mutual+fund project+
TRANSCRIPT

8/8/2019 Mutual+Fund Project+
http://slidepdf.com/reader/full/mutualfund-project 1/79
A Summer Project Report
On
“SECTORAL PERFORMANCE EVALUATION OF MUTUAL FUNDS”
Submitted in partial fulfillment of the requirement for theMaster of Business Administration course in
Visvesvaraya Technological University
SRI BHAGAWAN MAHAVEER JAIN COLLEGE OF ENGINEERING DEPARTMENT OF MANAGEMENT STUDIES
Jakkasandra post, Kanakapura Taluk, Bangalore-562 112APRIL -2008

8/8/2019 Mutual+Fund Project+
http://slidepdf.com/reader/full/mutualfund-project 2/79
TABLE OF CONTENTS
Chapter Title Page No.
Executive Summary
1 General Introduction
1.1 Industry profile
1.2 Theoretical concept of study
2 Research Methodology
2.1 Statement of the problem
2.2 Objective of the study
2.3 Scope of the study
2.4 Research methodology
2.5 Limitations of the study
2.6 Research Parameters
3 Data Analysis & Interpretation of results
4Summary of Findings & Conclusion
4.1 Summary of Findings
4.2 Conclusion
5 Suggestions
Bibliography
Annexure

8/8/2019 Mutual+Fund Project+
http://slidepdf.com/reader/full/mutualfund-project 3/79
LIST OF TABLES
Table No. Title Page No.
1
Table Showing the Absolute Returns of the
FMCG Funds
2Table showing the General Characteristics of the
FMCG Funds
3Table Showing the Vital Statistics of the FMCG
Funds
4Table Showing the Absolute Returns of
Pharmaceutical Funds
5Table showing the General Characteristics of the
Pharmaceutical Funds
6Table Showing the Vital Statistics of
Pharmaceutical Funds
7Table Showing the Absolute Returns of
Technology Funds
8 Table showing the General Characteristics of Technology Funds
9Table Showing the Vital Statistics of Technology
funds
10Table Showing the Absolute Returns of ELSS
Schemes
11 Table showing the General Characteristics of ELSS Schemes
12Table Showing the Vital Statistics of ELSS
Schemes
13Table showing the various sectoral schemes and
its Benchmark Index
14Table showing the ranking of FMCG Funds based
on Sharpe & Treynor measure

8/8/2019 Mutual+Fund Project+
http://slidepdf.com/reader/full/mutualfund-project 4/79
15Table showing the ranking of PharmaceuticalFunds based on Sharpe & Treynor measure
16Table showing the ranking of Technology Funds
based on Sharpe & Treynor measure
17Table showing the ranking of Technology Funds
based on Sharpe & Treynor measure
LIST OF GRAPHS

8/8/2019 Mutual+Fund Project+
http://slidepdf.com/reader/full/mutualfund-project 5/79
Graph No. Title Page No.
1 Chart Showing the Absolute Returns of FMCGFunds
2 Chart showing the AUM, Expense Ratio, P\ERatio & Turnover Ratio of FMCG Funds
3 Chart showing the S.D of FMCG Funds
4 Chart showing the Beta, Alpha & R ² of FMCGFunds
5 Chart showing the Sharpe & Treynor Measureof FMCG Funds
6 Chart showing the Absolute Returns of PharmaFunds
7 Chart showing the AUM, Expense Ratio, P\ERatio & Turnover Ratio of Pharma Funds
8 Chart showing the S.D of Pharma Funds
9 Chart showing the Beta, Alpha & R ² of Pharma Funds
10 Chart showing the Sharpe & Treynor Measureof Pharma Funds
11 Chart showing the Absolute Returns of TechnologyFunds
12 Chart showing the AUM, Expense Ratio, P\ERatio & Turnover Ratio of Technolo Funds
13 Chart showing the S.D of Technology Funds
14 Chart showing the Beta, Alpha & R ² of Technology Funds
15 Chart showing the Sharpe & Treynor Measureof Technolo Funds
16 Chart showing the Absolute Returns of ELSS Schemes

8/8/2019 Mutual+Fund Project+
http://slidepdf.com/reader/full/mutualfund-project 6/79
Graph
No.Title Page No.
17 Chart showing the AUM of ELSS Schemes
18 Chart showing the Expense Ratio, P\E Ratio& Turnover Ratio of ELSS Schemes
19 Chart showing the S.D of ELSS Schemes
20 Chart showing the Beta, Alpha & R² of ELSS Schemes
21 Chart showing the Sharpe & Treynor
Measure of ELSS Schemes

8/8/2019 Mutual+Fund Project+
http://slidepdf.com/reader/full/mutualfund-project 7/79
EXECUTIVE SUMMARY
Financial system in a country plays a dominant role in assets formation and
intermediation, and contributes substantially in macroeconomic development. In this process
of development mutual funds have emerged as strong financial intermediaries and are playing
a very important role in bringing stability to the financial system and efficiency to resource
allocation.
Mutual funds play a crucial role in an economy by mobilizing savings and investing
them in the capital market, thus establishing a link between savings and the capital market.
The activities of mutual funds have both short-and long-term impact on the savings and
capital markets, and the national economy.
The project is titled Sectoral performance evaluation of Mutual Funds. In this report
the comparison is carried out in order to evaluate the performance of different sectors such as
FMCG, Pharmaceuticals, Information Technology and Equity Linked Savings Schemes on
the basis of Absolute Annual returns, Standard Deviation, R 2, AUM, Alpha, Beta, Sharpe and
Treynor ratios. For this purpose of comparison top ten asset management companies funds
were taken into consideration. Comparison is done by taking the different benchmarks like
Sensex, S&P CNX Nifty, BSE 100, BSE 200, BSE FMCG, BSE TECk, BSE IT, S&P CNX
IT Software.
For the purpose of evaluation monthly NAV’s from January, 2005 to February, 2008
were taken into consideration along with along with respective benchmark indices.
The ranking of the funds is done based on Sharpe and Treynor ratios. The study
reveals that by and large it has been seen that sector specific have not found investors interestover a period of time as their AUM are very low when compared to ELSS and also other
diversified schemes. This is mainly due to the high risk involved by investing in a particular
sector. Investors tend to prefer diversified sectoral investment as the risks are reduced.

8/8/2019 Mutual+Fund Project+
http://slidepdf.com/reader/full/mutualfund-project 8/79
CHAPTER I
INTRODUCTION

8/8/2019 Mutual+Fund Project+
http://slidepdf.com/reader/full/mutualfund-project 9/79
1.1 INDUSTRY PROFILE
Mutual funds play a crucial role in an economy by mobilizing savings and investing
them in the capital market, thus establishing a link between savings and the capital market.The activities of mutual funds have both short-and long-term impact on the savings and
capital markets, and the national economy.
The Indian Mutual fund Industry has witnessed a structural transformation during the
past few years. The fund industry has grown phenomenally over the past couple of years,
and as on 29th February 2008, it had debt and equity assets of Rs.5,32,864 crore. Its equity
corpus of Rs.2,20,263 lakh crore accounts for over 3 percent of the total marketcapitalization of BSE, at Rs.58 lakh crore. Its holding in Indian companies ranges between 1
percent and almost 29 percent making them an influential shareholder.
In India most mutual funds have an expense ratio of 2.5 percent, a ceiling fixed by the
market regulator, SEBI .The management cost is 1.75 percent. On an average equity funds in
India charge expense ratios of over 2 percent per annum more than double the global average
of sub 1 percent. Bond funds charge around 0.6 percent, which is lower than global average
of 0.9 percent. Expense ratio comprises of management fees and operating expenses.
Mutual funds that invest more than half their corpus in shares of companies
accounting for the top 70 percent of the total market capitalization are categorized as large
cap funds. Funds predominantly investing in mid cap companies are those that account for
another 20 percent of the overall market cap. Mutual fund houses have restricted their
investment universe to barely 768 companies as on 31st January 2008.A chunk of mutual fund
money has gone into companies that are a part of two indices, Sensex and Nifty. The mutualfund investment in companies ranges between 1 percent and 29 percent of their paid up
capital.
In India only 3 percent of the household savings is invested in the mutual funds.
According to CRISIL 30 fund houses in India are together tapping only about 4 percent of the
incremental household savings market annually. The top 5 asset management companies in
India account for 52 percent of the Indian mutual funds market. And the Indian mutual fundindustry forms only 0.37 percent of the globally managed funds in the industry which are

8/8/2019 Mutual+Fund Project+
http://slidepdf.com/reader/full/mutualfund-project 10/79
pegged at $23 trillion (Rs.92 lakh crore).The main reason for this lopsided development is the
lack of geographical penetration: a substantial portion of the asset under management comes
from larger cities.
Mutual Funds over the years have gained immensely in their popularity. With the
introduction of innovative products, the world of mutual funds nowadays has a lot to offer to
its investors. Since Indian economy is no more a closed market, and has started integrating
with the world markets, external factors which are complex in nature affect us too. Factors
such as an increase in short-term US interest rates, the hike in crude prices, or any major
happening in Asian market have a deep impact on the Indian stock market. Mutual funds
provide an option of investing without getting lost in the complexities. India's mutual fund
industry, buoyed by a phenomenal rise in stock market indices and a spurt in foreign
institutional investments, has been rewarding investors handsomely. India's mutual funds
sector has never had it so good. Retail investors have been pouring billions of dollars into
funds, and have been reaping handsome rewards.
With emerging markets (including India, China and Brazil) being the flavor of the
season, international funds have been furiously earmarking a large portion of their allocationsto developing countries. Not surprising, considering the phenomenal returns that markets like
India have fetched them. With the Indian stock markets providing attractive returns, foreign
institutional investors (FIIs) have been making a beeline to the country. India's robust capital
market has resulted in a flowering of its mutual fund sector. Investors who had been
disenchanted with mutual funds have returned in a big way.
Mutual funds in India are also looking at increasing their exposure to the
infrastructure sector in the country. About $10 billion would be invested to build new roads,highways, ports, airports and other infrastructure in India over the next three years. Funds
like Tata Mutual Fund, DSP Merrill Lynch and Prudential ICICI have launched infrastructure
funds, and others are also expected to follow suit.

8/8/2019 Mutual+Fund Project+
http://slidepdf.com/reader/full/mutualfund-project 11/79
1.1.1 HISTORY OF MUTUAL FUND IN INDIA
The history of mutual funds in India can be broadly divided into 5 important phases.
First Phase: 1963-87 Initial Development phase (Unit Trust of India)
In 1963, UTI was established by an Act of Parliament and given a monopoly. The
impetus for establishing a formal institution came from the desire to increase the propensity
of the middle and lower groups to save and to invest. The first and still one of the largest
schemes, launched by UTI was Unit Scheme 1964. UTI created a number of products such as
monthly income plans, children’s plans, equity-oriented schemes and offshore funds during
this period. The total asset under management for the year 1987-88 was 6,700 crores.
Second Phase: 1987-93 (Entry of Public Sector Funds)
Second phase witnessed the entry of mutual funds sponsored by state owned banks
and financial institutions. With the opening up of the economy, many public sector and
financial institutions were allowed to establish mutual funds. In November 1987 the State
Bank of India established the first non-UTI mutual fund-SBI Mutual Fund. This was
followed by Canbank Mutual Fund (launched in December, 1987), LIC Mutual Fund (1989),and Indian Bank Mutual Fund (1990) followed by Bank of India Mutual Fund, GIC Mutual
Fund and PNB Mutual Fund. The fund industry expanded nearly seven times in terms of
Assets under Management. The total asset under management considering both UTI and
Public Sector was 47,004.
Third Phase: 1993-2003 (Entry of Private Sector Funds)
A new era started in the Indian mutual fund industry, giving the Indian investors a
wider choice of fund families. Also, 1993 was the year in which the first Mutual Fund
Regulations came into being, under which all mutual funds, except UTI were to be registered
and governed. The erstwhile Kothari Pioneer (now merged with Franklin Templeton) was the
first private sector mutual fund registered in July 1993. The 1993 SEBI (Mutual Fund)
Regulations were substituted by a more comprehensive and revised Mutual Fund Regulations
in 1996. The industry now functions under the SEBI (Mutual Fund) Regulations 1996. The
number of mutual fund houses went on increasing, with many foreign mutual funds setting up
funds in India and also the industry has witnessed several mergers and acquisitions. As at the

8/8/2019 Mutual+Fund Project+
http://slidepdf.com/reader/full/mutualfund-project 12/79
end of January 2003, there were 33 mutual funds with total assets of Rs. 1,21,805 crores. The
Unit Trust of India with Rs.44,541 crores of assets under management was way ahead of
other mutual funds.
Fourth Phase – since February 2003
In February 2003, following the repeal of the Unit Trust of India Act 1963 UTI was
bifurcated into two separate entities. Conforming to the SEBI Mutual Fund Regulations, and
with recent mergers taking place among different private sector funds, the mutual fund
industry has entered its current phase of consolidation and growth. As at the end of February
29, 2008, there were 40 funds, which manage assets of Rs.5,32,864 crores.
1.1.2 ROLE OF MUTUAL FUND IN FINANCIAL MARKET
Indian financial institutions have played a dominant role in assets formation and
intermediation, and contributed substantially in macroeconomic development. In this process
of development Indian mutual funds have emerged as strong financial intermediaries and are
playing a very important role in bringing stability to the financial system and efficiency to
resource allocation. Mutual funds play a crucial role in an economy by mobilizing savings and
investing them in the capital market, thus establishing a link between savings and the capital
market. The activities of mutual funds have both short-and long-term impact on the savings
and capital markets, and the national economy. Mutual funds, thus, assist the process of
financial deepening and intermediation. They mobilize funds in the savings market and act
as complementary to banking; at the same time they also compete with banks and other
financial institutions. In the process stock market activities are also significantly influenced
by mutual funds.
There is thus hardly any segment of the financial market, which is not (directly or indirectly) influenced by the existence and operation of mutual funds. However, the scope
and efficiency of mutual funds are influenced by overall economic fundamentals: the
interrelationship between the financial and real sector, the nature of development of the
savings and capital markets, market structure, institutional arrangements and overall policy
regime.

8/8/2019 Mutual+Fund Project+
http://slidepdf.com/reader/full/mutualfund-project 13/79
1.1.3 Composition of Indian Mutual Fund Industry:
Asset Under Management for all Mutual Fund houses, as on 31, March, 2008 is as follows
Amount in Rs. Crores
Sl.
No.Mutual Fund Name No. of Schemes
Asset Under
Management
1 Reliance Mutual Fund 335 77,210
2 ICICI Prudential Mutual Fund 419 64,045
3 UTI Mutual Fund 315 52,465
4 HDFC Mutual Fund 351 43,763
5 Birla SunLife Mutual Fund 330 36,391
6 Franklin Templeton Investments 225 29,604
7 SBI Mutual Fund 171 27,582
8 Tata Mutual Fund 389 19,423
9 Kotak Mahindra Mutual Fund 178 19,368
10 DSP Merrill Lynch Mutual Fund 207 19,136
11 HSBC Mutual Fund 213 15,530
12 Deutsche Mutual Fund 181 14,405
13 Standard Chartered Mutual Fund 255 13,763
14 LIC Mutual Fund 112 13,387
15 PRINCIPAL Mutual Fund 151 13,319
16 Sundaram Mutual Fund 203 13,285
17 JM Financial Mutual Fund 171 12,560
18 Lotus India Mutual Fund 212 10,057
19 ING Mutual Fund 255 9,845
20 Fidelity Mutual Fund 39 9,487
21 ABN AMRO Mutual Fund 325 6,814
22 Benchmark Mutual Fund 12 5,611
23 Morgan Stanley Mutual Fund 3 3,670
8/8/2019 Mutual+Fund Project+
http://slidepdf.com/reader/full/mutualfund-project 14/79
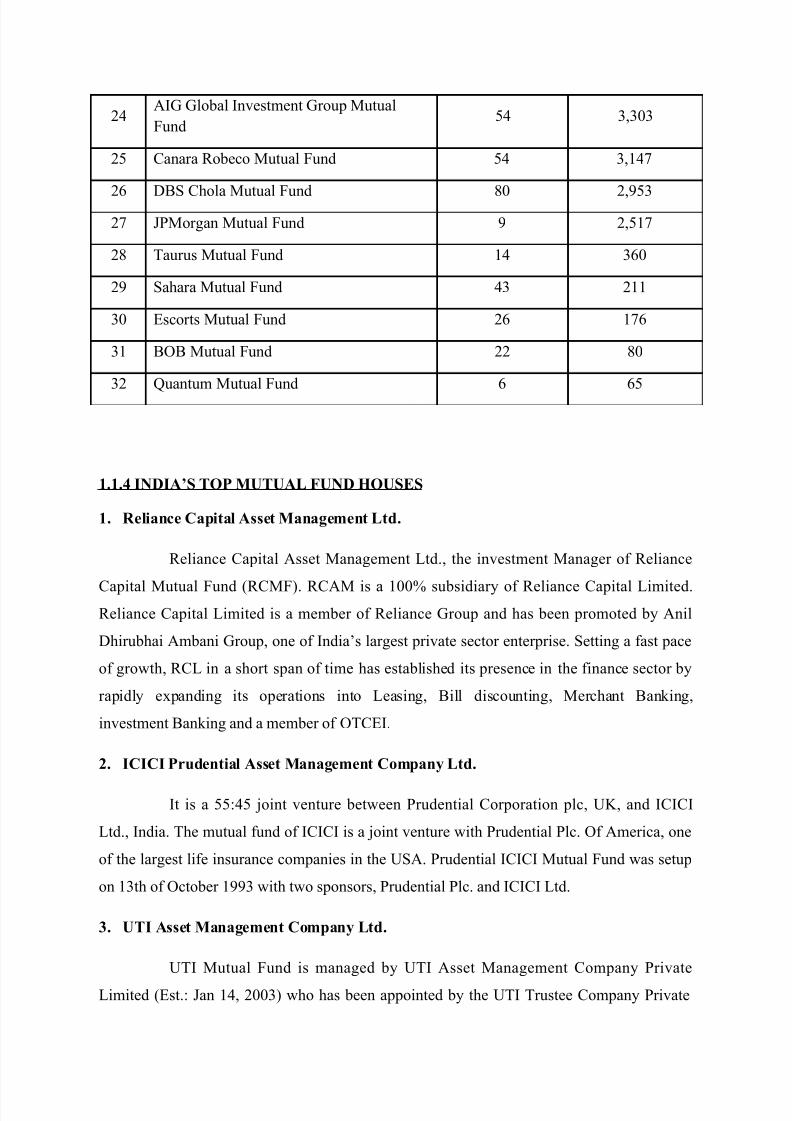
24AIG Global Investment Group MutualFund
54 3,303
25 Canara Robeco Mutual Fund 54 3,147
26 DBS Chola Mutual Fund 80 2,95327 JPMorgan Mutual Fund 9 2,517
28 Taurus Mutual Fund 14 360
29 Sahara Mutual Fund 43 211
30 Escorts Mutual Fund 26 176
31 BOB Mutual Fund 22 80
32 Quantum Mutual Fund 6 65
1.1.4 INDIA’S TOP MUTUAL FUND HOUSES
1. Reliance Capital Asset Management Ltd.
Reliance Capital Asset Management Ltd., the investment Manager of Reliance
Capital Mutual Fund (RCMF). RCAM is a 100% subsidiary of Reliance Capital Limited.Reliance Capital Limited is a member of Reliance Group and has been promoted by Anil
Dhirubhai Ambani Group, one of India’s largest private sector enterprise. Setting a fast pace
of growth, RCL in a short span of time has established its presence in the finance sector by
rapidly expanding its operations into Leasing, Bill discounting, Merchant Banking,
investment Banking and a member of OTCEI.
2. ICICI Prudential Asset Management Company Ltd.
It is a 55:45 joint venture between Prudential Corporation plc, UK, and ICICI
Ltd., India. The mutual fund of ICICI is a joint venture with Prudential Plc. Of America, one
of the largest life insurance companies in the USA. Prudential ICICI Mutual Fund was setup
on 13th of October 1993 with two sponsors, Prudential Plc. and ICICI Ltd.
3. UTI Asset Management Company Ltd.
UTI Mutual Fund is managed by UTI Asset Management Company Private
Limited (Est.: Jan 14, 2003) who has been appointed by the UTI Trustee Company Private

8/8/2019 Mutual+Fund Project+
http://slidepdf.com/reader/full/mutualfund-project 15/79
Limited for managing the schemes of UTI Mutual Fund and the schemes transferred /
migrated from UTI Mutual Fund.
4. HDFC Asset Management Company Limited
HDFC Mutual Fund was setup on June 30, 2000 with two sponsors namely
Housing Development Finance Corporation Limited and Standard Life Investments Limited,
one of the leading Insurance companies in the United Kingdom, having vast experience in
management of funds.
5. Birla Sun Life Mutual Fund
Birla Sun Life Mutual Fund is the joint venture of Aditya Birla Group and Sun
Life Financial. Sun Life Financial is a global organization evolved in 1871 and is being
represented in Canada, the US, the Philippines, Japan, Indonesia and Bermuda apart from
India. Birla Sun Life Mutual Fund follows a conservative long-term approach to investment.
6. Franklin Templeton Asset Management (India) Pvt. Ltd.
It is a part of the Franklin Templeton Group. The sponsor of the Fund Templeton
International Inc., is a wholly owned subsidiary of Templeton Worldwide Inc., which in turn
is a wholly owned subsidiary of Franklin Resources Inc. The Franklin Templeton Group isone of the world s largest Investment Management Companies. It has over 50 years of
experience in International Investment Management with 34 offices in over 23 countries,
which service over 10 million unit holders. Templeton started operations in Mumbai, India in
January 1996.
1.1.5 FUTURE SCENARIO
The asset base will continue to grow at an annual rate of about 30 to 35 % over thenext few years as investor’s shift their assets from banks and other traditional avenues. Some

8/8/2019 Mutual+Fund Project+
http://slidepdf.com/reader/full/mutualfund-project 16/79
of the older public and private sector players will either close shop or be taken over. Out of
ten public sector players five will sell out, close down or merge with stronger players in three
to four years. In the private sector this trend has already started with two mergers and one
takeover. Here too some of them will down their shutters in the near future to come. But this
does not mean there is no room for other players. The market will witness a flurry of new
players entering the arena. There will be a large number of offers from various asset
management companies in the time to come. Some big names like Fidelity, Principal, Old
Mutual etc. are looking at Indian market seriously. One important reason for it is that most
major players already have presence here and hence these big names would hardly like to get
left behind. The mutual fund industry is awaiting the introduction of derivatives in India as
this would enable it to hedge its risk and this in turn would be reflected in its Net Asset Value
(NAV). SEBI is working out the norms for enabling the existing mutual fund schemes to
trade in derivatives. Importantly, many market players have called on the Regulator to initiate
the process immediately, so that the mutual funds can implement the changes that are
required to trade in Derivatives. May the Net Asset Values grow!!
1.2 THEORITICAL CONCEPT
MUTUAL FUND BASICS

8/8/2019 Mutual+Fund Project+
http://slidepdf.com/reader/full/mutualfund-project 17/79
As you probably know, mutual funds have become pretty popular over the last few
years. What was once just another obscure financial instrument is now a part of our lives and
here to stay. According to sources, more than 80 million people, or one half of the households
in America, invest in mutual funds. That means that, in the United States alone, trillions of
dollars are invested in mutual funds.
Its common knowledge that investing in mutual funds is (or at least should be) better
than simply letting your cash waste away in a savings account, but, for most people, that's
where the understanding of funds ends.
Originally mutual funds were meant to allow the common man to get a piece of the
market considering that the common man would be less knowledgeable about financialmarkets and would have smaller investments to transact with. Instead of spending all your
free time buried in the financial pages of the Economic Times, all you have to do is buy a
mutual fund and you'd be set on your way to financial freedom. As you might have guessed,
it's not that easy. Not all mutual funds are the same, and investing in mutual funds isn't as
easy as throwing your money at the first salesperson who attracts your attention.
Mutual Fund- Meaning
A Mutual Fund is a trust that pools the savings of a number of investors who share a
common financial goal. It is essentially a diversified portfolio of financial instruments - these
could be equities, debentures / bonds or money market instruments. The corpus of the fund is
then deployed in investment alternatives that help to meet predefined investment objectives.
Investors of mutual funds are known as unit holders. The income earned through these
investments and the capital appreciation realised are shared by its unit holders in proportion
to the number of units owned by them. Thus a Mutual Fund is a suitable investment for the
common man as it offers an opportunity to invest in a diversified, professionally managed
basket of securities at a relatively low cost.
The investors, in proportion to their investments, share the profits or losses. The
mutual funds normally come out with a number of schemes with different investment
objectives, which are launched from time to time. A mutual fund is required to be registered
with Securities and Exchange Board of India (SEBI), which regulates securities markets
before it can collect funds from the public.

8/8/2019 Mutual+Fund Project+
http://slidepdf.com/reader/full/mutualfund-project 18/79
An investor could make money from a mutual fund in three ways:
Income is earned from dividends declared by mutual fund schemes from time to time.
If the fund sells securities that have increased in price, the fund has a capital gain.
This is reflected in the price of each unit. When investors sell these units at prices
higher than their purchase price, they stand to make a gain.
If fund holdings increase in price but are not sold by the fund manager, the fund's unit
price increases. You can then sell your mutual fund units for a profit. This is
tantamount to a valuation gain.
DEFINITIONS:
The SEBI, 1993 defines a Mutual Fund as .a fund established in the form of a trust by
a sponsor, to raise monies by the trustees through the sale of units to the public, under one or
more schemes, for investing in securities in accordance with these regulations.

8/8/2019 Mutual+Fund Project+
http://slidepdf.com/reader/full/mutualfund-project 19/79
1.2.1 OPERATION OF THE FUND
A mutual fund invites the prospective investors to join the fund by offering various
schemes so as to suit to the requirements of categories of investors. The resources of
individual investors are pooled together and the investors are issued units/shares for the
money invested. The amount so collected is invested in capital market instruments like
treasury bills, commercial papers, etc.
For managing the fund, a mutual fund gets an annual fee of 1.25% of funds managed
at the maximum as fixed by SEBI (MF) regulations, 1993 and if the funds exceed Rs. 100
cores, the fee is only 1%. The fee cannot exceed 1%. Of course, regular expenses like
custodial fee, cost of dividend warrants, fee for registration, the asset management fee etc are
debited to the respective schemes. These expenses cannot exceed 3% of the assets in the
respective schemes. These expenses cannot exceed 3% of the assets in the respective schemes
each year. The remaining amount is given back to the investors in full.
The flow chart below describes broadly the working of a mutual fund:
Fig: Mutual Fund Operation Flow Chart

8/8/2019 Mutual+Fund Project+
http://slidepdf.com/reader/full/mutualfund-project 20/79
1.2.2 ORGANIZATION OF A MUTUAL FUND
There are many entities involved and the diagram below illustrates the organizational
set up of a mutual fund:
Organisation of a Mutual Fund
MUTUAL FUND SET UP
A mutual fund is set up in the form of a trust, which has sponsor, trustees, asset
Management Company (AMC) and custodian. The trust is established by a sponsor or more
than one sponsor who is like promoter of a company. The trustees of the mutual fund hold its
property for the benefit of the unit holders. Asset Management Company approved by SEBI
manages the funds by making investments in various types of securities. Custodian, who is
registered with SEBI, holds the securities of various schemes of the fund in its custody. The
trustees are vested with the general power of superintendence and direction over AMC. Theymonitor the performance and compliance of SEBI Regulations by the mutual fund.
SEBI Regulations require that at least two thirds of the directors of trustee
company or board of trustees must be independent i.e. they should not be associated with the
sponsors. Also, 50% of the directors of AMC must be independent. All mutual funds are
required to be registered with SEBI before they launch any scheme. However, Unit Trust of
India (UTI) is not registered with SEBI (as on January 15, 2002).

8/8/2019 Mutual+Fund Project+
http://slidepdf.com/reader/full/mutualfund-project 21/79
The formation and operations of Mutual Funds in India is solely guided by SEBI (Mutual
Funds) Regulations, 1993, which came into force on 20th January, 1996, through a
notification on 9th December, 1996. these Regulations make it mandatory for Mutual Funds
to have a three-tier structure of :
1. A Sponsor Institution to promote the Fund.
2. A team of Trustees to oversee the operations and to provide checks for the efficient,
profitable and transparent operations of the fund and
3. An Asset Management Company (AMC) to actually deal with the funds.
Sponsoring Institution:
The Company, which sets up the mutual fund, is called the Sponsor. SEBI has laid
down certain criteria to be met by the sponsor. The criterion mainly deals with adequate
experience, good past track record, net worth etc.
• Sponsor appoints the Trustees, Custodian and the AMC with the prior approval of
SEBI, and in accordance with SEBI Regulations.
• Sponsor must have at least 5-year track record of business interest in the Financial
Markets.
Trustees:
Trustees are the people with long experience and good integrity in the respective
fields carry the crucial responsibility in safeguarding the interests of the investors. For this
purpose, they monitor the operations of the different schemes. They have wide ranging
powers and they can even dismiss AMC with the approval of SEBI. The Indian Trust Act
governs them.
Asset Management Company:
The AMC actually manages the funds of the various schemes. The AMC employs a
large number of professionals to make investments, carry out research &to do agent and
investor servicing. In fact, the success of any Mutual Fund depends upon the efficiency of
this AMC. The AMC submits a quarterly report on the functioning of the mutual fund to the
trustees who will guide and control the AMC.

8/8/2019 Mutual+Fund Project+
http://slidepdf.com/reader/full/mutualfund-project 22/79
The AMC is usually a private limited company, in which the sponsors and their
associations or joint venture partners are shareholders. The AMC has to be registered by
SEBI and should have a minimum Net worth of Rs.10 cores all times. The role of the AMC is
to act as the Investment Manager of the Trust along with the following functions:
• It manages the funds by making investments in accordance with the provision of the
Trust Deed and Regulations
• The AMC shall disclose the basis of calculation of NAV and Repurchase price of the
schemes and disclose the same to the investors.
• Funds shall be invested as per Trust Deed and Regulations.
Registrars and Transfer Agents:
The Registrars and Transfer Agents are responsible for the investor servicing
functions, as they maintain the records of investors in the mutual funds. They process
investor applications , record details provided by the investors on application forms, send out
periodical information on the performance of the mutual fund; process dividend pay-out to
the investors; incorporate changes in information as communicated by investors; and keep
the investor record up to date, by recording new investors and removing investors who have
withdrawn their funds.
Custodian:
Custodians are responsible for the securities held in the mutual funds portfolio. They
discharge an important back-office function, by ensuring that securities that are bought are
delivered and transferred to the books of mutual funds, and that funds are paid-out when
mutual fund buys securities. They keep the investment account of the mutual fund, and also
collect the dividends and interest payments due on the mutual fund investments. Custodians
also track corporate actions like bonus, issues, right offers, offer for sale, buy back and open
offers for acquisition.

8/8/2019 Mutual+Fund Project+
http://slidepdf.com/reader/full/mutualfund-project 23/79
1.2.3 BENEFITS OF INVESTING IN A MUTUAL FUND
The benefits of investing in mutual funds are as follows -
Access to professional money managers - Experienced fund managers using advanced
quantitative and mathematical techniques manage your money.
Diversification - Mutual funds aim to reduce the volatility of returns through
diversification by investing in a number of companies across a broad section of industries
and sectors. It prevents an investor from putting "all eggs in one basket". This inherently
minimizes risk. Thus with a small investible surplus an investor can achieve
diversification which would have otherwise not been possible.
Liquidity - Open-ended mutual funds are priced daily and are always willing to buy back
units from investors. This mean that investors can sell their holdings in mutual fund
investments anytime without worrying about finding a buyer at the right price. In the case
of other investment avenues such as stocks and bonds, buyers are not necessarilyavailable and therefore these investment avenues are less liquid compared to open-ended
schemes of mutual funds.
Tax Efficiency - Mutual fund offers a variety of tax benefits. Please visit the tax corner
section or consult your tax advisor for details.
Low transaction costs - Since mutual funds are a pool of money of many investors, the
amount of investment made in securities is large. This therefore results in paying lower
brokerage due to economies of scale.

8/8/2019 Mutual+Fund Project+
http://slidepdf.com/reader/full/mutualfund-project 24/79
Transparency - Prices of open ended mutual funds are declared daily. Regular updates
on the value of your investment are available. The portfolio is also disclosed regularly
with the fund manager's investment strategy and outlook.
Well-regulated industry - All the mutual funds are registered with SEBI and they
function under strict regulations designed to protect the interests of investors.
Convenience of small investments - Under normal circumstances, an individual investor
would not be able to diversify his investments (and thus minimize risk) across a wide
array of securities due to the small size of his investments and inherently higher
transaction costs. A mutual fund on the other hand allows even individual investors to
hold a diversified array of securities due to the fact that it invests in a portfolio of stocks.
A mutual fund therefore permits risk diversification without an investor having to invest
large amounts of money.
Tax benefits on Investment in Mutual Funds -
1) 100% Income Tax exemption on all Mutual Fund dividends.
2) Capital Gains Tax to be lower of -
10% on the capital gains without factoring indexation benefit and
20% on the capital gains after factoring indexation benefit.
3) Open-end funds with equity exposure of more than 65% (Revised from 50% to 65%
in Budget 2006) are exempt from the payment of dividend tax for a period of 3 yearsfrom 1999-2000.
1.2.4 DISADVANTAGES OF INVESTING MUTUAL FUNDS
Professional Management - Some funds doesn’t perform in neither the market, as their
management is not dynamic enough to explore the available opportunity in the market,
thus many investors debate over whether or not the so-called professionals are any better than mutual fund or investor himself, for picking up stocks.

8/8/2019 Mutual+Fund Project+
http://slidepdf.com/reader/full/mutualfund-project 25/79
Costs – The biggest source of AMC income, is generally from the entry & exit load
which they charge from an investors, at the time of purchase. The mutual fund industries
are thus charging extra cost under layers of jargon.
Dilution - Because funds have small holdings across different companies, high returns
from a few investments often don't make much difference on the overall return. Dilution
is also the result of a successful fund getting too big. When money pours into funds that
have had strong success, the manager often has trouble finding a good investment for all
the new money.
Taxes - when making decisions about your money, fund managers don't consider your
personal tax situation. For example, when a fund manager sells a security, a capital-gain
tax is triggered, which affects how profitable the individual is from the sale. It might have
been more advantageous for the individual to defer the capital gains liability.
1.2.5 Risks of investment in Mutual Funds:
Mutual funds are not free from risks as the funds so collected are invested in stock
markets, which are volatile in nature and are not risk free. The following risks are generally
involved in mutual funds
1. Market risks: In general, there are many kinds of risks associated with every kind of investment on shares. They are called market risks. These market risks can be reduced,
but not completely eliminated even by a good investment management. The prices of
shares are subject to wide price fluctuations depending upon market conditions over
which nobody has control. The various phases of business cycle such as Boom,
Recession, Slump and Recovery affects the market conditions to a larger extent.
2. Scheme risks: There are certain risks inherent in the scheme itself. For instance, in a pure
growth scheme, risks are greater. It is obvious because if one expects more returns as in
the case of a growth scheme, one has to take more risks.
3. Investment risk: Whether the mutual fund makes money in shares or loses depends upon
the investment expertise of the Asset Management Company (AMC). If the investment

8/8/2019 Mutual+Fund Project+
http://slidepdf.com/reader/full/mutualfund-project 26/79
advice goes wrong, the fund has to suffer a lot. The investment expertises of various
funds are different and it is reflected on the returns, which they offer to the investors.
4. Business Risk: The corpus of a mutual fund might have been invested in a companies
shares. If the business of that company suffers any set back, it cannot declare any
dividend. It may even go to the extent of winding up its business. Though the mutual
funds can withstand such a risk, its income paying capacity is affected.
5. Political risks: Every government brings new economic ideologies and policies. It is
often said that many economic decisions are politically motivated. Change of government brings in the risk of uncertainty, which every player in the finance service industry has to
face.
1.2.6 DIFFERENT TYPES OF MUTUAL FUNDS
TYPES OF MUTUAL FUND SCHEMES
Wide variety of Mutual Fund Schemes exists to cater to the needs such as financial position,
risk tolerance and return expectations etc. The table below gives an overview into the existing
types of schemes in the Industry.
BYSTRUCTURE
• Open - Ended Schemes• Close - Ended Schemes• Interval Schemes
BY INVESTMENT OBJECTIVE
• Growth Schemes• Income Schemes• Balanced Schemes• Money Market Schemes
OTHER SCHEMES

8/8/2019 Mutual+Fund Project+
http://slidepdf.com/reader/full/mutualfund-project 27/79
• Tax Saving Schemes• Special Schemes• Index Schemes• Sector Specific Schemes
Mutual fund schemes may be classified on the basis of their structure and their investmentobjective.
By Structure
Open-ended Funds
An Open-ended Fund is one that is available for subscription all through the year. These
do not have a fixed maturity. Investors can conveniently buy and sell units at Net AssetValue (NAV) related prices.
Close-ended Funds
A Close-ended Fund has a stipulated maturity period, which generally ranges from 3 to
15 years. The fund is open for subscription only during a specified period. Investors can
invest in the scheme at the time of the initial public issue and thereafter they can buy or
sell the units of the scheme on the Stock Exchanges, if they are listed. The market price at
the stock exchange could vary from the scheme's NAV on account of demand and supply
situation, unit holders' expectations and other market factors.
By Investment Objective
Growth/Equity Oriented Funds
The aim of growth funds is to provide capital appreciation over the medium to longterm. Such schemes normally invest a majority of their corpus in equities. Growth
schemes are ideal for investors who have a long-term outlook and are seeking growth
over a period of time.
Income/Debt Oriented Funds

8/8/2019 Mutual+Fund Project+
http://slidepdf.com/reader/full/mutualfund-project 28/79
The aim of Income Funds is to provide regular and steady income to investors. Such
schemes generally invest in fixed income securities such as bonds, corporate debentures
and Government securities.
Income Funds are ideal for capital stability and regular income. Capital appreciation in
such funds may be limited, though risks are typically lower than that in a growth fund.
Balanced Funds
The aim of Balanced Funds is to provide both growth and regular income. Such
schemes periodically distribute a part of their earning and invest both in equities and fixed
income securities in the proportion indicated in their offer documents. This proportion
affects the risks and the returns associated with the balanced fund - in case equities are
allocated a higher proportion, investors would be exposed to risks similar to that of the
equity market.
Balanced funds with equal allocation to equities and fixed income securities are ideal
for investors looking for a combination of income and moderate growth.
Money Market Funds
The aim of Money Market Funds is to provide easy liquidity, preservation of capital
and moderate income. These schemes generally invest in safer short-term instruments
such as Treasury Bills, Certificates of Deposit, Commercial Paper and Inter-Bank Call
Money. Returns on these schemes may fluctuate depending upon the interest rates
prevailing in the market.
Load Funds
A Load Fund is one that charges a commission for entry or exit. That is, each time
you buy or sell units in the fund, a commission will be payable. Typically entry and exit
loads range from 1% to 2%. It could be worth paying the load, if the fund has a good
performance history.
No-Load Funds

8/8/2019 Mutual+Fund Project+
http://slidepdf.com/reader/full/mutualfund-project 29/79
8/8/2019 Mutual+Fund Project+
http://slidepdf.com/reader/full/mutualfund-project 30/79
Sectoral Schemes
Sectoral Funds are those which invest exclusively in specified sector(s) such asFMCG, Information Technology, Pharmaceuticals, etc. These schemes carry higher risk
as compared to general equity schemes as the portfolio is less diversified, i.e. restricted to
specific sector(s) / industry (ies).
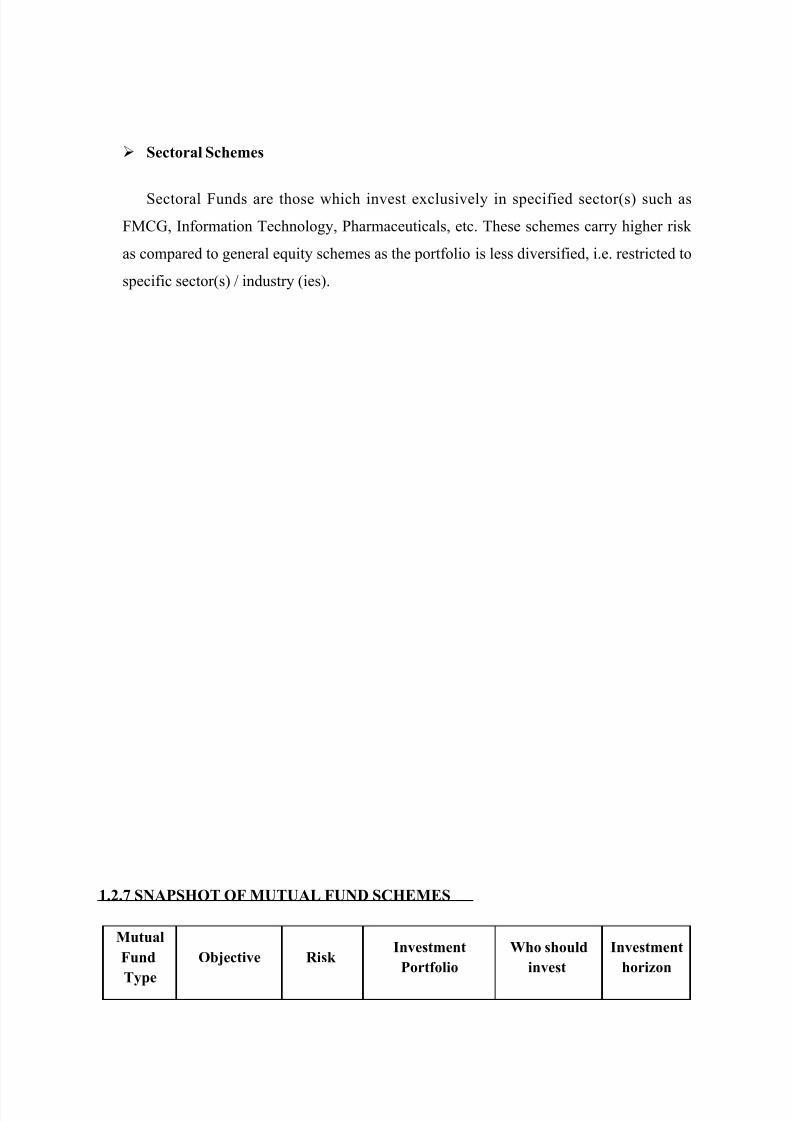
1.2.7 SNAPSHOT OF MUTUAL FUND SCHEMES
Mutual
Fund
Type
Objective Risk Investment
Portfolio
Who should
invest
Investment
horizon

8/8/2019 Mutual+Fund Project+
http://slidepdf.com/reader/full/mutualfund-project 31/79
Money
Market
Liquidity +ModerateIncome +
Reservation of Capital
Negligible
Treasury Bills,Certificate of
Deposits,Commercial Papers,
Call Money
Those who park their funds in
current accountsor short-term
bank deposits
2 days - 3weeks
Short-
term
Funds
(Floating -
short-
term)
Liquidity +ModerateIncome
LittleInterest Rate
Call Money,Commercial Papers,Treasury Bills, CDs,
Short-termGovernmentsecurities.
Those withsurplus
short-term funds
3 weeks -3 months
Bond
Funds
(Floating -
Long-
term)
Regular IncomeCredit Risk & InterestRate Risk
Predominantly
Debentures,Government
securities, CorporateBonds
Salaried &conservative
investors
More than 9 -12 months
Gilt FundsSecurity &
IncomeInterest Rate
Risk Government
securities
Salaried &conservative
investors
12 months &more
Equity
Funds
Long-termCapital
AppreciationHigh Risk Stocks
Aggressiveinvestors with
long term outlook.
3 years plus
Index
Funds
To generatereturns that arecommensuratewith returns of
respectiveindices
NAV varieswith index
performance
Portfolio indices likeBSE, NIFTY etc
Aggressiveinvestors.
3 years plus
BalancedFunds
Growth &Regular Income
Capital
Market Risk and InterestRate Risk
Balanced ratio of equity and debtfunds to ensurehigher returns at
lower risk
Moderate &Aggressive
2 years plus
Selecting the right Scheme
Investment
ObjectiveInvestment horizon Ideal Instruments

8/8/2019 Mutual+Fund Project+
http://slidepdf.com/reader/full/mutualfund-project 32/79
Short-termInvestment
1- 6 months Liquid/Short-term plans
CapitalAppreciation
Over 3 yearsDiversified Equity/ Balanced
Funds
Regular Income FlexibleMonthly Income Plans / Income
Funds
Tax Saving 3 yrs lock-inEquity-Linked Saving Schemes
(ELSS)
1.2.8 DIFFERENT PLANS THAT MUTUAL FUNDS OFFER
To cater to different investment needs, Mutual Funds offer various investmentoptions. Some of the important investment options include:
Growth Option: Dividend is not paid-out under a Growth Option and the investor
realizes only the capital appreciation on the investment (by an increase in NAV).
Dividend Payout Option: Dividends are paid-out to investors under the Dividend Payout
Option. However, the NAV of the mutual fund scheme falls to the extent of the dividend
payout.
Dividend Re-investment Option: Here the dividend accrued on mutual funds is
automatically re-invested in purchasing additional units in open-ended funds. In most
cases mutual funds offer the investor an option of collecting dividends or re-investing the
same.
Retirement Pension Option: Some schemes are linked with retirement pension.
Individuals participate in these options for themselves, and corporate’s participate for
their employees.
Insurance Option: Certain Mutual Funds offer schemes that provide insurance cover to
investors as an added benefit.
Systematic Investment Plan (SIP): Here the investor is given the option of preparing a
pre-determined number of post-dated cheques in favour of the fund. The investor is
allotted units on a predetermined date specified in the offer document at the applicable
NAV.
Systematic Encashment Plan (SEP): As opposed to the Systematic Investment Plan, the
Systematic Encashment Plan allows the investor the facility to withdraw a pre-determined

8/8/2019 Mutual+Fund Project+
http://slidepdf.com/reader/full/mutualfund-project 33/79
amount / units from his fund at a pre-determined interval. The investor's units will be
redeemed at the applicable NAV as on that day.
1.2.9 ROLE OF MUTUAL FUND IN FINANCIAL MARKET
Indian financial institutions have played a dominant role in assets formation and
intermediation, and contributed substantially in macroeconomic development. In this process
of development Indian mutual funds have emerged as strong financial intermediaries and are
playing a very important role in bringing stability to the financial system and efficiency to
resource allocation. Mutual funds play a crucial role in an economy by mobilizing savings and
investing them in the capital market, thus establishing a link between savings and the capital
market. The activities of mutual funds have both short-and long-term impact on the savings
and capital markets, and the national economy. Mutual funds, thus, assist the process of
financial deepening and intermediation. They mobilize funds in the savings market and act
as complementary to banking; at the same time they also compete with banks and other
financial institutions. In the process stock market activities are also significantly influenced
by mutual funds.
There is thus hardly any segment of the financial market, which is not (directly or
indirectly) influenced by the existence and operation of mutual funds. However, the scope
and efficiency of mutual funds are influenced by overall economic fundamentals: the
interrelationship between the financial and real sector, the nature of development of the
savings and capital markets, market structure, institutional arrangements and overall policy
regime.

8/8/2019 Mutual+Fund Project+
http://slidepdf.com/reader/full/mutualfund-project 34/79
CHAPTER II
RESEARCH
METHODOLOGY
RESEARCH METHODOLOGY

8/8/2019 Mutual+Fund Project+
http://slidepdf.com/reader/full/mutualfund-project 35/79
2.1 Statement of problem
In India not much work has been done in order to analyze the risk and returns of
mutual funds. The analysis which is available is right from the time of inception of the funds
and may not be relevant if the period is very long. Therefore an analysis of the funds for the
past three years would be very relevant from the view point of making an investment as the
market conditions keeps on changing.
Also there are very few sector specific schemes available for investment and most of
them are diversified schemes. Therefore an analysis of three sectors along with Equity linked
savings schemes would help us understand this trend. Also this would help an investor to
make an investment decision in sector specific schemes.
Therefore this research is based on:
“SECTORAL PERFORMANCE EVALUATION OF MUTUAL FUNDS”
2.2 Objectives
The following are the objectives of the study conducted:
To understand the concept of Mutual Funds.
To evaluate the performance of sector specific mutual funds like FMCG (Fast Moving
Consumer Goods), Pharmaceutical, Technology and ELSS (Equity Linked Savings
Scheme) in terms of risk and returns.
To study the absolute annual returns of the various sectoral mutual funds.
To analyze the fund risk factor as against the various benchmarks like Sensex, S&P
CNX Nifty, BSE 100, BSE 200, BSE FMCG, BSE TECk, BSE IT, S&P CNX IT
Software.
To examine the funds sensitivity to the market fluctuations in terms of beta, standard
deviation and R-squared.
To appraise and rank the performance of mutual funds according to the Sharpe and
Treynor measure.
2.3 Scope

8/8/2019 Mutual+Fund Project+
http://slidepdf.com/reader/full/mutualfund-project 36/79

8/8/2019 Mutual+Fund Project+
http://slidepdf.com/reader/full/mutualfund-project 37/79
The monthly benchmark indices are collected from moneycontrol and BSE (Bombay
Stock Exchange) and NSE (National Stock Exchange) website.
91 days T-Bill risk free rate of return from Reserve bank of India.
There was a use of primary data in case of investment patterns of investors and
discussions held with portfolio managers.
2.6 Limitations
The study is mainly limited to equity sector funds and ELSS schemes for a period of
three years starting from January-2005 to Fecbruary-2008
The funds under study are growth schemes.
The risk free return is temporary and may change over a period of time.
There were limitations because the funds available for comparison in this project were
very few. Limited numbers of companies were available having sector specific
schemes.
The study is confined to only to top ten asset management companies.
The ranks are assigned on the basis of only two measures & data is considered for
three years only.
2.7 Research Parameters
The data was collected based on the following important qualitative and quantitative
factors related to mutual funds. They are:
1. Quantitative Measures
Assets under management (AUM)
Annual Returns
Expense Ratio
PE multiple/ratio Turnover Ratio

8/8/2019 Mutual+Fund Project+
http://slidepdf.com/reader/full/mutualfund-project 38/79
2. Risk Measures
Standard Deviation
Beta
Alpha R-Squared
Sharpe Ratio
Treynor Ratio
3. Qualitative Measures
Benchmark
1. Quantitative Measures
a) Assets under Management (AUM)
This denotes the size of the fund or the scheme. Larger funds have higher AUM and vice
versa.
b) Annual Return
A return is a measurement of how much an investment has increased or decreased in
value over any given time period. In particular, an annual return is the percentage by which it
increased or decreased over any twelve-month period.
Return = ((End_price + Start_price) / Start_price)*100
Eg:
c) Expense Ratio
Mutual funds too charge a fee for managing your money. This involves the fund
management fee, agent commissions, registrar fees, and selling and promoting expenses. All
this falls under a single basket called expense ratio or annual recurring expenses that isdisclosed every March and September and is expressed as a percentage of the fund's average
Date NAV Returns
January, 2005 18.12 - January, 2006 30.07 65.95 %
January, 2007 34.91 16.10 % January, 2008 42.95 23.03 %

8/8/2019 Mutual+Fund Project+
http://slidepdf.com/reader/full/mutualfund-project 39/79
weekly net assets. Expense ratio states how much you pay a fund in percentage term every
year to manage your money.
d) Price Earnings Ratio
A company’s PE is the ratio of the share price of a company to its earnings per share
(EPS). If EPS is one, the PE ratio will reflect the price that an investor will pay for this one
rupee of the company's profits.
An equity fund is a collection of shares. Therefore, a fund's PE is the average of the
PEs of all stocks, in proportion to their presence in the portfolio. Because fund portfolios
change, the PE will also change and this will not reflect the growth prospects of the
underlying assets. A fund's PE is the weighted average PE of its stocks.
A fund's PE ratio can tell us whether the fund has more growth stocks or value stocks
compared to another fund.
e) Turnover Ratio
The turnover ratio represents the percentage of a fund's holdings that change every year.
To put it simply, a turnover rate of 100 per cent implies that the fund manager has replaced
his entire portfolio during the period given.
2. Risk Measures
a) Standard Deviation
The Standard Deviation of an average is the amount by which the numbers that go
into an average deviate from that average. It tells us how closely an average represents the
underlying numbers.
Risk! A recipe for figuring out the risk level of a fund takes shape:
Calculate a fund's monthly performance over a long period of time.
Calculate the average for all these monthly performances.
If the individual monthly performances are very different from the average, then that
fund is risky, delivering high returns in some months and poor returns in others. If

8/8/2019 Mutual+Fund Project+
http://slidepdf.com/reader/full/mutualfund-project 40/79
they are mostly similar, then the fund is a low risk one, with about the same returns
month after month.
We just calculate exactly how much each month's performance is different from the
average and then calculate the average of these differences. This is Standard Deviation.
b) Beta
Betas are widely used to measure the volatility of a stock fund's price relative to the
general market. The beta relates the volatility of a single security to the volatility of the
market as a whole.
An issue with a beta of 1.5 for example, tends to move 50% more than the total market, in
the same direction. An issue with a beta of 0.5 tends to move 50% less. If a stock or stock
fund moved exactly as the market moved, it would have a beta of 1.0. Thus, high beta is
typical of a volatile stock. Low beta is typical of a stock that moves less than the market as a
whole. A stock with a negative beta moves in the direction opposite to that of the market.
With a beta of -1.0 a stock has the same volatility as the market, but tends to rise when themarket falls, and vice versa.
Example: Calculation of Beta
BENCHMARK (X) NAV
(Y)
XReturns of Benchmark
(%)
YReturnsof Fund
(%)X
2
Y2
X*Y
1059 18.2
1122 18.7 5.95 2.75 35.39 7.55 16.34
1065 19.3 -5.08 3.21 25.81 10.29 -16.30
1053 19.6 -1.13 1.55 1.27 2.42 -1.75
1112 19.7 5.60 0.51 31.39 0.26 2.86
1189 21.6 6.92 9.64 47.95 93.02 66.78

8/8/2019 Mutual+Fund Project+
http://slidepdf.com/reader/full/mutualfund-project 41/79
∑X=12.27 ∑Y=17.67 ∑X2=141.81 ∑Y2=113.54 ∑XY=67.93
= 0.23
c) Alpha
Alpha is part of what is called modern portfolio theory, a set of techniques that
analyze investing in a somewhat academic manner. Alpha is used along with beta. Beta is
therefore a measure of volatility.
Alpha tells you whether that fund has produced returns justifying the risks it is taking
by comparing its actual return to the one 'predicted' by the beta. Say, a fund can be expected
to earn—based on its beta—a return of 15 per cent in a given year. However, it actually
fetches you 18 per cent. Then the alpha of the fund is simply 18-15 = 3, that is, 3.
Alpha can be seen as a measure of a fund manager's performance. A positive alpha
implies that a fund has performed better than expected, given its level of risk. So higher the
alpha better are returns.
E.g.: From the above example
X = ∑X = 12.27 = 2.45 Y = ∑Y = 17.67 = 3.53
N 5 N 5
Alpha = { 3.53 – ( 0.23 * 2.45 )} = 2.97
d) R-Squared
R-squared measures how much of the fund’s return can be explained by the market
movements. It does this by measuring how closely the fund’s performance tracks that of the
benchmark index. The R-squared of an index fund, investing in same securities and in the
same weightage as the index, will be one. If a fund has a high R-squared, it makes the beta a
valid measure. A figure of 0.8 or higher for the R-squared is considered adequate to give
credence to the beta. The lower the R-squared the less reliable is the beta.

8/8/2019 Mutual+Fund Project+
http://slidepdf.com/reader/full/mutualfund-project 42/79

8/8/2019 Mutual+Fund Project+
http://slidepdf.com/reader/full/mutualfund-project 43/79
f) Treynor Ratio
The Treynor ratio is a measurement of the returns earned in excess of that which could have
been earned on a riskless investment.
The Treynor ratio (sometimes called reward-to-volatility ratio) relates excess return
over the risk-free rate to the additional risk taken; however systematic risk instead of total
risk is used. The higher the Treynor ratio, the better the performance under analysis.
Where, Ti = Treynor
R i = the average portfolio return
R f = the average risk free rate
βi = the slope of the characteristic
line during the time period
For e.g.: Let R i = 29.40%, R f = 7.44%, βi = 0.23
Then Tt = 0.2940 – 0.0744 = 0.95
0.23
3) Qualitative Measures
a) Benchmark Index
It is generally an index like the BSE TECk, Bankex etc. This is used for judging the
performance of the fund by comparing the returns of the funds with their respective
benchmark index. There are some funds which beat the index and gives higher returns to the
investors.
i
f i
i
R RT
β
−
=

8/8/2019 Mutual+Fund Project+
http://slidepdf.com/reader/full/mutualfund-project 44/79
CHAPTER III
DATA ANALYSIS&
INTERPRETATION

8/8/2019 Mutual+Fund Project+
http://slidepdf.com/reader/full/mutualfund-project 45/79

8/8/2019 Mutual+Fund Project+
http://slidepdf.com/reader/full/mutualfund-project 46/79

8/8/2019 Mutual+Fund Project+
http://slidepdf.com/reader/full/mutualfund-project 47/79
(CADM), System Integration, IT Consulting, Application Management, Infrastructure
Management Services, Software testing, Service-oriented architecture and Web services.
Even in the event of a falling dollar and a strengthened rupee, India is the undisputed
leader in offshore services, accounting for 65-70 per cent of the global off shoring pie. It tops
the list of 30 countries on criteria such as language, Government support, labour pool,
infrastructure, educational system, cost, political and economic environment, cultural
compatibility, global and legal maturity, and data and intellectual property security and
privacy, says Gartner.
In 2006-07, software and services exports grew by 33 per cent to register revenue of US$
31.4 billion, whereas the domestic segment grew by 23 per cent to US$ 8.2 billion. Withinexports, IT services touched US$ 18 billion, a growth of 35.5 per cent. The country's IT
exports have, in fact, come quite far, starting from a few million dollars in the early 90s. The
Government expects the exports turnover to touch US$ 80 billion by 2011, growing at an
annual rate of 30 pc per annum.
Equity Linked Savings Scheme (ELSS)
These schemes offer tax rebates to the investors under specific provisions of the Income Tax
Act, 1961 as the Government offers tax incentives for investment in specified avenues. E.g.
Equity Linked Savings Schemes (ELSS). These schemes are growth oriented and invest pre-
dominantly in equities. Their growth opportunities and risks associated are like any equity-
oriented scheme. ELSS invests predominantly in equity, and offer tax deduction to investors
under section 80 C of the Income Tax Act. Currently rebate u/s 80C can be availed up to a
maximum investment of Rs 1, 00,000. A lock-in of 3 years is mandatory.
FMCG
Franklin FMCG Fund (G)
SBI Magnum Sector Umbrella – FMCG (G)
ICICI Prudential FMCG (G)
Birla SunLife Buy India Fund (G)

8/8/2019 Mutual+Fund Project+
http://slidepdf.com/reader/full/mutualfund-project 48/79

8/8/2019 Mutual+Fund Project+
http://slidepdf.com/reader/full/mutualfund-project 49/79
Interpretation: From the above table & chart it is seen that ICICI Pru FMCG fund has given
the highest returns of 191% since 2005. It was followed by Birla Buy India fund with 124%
returns. Over the three years ICICI FMCG fund was able to give the highest returns followed
by Birla Sunlife Buy India Fund. In the market meltdown in 2008 the magnum FMCG and
Birla Buy India fund each has taken hit by around 18%. This shows that the fund
management of ICICI FMCG is proactive as it has been able to produce better returns when
compared to its peers. The Magnum FMCG fund was a terrible performer with only 11%
returns over three years.
TABLE 2: Table showing the General Characteristics of the FMCG Funds
Source: Value Research, March 2008
FundAUM
(Cr)
Expense ratio
(%)PE Ratio
Turnover
Ratio (%)
Franklin FMCG Fund 25.19 2.50 33.55 8.17
SBI Magnum FMCG Fund 7.65 2.50 38.43 31
ICICI Pru FMCG Fund 69.69 2.50 42.45 99
Birla SunLife Buy IndiaFund 58.33 2.44 35.72 14

8/8/2019 Mutual+Fund Project+
http://slidepdf.com/reader/full/mutualfund-project 50/79
Interpretation: From the above table & chart it is seen that ICICI and Birla have a higher
AUM when compared to Magnum and Franklin. This is in correlation to the returns
generated by the funds. As magnum has given very less returns it has faced large redemptions
and as a result its AUM has declined and now stands at just 7.65Cr.
The expense ratio is the amount which the investor pays manage the fund in
percentage terms is more or less same for all the funds and it comes upto 2.5%.
The PE ratio is high for ICICI which is 42.45 and it is followed by Magnum, Birla
and Franklin. All the funds have a high PE ratio and this shows that these funds have more of
growth stocks in their portfolio.
The turnover ratio for ICICI is very high at 99%. This shows that ICICI fund has
churned its entire portfolio in a year. Whereas the other funds have a comparatively lesser turnover ratios.
TABLE 3: Table Showing the Vital Statistics of the FMCG Funds
FundSD
(%)
Annualised
S.DBeta Alpha R 2 Sharpe Treynor
FranklinFMCG Fund
6.27 21.71 0.58 0.80 0.68 0.83 0.31
SBI MagnumFMCG Fund
7.59 26.30 0.43 -0.38 0.16 0.00 0.00
ICICI PruFMCG Fund
6.98 24.19 0.62 1.66 0.48 1.22 0.48
Birla SunLifeBuy IndiaFund
6.47 22.42 0.73 0.38 0.69 0.92 0.28

8/8/2019 Mutual+Fund Project+
http://slidepdf.com/reader/full/mutualfund-project 51/79
Interpretation: The overall risk of Magnum fund is higher when compared to FMCG funds.
Also Magnum provides the least returns comparatively. On the other hand ICICI has a S.D of
6.98 but it provides the highest returns. All the funds have a relatively same S.D.
Interpretation: All the funds are less volatile than their respective benchmark indices as the
beta values are less than one. Magnum FMCG fund has underperformed as it has a negative
alpha. ICICI Pru FMCG fund has performed better than expectations as it has a very high
Alpha. The beta of a fund has to be seen in conjunction with the R-squared for understanding
the risk of the fund. As the Franklin and Birla have a high R 2 it makes the beta a valid
measure.

8/8/2019 Mutual+Fund Project+
http://slidepdf.com/reader/full/mutualfund-project 52/79
Interpretation: Sharpe Ratio defines the relation between return and volatility of the funds.
It shows the Risk adjusted return. Comparatively ICICI fund is more reliable and SBI has the
least ratio. Treynor ratio of ICICI is high and this shows that it has been able to earn higher
excess return over the risk free rate when compared to other schemes. SBI has a Treynor ratio
of zero and is the undesirable choice for investment.
PHARMA FUNDS:
Franklin Pharma
JM Healthcare Sector 1
Magnum Pharma
Reliance Pharma
UTI Pharma & Healthcare
TABLE 4: Table Showing the Absolute Returns of Pharmaceutical Funds
Scheme 2008 2007 2006 2005 Since 2005
Franklin Pharma -12.41 5.75 13.86 17.36 36.95
JM HealthcareSector -11.26 11.24 16.10 16.49 44.44
MagnumPharma -14.94 6.74 12.63 44.41 54.09
Reliance Pharma -21.54 49.80 16.73 29.40 88.34
UTI Pharma &Healthcare
-12.15 12.08 8.25 16.02 34.73
1 JM Healthcare Sector fund is not a top ten AMC.

8/8/2019 Mutual+Fund Project+
http://slidepdf.com/reader/full/mutualfund-project 53/79
Interpretation: From the above table & chart it can be seen that Reliance Pharma is the best
performing fund followed by Magnum Pharma, JM Healthcare, Franklin and UTI Pharma.
Reliance was able to give a very high overall return when compared to other funds in this
category because of the 50% returns given by it in the year 2007. Also in the year 2008 the
reliance fund has taken a worst hit when compared to others by 21.54%. The worst reforming
funds in this sector were Franklin Pharma and UTI Pharma. This is mainly because of thePharmaceutical sector as a whole has been underperforming over a period time.
TABLE 5: Table showing the General Characteristics of the Pharmaceutical Funds
Fund AUM(cr)Expense Ratio
(%)PE Ratio
Turnover
Ratio (%)
Franklin Pharma43.58 2.50 20.24 42.90
JM Healthcare Sector 5.47 2.50 22.21 34.25
Magnum Pharma33.95 2.50 23.37 17.00
Reliance Pharma136.23 2.19 18.77 36.00
UTI Pharma &Healthcare
55.54 2.50 22.50 98.30
Source: Value Research, March 2008

8/8/2019 Mutual+Fund Project+
http://slidepdf.com/reader/full/mutualfund-project 54/79
Interpretation: From the above table & chart it is seen that the AUM of Reliance Pharma is
highest when compared to other funds in the same category. Invariably funds having higher
returns will attract more investors and this leads to an increase in its AUM.
The expense ratio for all the funds stands at 2.5% except for Reliance Pharma which
is at 2.19%. This shows that the fund management of Reliance is efficient as its annual
recurring expenses are lesser when compared to its competitors. This is mainly due to larger
asset under management.
The PE ratio for all the funds is around 20 to 23 times. Whereas the PE ratio of
Reliance Pharma is just 18.77 times. In spite of a lower PE ratio it is able to give higher
returns to its investors.
The turnover ratio represents the percentage of a fund’s holding that change every
year. UTI Pharma has been able to churn 98% of its portfolio and the turnover of Magnum is
the least at 17%.
TABLE 6: Table Showing the Vital Statistics of Pharmaceutical Funds
Fund SD (%)Annualised
S.DBeta Alpha R 2 Sharpe Treynor
Franklin
Pharma
7.04 24.38 0.62 0.17 0.59 0.07 0.03

8/8/2019 Mutual+Fund Project+
http://slidepdf.com/reader/full/mutualfund-project 55/79
JMHealthcareSector
7.32 25.36 0.70 0.33 0.62 0.18 0.07
MagnumPharma
7.45 25.81 0.61 0.70 0.43 0.31 0.13
ReliancePharma
8.27 28.65 0.82 1.13 0.53 0.54 0.19
UTI Pharma&Healthcare
7.36 25.51 0.70 0.13 0.61 0.09 0.03
Interpretation: The Reliance Pharma fund has a high S.D of 8.27. S.D measures the risks
associated with the fund. Also Reliance fund justifies this risk as it gives the highest returns
when compared to other funds.

8/8/2019 Mutual+Fund Project+
http://slidepdf.com/reader/full/mutualfund-project 56/79
Interpretation: All the Pharma funds has fairly same beta around 0.7 and therefore they will
fluctuate slightly less than their indices. The Reliance fund has an Alpha greater than one as a
result it has performed better than all other funds. The alpha of UTI Pharma is 0.13 andtherefore it has not met its expectations. The R 2 comparatively of all the funds are between
0.43 to 0.61. This shows that all the funds correlate with the performance of their benchmark
index.
Interpretation: Based on Sharpe ratio Reliance is a much better choice as it has a higher
returns per unit of risk. It is followed by Magnum and JM. Based on Treynor measure
Franklin, JM and UTI are least preferred fund as the give lesser returns then the other two
funds. Hence based on both the measures Reliance is the first choice of investment.
TECHNOLOGY FUNDS
Birla Sun Life New Millennium
ICICI Prudential Technology
Kotak Tech
SBI Magnum IT
UTI Software
TABLE 7: Table Showing the Absolute Returns of Technology Funds
Scheme 2008 2007 2006 2005 Since 2005

8/8/2019 Mutual+Fund Project+
http://slidepdf.com/reader/full/mutualfund-project 57/79
Birla Sun Life New Millennium -17.12 20.77 46.01 52.86 114.98
ICICI Prudential Technology -12.73 10.92 51.64 53.34 125.76
Kotak Tech -20.08 0.20 36.68 22.54 53.54
Magnum IT -15.34 6.41 51.17 65.40 100.20
UTI Software -18.32 -10.09 47.37 45.81 62.23
Interpretation: From the above table & chart it is seen that the technology funds have given
very good returns in the year 2005 and 2006. But the returns were very meager in the year
2007 and it was negative in the year 2008. Over the three years’ time period three funds have
doubled in value with over 100% returns. The best performing fund was ICICI Pru
Technology followed by Birla Sunlife and Magnum IT. The technology sector has showed a
negative return in the last 14 months mainly due the U.S Dollar depreciation. The worst
performing fund was Kotak Tech.
TABLE 8: Table showing the General Characteristics of Technology Funds

8/8/2019 Mutual+Fund Project+
http://slidepdf.com/reader/full/mutualfund-project 58/79
Source: Value Research, March 2008
Fund AUM (Cr)Expense
ratio (%)PE
Ratio
Turnover
Ratio(%)
Birla Sun Life NewMillennium
92.93 2.45 45.98 45
ICICI Prudential Technology 129.55 2.40 25.96 92.00
Kotak Tech 27.20 2.25 38.25 81.83
SBI Magnum IT 69.99 2.48 23.94 10.00
UTI Software 79.60 2.38 24.40 25.35

8/8/2019 Mutual+Fund Project+
http://slidepdf.com/reader/full/mutualfund-project 59/79
Interpretation: From the above table & chart it is seen that the ICICI Pru Technology fund
is the largest fund and the Kotak Tech is the smallest fund in this sector. This shows that the
marketing activities of ICICI was aggressive than its competitors and also the returns
generated are higher and therefore it has a very high AUM.
The Expense ratio is relatively same for all the funds ranging from 2.25% to 2.45%. It
is high for Magnum IT fund and it was least for Kotak Tech.
The PE ratio was very high for Birla and Kotak Tech. Whereas for other funds it was
relatively same ranging from 24% to 26%. This shows that Birla and Kotak had aggressive
growth stocks in its portfolio.
The turnover ratio was very high for ICICI and Kotak. This shows that the volume of
trading carried out by them was very high. On the other hand the volume of trading for Magnum was very least at 10%.
TABLE 9: Table Showing the Vital Statistics of Technology funds
Fund SD (%)Annualised
S.DBeta Alpha R 2 Sharpe Treynor
Birla SunLife NewMillennium
6.45 22.35 0.90 0.53 0.86 0.89 0.22
ICICIPrudentialTechnology
7.17 24.85 0.84 1.39 0.54 0.88 0.26
Kotak Tech 6.67 23.10 0.94 0.16 0.86 0.37 0.09
Magnum IT 7.20 24.94 0.90 0.95 0.61 0.70 0.19
UTISoftware
6.86 23.75 0.98 0.45 0.94 0.42 0.10

8/8/2019 Mutual+Fund Project+
http://slidepdf.com/reader/full/mutualfund-project 60/79
Interpretation: The S.D of ICICI and Magnum IT fund is higher. This is justified by its high
returns. Whereas Birla fund has a low risk but it yields a very high returns. So Birla fund is
better in terms of risk return parameters.
Interpretation: All the funds have a fairly same beta –slightly less than one and therefore
will fluctuate slightly less than their respective indices. ICICI fund has an alpha higher than
one and it is the best performer. Whereas the Kotak Tech fund has a very low alpha and
therefore it has given a return which slightly higher than its benchmark. As the R 2 of UTI,
Kotak and Birla is high and close to one we can say that its performance correlates with the
performance of the benchmark and it makes the beta a valid measure.

8/8/2019 Mutual+Fund Project+
http://slidepdf.com/reader/full/mutualfund-project 61/79
Interpretation: By Sharpe measure both Birla and ICICI is better than the other three as it
has a higher ratio. By Treynor’s measure also the same conclusion is arrived. Between the
two ICICI is a better choice as it has a higher Treynor measure. Here the Kotak fund is least
preferred as is has lest Sharpe and Treynor measure.
ELSS:
These schemes offer tax rebates to the investors under specific provisions of the
Income Tax Act, 1961 as the Government offers tax incentives for investment in specified
avenues. E.g. Equity Linked Savings Schemes (ELSS) .These schemes are growth oriented
and invest pre-dominantly in equities. Their growth opportunities and risks associated are like
any equity-oriented scheme. ELSS invests predominantly in equity, and offer tax deduction to
investors under section 80 C of the Income Tax Act. Currently rebate u/s 80C can be availed
up to a maximum investment of Rs 1,00,000. A lock-in of 3 years is mandatory.
Large Schemes (AUM >500 crores)
1. Birla Tax Plan 98 (G)
2. Franklin India Tax Shield (G)
3. HDFC Long Term Advantage (G)
4. ICICI Pru Tax Plan (G)
5. SBI Magnum Tax Gain (G)
TABLE 10: Table Showing the Absolute Returns of ELSS Schemes

8/8/2019 Mutual+Fund Project+
http://slidepdf.com/reader/full/mutualfund-project 62/79
Schemes 2008 2007 2006 2005Since
2005
Birla Tax Plan 98 -18.94 51.73 31.88 57.34 155.21
Franklin India Tax Shield -15.75 56.02 27.17 48.93 148.95
HDFC Long Term Advantage -14.29 40.62 23 55.63 130.73
ICICI Pru Tax Plan -19.47 40.95 26.15 68.8 141.71
SBI Magnum Tax Gain -13.40 18.65 2.73 52.98 73.79
Interpretation: It is seen that overall the ELSS schemes have been performing exceptionally
well with overall returns of around 140% over three years. The best performing fund was
Birla Tax plan followed by Franklin Tax Shield, ICICI Pru Tax Plan and HDFC LT
Advantage fund. The worst performer in this category was the Magnum Tax Gain which wasable to produce only half of the returns which its peer could manage. This shows that fund
management of magnum Tax gain was ineffective.
TABLE 11: Table showing the General Characteristics of ELSS Schemes
Scheme Name AUM (cr)Expense
Ratio (%)P/E Ratio
Turnover
ratio (%)
Birla Tax Plan 98 651.82 2.30 44.96 23.00

8/8/2019 Mutual+Fund Project+
http://slidepdf.com/reader/full/mutualfund-project 63/79
Franklin India TaxShield
553.24 2.28 38.43 66.70
HDFC Long TermAdvantage
855.25 2.16 32.56 31.84
ICICI Pru Tax Plan 834.00 2.17 29.32 187.00SBI Magnum TaxGain
3,263.51 1.89 32.56 7.00
Source: Value Research, March 2008
Interpretation: From the above table & chart it is seen that Magnum Tax gain has a very
high AUM when compared to other funds. Its AUM is nearly four times to its nearest
competitors. This shows that magnum fund has a very large investor base. Also other funds
have a healthy AUM ranging from 550 Crs to 830 Crs. The AUM is generally high for ELSS
schemes mainly due to the tax benefit provided by investing in these schemes.

8/8/2019 Mutual+Fund Project+
http://slidepdf.com/reader/full/mutualfund-project 64/79
Interpretation: The Expense ratio is relatively same for all the funds except Magnum Tax
gain which is at 1.89%. The expense of this fund is lower when compared to its competitors
mainly due to the very large AUM base.
The PE ratio of all the funds are well above 29 times, this is mainly because the
investment objective of these funds is investing mainly in equities and a very minimal portion
is invested in debt.
The Turnover ratio for ICICI for very high at 187% which shows a very high trading
volume. Whereas for the other funds it was relatively lesser and ranged from 7% to 66%
mainly due to the lock in period associated with these funds. The fund managers can invest in
stocks for a long period of time in order to generate higher returns.
TABLE 12: Table Showing the Vital Statistics of ELSS Schemes
FundSD
(%)
Annualised
S.DBeta Alpha R² Sharpe Treynor
Birla Tax Relief 96 6.52 22.59 0.85 0.32 0.74 1.11 0.30
Franklin IndiaTax Shield
6.68 23.15 0.90 0.30 0.93 1.05 0.27
HDFC LongTermAdvantage
6.05 20.96 0.71 0.38 0.72 1.01 0.30
ICICI Pru TaxPlan
7.22 24.99 0.86 0.33 0.64 0.97 0.28
SBI MagnumTax gain
7.79 26.98 0.68 -0.04 0.31 0.55 0.22

8/8/2019 Mutual+Fund Project+
http://slidepdf.com/reader/full/mutualfund-project 65/79
Interpretation: The S.D of all the funds is relatively same around 6.5 for all the funds except
ICICI and Magnum which has a high S.D. Also Magnum has a very high S.D but it yields a
very low return. In terms of risk HDFC has the least risk with high returns.
Interpretation: The beta is highest of Franklin fund and least for the Magnum fund. All the
funds have a beta less than one and hence they are less volatile than their benchmark indices.
The alpha of all the funds is relatively same for all the funds except for Magnum Tax
fund it is negative. This means that magnum fund has under performed its benchmark index.
As the Franklin fund has a R 2 of 0.93, this shows it correlates perfectly with the
benchmark and as a result it has given the same returns as generated by its benchmark. Also
as Magnum has a low R 2, therefore beta of Magnum is not a valid measure.

8/8/2019 Mutual+Fund Project+
http://slidepdf.com/reader/full/mutualfund-project 66/79
Interpretation: From the above table and chart it is seen that comparatively all the funds
except Magnum fund have a high Sharpe ratio around one. By Treynor’s measure the best
funds are Birla and HDFC fund. Based on both the measures the best ranked fund is Birla and
the least ranked fund is Magnum fund.
TABLE 13: Table showing the various sectoral schemes and its Benchmark Index.

8/8/2019 Mutual+Fund Project+
http://slidepdf.com/reader/full/mutualfund-project 67/79
Source: www.mutualfundsofindia.com
QUALITATIVE DATA
SCHEME BENCHMARK
FMCG
Franklin FMCG Fund ET BrandexSBI Magnum FMCG Fund BSE FMCG
ICICI Pru FMCG Fund S&P CNX FMCG
Birla SunLife Buy India Fund BSE200
TECHNOLOGY
Birla Sun Life New Millennium BSE TECk
ICICI Prudential Technology BSE IT
Kotak Tech BSE ITSBI Magnum IT BSE IT
UTI Software S&P CNX Software
PHARMA
Franklin Pharma ET Lifex
JM Healthcare Sector BSE HC
Magnum Pharma BSE HC
Reliance Pharma BSE HC
UTI Pharma & Healthcare S&P CNX Pharma
ELSS
Birla Tax Plan 98 SENSEX
Franklin India Tax Shield S&P CNX 500
HDFC Long Term Advantage Sensex
ICICI Prudential Tax Plan S&P CNX Nifty
SBI Magnum Tax Gain BSE 100

8/8/2019 Mutual+Fund Project+
http://slidepdf.com/reader/full/mutualfund-project 68/79

8/8/2019 Mutual+Fund Project+
http://slidepdf.com/reader/full/mutualfund-project 69/79
FMCG
ICICI Pru FMCG fund has given the highest returns of 191% since 2005. It was
followed by Birla Buy India fund with 124% returns. The Magnum FMCG fund was a
terrible performer with only 11% returns over three years.
ICICI FMCG and Birla have a higher AUM when compared to Magnum and
Franklin. This is in correlation to the returns generated by the funds. As magnum has
given very less returns it has faced large redemptions.
The expense ratio is more or less same for all the funds at 2.5%.
The PE ratio is high for ICICI which is 42.45 and it is followed by Magnum, Birla
and Franklin.
The overall risk of Magnum fund is higher when compared to other FMCG funds.
Also Magnum provides the least returns comparatively. On the other hand ICICI has a
S.D of 6.98 but it provides the highest returns.
All the funds are less volatile than their respective benchmark indices as the beta
values are less than one. Magnum FMCG fund has underperformed as it has a negative
alpha. ICICI Pru FMCG fund has performed better than expectations as it has a very high
Alpha. As the Franklin and Birla have a high R 2 it makes the beta a valid measure.
Sharpe Ratio defines the relation between return and volatility of the funds. It shows
the Risk adjusted return. Comparatively ICICI fund is more reliable and SBI has the least
ratio. Treynor ratio of ICICI is high and this shows that it has been able to earn higher
excess return over the risk free rate when compared to other schemes. SBI has a Treynor
ratio of zero and is the undesirable choice for investment.
PHARMA FUNDS
Reliance Pharma is the best performing fund followed by Magnum Pharma, JM
Healthcare, Franklin and UTI Pharma. Reliance was able to give a very high overall
return when compared to other funds in this category because of the 50% returns given by

8/8/2019 Mutual+Fund Project+
http://slidepdf.com/reader/full/mutualfund-project 70/79
it in the year 2007. The worst performing funds in this sector were Franklin Pharma and
UTI Pharma.
Reliance Pharma has a higher AUM when compared to other funds. Invariably funds
having higher returns will attract more investors and this leads to an increase in its AUM.
The expense ratio for all the funds stands at 2.5% except for Reliance Pharma which is at
2.19%. This is mainly due to larger asset under management.
The PE ratio for all Pharma funds is around 20 to 23 times. Whereas the PE ratio of
Reliance Pharma is just 18.77 times. In spite of a lower PE ratio it is able to give higher
returns to its investors.
The turnover ratio represents the percentage of a fund’s holding that change every year.
UTI Pharma has been able to churn 98% of its portfolio and the turnover of Magnum is
the least at 17%.
The Reliance Pharma fund has a high S.D of 8.27. S.D measures the risks associated with
the fund. Also Reliance fund justifies this risk as it gives the highest returns when
compared to other funds.
The Reliance fund has an Alpha greater than one as a result it has performed better than
all other funds. The alpha of UTI Pharma is 0.13 and therefore it has not met its
expectations. The R 2 comparatively of all the funds are between 0.43 to 0.61. This shows
that all the funds correlate with the performance of their benchmark index.
Based on Sharpe ratio Reliance is a much better choice as it has a higher returns per unit
of risk. It is followed by Magnum and JM. Based on Treynor measure Franklin, JM and
UTI are least preferred fund as the give lesser returns then the other two funds. Hence based on both the measures Reliance is the first choice of investment.
TECHNOLOGY FUNDS
Technology funds have given very good returns in the year 2005 and 2006. Over the three
years’ time period three funds have doubled in value with over 100% returns. The best
performing fund was ICICI Pru Technology followed by Birla Sunlife and Magnum IT.

8/8/2019 Mutual+Fund Project+
http://slidepdf.com/reader/full/mutualfund-project 71/79
The technology sector has showed a negative returns in the last 14 months mainly due the
U.S Dollar depreciation. The worst performing fund was Kotak Tech.
The ICICI Pru Technology fund is the largest fund and the Kotak Tech is the smallest
fund in this sector.
The Expense ratio is relatively same for all the funds ranging from 2.25% to 2.45%. It is
high for Magnum IT fund and it was least for Kotak Tech.
The PE ratio was very high for Birla and Kotak Tech. Whereas for other funds it was
relatively same ranging from 24% to 26%.
The turnover ratio was very high for ICICI and Kotak. This shows that the volume of
trading carried out by them was very high. On the other hand the volume of trading for
Magnum was very least at 10%.
The S.D of ICICI and Magnum IT fund is higher. This is justified by its high returns.
Whereas Birla fund has a low risk but it yields a very high returns. So Birla fund is better
in terms of risk and return parameters.
All the funds have a fairly same beta –slightly less than one and therefore will fluctuate
slightly less than their respective indices. ICICI fund has an alpha higher than one and is a
better performer. As the R 2 of UTI, Kotak and Birla is high and close to one we can say
that its performance correlates with the performance of the benchmark and it makes the
beta a valid measure.
By Sharpe measure both Birla and ICICI is better than the other three as it has a higher
ratio. By Treynor’s measure also the same conclusion is arrived. Between the two ICICI
is a better choice as it has a higher Treynor measure. Here the Kotak fund is least preferred as is has lest Sharpe and Treynor measure.
EQUITY LINKED SAVINGS SCHEMES
ELSS schemes have been performing exceptionally well with overall returns of around
140% over three years. The best performing fund was Birla Tax plan followed by
Franklin Tax Shield, ICICI Pru Tax Plan and HDFC LT Advantage fund. The worst

8/8/2019 Mutual+Fund Project+
http://slidepdf.com/reader/full/mutualfund-project 72/79
performer in this category was the Magnum Tax Gain which was able to produce only
half of the returns which its peer could manage. This shows that fund management of
magnum Tax gain was ineffective.
It is seen that Magnum Tax gain has a very high AUM when compared to other funds. Its
AUM is nearly four times to its nearest competitors. This shows that magnum fund has a
very large investor base. Also other funds have a healthy AUM ranging from 550 Crs to
830 Crs. The AUM is generally high for ELSS schemes mainly due to the tax benefit
provided by investing in these schemes.
The Expense ratio is relatively same for all the funds except Magnum Tax gain which is
at 1.89%. The expense of this fund is lower when compared to its competitors mainly due
to the very large AUM base.
The PE ratio of all the funds are well above 29 times, this is mainly because the
investment objective of these funds is investing mainly in equities and a very minimal
portion is invested in debt.
The Turnover ratio for ICICI is very high at 187% which shows a very high trading
volume. Whereas for the other funds it was relatively lesser and ranged from 7% to 66%
mainly due to the lock in period associated with these funds. The fund managers can
invest in stocks for a long period of time in order to generate higher returns.
The S.D of all the funds is relatively same around 6.5 for all the funds except ICICI and
Magnum which has a high S.D. Also Magnum has a very high S.D but it yields a very
low return. In terms of risk HDFC has the least risk with high returns.
The beta is highest of Franklin fund and least for the Magnum fund. All the funds have a
beta less than one and hence they are less volatile than their benchmark indices.
The alpha of all the funds is relatively same for all the funds except for Magnum Tax
fund it is negative. This means that magnum fund has under performed its benchmark
index.
As the Franklin fund has a R 2 of 0.93, this shows it correlates perfectly with the
benchmark and as a result it has given the same returns as generated by its benchmark.
Also as Magnum has a low R 2, therefore beta of Magnum is not a valid measure.
8/8/2019 Mutual+Fund Project+
http://slidepdf.com/reader/full/mutualfund-project 73/79
Comparatively all the funds except Magnum fund have a high Sharpe ratio around one.
By Treynor’s measure the best funds are Birla and HDFC fund. Based on both the
measures the best ranked fund is Birla and the least ranked fund is Magnum fund.
CONCLUSION
This research report was a very good learning experience for me. The project on
mutual fund facilitated me in understanding the theoretical concepts along with the in- depth
study of various important parameters to evaluate mutual fund schemes and has made me self
sufficient in analyzing the wide variety of schemes available in the market and picking up
the right one to invest.
By and large it has been seen that sector specific schemes like FMCG, Pharmaceutical
& Technology have not found investors interest as their AUM are very low when compared
to ELSS and also other diversified schemes. This is mainly due to the high risk involved by
investing in a particular sector. Investors tend to prefer diversified sectoral investment as therisks are reduced.

8/8/2019 Mutual+Fund Project+
http://slidepdf.com/reader/full/mutualfund-project 74/79
Ranking of funds maybe done as per Risk Adjusted Returns method. This is the most
precise and comparative way of ranking as it takes the risk and return, both into
consideration. Thus, it has proved to be more accurate and concrete. Also by the means of
Sharpe and Treynor measure all the sector specific schemes were analyzed and ranked. This
provides a ready guide for the investor in making the right investment decision.
It was traced that the funds, which embarked lower risk, did not always validate lower
returns or vice versa. This states that the risks and return need not always be in a beeline or
point-blank relationship.

8/8/2019 Mutual+Fund Project+
http://slidepdf.com/reader/full/mutualfund-project 75/79
CHAPTER V
SUGGESTIONS

8/8/2019 Mutual+Fund Project+
http://slidepdf.com/reader/full/mutualfund-project 76/79
SUGGESTIONS
The funds which are performing at an average level should increase their turnover ratios. As it has been seen from the study that all the top performing funds have a very
high turnover ratio.
Also in each sector invariably the best returns generator fund has the highest AUM.
Therefore the AMCs should adopt an aggressive marketing strategy to lure in the
investor to increase their fund corpus.
SBI Magnum FMCG fund has produced meager returns and this fund should bewound up.
Reliance Pharma fund can add more growth stocks to its portfolio to further enhance
its returns.
SBI Magnum Tax Gain fund needs to reduce its risk and also improve its returns by
increasing its trading volume and adopting an active fund management style.
TABLE 14: Table showing the ranking of FMCG Funds based on Sharpe & Treynor
measure
Rank Sharpe Ratio Treynor Ratio
1 ICICI Pru FMCG Fund ICICI Pru FMCG Fund2 Birla SunLife Buy India Fund Franklin FMCG Fund3 Franklin FMCG Fund Birla SunLife Buy India Fund4 SBI Magnum FMCG Fund SBI Magnum FMCG Fund
In FMCG sector the top pick for investment is the ICICI Prudential FMCG Fund as it
generates higher returns.
TABLE 15: Table showing the ranking of Pharmaceutical Funds based on Sharpe &
Treynor measure
Rank Sharpe Ratio Treynor Ratio
1 Reliance Pharma Reliance Pharma
2 Magnum Pharma Magnum Pharma3 JM Healthcare Sector JM Healthcare Sector

8/8/2019 Mutual+Fund Project+
http://slidepdf.com/reader/full/mutualfund-project 77/79

8/8/2019 Mutual+Fund Project+
http://slidepdf.com/reader/full/mutualfund-project 78/79

8/8/2019 Mutual+Fund Project+
http://slidepdf.com/reader/full/mutualfund-project 79/79
BIBLIOGRAPHY
Books Referred
• V.A AVADHANI, Securities Analysis and Portfolio Management,
Himalaya Publishing House, 2004
Magazines Referred
• Value Research-Mutual Fund Insight, Volume V, Number 7
• Business World, 3 March 2008
Websites
• www.mutualfundsofindia.com
• www.valueresearch.com
•
www.amfi-india.com• www.sebi.gov.in
• www.rbi.org.in
• www.moneycontrol.com
• www.nse-india.com
• www.bse-india.com
• www.money-zine.com
• www.njfundz.com