multinational - pper - african development bank
TRANSCRIPT
ADB/OPEV/2006/19 November 2006 Original : ENGLISH Distribution : LIMITED MULTINATIONAL
FIFTH LINE OF CREDIT TO EAST AFRICAN DEVELOPMENT BANK (EADB)
PROJECT PERFORMANCE EVALUATION REPORT

TABLE OF CONTENTS
Page N°.
CURRENCY EQUIVALENTS i BASIC PROJECT DATA ii EVALUATION RATING SUMMARY iii ABBREVIATIONS AND ACRONYMS iv EXECUTIVE SUMMARY v 1. BACKGROUND OF THE FIFTH LINE OF CREDIT 1 1.1 Introduction 1 1.2 Economic Background of East African Community 1
1.3 The EADB 2 2. THE EVALUATION 3
2.1 Evaluation Methodology and Approach 3 2.2 Key Performance Indicators 3
3. IMPLEMENTATION PERFORMANCE 4
3.1 Loan Effectiveness, Start-up and Implementation 4 3.2 Disbursement and Financing Arrangements 5 3.3 Supervision, Reporting, Monitoring and Evaluation 6
4. PERFORMANCE EVALUATION AND RATINGS 6
4.1 Relevance of the LOC and Quality at Entry 6 4.2 Achievements of Objectives and Outputs (“Efficacy”) 7 4.3 Efficiency 12 4.4 Institutional Development Impact 16 4.5 Sustainability 17 4.6 Aggregate Performance Rating 18 4.7 Performance of the Borrower 18 4.8 Performance of the Bank 19 4.9 Factors affecting Implementation Performance and Outcome 19
5. CONCLUSION, LESSONS LEARNT AND RECOMMENDATIONS 21
5.1 Conclusion 21 5.2 Main Findings (Lessons) and Recommendations 21
LIST OF TABLES Page N°. 3.1 Disbursement of LOC V in Million UA 5 4.1 Sub-projects Distribution by Member Countries and Sector of Activity 7 4.2 Performance of Sub-Projects 11 4.3 LOC V Repayments by EADB 13 4.4 Evaluation Rating Summary 17 Annexes N°. of Pages 1. Briefs on Economic and Financial Sector of EAC Countries 3 2. Selected Statistics of EAC Member States 3 3. Evolution of Bank’s LOC Policies and Strategies 2 4. Lessons Learnt from 3rd and 4th LOCs 2 5. Retrospective Result Based Logical Framework Matrix: LOC V 3 6. Summary Status of Sub-Projects Financed under LOC V 2 7. Performance Evaluation Criteria and Ratings 4 8. Historical Financial Statements 2 9. Factors Affecting Implementation Performance and Outcome 3 10. Sources of Information 1 This report was prepared by Mrs. G. HALL-YIRGA, Principal Evaluation Officer, Operations Evaluation Department, (OPEV) and Mr. Akinola AKINTUNDE (Consultant), following a field mission to East Africa. Any further matters relating to the report may be referred to Mr. D. A. BARNETT, Acting Director, OPEV, on extension 2041 or to Mrs. HALL-YIRGA, on extension 2263.
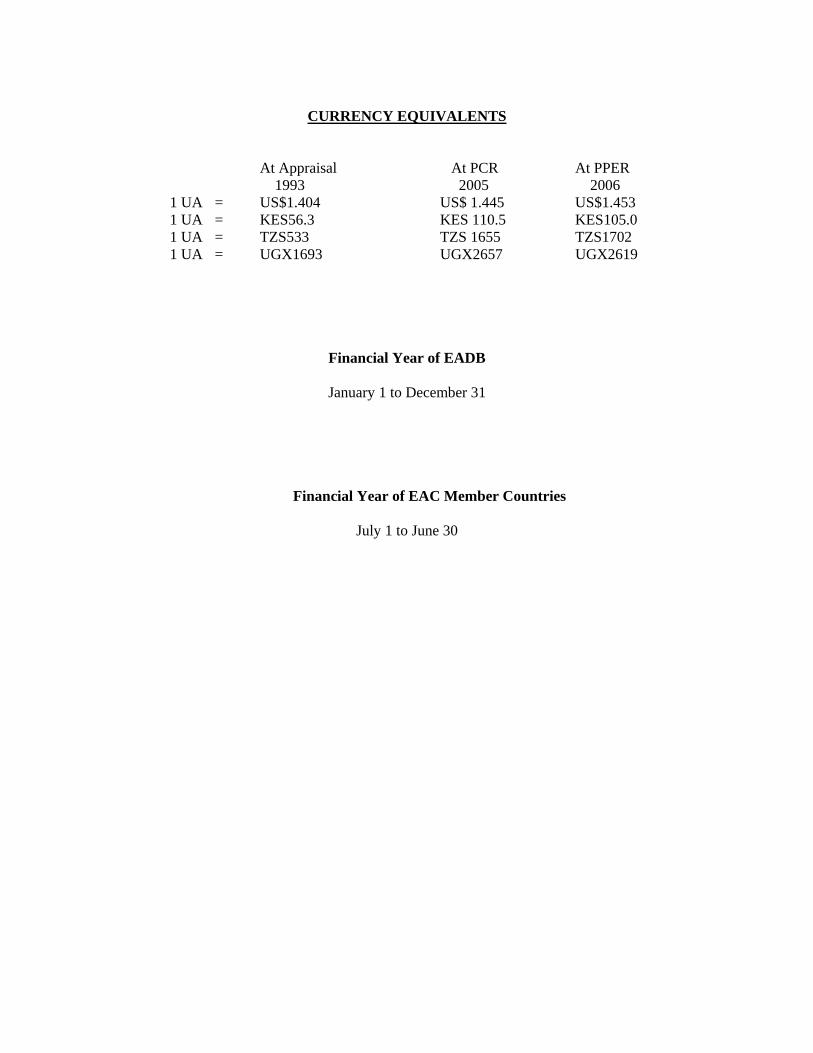
CURRENCY EQUIVALENTS
At Appraisal At PCR At PPER 1993 2005 2006
1 UA = US$1.404 US$ 1.445 US$1.453 1 UA = KES56.3 KES 110.5 KES105.0 1 UA = TZS533 TZS 1655 TZS1702 1 UA = UGX1693 UGX2657 UGX2619
Financial Year of EADB
January 1 to December 31
Financial Year of EAC Member Countries
July 1 to June 30

ii
BASIC PROJECT DATA
A. Loan Data 1. Country : Multinational (Kenya, Tanzania and Uganda) 2. Name of Project : Fifth Line of Credit 3. Loan Number : 2000190000089 4 Project Number : P-Z1-HAA-002 5. Loan Amount : UA 20 million 6. Sector : Financial Sector 7. Borrower : East African Development Bank (EADB) 8. Executing Agency : East African Development Bank (EADB) 9. Beneficiaries : East African Development Bank (EADB) 10. Guarantor : Subscribed Callable Capital of EADB B. Line of Credit Details Appraisal Actual 1. Amount (in UA million) : 15.00 15.00 2. Commitment Charge : 0.75% 0.75% 3. Interest Rate per annum : Fixed at 8.5%, and on-lending rate was fixed at 12% per annum 4. Repayment Period : 14 Years 14 Years 5. Grace Period : 4 Years 4 Years 6. Loan Approval Date : Oct. 1993 Oct. 1993 7. Loan signature Date : Apr. 1993 25/08/94 8. Date of Entry into Force : Apr. 1993 17/09/95
Term Lending 45.36Equity investment 4.00Working Capital 6.00
C. Financing Plan (UA millions) :
TOTAL 55.38ADB 15.00EXIM Bank(Japan) 5.00EADB Internal Source 16.41Other Sources 18.97
D. Source of Finance (UA millions) :
TOTAL 55.38E. Project Implementation 1. Date of Signature : March 1994 23/05/95 2. Effective Date : April 1994 17/09/95 3. Commencement Date : January 1994 March 1996 4. Completion Date (implementation) : December 1996 December 1999 5. Date of final disbursement : December 1997 August 1999 F. Performance Indicators 1. Overrun Period : 2 years 2. Number of last disbursement deadline extensions : 2 3. Number of sub-projects 19 4. Project Implementation Status Complete G. Disbursement Amount Disbursed % Disbursed 1. Total disbursed UA15 million 100 2. Amount cancelled NIL 3. Unused balance NIL
iii
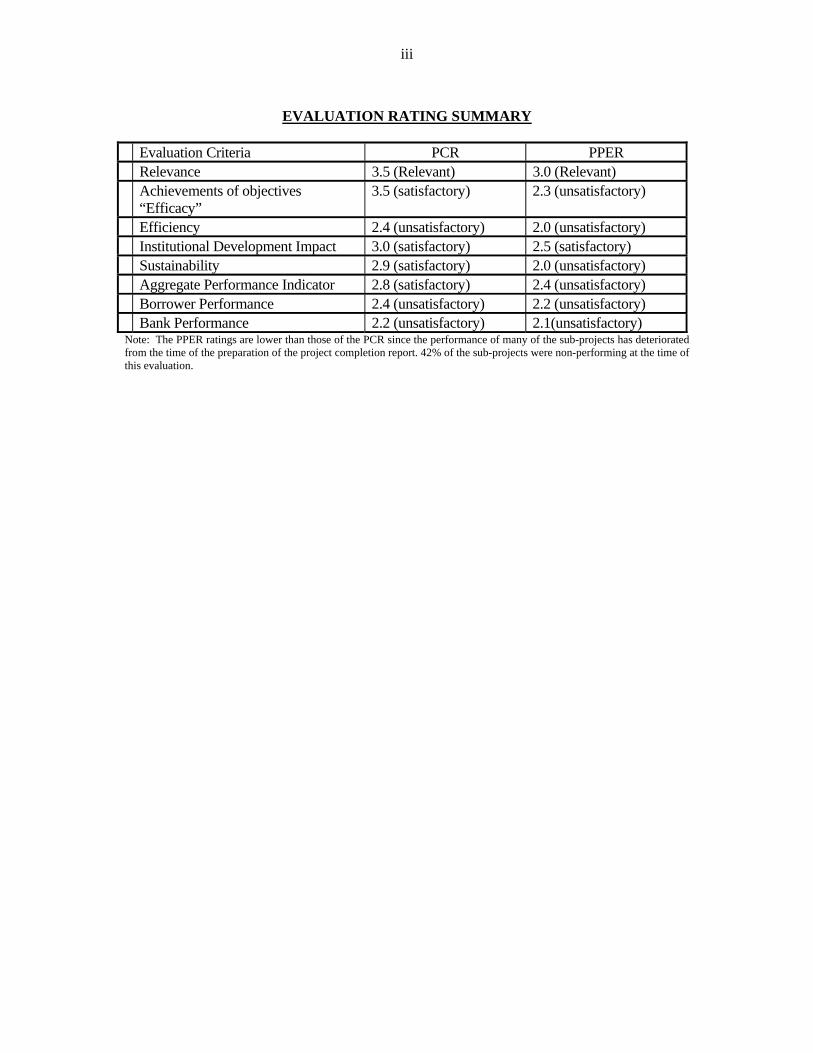
EVALUATION RATING SUMMARY
Evaluation Criteria PCR PPER Relevance 3.5 (Relevant) 3.0 (Relevant) Achievements of objectives
“Efficacy” 3.5 (satisfactory) 2.3 (unsatisfactory)
Efficiency 2.4 (unsatisfactory) 2.0 (unsatisfactory) Institutional Development Impact 3.0 (satisfactory) 2.5 (satisfactory) Sustainability 2.9 (satisfactory) 2.0 (unsatisfactory) Aggregate Performance Indicator 2.8 (satisfactory) 2.4 (unsatisfactory) Borrower Performance 2.4 (unsatisfactory) 2.2 (unsatisfactory) Bank Performance 2.2 (unsatisfactory) 2.1(unsatisfactory) Note: The PPER ratings are lower than those of the PCR since the performance of many of the sub-projects has deteriorated from the time of the preparation of the project completion report. 42% of the sub-projects were non-performing at the time of this evaluation.

iv
ABBREVIATIONS AND ACRONYMS
ADB = African Development Bank ADF = African Development Fund DFI = Development Finance Institution DRC = Democratic Republic of Congo COMESA = Common Market for Eastern and Southern Africa EAC = East African Community EADB = East African Development Bank EEC = European Economic Community EIA = Environmental Impact Assessment EIB = European Development Bank FMO = Netherlands Development Finance Company GDP = Gross Domestic Product IDB = Industrial Development Bank of Kenya IFC = International Finance Corporation KES = Kenya Shillings LIBOR = London Inter-Bank Offer Rate LOC = Line of Credit LOC V = Fifth Line of Credit to EADB NDF = Nordic Development Fund PCR = Project Completion Report PPER = Project Performance Evaluation Report PTA = Preferential Trade Area for Eastern and Southern Africa PTA Bank = Eastern and Southern African Trade and Development Bank RMC = Regional Member Country of ADB SAP = Structural Adjustment Programme SME = Small and Medium Enterprises TAF = ADF Technical Assistance Fund TZS = Tanzania Shillings The Bank = ADB TDFL = Tanzania Development Finance Limited UA = Unit of Account of African Development Bank Group UGX = Uganda Shilling UNDP = United Nations Development Programme USD/US$ = United States Dollar
v
EXECUTIVE SUMMARY 1. The East African Development Bank (EADB) is a sub-regional development bank owned by the three member states of Kenya, Uganda and Tanzania. Other shareholders include the African Development Bank, bilateral donors and some foreign banks. EADB was established in 1967 under the Treaty of East African Cooperation. Following the Cooperation’s break up in 1977, EADB was re-established in 1980 under its own charter and mandated to offer a broad range of financial services to small and medium enterprises (SMEs), guided by the overriding objective of promoting socio-economic development and regional integration in the member states. 2. The revitalization of regional cooperation among the member states through the establishment of the new East African Community (EAC) has given EADB’s development financing function a special role in promoting regional integration. EADB has been restructured a few times to improve its governance and portfolio management. The latest restructuring was carried out in early 2003 on the basis of a study carried out by Washington Advisory Group of the World Bank. Before then, EADB activities were concentrated at its Uganda Head Office. Following the restructuring, decentralization was effected by opening full-fledged country offices with adequate staff to handle the entire project cycle ‘from cradle to grave’ i.e. from project identification to completion. 3. ADB’s assistance to EADB dates back to 1970 when it participated in EADB’s equity capital in the formative stage. ADB has to date extended seven LOCs, some with a technical assistance component, for a total of UA96.12 million (net of cancellations), and an additional equity of UA4.45 million provided in 1999. LOC V, the subject of this evaluation, amounted to UA15million and was extended to EADB in 1994 for financing existing and newly established resource-based and export-oriented enterprises. Nineteen (19) sub-projects were financed under LOC V, of which 41% was in agriculture (floriculture) and agro-processing industry sectors, 33 % was in manufacturing, 16% in tourism and 10% in the transport sector. As regards the distribution among member states, 39% of the LOC was used in Kenya, 38% in Tanzania and 23% in Uganda. 4. Of the total 19 sub-projects, 11 sub-projects (58%) have been performing (of which eight (42%) were successful and three (16%) were partially successful. One sub-project (5%) was unsuccessful (requiring restructuring) and seven (37%) had failed. The performing sub-projects have contributed to foreign exchange savings or earnings and provided employment opportunities. The additional direct jobs created are about 2,000 of which women occupy about 25%. Several indirect jobs resulted from the backward and forward economic linkages in the sub-region. 5. LOC V was extended at a time when major economic reforms were taking place in the member states. This evaluation found that, in general, LOC V has been relevant and in line with ADB and EAC member countries’ policies for private sector development. The LOC had achieved the main objective of providing foreign currency resources for financing private sector export-oriented and import substitution projects. However, the development outcomes have not been achieved fully. 6. The major factors that contributed to the poor performance or failure of the sub-projects relate to high fixed on-lending interest rates on the foreign loans; foreign exchange risk on loan repayments; unfavourable weather conditions for the floriculture sub-projects; and inappropriate

vi
plant and equipment acquisition in some cases. Inadequate working capital and entrepreneurial and managerial capacities were setbacks that particularly plagued the new indigenous enterprises. Another bottleneck impeding success has to do with the general paucity of infrastructure facilities, particularly electricity that increased production costs excessively and impinged on the competitiveness of final products relative to imports, particularly following the liberalization policies adopted by member states. EADB’s poor governance and ADB’s haphazard monitoring both contributed to limit this LOC’s success rate. Thus, EADB’s operational and financial performance and the sub-projects’ overall evaluation were unsatisfactory with respect to efficacy, efficiency and sustainability. The institutional development impact, however, has been rated as satisfactory since this LOC was instrumental in initiating EADB’s restructuring, and the parallel financing of NDF and other donors. 7. During the LOC V implementation period, EADB performance experienced its highs and lows. From 1994 to 2001 profitability increased from UA1.7 million to UA5.4 million thanks to the injection of LOC V and the subsequent LOCs VI and VII, as well as the assistance from other donors. However, from 2001 onwards, EADB was in financial difficulties necessitating further restructuring and improvement in governance. The 2003 restructuring has brought about a turn around and modest profits in 2004 and 2005, as opposed to the deep losses in 2002 and 2003. The losses during these two years were largely a result of high provisioning for bad debts. 8. EADB’s sustainability is still a challenge primarily because of its constant concern about getting adequate resources from donors and member states to fulfil its mandate. EADB mainly finances medium- and large-scale enterprises and has not yet ventured into regional projects. Its own capacity limitation and ADB’s policy regarding the ceiling on single project size may have been among the factors restraining regional projects financing. There may not be also strong and sustained political will on the part of governments to finance integration projects. On the other side of the scale, EADB is also short on resources for lending to national level financial intermediaries that finance small and micro enterprises. There is a need to revisit policies and strategies regarding financial intermediation of sub-regional development banks, such as EADB, to scale up their operations that have regional scope on the one hand, and, on the other, to forge appropriate linkages with national level financial intermediaries that are better placed to reach out to small and micro-enterprises.
Main Findings (Lessons) and Recommendations 9. The main findings (lessons) and recommendations are as follows:
A. Good governance has been a key ingredient to improve EADB’s performance following the 2003 reforms, though sustainability is still a challenge. Also of concern is EADB’s lack of an adequate monitoring system that captures the developmental outcomes of sub-projects. In future interventions, ADB needs to assess critically that the corporate culture of DFIs has embraced good governance and best business practices. In addition, ADB needs to review that the monitoring and reporting system in place captures information and data on the development outcomes of the LOCs. In the light of LOC V’s poor performance and given that the Bank has financed two
vii
further LOCs (VI and VII) consideration of any new interventions should be subject to preparation of project completion reports on those operations. B. LOC V’s major initial advantage was its low interest rate, relative to the then prevailing market conditions, which enabled EADB to pass on the funds at competitive rates. Over time, however, sub-projects promoters found the fixed rate burdensome in view of the significant changes in market interest rate structure following the liberalization policy of member states. Moreover, some sub-projects needed term credit in local currency. The application of variable interest rates in recent years is encouraging, and this should continue with efficient system to make timely adjustments resulting from changes in market rates. ADB should consider financing in local currency to DFIs (through co-financing with commercial banks or issuing guarantees) to raise local currency resources for on lending to SMEs. In addition, the possibility of swapping foreign currency and local currency loans should be explored to mitigate for exchange risks. C. Financial sector liberalization and the ensuing availability of foreign currency in the formal markets has encouraged commercial banks to venture into medium to long-term lending – a move that poses new competitive challenges to DFIs, such as EADB. On the other side of the scale, DFIs are not adequately structured and resourced to meet the needs of small and micro-enterprises. And while institutions, such as small enterprise development agencies and NGOs, can provide technical assistance to small and micro-enterprises, their operations are often hampered by financial limitations.
ADB should forge effective linkages with sub-regional DFIs, and for the latter to do the same with national level financial intermediaries to channel bulk financial resources for on lending to the different client segments. Sub-regional DFIs, such as EADB, may need to concentrate on higher-level services, including those with sub-regional scope.
ADB should forge partnership and establish appropriate linkages for providing funding to small enterprises development agencies and NGOs that can effectively assist in capacity development of micro and small enterprises, in areas such as business plan development, loan application procedures and processes, accounting practices, and financial reporting. In effect, there is a need for ADB to revisit its policies and strategies of financial intermediations through sub-regional and national DFIs to determine the respective niche for competitiveness, additionality and complementarity among the different players.
D. The great challenge facing DFIs like EADB are augmenting its capital base
regularly, improving its asset base steadily, and mobilising resources to meet its mandate sustainably. In the interest of EADB’s future, ADB needs to dialogue with member states to
viii
enhance their share capital in order to improve EADB’s creditworthiness and, thereby, strengthen its capacity to mobilize internal and external resources.
E. The upper limit set on sub-regional development banks, such as EADB, to finance a specific sub-project may have constrained EADB from taking up larger scale national and sub-regional projects. ADB may consider raising the existing upper limit to performing sub-regional DFIs to enable them to take up larger national-level individual projects and co-finance investments with a regional integration scope.
F. Financial reporting from some sub-projects is suspect. In spite of their sustained performance, financial accounts show deficits or very little profits. Such accounting practice does not allow for assessing the build up of capital for sustainability and defeats part of the development objectives related to meeting tax obligations.
As part of the governance issue, ADB needs to assist member states to have well functioning tax authorities and regulatory bodies to oversee the performance of the private sector. ADB’s future interventions should include conditions requiring EADB to ensure that sub-projects financed under its LOC submit audited financial accounts prepared based on accepted financial accounting principles and practices.
G. Lack of adequate infrastructure such as reliable power supply has been a set back in the development of private sector in general and small enterprises in particular.
ADB needs to dialogue effectively with member states to explore ways of improving the overall enabling environment including the sustained provision of basic infrastructure.

1. BACKGROUND OF THE FIFTH LINE OF CREDIT 1.1 Introduction 1.1.1 The East African Development Bank (EADB) approached the African Development Bank (ADB) in December 1992 for a package of assistance comprising a Line of Credit (LOC) of UA20 million, technical assistance of UA900, 000, and equity participation of UA5 million. The ADB responded by launching a preparatory and an appraisal mission in March and July 1993, respectively. Subsequently, LOC V amounting to UA15million was approved in August 1994. In the same year, the Nordic Development Fund (NDF) intervened to cover the LOC financing gap of UA5 million and provided technical assistance of UA600,000. ADB’s equity participation of UA4.45 million was made in 1999. LOC V’s Loan Agreement was signed in May 1995 and became effective in September 1995. 1.1.2 LOC V was extended to support the economic recovery of EADB member states by providing foreign exchange resources to finance investments in small- and medium-scale private enterprises. To this end, LOC V was to support the industrial and export sector to improve production efficiency and the quality of the industrial products, to increase exports, and to create employment opportunities. LOC Vs specific objective was to avail foreign exchange resources to EADB for providing term loans to private sector enterprises, particularly those with regional impact in the member states. The objective of the technical assistance, which was financed by NDF, was to strengthen EADB’s institutional capacity. 1.1.3 LOC V’s outputs were to include viable rehabilitated existing enterprises and newly established resource-based and export-oriented projects in the agro-industrial, manufacturing and tourism sectors. The financing plan covered 20 sub-projects of which twelve were for rehabilitation and modernization while the remaining eight were new. All the sub-projects were expected to use local resources and/or produce for export markets. 1.1.4 ADB and EADB have a long-standing relationship that has entailed ADB’s multi-faceted engagement – in equity, LOCs, technical assistance -- to support EADB’s development operations. In addition to LOC V, ADB has extended the sixth and seventh lines of credit, and is currently considering the eighth. 1.2 Economic Background of East African Community 1.2.1 At the time LOC V was appraised in 1993, the EAC countries were undertaking economic reforms, which were implemented in the form of structural adjustment programmes (SAP). The LOC V implementation period, between 1996 and 1999, was a difficult one for both EADB and the sub-projects financed due to a number of factors, including unfavourable climatic conditions, the slowdown in economic growth, and general weakness of enabling environment and incentives to entrepreneurs. However, the reforms contributed to the liberalisation of the productive sectors, opening up of the financial markets to foreign competition, foreign exchange liberalisation, consumer price deregulation, and generally enhanced private sector involvement in the economy. 1.2.2 The performance of the member states has registered improvement over the years in the main economic sectors. Although Kenya is the strongest economy among the EAC countries, its GDP growth rate has been slow, whereas Tanzania has shown relatively strong growth. Uganda has combined strong growth with low inflation and has the most open

2
economy in the region. The manufacturing sector is growing steadily, much faster than the overall GDP growth rate (detailed information and data on economic and financial sectors are presented in Annexes 1 and 2). Overall, the broad macro-economic policy has been good. 1.2.3 The EAC, which hitherto was not effective, has recently been revitalised with the leaders showing greater commitment to support development. The key issues, especially for private sector and industrial development, include creating enabling environment for both foreign and domestic investments, and providing basic infrastructure. EAC developed in 2005 a five-year development strategy that plans to recapitalize EADB for implementing poverty reduction projects, set up an East African Development Fund, prepare the East African Power Master Plan and the Road Network Plan. 1.2.4 The EAC continues to implement the regional integration programme that proceeds in stages beginning with establishment of the Customs Union, followed by instituting a Common Market, Monetary Union, and, ultimately, Political Federation. Negotiation of Customs Union took four years while the regional investment code for the three countries has been under discussion. Recent data indicate that intra-EAC trade is substantial with Kenya being the largest exporter to the region and Uganda the largest importer. A lot of informal trade goes on within the EAC not captured in official statistics. 1.3 The EADB 1.3.1 The East African Development Bank (EADB) is a sub-regional development bank owned by the three member states of Kenya, Uganda and Tanzania. Other shareholders include the African Development Bank, FMO (Netherlands), DEG (Germany), Consortium of Yugoslav Institutions, SBIC-Africa Holdings, Commercial Bank of Africa, Nairobi, Norbanken AB, Stockholm, Standard Chartered Bank, London, and Barclays Bank International, London. EADB was established in 1967 under the Treaty of the then East African Cooperation. Following the break up of the Cooperation in 1977, EADB was re-established with its own charter in 1980. Under this charter, EADB’s role and mandate were reviewed and its operational scope expanded to offer a broad range of financial services in the member states with the overriding objective of strengthening socio-economic development and regional integration. EADB provides term credit to commercially run public and private sector enterprises. It also extends limited technical assistance to private sector SMEs. The revitalization of regional cooperation among the member states through the establishment of the new East African Community (EAC) has accorded EADB the opportunity of playing a catalytic role in regional integration. 1.3.2 EADB was restructured early 2003 on the basis of a study carried out by Washington Advisory Group of the World Bank. Before the restructuring, EADB activities, including appraisal and monitoring, were concentrated at the head office in Uganda, while country offices in the other member states, manned with skeletal staff, served a representation function. Following the restructuring, full decentralization was effected and each country office made responsible for the entire project cycle ‘from cradle to grave’ i.e., from project identification to completion, while the review processes and approval are carried out from headquarters.
3
1.3.3 EADB has depended significantly on ADB’s lines of credit. Other sources include NDF of the Nordic countries, EXIM Bank of India, OPEC Fund, and SIDA of Sweden. Since 2003, EADB has a memorandum of understanding with DBSA regarding technical assistance support. DBSA has also extended LOC to EADB and engaged in co-financing with it. The China Development Bank and Japan Bilateral sources also provide financial assistance. EADB has issued nine (9) corporate bonds in the member countries to raise resources in local currencies over the years. 2. THE EVALUATION 2.1 Evaluation Methodology and Approach 2.1.1 The purpose of this evaluation is to assess the performance of LOC V extended to EADB based on the standard evaluation benchmarks of relevance, efficacy, efficiency, institutional development impact and sustainability of outcomes. This evaluation has also a higher objective of assessing the instrument’s effectiveness as ADB’s wholesale lending channel to support private sector development in the sub-region. The review aims to provide indications regarding broad policy and strategy issues that influence interventions in the future. The evaluation lessons will serve as inputs to the review of Bank assistance to sub-regional finance institutions, scheduled for 2007. 2.1.2 The evaluation was made on the basis of desk reviews and field missions. The desk reviews on documents was supplemented by interviews with concerned staff members. PCR reports on earlier LOCs (III and IV) have been reviewed to assess the incorporation of lessons in LOC V. Questionnaires were developed and used for systematic collection of data and information on LOC V, EADB, and the sub-projects. The field trip enabled interaction with various stakeholders, including sub-project promoters. It also provided opportunities to exchange views with government officials regarding investment policies, especially those bearing on fostering enabling environment for private sector development. The site visits to private enterprises and other relevant organisations have facilitated in drawing lessons of experience on LOC V. It should also be noted that lack of ready access to sub-project files has compromised the evaluation scope in areas such as reviewing sample sub-projects’ business plans (to assess transparency in processing loan applications), and loan repayment files (to validate amount of sub-projects’ debt repayment). 2.1.3 The evaluation followed the standard benchmarks of relevance, effectiveness and efficiency, institutional development impact and sustainability of the outcomes. The situation with and without the LOC was also assessed. The evaluation also covered LOC V’s contribution towards meeting cross cutting objectives of poverty reduction, gender equity, environmental sustainability, private sector development and regional integration. The factors that affected the achievement of objectives and the sustainability of development outcomes were also assessed, as were the performances of EADB and ADB in relation to LOC V implementation. The performance of EADB and the sub-projects in the most recent years
4
was examined in general terms to assess sustainability issues and debt service capacity. 2.2 Key Performance Indicators 2.2.1 A few general indicators were provided for LOC V in the logical framework and
some are discussed in the appraisal report. The following indicators were considered for the LOC V: • New and existing SMEs to be financed, • Employment to be created, • Regional projects promoted, • Decline in credit arrears, • Improved profitability of EADB.
2.2.2 At the time of LOC V’s appraisal, it was expected that the economies of EADB member states would experience stability and growth and that the investment climate would be conducive to private sector investments, particularly SMEs. It was also assumed that inflation would be under control, export markets would be accessible, and credit facilities and industrial inputs (power, raw materials and fuel) would be adequately available. The assumptions and indicators were given in broad, general terms and without quantification. The lack of quantified indicators and the inadequate monitoring system has compromised this evaluation since it was not possible to capture the evolution of the various indicators and measure the outcomes and benefits of LOC V in full quantitative terms. 3. IMPLEMENTATION PERFORMANCE
3.1 Loan Effectiveness, Start-up and Implementation 3.1.1 ADB prepared and appraised LOC V in March and July 1993, respectively and approved it in August 1994. The approved amount at UA15million was lower than the EADB request and did not include a technical assistance or equity capital component. NDF financed the LOC financing gap and technical assistance in the same year, while ADB’s equity capital investment came only in 1999. The LOC was signed in May 1995 and became effective in September 1995, eleven months after approval. The delay in effectiveness was due to EADB taking longer than envisaged in meeting the condition prior to entry into force of the LOC. The condition related to up-dating EADB’s project appraisal manual to include guidelines for environmental impact assessment and gender issue analysis. 3.1.2 LOC V implementation was also impeded by time slippage. Commitments were slow at the beginning, as EADB was cautious in selecting projects when the economies of the EADB member states were just picking up. Also taking time was ensuring that selected projects were able to abide with the ADB’s procurement rules and investment ceiling of UA 8.0 million. Three sub-projects approved by ADB were cancelled due to various problems encountered by the sponsors, such as changes in project design and cost structures, technological problems, and inability to come up with promoters’ contributions. There were

5
also partial cancellations of the loans extended to two sub-projects, one because successful operation enabled the sub-project to generate its resource requirements internally, and the other due to scaling down of the project size. 3.1.3 EADB’s exposure to a single sub-project was set at a maximum of UA8 million and a minimum of UA200,000 -- with due regard given to equitable resource distribution among member states. The upper limit hinders EADB from supporting regional projects having investment requirements exceeding the set ceiling, while the lower limit restricts EADB on lending to the smaller SMEs. As a consequence, all LOC beneficiaries were either medium or large-scale enterprises. There is need to explore other channels to reach out small and micro-enterprises. 3.2 Disbursement and Financing Arrangements 3.2.1 LOC V disbursements incurred time slippages. The LOC was scheduled to be disbursed within three years from January 1995 to December 1997 – thus the initial deadline for last disbursement was fixed as 31 December 1997. In fact, the first disbursement was made in March 1996 and the last disbursement in August 1999, after extending the deadline twice, from December 1997 to December 1998, and then to December 1999. Adopting the rather cumbersome “reimbursement method of disbursement” contributed to delays in processing claims. The lesson learnt from the delays led to the adoption of the Special Account Method for subsequent LOCs, in which tranche transfers are used. Table 3.1 compares projected with actual disbursements.
Table 3.1: Disbursement of LOC V in million UA
Year Projected Actual 1995 5.00 1996 5.00 2,03 1997 5.00 2,91 1998 2,34 1999 7,75 Total 15.00 15.03
3.2.2 The LOC financing plan envisaged, at appraisal, that EADB would have its own internal resources (UA16.41 million), and mobilise additional resources from EXIM Bank of Japan (UA5 million), and other sources (UA18.97 million) in order to meet the term lending, equity participation and working capital requirements of the sub-projects. ADB contributed UA15.0 million, or 27% of EADB’s financial requirements of UA55 million for the five-year period 1993 – 1997. Significantly, ADB contribution was catalytic in attracting other donors to provide the financing gap. Thus, EADB succeeded in mobilising resources, including LOCs and other instruments, from different sources, such as NDF (UA5.6 million), Eximbank of Japan (UA5 million), FMO (US$10 million) and DEG (EUR14 million). EADB also generated funds from its own operations and successfully launched three local currency bond issues in the Kenyan market (US$ 10 million equivalent in 1997, and another US$ 20
6
million in 1999), and in the Ugandan market (US$ 10 million equivalent in 1997). The bond issues in the member states availed much-needed local resources for investment. 3.3 Supervision, Reporting, Monitoring and Evaluation
EADB delayed in submitting progress reports on LOC V. The supervision and monitoring system at EADB were inadequate to capture information and data on sub-projects, thus hindering assessment of sub-projects’ outcomes, and LOC V’s overall effectiveness. ADB involvement was not consequential either, since it only undertook two supervision missions during LOC V implementation, with limited results in finding remedies to implementation problems. In recent years, the monitoring function in the ADB and EADB has improved; still, it bears emphasizing that EADB requires enhanced monitoring systems to capture the financial and developmental outcomes of sub-projects. 4. PERFORMANCE EVALUATION AND RATINGS 4.1 Relevance of the LOC and Quality at Entry 4.1.1 ADB’s financial intermediation through LOCs was carried out in accordance with the policy document (Ref. ADB/AD/81/140) issued in 1981 that was later incorporated in the Industrial Sector Policy Guidelines of 1986 and which mainly addressed issues on Line of Credit to and Equity Financing of DFIs at national and sub-regional levels. The evolution of the policies and strategies relating to financial intermediation in RMCs is presented in Annex 3. When LOC V was extended, the Bank’s lending strategy in EADB member states largely emphasized assistance to the productive sectors and infrastructure to promote economic development. Consistent with this strategy, the Bank had participated two times in EADB’s equity and extended five LOCs over the years. The previous four LOCs had responded to help meet the foreign currency required for term lending that support investments for development. PCRs and PPERs were prepared for these LOCs though the lessons drawn were not fully considered in LOC V’s design. (The lessons drawn in the third and fourth LOCs are presented in Annex 4.) The main lessons included in designing LOC V are those on restricting operations to private sector projects, and those on addressing environmental considerations. The other lessons, such as the need for improving EADB capacity to rigorously prepare and appraise sub-projects on the basis of risk analysis; the problems of indigenous sub-projects; the paucity of infrastructure; and the lack of adequate monitoring system were not addressed in the design of LOC V, thus compromising the quality at entry. The retrospective logical framework is presented in Annex 5. 4.1.2 LOC V was made in line with the Bank’s and EADB’s objective of supporting the development of the private sector, in general and SMEs, in particular, to which ADB’s direct lending would not be effective. LOC V is relevant because it is based on ADB’s lending strategy and is consistent with member states’ policies of promoting development and integration. This LOC assumes particular relevance as it was extended at a time when EADB needed it to come out of its financial crises. ADB’s bold decision and firm conditions to bail
7
out EADB contributed, together with NDF’s technical assistance, to turnaround the ailing EADB and strengthen its operations and financial position. ADB also played an effective catalytic role in drawing other financiers to EADB. 4.2 Achievements of Objectives and Outputs (“Efficacy”) Policy Goals and Objectives 4.2.1 LOC objectives conform to the overall policy goal of supporting economic development while also promoting regional integration and poverty reduction in EADB member states. LOC V’s main objective was promoting small and medium scale enterprises (SMEs) in the private sector and strengthening regional cooperation. But since no specific quantitative targets were set at appraisal, the comparison between the situation at appraisal and this evaluation is made mainly qualitatively. 4.2.2 All LOC sub-projects are private sector operations. Generally, the ADB extends LOCs only after appraising the financial intermediary -- in this case EADB -- and reviewing the potential list of sub-projects. If the exercise is positive, the general assumption is that the sub-projects would be implemented and their performance sustained in order to meet the LOC’s overall objectives. At EADB, each sub-project was appraised and both the financial and economic rates of return calculated. Disbursement requests were sent to ADB against the appraised sub-projects. Thus, all LOC V sub-projects were expected to have high financial and economic rate of return (over 20% and, in some cases, over 30%), generate new employment, and save or earn foreign exchange -- key performance indicators at sub-project level. 4.2.3 LOC V was extended at a time when major economic reforms were taking place in the member states and EADB was restructuring to improve its performance and governance. This evaluation found that the LOC has achieved the main objective of providing foreign currency resources to support private sector sub-projects that succeeded in earning/saving foreign exchange. However, the sub-projects’ full success was impeded by several factors such as the lack of adequate infrastructure that made sub-projects’ products more expensive than competing imports, inadequate working capital, lack of entrepreneurship, unfavourable weather conditions in the case of floriculture sub-projects. In general, LOC V’s achievement of objectives was unsatisfactory. The individual component’s assessment of the efficacy benchmark is covered below. Outputs 4.2.4 The 19 sub-projects (20 sub-loans) financed by EADB in the three member states were private sector operations, including some privatised ones. The status of the sub-projects financed under LOC V is summarised in Annex 6. Four of the sub-projects had regional impact in terms of exporting their products to and/or sourcing their raw materials from regional countries, twelve earned foreign exchange, and five engaged in import substituting manufacturing. The full LOC amount of UA 15 million was disbursed among the member states, with Kenya, Tanzania, and Uganda accounting for 39%, 38%, and 23%, respectively.
8
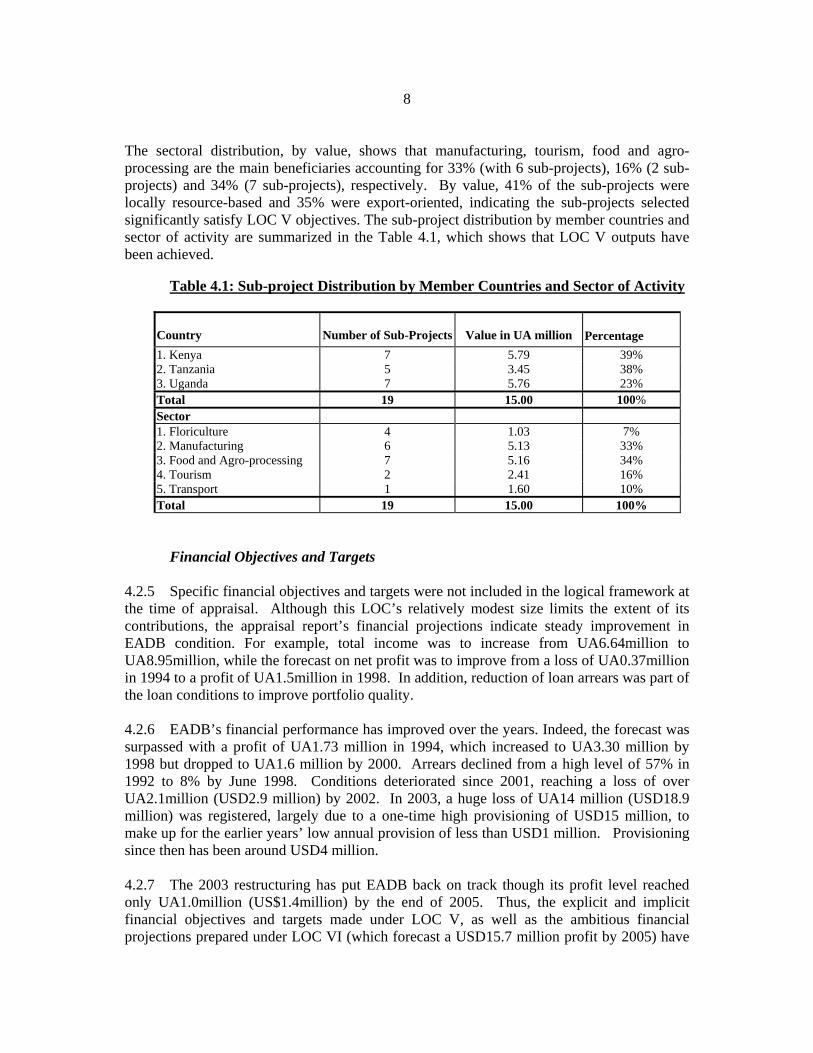
The sectoral distribution, by value, shows that manufacturing, tourism, food and agro-processing are the main beneficiaries accounting for 33% (with 6 sub-projects), 16% (2 sub-projects) and 34% (7 sub-projects), respectively. By value, 41% of the sub-projects were locally resource-based and 35% were export-oriented, indicating the sub-projects selected significantly satisfy LOC V objectives. The sub-project distribution by member countries and sector of activity are summarized in the Table 4.1, which shows that LOC V outputs have been achieved. Table 4.1: Sub-project Distribution by Member Countries and Sector of Activity
Country
Number of Sub-Projects
Value in UA million Percentage
1. Kenya 7 5.79 39% 2. Tanzania 5 3.45 38% 3. Uganda 7 5.76 23% Total 19 15.00 100% Sector 1. Floriculture 4 1.03 7% 2. Manufacturing 6 5.13 33% 3. Food and Agro-processing 7 5.16 34% 4. Tourism 2 2.41 16% 5. Transport 1 1.60 10% Total 19 15.00 100%
Financial Objectives and Targets 4.2.5 Specific financial objectives and targets were not included in the logical framework at the time of appraisal. Although this LOC’s relatively modest size limits the extent of its contributions, the appraisal report’s financial projections indicate steady improvement in EADB condition. For example, total income was to increase from UA6.64million to UA8.95million, while the forecast on net profit was to improve from a loss of UA0.37million in 1994 to a profit of UA1.5million in 1998. In addition, reduction of loan arrears was part of the loan conditions to improve portfolio quality. 4.2.6 EADB’s financial performance has improved over the years. Indeed, the forecast was surpassed with a profit of UA1.73 million in 1994, which increased to UA3.30 million by 1998 but dropped to UA1.6 million by 2000. Arrears declined from a high level of 57% in 1992 to 8% by June 1998. Conditions deteriorated since 2001, reaching a loss of over UA2.1million (USD2.9 million) by 2002. In 2003, a huge loss of UA14 million (USD18.9 million) was registered, largely due to a one-time high provisioning of USD15 million, to make up for the earlier years’ low annual provision of less than USD1 million. Provisioning since then has been around USD4 million. 4.2.7 The 2003 restructuring has put EADB back on track though its profit level reached only UA1.0million (US$1.4million) by the end of 2005. Thus, the explicit and implicit financial objectives and targets made under LOC V, as well as the ambitious financial projections prepared under LOC VI (which forecast a USD15.7 million profit by 2005) have
9
not been met even with additional injection of resources. At sub-project level, the projected financial performance and rates of return have not been achieved, or if achieved were not fully reported (details are covered under section 4.4).
Institutional Development Objectives 4.2.8 The logical framework did not include specific institutional development objectives. Still, NDF technical assistance provisions and LOC V loan conditions were instrumental for actions that were put in place to improve EADB’s governance and staff performance. These included actions for utilizing financial management expertise, updating the project appraisal manual, and preparing long-term operational strategy. The parallel NDF financing helped, among others, to expand EADB’s financial products. 4.2.9 The achievement of the institutional development objectives as presented in the retrospective logical framework is satisfactory. Indeed, it was EADB’s positive institutional performance in 1995 that influenced favourably the decision to extend LOC VI. Unfortunately the situation on the financial front was less reassuring, with declining financial performance resurfacing again in 2003, rendering further restructuring necessary. As noted earlier, the 2003 restructuring introduced a ‘cradle to grave’ decentralization concept, where each member state would have a country office that would be able to cover the complete project cycle activities. The aim of such decentralization is improving the operational function as a whole; the full benefits have, however, yet to be realized (details covered under section 4.5).
Social Objectives and Targets 4.2.10 The logical framework had included employment generation as a social objective though no specific targets were set for it. The successful sub-projects financed under LOC V have provided social benefits in the form of job creation, both directly or indirectly. The extent to which the new jobs are being sustained may be indicated by comparing the PCR estimates for job creation with those that existed at the time of this evaluation. 4.2.11 The PCR estimated that the operating sub-projects provided 4,600 direct jobs, of which women had about 30%. At the time of this evaluation, many sub-projects were not performing. Based on the available data, the total direct jobs created and sustained were about 2,000, of which women had a quarter. However, there have been significant indirect jobs created in the backward and forward businesses through supplying raw material to or buying the products from the sub-projects, although the share that can be attributed to this LOC is difficult to determine. Some anecdotal positive social benefits from the successful sub-projects include the following:
• A ceramic manufacturing sub-project gets 50% of its raw materials from the
local communities in the rural areas. A mining plant nearby supplies the balance. Significant indirect employment has been created as a result.
10
• A milk processing sub-project has provided indirect jobs to the local community (some 9000 farmers of which 4000 are women) who are also members of the cooperative society that sponsored the milk processing plant. These members also supply raw milk to the processing plant. Thus, this sub-project has provided sustained income to the rural community to improve their livelihood and send their children to school. At one time, due to governance issues, the members had stopped temporarily supplying the raw milk, which so adversely affected their income that some had to discontinue sending their children to school.
• A tourist lodge in Tanzania financed under the LOC has created opportunities for
the local community to produce artisan items for sale to tourists. Private businesses also provide fresh vegetables and fish to the lodge operators and the community at large.
4.2.12 Notwithstanding the positive outcomes of the few performing sub-projects, the social benefits have not been optimized as a result of the large number of non-performing sub-projects. For example, three of the floriculture sub-projects (that were expected to provide high employment opportunities to the communities in the semi-urban areas) did not succeed. Environmental Objectives 4.2.13 The logical framework did not include any environmental objectives and targets except mentioning in the appraisal report and in the loan conditions that EADB had to follow ADB’s environmental guidelines in appraising and monitoring the sub-projects. EADB has put in place guidelines for assessing sub-projects’ environmental impact in fulfilment of this LOC’s condition. The investment officers see to it the sub-projects are environmentally sound and sustainable during operations. Generally, the successful sub-projects comply with the respective countries’ environmental guidelines, which are in most cases similar to those of the ADB and EADB. A few illustrative observations are provided below:
• In a salt mining and processing plant, the government environmental and health
safety standards are well observed and audited periodically.
• A milk-processing sub-project has a wastewater pre-treatment plant at the factory premises, which is connected to the town's sewerage treatment system.
• A tourist lodge sub-project is located within the national park area where there is
strong government commitment to protecting the environment. For example, the road leading to the lodge is not asphalted to maintain the wild life’s natural habitat. Tourists or visitors are not allowed to come out of their cars so as not to disturb wild life movement. The net revenue from park entrance fees is reinvested to protect the environment and there is strict penalty on poachers; and rangers actively watch to protect the wildlife environment.

11
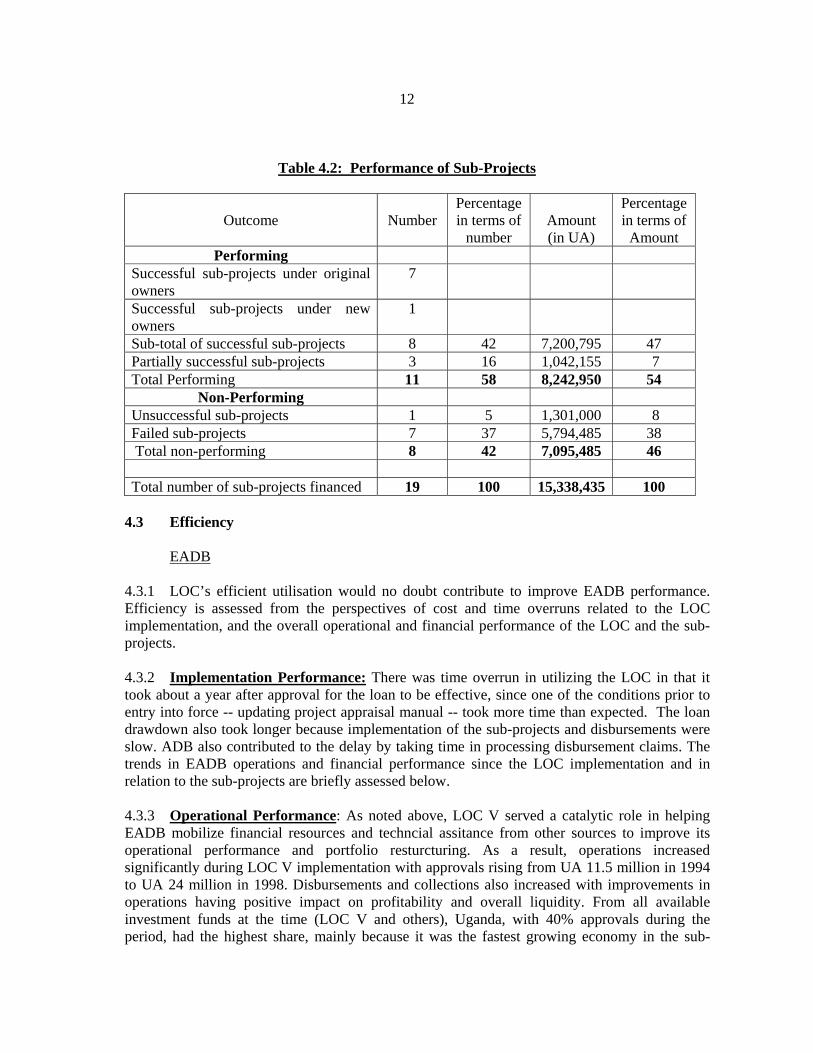
Financial and Private Sector Development Objectives and Targets 4.2.14 The logical framework matrix did not include specific objectives and indicators regarding the LOC’s contribution to financial and private sector development. LOC V was given at a time when EADB financial performance was at its lowest and other donors were reluctant to provide funds. In retrospect, LOC V has been a strong catalyst since other donors such as NDF, and OPEC Fund followed ADB to assist EADB. There is a memorandum of understanding with the Development Bank of Southern Africa (DBSA) since 2003 for credit line and technical assistance. Funds were also secured from China Development Bank and Japan bilateral sources. EADB was also able to raise local currency bond issues in the EAC member countries to augment its resources for on-lending. Thus, LOC V and subsequent ADB LOCs, together with funds from other sources, have contributed to increase investment resources to support private sector development. However, the small size of the LOC V and the poor performance of many sub-projects have limited the sustained contribution of this LOC towards meeting the financial and private sector development objectives. Regional Integration Objectives and Targets 4.2.15 The logical framework refers to regional cooperation being strengthened with LOC support to regional projects. Retrospectively, LOC V has some degree of regional impact due to intra-regional trade. Some of the promoters, who have businesses across the region, were therefore able to synergise markets for raw materials and finished products. The plastics, ceramics and salt mining and processing industries engage in intra-regional trade for their respective finished products. Sub-projects such as tourist lodges have supported employment opportunities at regional level through recruitment of experienced lodge managers from other regions. However, no regional sub-project involving two or more countries has been considered. Other than resources limitation of EADB, the may not be strong and sustained political will among member countries to jointly finance projects with regional scope. Outcomes 4.2.16 A review of the sub-projects shows that eight of them, accounting for 47% of the LOC amount, met the LOC objectives. Three of them, with 7% of the LOC value, were partially successful. One, with 8% share, was unsuccessful, while seven, accounting for 38% of the LOC, failed -- as summarized in Table 4.2 and detailed in Annex 6. The successful sub-projects have contributed positively to employment generation and foreign exchange savings or earnings. As stated above, there has also been forward and backward linkages in terms of raw material inputs and indirect labour employment. The full achievement of LOC outcomes was constrained by the non-performing or failed sub-projects whose operations were affected by several adverse factors stated above. Poor selection and risk analysis, as well as inadequate monitoring of the sub-projects had also contributed to limiting the LOC success rate. 4.2.17 Considering all the above, the high rate of non performing sub-projects in particular, the LOC’s overall achievement of objectives and outcomes (efficacy) is rated as unsatisfactory (Annex 7).
12
Table 4.2: Performance of Sub-Projects
Outcome
Number Percentage in terms of
number
Amount (in UA)
Percentage in terms of
Amount Performing
Successful sub-projects under original owners
7
Successful sub-projects under new owners
1
Sub-total of successful sub-projects 8 42 7,200,795 47 Partially successful sub-projects 3 16 1,042,155 7 Total Performing 11 58 8,242,950 54
Non-Performing Unsuccessful sub-projects 1 5 1,301,000 8 Failed sub-projects 7 37 5,794,485 38 Total non-performing 8 42 7,095,485 46 Total number of sub-projects financed 19 100 15,338,435 100
4.3 Efficiency
EADB
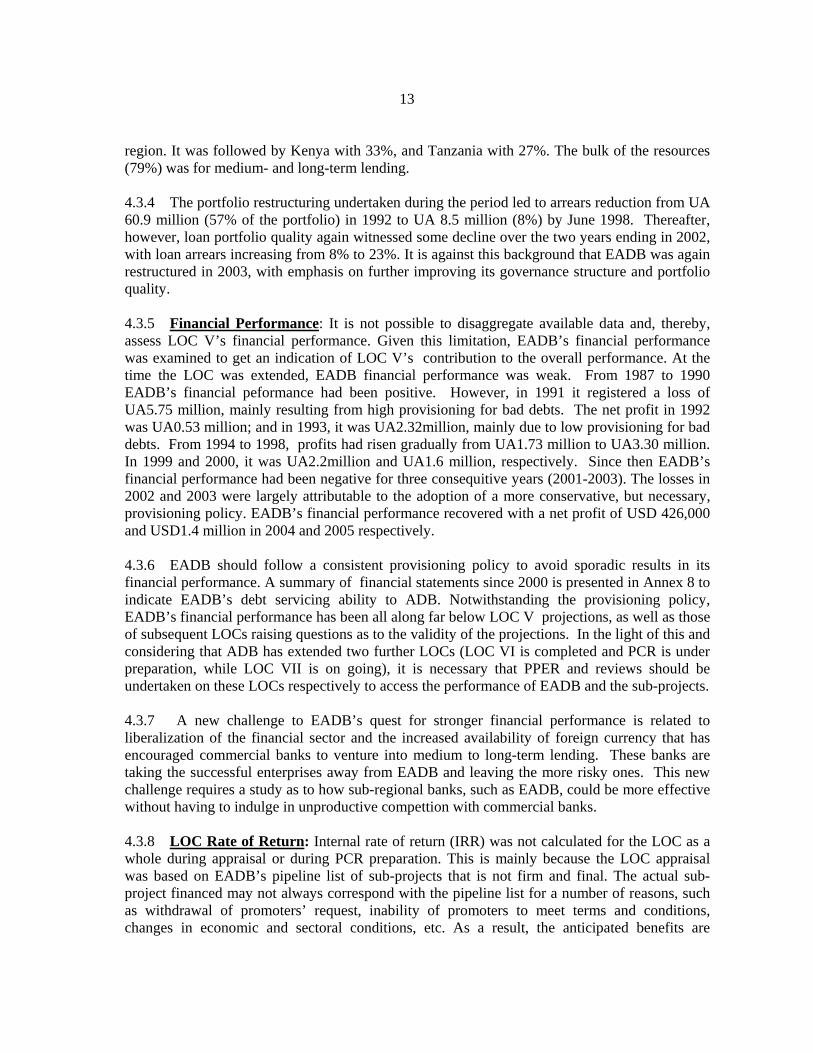
4.3.1 LOC’s efficient utilisation would no doubt contribute to improve EADB performance. Efficiency is assessed from the perspectives of cost and time overruns related to the LOC implementation, and the overall operational and financial performance of the LOC and the sub-projects. 4.3.2 Implementation Performance: There was time overrun in utilizing the LOC in that it took about a year after approval for the loan to be effective, since one of the conditions prior to entry into force -- updating project appraisal manual -- took more time than expected. The loan drawdown also took longer because implementation of the sub-projects and disbursements were slow. ADB also contributed to the delay by taking time in processing disbursement claims. The trends in EADB operations and financial performance since the LOC implementation and in relation to the sub-projects are briefly assessed below. 4.3.3 Operational Performance: As noted above, LOC V served a catalytic role in helping EADB mobilize financial resources and techncial assitance from other sources to improve its operational performance and portfolio resturcturing. As a result, operations increased significantly during LOC V implementation with approvals rising from UA 11.5 million in 1994 to UA 24 million in 1998. Disbursements and collections also increased with improvements in operations having positive impact on profitability and overall liquidity. From all available investment funds at the time (LOC V and others), Uganda, with 40% approvals during the period, had the highest share, mainly because it was the fastest growing economy in the sub-
13
region. It was followed by Kenya with 33%, and Tanzania with 27%. The bulk of the resources (79%) was for medium- and long-term lending. 4.3.4 The portfolio restructuring undertaken during the period led to arrears reduction from UA 60.9 million (57% of the portfolio) in 1992 to UA 8.5 million (8%) by June 1998. Thereafter, however, loan portfolio quality again witnessed some decline over the two years ending in 2002, with loan arrears increasing from 8% to 23%. It is against this background that EADB was again restructured in 2003, with emphasis on further improving its governance structure and portfolio quality. 4.3.5 Financial Performance: It is not possible to disaggregate available data and, thereby, assess LOC V’s financial performance. Given this limitation, EADB’s financial performance was examined to get an indication of LOC V’s contribution to the overall performance. At the time the LOC was extended, EADB financial performance was weak. From 1987 to 1990 EADB’s financial peformance had been positive. However, in 1991 it registered a loss of UA5.75 million, mainly resulting from high provisioning for bad debts. The net profit in 1992 was UA0.53 million; and in 1993, it was UA2.32million, mainly due to low provisioning for bad debts. From 1994 to 1998, profits had risen gradually from UA1.73 million to UA3.30 million. In 1999 and 2000, it was UA2.2million and UA1.6 million, respectively. Since then EADB’s financial performance had been negative for three consequitive years (2001-2003). The losses in 2002 and 2003 were largely attributable to the adoption of a more conservative, but necessary, provisioning policy. EADB’s financial performance recovered with a net profit of USD 426,000 and USD1.4 million in 2004 and 2005 respectively. 4.3.6 EADB should follow a consistent provisioning policy to avoid sporadic results in its financial performance. A summary of financial statements since 2000 is presented in Annex 8 to indicate EADB’s debt servicing ability to ADB. Notwithstanding the provisioning policy, EADB’s financial performance has been all along far below LOC V projections, as well as those of subsequent LOCs raising questions as to the validity of the projections. In the light of this and considering that ADB has extended two further LOCs (LOC VI is completed and PCR is under preparation, while LOC VII is on going), it is necessary that PPER and reviews should be undertaken on these LOCs respectively to access the performance of EADB and the sub-projects. 4.3.7 A new challenge to EADB’s quest for stronger financial performance is related to liberalization of the financial sector and the increased availability of foreign currency that has encouraged commercial banks to venture into medium to long-term lending. These banks are taking the successful enterprises away from EADB and leaving the more risky ones. This new challenge requires a study as to how sub-regional banks, such as EADB, could be more effective without having to indulge in unproductive compettion with commercial banks. 4.3.8 LOC Rate of Return: Internal rate of return (IRR) was not calculated for the LOC as a whole during appraisal or during PCR preparation. This is mainly because the LOC appraisal was based on EADB’s pipeline list of sub-projects that is not firm and final. The actual sub-project financed may not always correspond with the pipeline list for a number of reasons, such as withdrawal of promoters’ request, inability of promoters to meet terms and conditions, changes in economic and sectoral conditions, etc. As a result, the anticipated benefits are
14
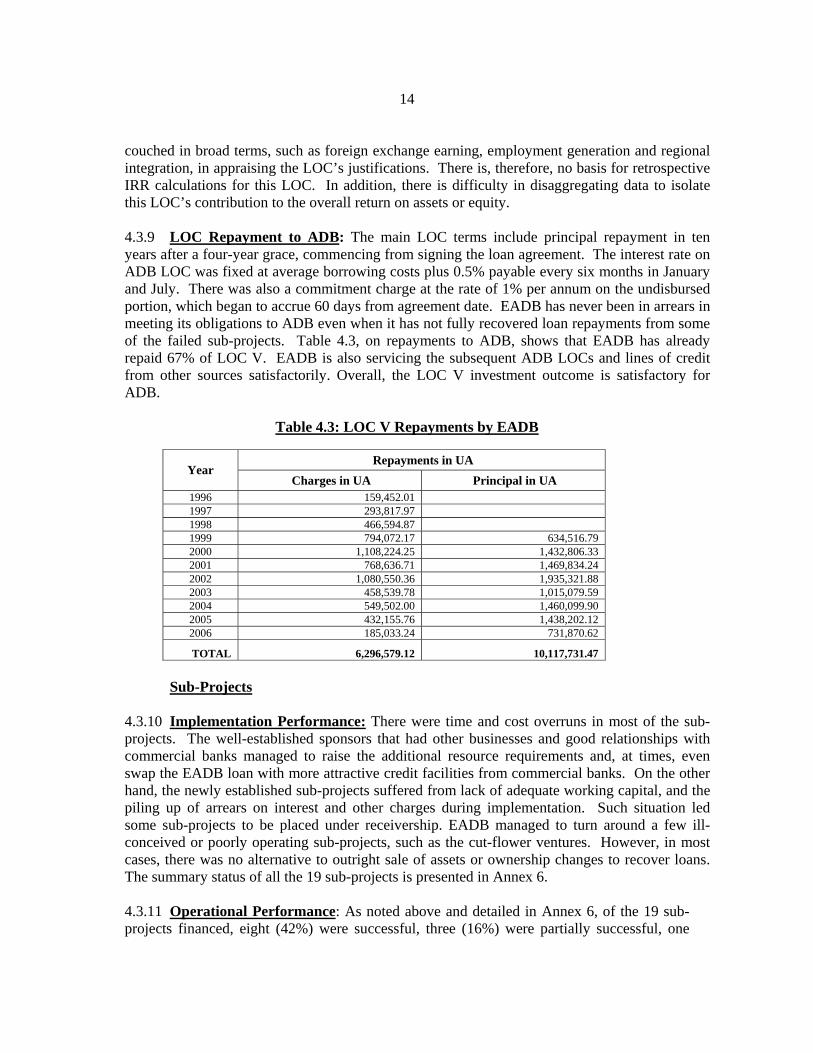
couched in broad terms, such as foreign exchange earning, employment generation and regional integration, in appraising the LOC’s justifications. There is, therefore, no basis for retrospective IRR calculations for this LOC. In addition, there is difficulty in disaggregating data to isolate this LOC’s contribution to the overall return on assets or equity. 4.3.9 LOC Repayment to ADB: The main LOC terms include principal repayment in ten years after a four-year grace, commencing from signing the loan agreement. The interest rate on ADB LOC was fixed at average borrowing costs plus 0.5% payable every six months in January and July. There was also a commitment charge at the rate of 1% per annum on the undisbursed portion, which began to accrue 60 days from agreement date. EADB has never been in arrears in meeting its obligations to ADB even when it has not fully recovered loan repayments from some of the failed sub-projects. Table 4.3, on repayments to ADB, shows that EADB has already repaid 67% of LOC V. EADB is also servicing the subsequent ADB LOCs and lines of credit from other sources satisfactorily. Overall, the LOC V investment outcome is satisfactory for ADB.
Table 4.3: LOC V Repayments by EADB
Repayments in UA
Year Charges in UA Principal in UA
1996 159,452.01 1997 293,817.97 1998 466,594.87 1999 794,072.17 634,516.79 2000 1,108,224.25 1,432,806.33 2001 768,636.71 1,469,834.24 2002 1,080,550.36 1,935,321.88 2003 458,539.78 1,015,079.59 2004 549,502.00 1,460,099.90 2005 432,155.76 1,438,202.12 2006 185,033.24 731,870.62
TOTAL 6,296,579.12 10,117,731.47 Sub-Projects 4.3.10 Implementation Performance: There were time and cost overruns in most of the sub-projects. The well-established sponsors that had other businesses and good relationships with commercial banks managed to raise the additional resource requirements and, at times, even swap the EADB loan with more attractive credit facilities from commercial banks. On the other hand, the newly established sub-projects suffered from lack of adequate working capital, and the piling up of arrears on interest and other charges during implementation. Such situation led some sub-projects to be placed under receivership. EADB managed to turn around a few ill- conceived or poorly operating sub-projects, such as the cut-flower ventures. However, in most cases, there was no alternative to outright sale of assets or ownership changes to recover loans. The summary status of all the 19 sub-projects is presented in Annex 6. 4.3.11 Operational Performance: As noted above and detailed in Annex 6, of the 19 sub-projects financed, eight (42%) were successful, three (16%) were partially successful, one
15
(5%) was unsuccessful, and seven (37%) failed. All the sub-projects were exempted from import duties on capital goods and enjoyed a higher rate of capital allowances in the first year of operation. Still, the overall enabling environment has not been conducive for new enterprises in particular. The poor infrastructure, lack of working capital, non-flexible lending terms and conditions had adversely affected their performance and contributed to their failure. 4.3.12 Financial Performance: Although EADB had calculated sub-projects’ internal rates of return (IRR) during appraisal, it did not put in place a mechanism to collect financial information and data needed to recalculate the retrospective IRRs. Some of the sub-projects visited during this evaluation, even when forthcoming about their operational performance, revealed little financial information. Financial data in EADB’s files for some of the sub-projects were insufficient to capture the cash flow streams needed to recalculate IRRs. Still, the limited available information was used as proxies to assess the financial performance of the sub-projects. This showed that none of the sub-projects met the profitability targets projected at appraisal (over 30% in most cases). However, from anecdotal findings, the successful sub-projects have performed well financially. 4.3.13 LOC performance as a whole is indirectly derived from the performance of the sub-projects, and EADB’s ability to recover its investment. The review showed that debt recovery from the sub-projects is mixed. Full debt recovery has been achieved from 52% of the sub-projects which represented about 59% of the LOC; 10% paid substantially, 16% paid partially, while 21% (which represented about 25% of the LOC amount) failed to pay, some being still under receivership. 4.3.14 Socio-economic Benefits: The socio-economic benefits of the successful sub-projects relate to foreign exchange saving or earning, employment generation, backward and forward linkages, regional integration in terms of export of finished products to and import of raw materials from within the sub-region, labour mobility, etc. It also includes export of finished products to countries outside the sub-region. In some cases, such as plastic products and cut flowers, the markets were outside the continent. While these benefits are significant, the overall conclusion is that they fall short because some 37% of the sub-projects (accounting for 38% of the LOC amount) failed. A few of the failed sub-projects were able to pay their debts through sale of assets or guaranteed property, such as land. As stated above, those that did not pay (21% of the sub-projects) made up 25% of the LOC amount. The three indigenous promoters who were engaged in floriculture ventures did not succeed. 4.3.15 The prevailing financial reporting practices of some successful sub-project promoters do not provide information bearing on capital build up for sustainability, as well as for determining the achievement of the development objectives, including meeting tax obligations. In spite of their sustained operations and high turnover, their financial accounts (when reported) show losses or minimal profits. The reason for persistent declaration of minimal profits or outright losses may be linked to avoiding or evading taxes. As a result, government tax revenues are diminished. It is for the tax authorities in the respective countries to review accounting practices of resident companies and realign company results for tax purposes.
16
4.3.16 Discussion with a sub-project’s management staff engaged in plastic products manufacturing (which has long cleared its debts), revealed that the enterprise earns on average an annual return of 22%; however, no audited account was released for verification. This sub-project caters to local and external markets, with 80% of the products exported within the region thus proving that it is a high foreign exchange earner. Another successful sub-project is engaged in ceramic manufacturing, an import substitution venture supplying local and regional markets. It has a strong backward linkage with local farmers providing 50% of the raw material (clay) while a local factory supplies the remaining 50%, thus providing significant indirect financial and other benefits. 4.3.17 The successful sub-projects (except one) are owned by non-indigenous promoters. There is no clear evidence if transfer of technology and skill to indigenous employees had been achieved. In the sub-projects visited, most of the management and supervisory positions are occupied by non-indigenous staff. The employees and the owners (shareholders) in one successful diary processing business are all indigenous. The milk processing plant is owned by a Farmers’ Cooperative (56%) and individual farmers (44%). 4.3.18 Overall Assessment of the LOC and the Sub-Projects: From the background and circumstances of the successful sub-projects, it can be deduced that the LOC instrument is more suitable to on-going stable medium- and large-scale enterprises, but less so for those being newly established. This is primarily because on going enterprises usually have the ability to respect loan terms and conditions from the start, and even to withstand implementation delays since such enterprises ordinarily have better financial liquidity than fresh starters. By contrast, any implementation delay could adversely affect new enterprises’ ability to repay accrued interest and the associated penalties, while the project is still under implementation. This risks the very viability of the new enterprise. 4.3.19 Considering the implementation problems and the high rate of non-performing sub-projects (42%), this LOC did not realize fully the expected financial, social and economic benefits. Thus, LOC V’s overall efficiency was rated unsatisfactory (Annex 7). 4.4 Institutional Development Impact 4.4.1 EADB had gone through a period of significant operational and managerial setbacks over the years caused mainly by inappropriate corporate governance. The problems led to deterioration in operational and financial conditions (portfolio quality declined with mounting loan arrears, while ability to mobilize additional resources was curtailed). The 1994 parallel financing from NDF included a technical assistance component to improve EADB performance. The assistance also helped introduce new product lines. While ADB did not include a technical assistance component in the LOC, the Bank had stipulated a number of conditions that required EADB to improve its institutional performance (such as enhancing staff productivity, utilising financial management services, updating the appraisal manual to enhance environmental safeguards and monitoring of sub-projects). ADB loan conditions and NDF’s institutional support assistance had encouraged EADB’s 1995 re-organization. Overall, LOC V has contributed positively to EADB’s institutional development. Thus, the overall institutional

17
development impact is rated satisfactory (Annex 7). However, sustainability is still a challenge as discussed below. 4.4.2 Institutional performance beyond the LOC V implementation period shows a mixed picture. The sixth LOC was extended when the appraisal in 1999 considered EADB’s 1995 restructuring successful. However, signs of deterioration were manifest in 2001/2002 leading, in 2003, to a comprehensive review of EADB’s structure and governance. As stated above, the new review introduced the concept of ‘cradle to grave’ whereby project officers cover the entire operational functions of the project cycle, from identification to completion. The previous structure had separated the appraisal and monitoring functions. Each country office was scaled up for the decentralized functions with a Chief Credit Officer position and a Risk Management Unit at headquarters that are entrusted to review proposals from country offices before submitting them to the Project Committee (PROCO) and the Board, as the case may be. The technical assistance component of ADB’s Support Project that was approved in December 2003 has helped to strengthen the institution’s management information system. A new set of internal procedures and processes were introduced to improve governance. Thus, part of the lessons drawn from LOC V has been applied to improve the design of LOC VI as deduced from the appraisal report. However, the monitoring and reporting functions still need strengthening so that EADB can obtain information and data from sub-projects to help it measure the development effectiveness of its investments. ADB needs to be actively engaged so that EADB sustains its good governance and improves its portfolio management. 4.5 Sustainability EADB 4.5.1 LOC V has served as a catalyst to help turn around the ailing EADB by inducing other financiers to provide funds. EADB thus was able to come out of the earlier problems with some improvement in its operational and financial performance. The full benefits of the latest reforms are yet to be realized. The trends shown in EADB financial statements for the last two years indicate improvements, when analysed in light of previous years’ performance. EADB was rated for the first time in 2002 and accorded B- by Fitch Investors Service, an International rating agency. Though the current rating is modest, it has nonetheless boosted EADB’s credibility as a financial institution. An important objective is to further strengthen EADB’s overall performance to attract successively better ratings. For this to happen, EADB’s good governance needs to be sustained. Also importantly, resource mobilization and capital increase issues will have to be effectively addressed so EADB can meet its mandate with good effect. Sub-Projects 4.5.2 The successful sub-projects have committed sponsors, sound management and financial base that enable them to sustain the benefits generated from their operations, such as employment, exports, import substitution, etc. There is, however, concern about the poor infrastructure, such as unreliable power and transportation networks, that adversely affect the performing sub-projects’ competitiveness and sustainability. Some promoters suggest that there should be incentives on electricity tariff through tax rebates to make up for using costly diesel
18
generators. Smaller enterprises have suffered more from electricity outages since they have no alternative supply. Thus, sustainability remains a concern even for the successful projects. A level-playing situation is called for to sustain the successful projects. 4.5.3 Considering the general enabling environment surrounding the sub-projects financed under the LOC and the rate of non-performing sub-projects (42%), the overall sustainability of LOC V is rated unsatisfactory (Annex 7).
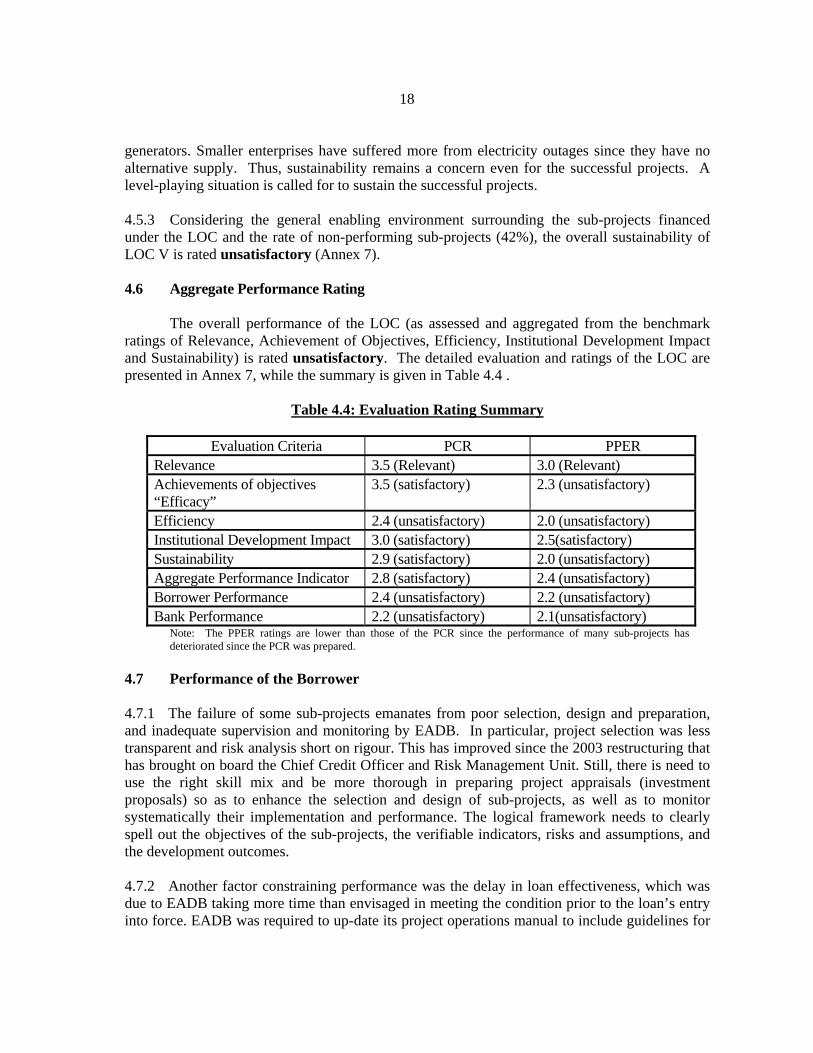
4.6 Aggregate Performance Rating The overall performance of the LOC (as assessed and aggregated from the benchmark ratings of Relevance, Achievement of Objectives, Efficiency, Institutional Development Impact and Sustainability) is rated unsatisfactory. The detailed evaluation and ratings of the LOC are presented in Annex 7, while the summary is given in Table 4.4 .
Table 4.4: Evaluation Rating Summary
Evaluation Criteria PCR PPER Relevance 3.5 (Relevant) 3.0 (Relevant) Achievements of objectives “Efficacy”
3.5 (satisfactory) 2.3 (unsatisfactory)
Efficiency 2.4 (unsatisfactory) 2.0 (unsatisfactory) Institutional Development Impact 3.0 (satisfactory) 2.5(satisfactory) Sustainability 2.9 (satisfactory) 2.0 (unsatisfactory) Aggregate Performance Indicator 2.8 (satisfactory) 2.4 (unsatisfactory) Borrower Performance 2.4 (unsatisfactory) 2.2 (unsatisfactory) Bank Performance 2.2 (unsatisfactory) 2.1(unsatisfactory)
Note: The PPER ratings are lower than those of the PCR since the performance of many sub-projects has deteriorated since the PCR was prepared.
4.7 Performance of the Borrower 4.7.1 The failure of some sub-projects emanates from poor selection, design and preparation, and inadequate supervision and monitoring by EADB. In particular, project selection was less transparent and risk analysis short on rigour. This has improved since the 2003 restructuring that has brought on board the Chief Credit Officer and Risk Management Unit. Still, there is need to use the right skill mix and be more thorough in preparing project appraisals (investment proposals) so as to enhance the selection and design of sub-projects, as well as to monitor systematically their implementation and performance. The logical framework needs to clearly spell out the objectives of the sub-projects, the verifiable indicators, risks and assumptions, and the development outcomes. 4.7.2 Another factor constraining performance was the delay in loan effectiveness, which was due to EADB taking more time than envisaged in meeting the condition prior to the loan’s entry into force. EADB was required to up-date its project operations manual to include guidelines for
19
environment impact assessment and gender issues analysis. EADB also delayed in submitting progress reports during LOC V. 4.7.3 There was a time overrun of about two years in completing LOC V, which led to extending two times the deadline for the last disbursement (from December 1997 to December 1998 and then to December 1999). Thus, EADB’s performance with respect to project selection, supervision and monitoring of the LOC V was unsatisfactory (Annex 7). 4.7.4 The 2003 restructuring has introduced a new set of procedures and processes to improve the performance on subsequent LOCs granted by the Bank and other donors. Institutionalising good governance is a key as lack of it had in the past contributed to the downturns in EADB’s performance. There is need to carry out evaluation to assess the impact of the changes on subsequent LOCs. 4.7.5 EADB is still considerably dependent on ADB’s assistance. A great challenge facing sub-regional banks, including EADB, is the necessity of diversifying the external and internal sources for resource mobilization to carry out their full mandate effectively. There is, therefore, a need for a large-scale review of sub-regional DFIs, such as EADB, to assess the adequacy of their resources, including the level of equity participation that should be forthcoming from member states. 4.8 Performance of the Bank
4.8.1 LOC V, together with NDF’s financial assistance, was a significant response to EADB’s resource requirements for financing investments in the sub-region. However, ADB contributed to time overrun of two years due to delayed disbursements and inadequate supervision. There is no evidence that ADB verified the sub-project selection process, other than accepting or rejecting the sub-project proposals sent for disbursements. The lessons from LOC III and IV were not considered fully in the design of the LOC V, thus compromising the quality at entry. During LOC’s five-year implementation period, the Bank only undertook two supervision missions. The ADB should have assisted EADB to manage LOCs operations more effectively. ADB’s overall performance as it relates to LOC V is rated unsatisfactory (Annex 7).
4.8.2 However, drawing lessons from LOC V, some improvement has been made in the design, implementation and monitoring of the subsequent LOCs. For example, LOC VI includes a technical assistance component; it applies the special account disbursement method to alleviate disbursement problems; and, regular supervision missions have taken place. Further improvement could be made through mid-term reviews, and instituting enhanced reporting system from EADB and sub-projects to facilitate self- and independent evaluations. ADB needs to also sample check EADB’s review processes of business plans in order to ensure that there is good governance and transparency in processing promoters’ loan applications. 4.9 Factors affecting Implementation Performance and Outcome 4.9.1 There are economic, social and institutional factors that affected LOC V’s overall implementation performance and outcomes. The two major factors for positive outcome are EADB’s access to foreign currency resources for on lending, and the unyielding commitment of
20
the successful sub-projects’ promoters. EADB’s restructuring in 2000 and 2003 contributed to improve the portfolio management and financial performance that justified continued support from ADB and other donors. However, the performance of the sub-projects deteriorated, with about 42% falling to non-performing status. 4.9.2 Several factors adversely affected both the performance of EADB and the sub-projects, and consequently the LOC outcomes. These factors are analysed in details in Annex 9 and the main ones are summarized below:
i.) Working Capital Requirement: The initial working capital requirement of sub-projects, particularly for new enterprises, is usually underestimated and securing it from commercial banks had been difficult for new starters. There is a need to include adequate start up working capital for new enterprises by firming up the co-financing plan through guaranteeing commercial banks, rather than leaving it to the new promoters to seek working capital financing on their own.
ii.) Project Preparation and Monitoring Function: The failure of some sub-projects under LOC V emanated from inadequate design and preparation, lack of project management experience on the part of promoters, as well as insufficient monitoring and supervision, both by EADB and ADB.
iii.) Legal Constraints to Debt Recovery: The absence of alternative means of arbitration or dispute resolution other than the regular courts unduly prolongs litigations and increases transaction costs for the financial institutions. Introduction of commercial courts could facilitate debt recovery. Donors should take up such issues with the respective EADB member states within the framework of supporting enabling environment and good governance.
iv.) Credit Reference Bureau: A major impediment to private sector development is the issue of assessing promotors’ creditworthiness in the absence of an alternative way of verifying information provided by the promoters themselves. It is noted that credit reference bureaus operate in other parts of the region, such as South Africa, and the company that provides the service is also operating from Kenya. The use of such services should be promoted in order to minimize defaults.
v.) Absence of Enabling Environment for SME Development: There is growing concern that DFIs are not catering to the investment needs of small enterprises. All the sub-projects financed under LOC V are medium- or large-scale enterprises. ADB needs to support an assessment study on how sub-regional development banks can forge with national DFIs to meet the needs of small and micro-enterprises.
vi.) Lack of Adequate Infrastructure: This problem is adversely affecting private sector development in general and small enterprises in particular since high production costs, ensuing significantly from excessive infrastructure overhead, render local product prices higher than those of imports. In the case of electricity, for example, small businesses suffer the most since they lack the financial capacity to go for alternative sources, such as generators. ADB needs to dialogue with member states on ways of improving the overall enabling environment, including investing in adequate infrastructure.
21
4.9.4 In general, the successful sub-projects have been able to withstand the effects of both internal and external shocks largely because of the diligence and imagination of promoters who had in place qualified managers that responded appropriately to evolving circumstances. The inverse is the case for the failed sub-projects. 5. CONCLUSION, LESSONS LEARNT AND RECOMMENDATIONS 5.1 Conclusion 5.1.1 LOC V was extended to EADB during the period of the structural adjustment programmes. The resultant economic liberalisation culminated in a high demand for project financing in the sub-region. This LOC, therefore, assisted EADB to meet part of this demand. 5.1.2 EADB’s earlier poor governance, the weak selection and design of the sub-projects, the inadequate enabling environment for private sector development, the lack of adequate equity and working capital, the significant number of non-performing sub-projects, have compromised the achievement of LOC V objectives and outcomes. The performing sub-projects (58%) financed under the LOC were medium- and large-scale enterprises, which have provided direct and indirect employment as well as foreign exchange earnings. EADB has managed to recoup a significant portion of its funds from the failed sub-projects. EADB has consistently respected its repayment obligations to ADB. 5.1.3 The enthusiasm to go for more new sub-projects (all the failed ones were new) did not bring fruit since such projects needed not only term loans but also much broader assistance encompassing working capital, entrepreneurship, infrastructure, marketing, etc. Future LOCs need to distinguish the needs of on-going concerns and new projects, particularly indigenous ones, to provide an appropriate and complete package of assistance. Although over the years, governments have improved the enabling environment for private sector development, there is a need for greater commitment and appropriate policies to cater to the needs of the private sector particularly the small and micro-enterprises. 5.2 Main Findings (Lessons) and Recommendations The main findings (lessons) and recommendations are as follows:
A. Good governance has been a key ingredient to improve EADB’s performance following the 2003 reforms, though sustainability is still a challenge. Also of concern is EADB’s lack of an adequate monitoring system that captures the developmental outcomes of sub-projects. In future interventions, ADB needs to assess critically that the corporate culture of DFIs have embraced good governance and best business practices. In addition, ADB needs to review that the monitoring and reporting system in place captures information and data on the development outcomes of the LOCs.
22
In the light of LOC V’s poor performance and given that the Bank has financed two further LOCs (VI and VII) consideration of any new interventions should be subject to preparation of project completion reports on both operations. B. LOC V’s major initial advantage was its low interest rate, relative to the then prevailing market conditions, which enabled EADB to pass on the funds at competitive rates. Over time, however, sub-projects promoters found the fixed rate burdensome in view of the significant changes in market interest rate structure following the liberalization policy of member states. Moreover, some sub-projects needed term credit in local currency. The application of variable interest rates in recent years is encouraging, and this should continue with efficient system to make timely adjustments resulting from changes in market rates. ADB should consider financing in local currency to DFIs (through co-financing with commercial banks or issuing guarantees) to raise local currency resources for on lending to SMEs. In addition, the possibility of swapping foreign currency and local currency loans should be explored to mitigate for exchange risks. C. Financial sector liberalization and the ensuing availability of foreign currency in the formal markets has encouraged commercial banks to venture into medium to long-term lending – a move that poses new competitive challenges to DFIs, such as EADB. On the other side of the scale, DFIs are not adequately structured and resourced to meet the needs of small and micro-enterprises. And while institutions, such as small enterprise development agencies and NGOs, can provide technical assistance to small and micro-enterprises, their operations are often hampered by financial limitations.
ADB should forge effective linkages with sub-regional DFIs, and for the latter to do the same with national level financial intermediaries to channel bulk financial resources for on lending to the different client segments. Sub-regional DFIs, such as EADB, may need to concentrate on higher-level services, including those with sub-regional scope.
ADB should forge partnership and establish appropriate linkages for providing funding to small enterprises development agencies and NGOs that can effectively assist in capacity development of micro and small enterprises, in areas such as business plan development, loan application procedures and processes, accounting practices, and financial reporting. In effect, there is a need for ADB to revisit its policies and strategies of financial intermediations through sub-regional and national DFIs to determine the respective niche for competitiveness, additionality and complementarity among the different players.
23
D. The great challenge facing DFIs like EADB are augmenting its capital base
regularly, improving its asset base steadily, and mobilising resources to meet its mandate sustainably. In the interest of EADB’s future, ADB needs to dialogue with member states to enhance their share capital in order to improve EADB’s creditworthiness and, thereby, strengthen its capacity to mobilize internal and external resources.
E. The upper limit set on sub-regional development banks, such as EADB, to finance a specific sub-project may have constrained EADB from taking up larger scale national and sub-regional projects. ADB may consider raising the existing upper limit to performing sub-regional DFIs to enable them to take up larger national-level individual projects and co-finance investments with a regional integration scope.
F. Financial reporting from some sub-projects is suspect. In spite of their sustained performance, financial accounts show deficits or very little profits. Such accounting practice does not allow for assessing the build up of capital for sustainability and defeats part of the development objectives related to meeting tax obligations.
As part of the governance issue, ADB needs to assist member states to have well functioning tax authorities and regulatory bodies to oversee the performance of the private sector. ADB’s future interventions should include conditions requiring EADB to ensure that sub-projects financed under its LOC submit audited financial accounts prepared based on accepted financial accounting principles and practices.
G. Lack of adequate infrastructure such as reliable power supply has been a set back in the development of private sector in general and small enterprises in particular.
ADB needs to dialogue effectively with member states to explore ways of improving the overall enabling environment including the sustained provision of basic infrastructure.
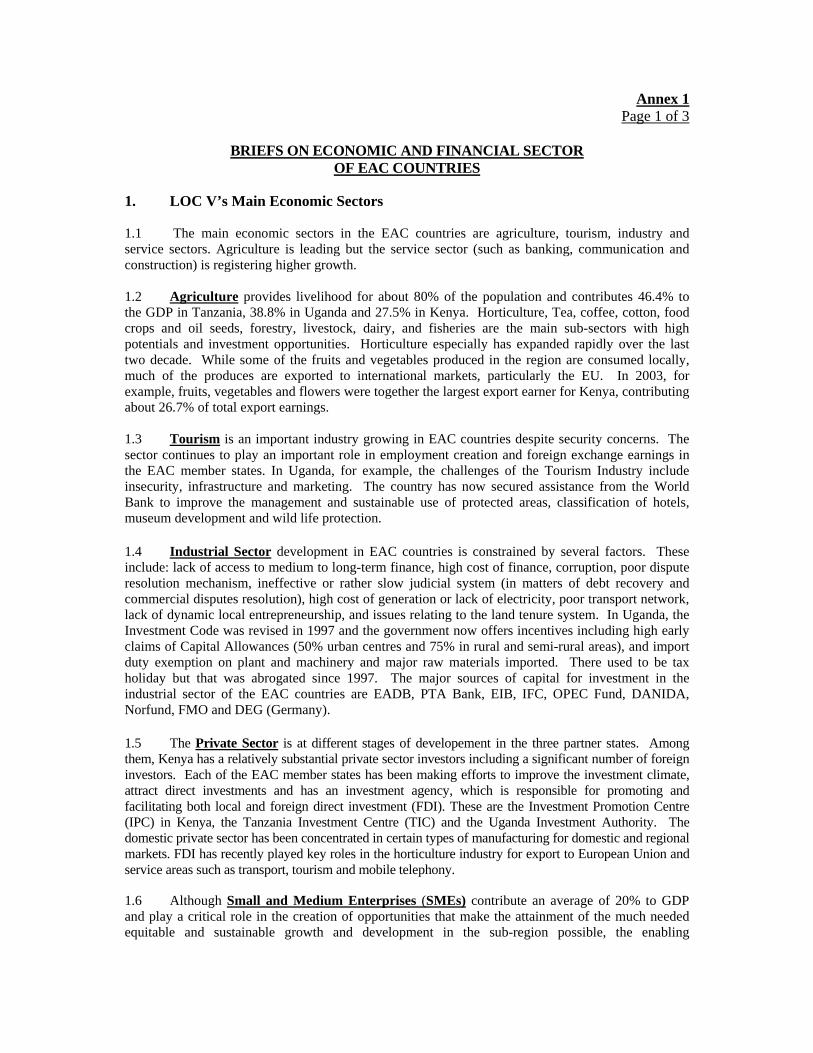
Annex 1 Page 1 of 3
BRIEFS ON ECONOMIC AND FINANCIAL SECTOR OF EAC COUNTRIES
1. LOC V’s Main Economic Sectors
1.1 The main economic sectors in the EAC countries are agriculture, tourism, industry and service sectors. Agriculture is leading but the service sector (such as banking, communication and construction) is registering higher growth. 1.2 Agriculture provides livelihood for about 80% of the population and contributes 46.4% to the GDP in Tanzania, 38.8% in Uganda and 27.5% in Kenya. Horticulture, Tea, coffee, cotton, food crops and oil seeds, forestry, livestock, dairy, and fisheries are the main sub-sectors with high potentials and investment opportunities. Horticulture especially has expanded rapidly over the last two decade. While some of the fruits and vegetables produced in the region are consumed locally, much of the produces are exported to international markets, particularly the EU. In 2003, for example, fruits, vegetables and flowers were together the largest export earner for Kenya, contributing about 26.7% of total export earnings. 1.3 Tourism is an important industry growing in EAC countries despite security concerns. The sector continues to play an important role in employment creation and foreign exchange earnings in the EAC member states. In Uganda, for example, the challenges of the Tourism Industry include insecurity, infrastructure and marketing. The country has now secured assistance from the World Bank to improve the management and sustainable use of protected areas, classification of hotels, museum development and wild life protection.
1.4 Industrial Sector development in EAC countries is constrained by several factors. These include: lack of access to medium to long-term finance, high cost of finance, corruption, poor dispute resolution mechanism, ineffective or rather slow judicial system (in matters of debt recovery and commercial disputes resolution), high cost of generation or lack of electricity, poor transport network, lack of dynamic local entrepreneurship, and issues relating to the land tenure system. In Uganda, the Investment Code was revised in 1997 and the government now offers incentives including high early claims of Capital Allowances (50% urban centres and 75% in rural and semi-rural areas), and import duty exemption on plant and machinery and major raw materials imported. There used to be tax holiday but that was abrogated since 1997. The major sources of capital for investment in the industrial sector of the EAC countries are EADB, PTA Bank, EIB, IFC, OPEC Fund, DANIDA, Norfund, FMO and DEG (Germany).
1.5 The Private Sector is at different stages of developement in the three partner states. Among them, Kenya has a relatively substantial private sector investors including a significant number of foreign investors. Each of the EAC member states has been making efforts to improve the investment climate, attract direct investments and has an investment agency, which is responsible for promoting and facilitating both local and foreign direct investment (FDI). These are the Investment Promotion Centre (IPC) in Kenya, the Tanzania Investment Centre (TIC) and the Uganda Investment Authority. The domestic private sector has been concentrated in certain types of manufacturing for domestic and regional markets. FDI has recently played key roles in the horticulture industry for export to European Union and service areas such as transport, tourism and mobile telephony.
1.6 Although Small and Medium Enterprises (SMEs) contribute an average of 20% to GDP and play a critical role in the creation of opportunities that make the attainment of the much needed equitable and sustainable growth and development in the sub-region possible, the enabling

Annex 1 Page 2 of 3
environment for their development remains inadequate. Most SMEs in the sub-region are facing a number of constraints, which affect their development. These include inadequate legal and regulatory framework, insufficient business development services as well as lack of necessary financial resources for term credit and initial working capital. Most financial institutions are averse to giving credit to SMEs in particular to indigenous ones due high-perceived risks. To address some of the above-mentioned issues there is need to develop appropriate policies to assist the SMEs. Governments need to provide a wide range of incentives to promote private sector development. In particular, there needs to be clear policy direction to help the development of indigenous entrepreneurs and design appropriate funding instruments to meet their unique requirements. 2. The Financial Sector 2.1 The financial sector in each of the EAC member states consist of a central bank, commercial banks, non-bank financial institutions, mortgage companies, insurance companies, development finance institutions, building societies, foreign exchange bureaux and microfinance institutions. However, the ccommercial banks have continued to dominate the financial sector in the sub-region. 2.2 The challenges of the financial sector in EAC are many including narrow investor base, unpredictable interest rate regime, regulatory issues, underdevelopment of the capital markets and restriction in the use of bond raised to the country of origin. However, there are opportunities to raise bonds from local banks other than from the public sector. Member countries of the EADB have engaged at different times in the reforms of the financial sector. The financial product coverage in the sub-region remains limited with domestic credit provided by the banking sector representing only about 10% of GDP in Tanzania and Uganda but 46% in Kenya. The problems with the sector are the high incidence of non-performing loans, low level of monetisation, low domestic savings, weak corporate governance, and the absence of credit reference bureau. 2.3 The EAC member states have functional capital markets. The East African Securities and Regulatory Authorities (EASRA), which encompasses the capital market regulatory agencies and stock exchanges in the sub-region, is the forum for ensuring cooperation while the stock exchanges and stockbrokers form the East African Securities Exchange Association (EASEA) and East African Stockbrokers Association (EASBA). There are too few listed companies (due to stringent qualification rules), small average company sizes, low liquidity levels (the value of shares traded in relation to total market capitalization) and the pool of liquid capital being too small to enable most firms to secure backing for investment schemes. Thus, the capital market is rather shallow to meet the growing demand for medium to long term financing in the sub-region. 2.4 The few traditional DFIs in the EAC member countries provide term credit to SMEs. However, most are not performing and many have moved into commercial banking services. For example, the Development Finance Co. Uganda (DFCU) is the only national financial intermediary (excluding micro-finance institutions) to provide term loan at national level to SMEs. DFCU also provides assistance to micro-finance institutions for on lending to small enterprises. The Uganda Development Bank, the public sector bank, is currently dormant. 2.5 In view of the above, commercial banks have continued to dominate the financial sector in the sub-region. In recent years, these banks are providing long-term credit facilities to well-performing private enterprises thus competing with EADB. However, the needs of small and micro-enterprises largely remain unmet.

Annex 1 Page 3 of 3
2.6 In the EADB member states, a few micro-finance institutions provide also banking services such as collecting deposits. However, these institutions are not well funded to meet the financial needs of the indigenous small enterprises. For example, the management of one of these institutions in Uganda (the Uganda Micro-finance Ltd.) intimated that, for a population of 25 million, commercial banks have 1 million individual accounts; credit associations have 80,000 clients; micro-finance institutions have 450,000 clients, giving about 1.5 million. The estimated number of bankable people in Uganda is 12 million. It follows that, only 10-12% of the population is getting access to banking services. EADB’s lower lending limit is US$200,000, while its upper limit is US$10 million for a single sub-project. The average loan to sub-project financed under LOC V was about US$700,000. Thus, its assistance went largely for medium and large enterprises. This indicates that EADB is not equipped to cater to the needs of micro and small enterprises whose capital requirements are below US$200,000 and which require technical assistance. 2.7 EADB has been extending limited resources to institutions such as Small Industry Development Organization (SIDO) of Tanzania that provide technical assistance to small and micro-enterprises. However, due to funding limitation, EADB was not providing such assistance on a sustainable basis. It can therefore be deduced that the needs of small enterprises have not been addressed adequately thereby constraining their development. According to the views of an official of DFCU, the sub-regional DFIs such as EADB and PTA Bank are not structured and financed to reach the typical small enterprises. 2.8 In recent years, there have been positive developments at the EADB’s governance and portfolio management functions but sustainability is still a big challenge due to inadequate resources at its disposal. For the foreseeable years, the external donors’ assistance to sub-regional banks such as EADB may have to continue. 2.9 Thus, the continued lack of term financing in the sub-region reveals that multilateral DFIs need to enhance their partnership with the sub-regional DFIs channel resources for private sector development in the sub-region. What is required is to package the instruments appropriately and adequately by type of clients and target group (such as those SMEs, which are on-going concerns, and those, which are new enterprises that also require technical assistance and permanent working capital). Further financial packaging is also required for the very small and micro-enterprises so that the financial products of ADB address the sub-projects needs. ‘One fits all’ approach needs to cease in the provision of future LOCs. Different types of financial products including the terms and conditions will have to be explored and applied to meet the needs of smaller enterprises in order to meet poverty reduction objectives. 2.10 It follows that, both ADB and the sub-regional development banks need to revisit their policies and strategies to forge alliance with national development banks and micro-finance institutions as well as support institutions. This will enable the respective partner to meet the term credit and working capital needs of the private sector enterprises in general and small and micro-enterprises in particular. In addition, there needs to be appropriate linkages with commercial banks to raise working capital requirements for new indigenous enterprises through guarantee schemes. Effective linkages among financial intermediaries could enhance comparative advantages of the different financial and non-financial institutions and reduce the associated transaction costs in meeting their respective mandates. ADB further needs to have sustained dialogue with governments of EAC member states for clear policy directions in order to accelerate the development of the private sector particularly micro and small -scale enterprises in the region as a whole.
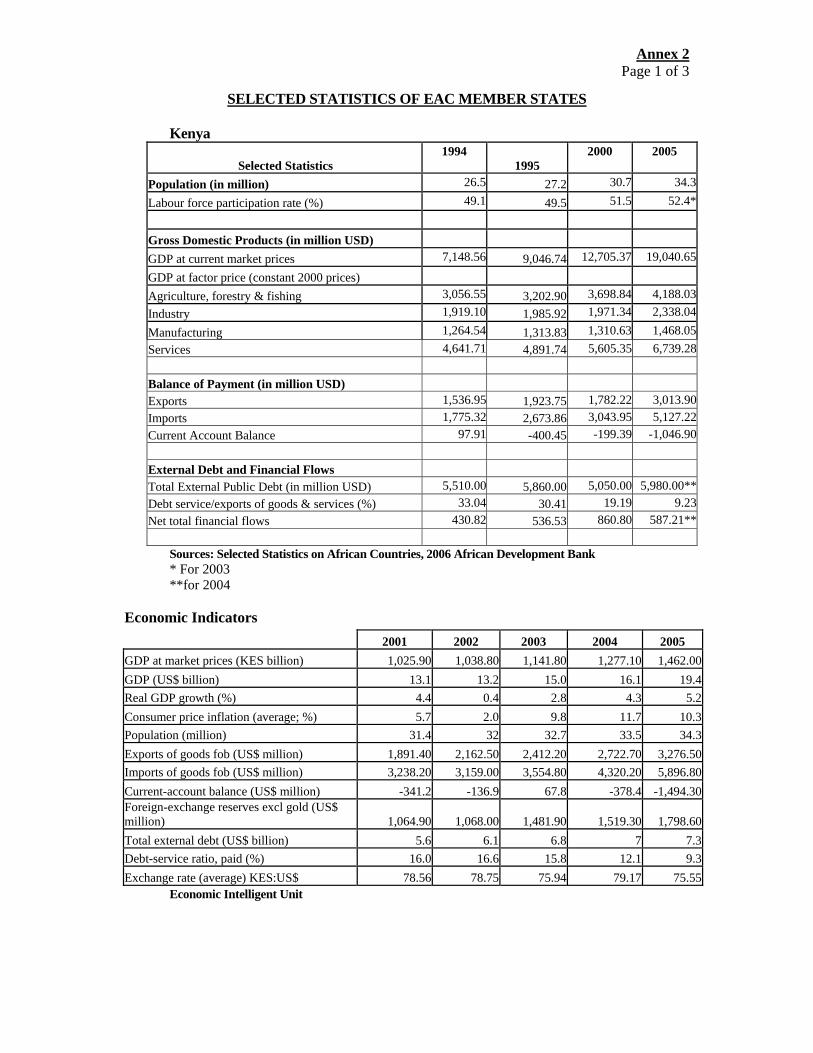
Annex 2 Page 1 of 3
SELECTED STATISTICS OF EAC MEMBER STATES Kenya
Selected Statistics
1994 1995
2000 2005
Population (in million) 26.5 27.2 30.7 34.3
Labour force participation rate (%) 49.1 49.5 51.5 52.4*
Gross Domestic Products (in million USD) GDP at current market prices 7,148.56 9,046.74 12,705.37 19,040.65
GDP at factor price (constant 2000 prices) Agriculture, forestry & fishing 3,056.55 3,202.90 3,698.84 4,188.03Industry 1,919.10 1,985.92 1,971.34 2,338.04
Manufacturing 1,264.54 1,313.83 1,310.63 1,468.05Services 4,641.71 4,891.74 5,605.35 6,739.28 Balance of Payment (in million USD) Exports 1,536.95 1,923.75 1,782.22 3,013.90Imports 1,775.32 2,673.86 3,043.95 5,127.22Current Account Balance 97.91 -400.45 -199.39 -1,046.90 External Debt and Financial Flows Total External Public Debt (in million USD) 5,510.00 5,860.00 5,050.00 5,980.00**Debt service/exports of goods & services (%) 33.04 30.41 19.19 9.23Net total financial flows 430.82 536.53 860.80 587.21**
Sources: Selected Statistics on African Countries, 2006 African Development Bank * For 2003 **for 2004
Economic Indicators 2001 2002 2003 2004 2005 GDP at market prices (KES billion) 1,025.90 1,038.80 1,141.80 1,277.10 1,462.00GDP (US$ billion) 13.1 13.2 15.0 16.1 19.4Real GDP growth (%) 4.4 0.4 2.8 4.3 5.2Consumer price inflation (average; %) 5.7 2.0 9.8 11.7 10.3Population (million) 31.4 32 32.7 33.5 34.3Exports of goods fob (US$ million) 1,891.40 2,162.50 2,412.20 2,722.70 3,276.50Imports of goods fob (US$ million) 3,238.20 3,159.00 3,554.80 4,320.20 5,896.80Current-account balance (US$ million) -341.2 -136.9 67.8 -378.4 -1,494.30Foreign-exchange reserves excl gold (US$ million) 1,064.90 1,068.00 1,481.90 1,519.30 1,798.60Total external debt (US$ billion) 5.6 6.1 6.8 7 7.3Debt-service ratio, paid (%) 16.0 16.6 15.8 12.1 9.3Exchange rate (average) KES:US$ 78.56 78.75 75.94 79.17 75.55 Economic Intelligent Unit

Annex 2 Page 2 of 3
Tanzania
Selected Statistics
1994 1995
2000
2005
Population (in million) 30.0 30.9 36.8 38.3
Labour force participation rate (%) 51.0 51.0 50.8 51.2*
Gross Domestic Products (in million USD) GDP at current market prices 4,510.85 5,255.22 9.080.83 12,206.78
GDP at factor price (constant 2000 prices) Agriculture, forestry & fishing 3,055.19 3,233.47 3,774.52 4,836.55Industry 946.87 928..69 1,318,52 2,034.51
Manufacturing 475.89 483.63 624.34 901.48Services 2,576.74 2,651.17 3,285.66 4,469.08 Balance of Payment (in million USD) Exports 519.40 682.54 663.30 1,456.42Imports 1,309.31 1,340.00 1,367.60 2,573,85Current Account Balance -710.94 -646.27 -498.60 0.0 External Debt and Financial Flows Total External Public Debt (in million USD) 6,140.00 6,220.00 5,730.00 6,230.00**Debt service/exports of goods & services (%) 21.46 21.04 12.67 13.22**Net total financial flows 965.67 880.76 1,176.31 1,749.78**
Sources: Selected Statistics on African Countries, 2006 African Development Bank * For 2003 **for 2004 Economic Indicators
2001 2002 2003 2004 2005
GDP at market prices (TZS billion) 8,274.10 9,445.90 10,692.40 10,090.30 11,264.00
GDP (US$ billion) 9.4 9.8 10.3 9.3 10Real GDP growth (%) 6.2 7.2 7.1 6.7 6.8
Consumer price inflation (average; %) 5.1 1 3.5 4.1 4.2Population (million) 34.4 35.2 35.9 36.7 37.4
Exports of goods fob (US$ million) 811.7 911.6 1,156.60 1,278.10 1,595.70Imports of goods fob (US$ million) 1,631.40 1,526.50 1,980.40 2,184.10 2,378.70
Current-account balance (US$ million) -456.6 -216.9 -393.4 -437.1 -479.5Foreign-exchange reserves excl gold (US$ million) 1,156.60 1,528.80 2,038.40 2,295.70 2,048.80
Total external debt (US$ billion) 6.8 7.3 7.5 7.9 7.7Debt-service ratio, paid (%) 9.7 6.6 4.7 6.6 6.6Exchange rate (average) TZS:US$ 876.4 966.6 1,038.40 1,089.30 1,128.90 Economic Intelligent Unit
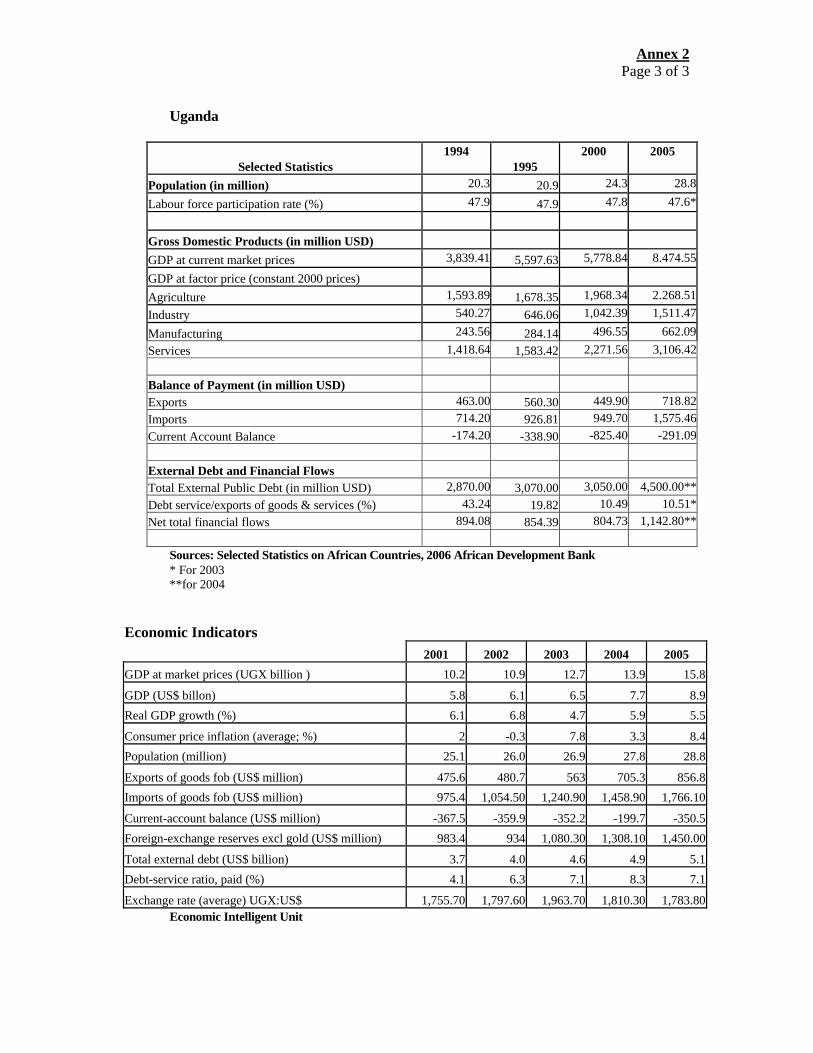
Annex 2 Page 3 of 3
Uganda
Selected Statistics
1994 1995
2000 2005
Population (in million) 20.3 20.9 24.3 28.8
Labour force participation rate (%) 47.9 47.9 47.8 47.6*
Gross Domestic Products (in million USD) GDP at current market prices 3,839.41 5,597.63 5,778.84 8.474.55
GDP at factor price (constant 2000 prices) Agriculture 1,593.89 1,678.35 1,968.34 2.268.51Industry 540.27 646.06 1,042.39 1,511.47
Manufacturing 243.56 284.14 496.55 662.09Services 1,418.64 1,583.42 2,271.56 3,106.42 Balance of Payment (in million USD) Exports 463.00 560.30 449.90 718.82Imports 714.20 926.81 949.70 1,575.46 Current Account Balance -174.20 -338.90 -825.40 -291.09 External Debt and Financial Flows Total External Public Debt (in million USD) 2,870.00 3,070.00 3,050.00 4,500.00**Debt service/exports of goods & services (%) 43.24 19.82 10.49 10.51*Net total financial flows 894.08 854.39 804.73 1,142.80**
Sources: Selected Statistics on African Countries, 2006 African Development Bank * For 2003 **for 2004 Economic Indicators 2001 2002 2003 2004 2005 GDP at market prices (UGX billion ) 10.2 10.9 12.7 13.9 15.8
GDP (US$ billon) 5.8 6.1 6.5 7.7 8.9Real GDP growth (%) 6.1 6.8 4.7 5.9 5.5
Consumer price inflation (average; %) 2 -0.3 7.8 3.3 8.4Population (million) 25.1 26.0 26.9 27.8 28.8
Exports of goods fob (US$ million) 475.6 480.7 563 705.3 856.8Imports of goods fob (US$ million) 975.4 1,054.50 1,240.90 1,458.90 1,766.10
Current-account balance (US$ million) -367.5 -359.9 -352.2 -199.7 -350.5Foreign-exchange reserves excl gold (US$ million) 983.4 934 1,080.30 1,308.10 1,450.00
Total external debt (US$ billion) 3.7 4.0 4.6 4.9 5.1Debt-service ratio, paid (%) 4.1 6.3 7.1 8.3 7.1
Exchange rate (average) UGX:US$ 1,755.70 1,797.60 1,963.70 1,810.30 1,783.80 Economic Intelligent Unit
Annex 3 Page 1 of 2
EVOLUTION OF BANK’S LOC POLICIES AND STRATEGIES
1. The ADB does not have separate financial intermediation policy and strategy for sub-regional development banks. The Lines of Credit extended to Public Sector Financial Intermediaries at national and sub-regional level are governed by the policy document (Ref. ADB/AD/81/140) issued in 1981 which was later incorporated within the Industrial Sector Policy Guidelines of 1986, which covered in main Line of Credit and Equity Financing of DFIs at national and sub-regional level. A new Financial Sector Policy was issued in October 2003 to guide the Bank’s indirect intermediations in RMCs. In this Policy document, the Bank Group is expected to satisfy through its LOCs, two interrelated objectives:
(i) To address market failures (such as limited longer maturity lending and limited SMEs access to credit); and
(ii) To strengthen the capacity of the participating financial institutions to lend
more to SMEs. 2. In the October 2003 policy, the Bank is expected to direct LOCs to institutions, which have in place good and transparent management, suitably designed operating standards, especially for accounting and provisioning for risks, and good negotiation with clients and proper supervision. At the time, the LOC V was extended to EADB, these expectations in the 2003 policy were not considered since these were of recent development necessitated in view of the failure of many DFIs in the past. Notwithstanding, the ADB’s loan conditions and NDF’s technical assistance helped to improve the performance of EADB over time. Thus, the fifth LOC effectively responded to the policy and strategy of ADB and EADB prevailing at the time. 3. Since 1991, the ADB expanded its operations for private sector development with the establishment of a private sector window. The operations of this window have been guided by a separate private sector strategy that was issued in 1996. This strategy aims at sharpening the operational focus of the private sector activities to enhance the Bank’s capacity to respond to the growing needs of the private sector in RMCs. By this strategy, new financing instruments such as LOCs and guarantees were introduced to enable the private sector department of the Bank broaden the scope of its assistance to the private sector. In line with this strategy, the department began in 1998 to provide LOCs without government guarantees to private financial intermediaries (PFIs). The LOCs were intended to enable the Bank to respond to a broad range of specific needs of private enterprises and fulfil its development objectives in ways that cannot be met through direct lending. The strategy requires the LOCs to enhance the capacity of the Bank to perform its catalytic role and promote private sector development. 4. In November 2004, the ADB further approved a new Private Sector Development (PSD) strategy. The strategy is anchored on the Bank Vision, the Strategic Plan 2003-2007, private sector policies and guidelines, CSPs, the Private Sector Country Profile (PSCP), the Country Governance Profile (CGP), and the Country Policy and Institutional Assessment (CPIA) and the prudential financial and risk management to safeguard the Bank as a sound development financial institution. The main objective of the PSD strategy is to support the development of a viable private sector in the RMCs consistent with the three pillars of the Bank’s Strategic Plan with respect to ownership, partnership and selectivity to enhance its
Annex 4 Page 2 of 2
catalytic role. Furthermore, there are dimensions to the concept of development effectiveness that are particular to the private sector and key to formalizing the economy through fair competition reflected in a level playing field and open markets; good corporate governance; financial risk mitigation; regional integration; and corporate citizenship with respect to social and environmental responsibility. 5. Thus, the policies, strategies and guidelines for LOC operations have evolved over the years. In recent years, the ADB’s public sector LOCs have been appraised in a similar fashion as those of the private sector LOCs except the difference is that of intensity on financial viability since the latter do not involve government guarantee. 6. In the new ADB organizational structure, all LOCs are now under the responsibility of the Private Sector Department. This situation has encouraged the use of similar policies and strategies to promote sector development, poverty reduction and development effectiveness in member states. Thus, the key dimensions to evaluate the LOCs for the public and private financial intermediaries are largely similar. 7. The sub-regional development Banks such as EADB are now constrained by the credit limits on sub-projects and therefore could not go into financing/co-financing large scale projects exceeding UA8 million that have significant contribution to regional integration and the NEPAD vision. On the other hand, such banks are not well equipped to provide financing to the very small indigenous enterprises since these enterprises require broad based assistance covering term loans, working capital, technical assistance for capacity building and the like. National level DFIs including micro-finance institutions are constrained to cater to the needs of small scale and micro- enterprises. Thus, the ADB needs to enhance its partnership with the sub-regional development banks such as EADB with appropriate instruments to accelerate regional integration in the RMCs on one hand, and on the other, develop the necessary linkages with national level financial intermediaries for the needed support to the smaller segment of the economy in the EAC member countries. Such orientation requires reflection and revisiting the policy and strategies relating to the lending and non-lending intermediation of the ADB to the sub-regional development banks and the national level financial and non-financial intermediaries in RMCs.
Annex 4 Page 1 of 2
LESSONS LEARNT FROM 3RD AND 4TH LOCS
1. Most of the lessons to learn from the implementation of the two lines of credit relate to the problems associated with EADB institutional capability, inexperience of the promoters in implementing and operating projects, inadequate infrastructure (power and water, telecom), managerial skills, inadequate lack of working capital, inadequate project preparation, appraisal and supervision, environmental considerations, and risk allocation or hedging. Therefore, a number of useful lessons could be derived from the implementation of the two lines of credit. 2. The first lesson to learn from this exercise is that project promoters, particularly emerging entrepreneurs (mostly indigenous), have problems of mobilizing equity capital, mainly for buildings, civil works and initial working capital. In many cases, a project is approved; disbursement made and even equipment arrived on site, without the promoters having fulfilled their commitment to mobilize adequate resources for their project. Therefore, rigorous appraisal is required to ensure that the emerging entrepreneurs have adequate capita1 before such sub-projects are accepted by a DFI. In addition, ADB should ensure that promoters have mobilized the required capital before approving the sub-project. 3. Furthermore, since most of the emerging promoters, whose projects failed, are indigenous, special training facilities should be availed to them. This kind of attention would reduce the chances of failed projects, similar to the situation that happened to three sub- projects of the third line of credit in Kenya. In addition, managerial capacity of project promoters must be assessed and verified thoroughly. DFIs need to be equipped to assist a promoter with project ideas, capital and extension services as necessary. 4. Another major lesson is that in some cases technology purchased is inappropriate for the quality of the products required. As a result, a sub-project may be delayed or fail to take off due to inappropriate technology acquired. It has also been noticed that a number of sub-borrowers look for cheap or second-hand technology which, in most cases, contribute to the failure of the project. In this regard, promoters should be encouraged in using proven technology. The Bank’s policy of requiring at least three quotations from three different countries should be strictly adhered. 5. Other lessons to learn from the implementation of the lines of credit are:
a. given high rate of failure of new sub-projects, as a general principle, only private projects with high rate of survival under the economic reform programmes, such as modernization, expansion and/or export-oriented projects which are dependent on local raw materials, should be funded from ADB lines of credit resources;
b. in order to effectively assist the emerging African entrepreneurs, the Bank Group
should concentrate on micro-enterprises, which are easier to manage, arid if backed by extension services, this type of assistance could be very useful to a large section of a population for a small amount of resources;
c. ADB should ensure that environmental impact analysis are conducted more
vigorously for every sub-project in order to ensure that corrective measures for potentially adverse effects on environment and health and safety of workers are
Annex 4 Page 2 of 2
incorporated: in each sub-project design; and, at the same time, supervision of such projects should be maintained to ensure that safety measures and protection on environment are maintained, according to national policy guidelines;
d. ADB should not accept a sub-project unless there is evidence to show that adequate
utilities (power and water supply) would be available for me sub-project in countries known to have such problems;
e. in order to minimize the problems normally associated with foreign exchange risk,
DFIs should promote export-oriented projects, as far as it is possible, which can easily service debt from export proceeds;
f. Government promoted projects are on the whole poor performers as opposed to those
promoted by private sector, which leads to the proposal that, lending to government corporations should be evaluated first and foremost on the individual sub-borrower’s ability to service debt and should be tied to maintenance of quality management, and not just on the basis of government guarantees;
g. it has been noted that performance of some of the sub-projects have been hampered
by emerging uncertain conditions which were not fully anticipated at the time of appraisal, which leads to another lesson that, rigorous project preparation and appraisal employing risk analysis is important; and finally;
h. it has been difficult, in many cases, to obtain adequate information on some sub-
projects of LOC III because a number of them were sold or liquidated at the time of the PCR, since the PCR was prepared about twelve years after the third line of credit had been granted. As a lesson, the Bank should make efforts to prepare PCRs soon after the completion of the lines of credit.

Annex 5 Page 1 of 3
RETROSPECTIVE RESULT-BASED LOGICAL FRAMEWORK MATRIX: LOC V
Verifiable Indicators Narrative Description Appraisal (1993) PCR (2004) PPER (2006)
Means of Verification
Assumptions/ Risks
1. GOALS AND OBJECTIVES 1.1 Sector Goal 1.1.1 Promotion of SMEs & Private Sector. 1.1.2 Generate Employment. 1.1.3 Regional cooperation strengthened.
1.1.1 New and existing SMEs financed. 1.1.2 Employment created. 1.1.3 Number of regional projects promoted.
1.1.1 A total of 19 sub-projects were financed (8 new, 11 existing (for expansion and rehabilitation) 1.1.2 A total of 4,600 jobs were estimated to have been created by the operating sub-projects (27% occupied by women) 1.1.3 Eight sub-projects export their products within the sub-region
1.1.1 Nineteen (19) sub-projects (20 sub-loans). 16 of the sub-projects were to substitute imports or cater to export markets. However, only seven were successful to achieve this objective, while the remaining were either partially (4) successful (1), unsuccessful or failed (7). 1.1.2 Only about 1,500 jobs were sustained by the operating sub-projects due to the failure rate (25% occupied by women). But the indirect jobs created or sustained was significant 1.1.3 Regional trade enhanced but no regional projects
EAC reports, country central bank reports, other donors reports, EADB Annual reports & Supervision reports.
(Goal to Super Goal)
1.2 OTHER OBJECTIVES 1.2 Financial Objectives 1.2.1Improved financial performance and profitability 1.2.2 To declare at least 50% of its annual net income as dividends 1.2.3 Improved liquidity position and reduced level of arrears 1.3 Institutional Development Objectives 1.3.1 Amend EADB Charter to reduce governments shareholding from 60% to 51% and allow more membership in the General
1.2.1 Profit increased from a low level of UA1.73million in 1994 to UA3.30million in 1999 1.2.2 50% of net income declared as dividends 1.2.3 Arrears improved from 57% in 1992 to 8% by 1998 but increased to 23% by 2002 1.3.1 Charter revised.
1.2.1 Same as PCR 1.2.2 Dividend not sustained due to losses in 2002 and 2003 1.2.3Liquidity position has significantly improved until 1998 reaching 8% but declined to 31% by 2005 1.3.1 Same as PCR
OPEV field mission EADB records
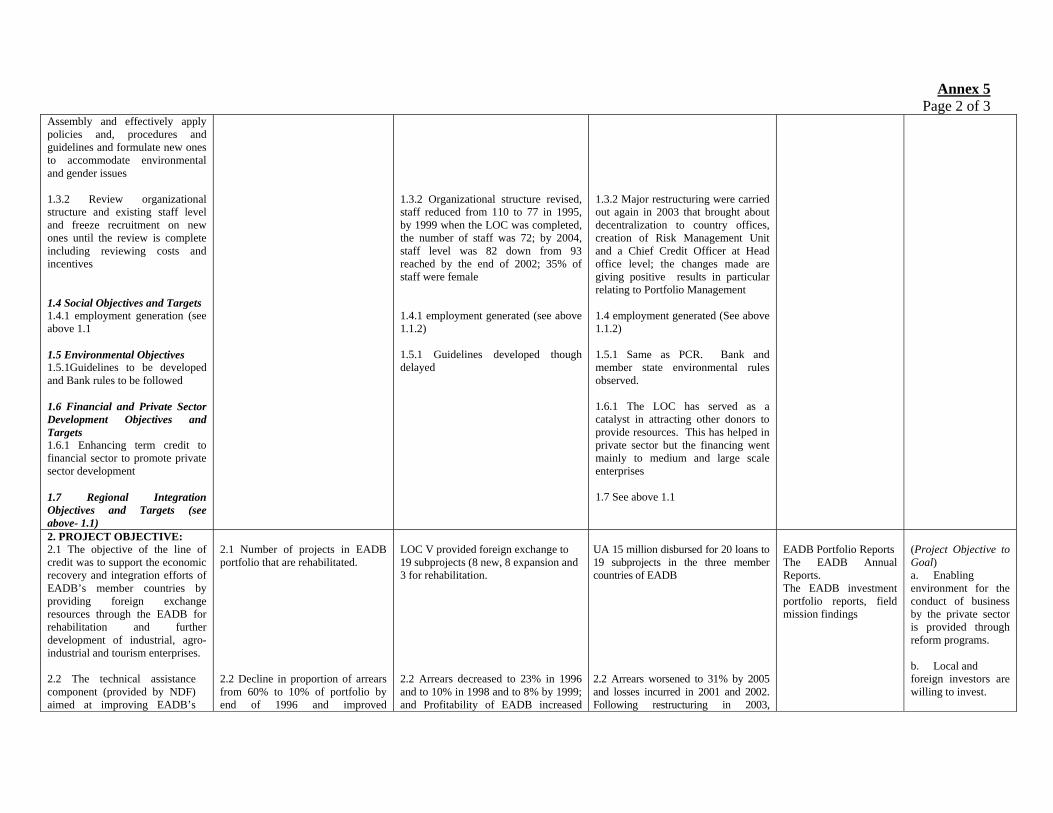
Annex 5 Page 2 of 3
Assembly and effectively apply policies and, procedures and guidelines and formulate new ones to accommodate environmental and gender issues 1.3.2 Review organizational structure and existing staff level and freeze recruitment on new ones until the review is complete including reviewing costs and incentives 1.4 Social Objectives and Targets 1.4.1 employment generation (see above 1.1 1.5 Environmental Objectives 1.5.1Guidelines to be developed and Bank rules to be followed 1.6 Financial and Private Sector Development Objectives and Targets 1.6.1 Enhancing term credit to financial sector to promote private sector development 1.7 Regional Integration Objectives and Targets (see above- 1.1)
1.3.2 Organizational structure revised, staff reduced from 110 to 77 in 1995, by 1999 when the LOC was completed, the number of staff was 72; by 2004, staff level was 82 down from 93 reached by the end of 2002; 35% of staff were female 1.4.1 employment generated (see above 1.1.2) 1.5.1 Guidelines developed though delayed
1.3.2 Major restructuring were carried out again in 2003 that brought about decentralization to country offices, creation of Risk Management Unit and a Chief Credit Officer at Head office level; the changes made are giving positive results in particular relating to Portfolio Management 1.4 employment generated (See above 1.1.2) 1.5.1 Same as PCR. Bank and member state environmental rules observed. 1.6.1 The LOC has served as a catalyst in attracting other donors to provide resources. This has helped in private sector but the financing went mainly to medium and large scale enterprises 1.7 See above 1.1
2. PROJECT OBJECTIVE: 2.1 The objective of the line of credit was to support the economic recovery and integration efforts of EADB’s member countries by providing foreign exchange resources through the EADB for rehabilitation and further development of industrial, agro-industrial and tourism enterprises. 2.2 The technical assistance component (provided by NDF) aimed at improving EADB’s
2.1 Number of projects in EADB portfolio that are rehabilitated. 2.2 Decline in proportion of arrears from 60% to 10% of portfolio by end of 1996 and improved
LOC V provided foreign exchange to 19 subprojects (8 new, 8 expansion and 3 for rehabilitation. 2.2 Arrears decreased to 23% in 1996 and to 10% in 1998 and to 8% by 1999; and Profitability of EADB increased
UA 15 million disbursed for 20 loans to 19 subprojects in the three member countries of EADB 2.2 Arrears worsened to 31% by 2005 and losses incurred in 2001 and 2002. Following restructuring in 2003,
EADB Portfolio Reports The EADB Annual Reports. The EADB investment portfolio reports, field mission findings
(Project Objective to Goal) a. Enabling environment for the conduct of business by the private sector is provided through reform programs. b. Local and foreign investors are willing to invest.

Annex 5 Page 3 of 3
operational performance through institutional and capacity strengthening.
profitability of EADB from UA 1.73 million in 1994 to UA 3.3 million in 1998.
improvement is showing but a lot needs to be down in portfolio management
3. OUTCOMES 3.1 A total of 7 Successful and sustained sub-projects out of 19 implemented
3.1 Successful projects 7 Partially successful project 4 Unsuccessful sub-projects 1 Failed sub-projects 7 Total 19
OPEV field mission PTA Bank records
4. PROJECT OUTPUTS: 4.1 Loans to sub-borrowers for equipment/ inputs provided. 4.2 EADB managerial and technical capabilities strengthened. 4.3 Staff incentives and morale boosted.
4.1 Number of subprojects approved/ amount disbursed. 4.2 Number of existing staff and young professionals trained in various skills; and quality of management decisions improved 4.3 Quality of staff output and man/hour input per day increased.
4.1 Nineteen (19) subprojects approved and implemented. 4.2 Forty-three (43) professionals and 11 young professionals trained. 4.3 Private sector Board members helped to improve quality of decisions on projects and quality of portfolio improved. 4.4 Staff turnover is low due to competitive remuneration and other incentives.
4.1 same as PCR 4.2 same as PCR but sustained training needed. Future LOC should include technical assistance 4.3 same as PCR 4.4 same as PCR
EADB reports, field mission findings
(Output to Project Objective) a. Management and professional capacity of the EADB adequate to monitor the sub-projects. b. Sub-project managerial capability adequate to sustain the sub-projects.
5. INPUTS/ACTIVITIES: 5.1 Preparation of loans to sub-borrowers by EADB: preparing and appraising sub-projects, approvals of sub-projects by ADB and disbursements. 5.2 Acquisition of consultants and logistical support equipment.
5.1 Number of subprojects sent to ADB for approval, Commitment of the LOC and Disbursements 5.2 None
5.1 About 22 subprojects sent to ADB and 19 were approved, LOC committed to 19 subprojects, and a total of UA 15 million disbursed from LOC V UA 0.6 million grant from NDF used to acquire the services of a consulting firm to establish the Business Development Department and to train the local staff.
ADB approved UA 15 million in August 1994 Loan became effective in September 1995 UA 15 million disbursed by December 2001
ADB records. ADB records. FFCO and The EADB financial records and audited accounts.
(Activities to Output) a. The EADB has the ability the entrepreneur to implement the sub-projects. b. Sub-projects submitted are good.

Annex 6 Page 1 of 2
SUMMARY STATUS OF SUB-PROJECTS FINANCED UNDER LOC V
No Final Beneficiary Country Sector Loan
Amount UA Date
Approved
Jobs Created and
sustained* Status of the sub-projects
1 A Tanzania Floriculture – cut flowers 286,926 04/08/1995 Partially Successful (debts partially recovered-rated 2)
2 B Tanzania Agro-processing cotton lint 586,000 07/11/1997 N.A Partially Successful (fully prepaid- rated 4) 3 C Tanzania Floriculture – cut flowers 350,195 09/06/1995 Failed (under receivership rated 1) 4 D Tanzania Manufacturing – industrial gases 1,301,000 01/06/1995 N.A Unsuccessful (debts settled by Government,
before privatized- rated 4) 5 E- I Tanzania Manufacturing plastic products 767,455 28/08/1995 545 Successful (fully paid- rated 4)
6 E- II Tanzania Manufacturing - plastic products 972,000 30/04/1996 Successful (fully paid-rated 4)
7 F Tanzania Agro-processing - grain milling 926,000 09/04/1998 Failed (never started due to inappropriate equipment)-promoter sued supplier of equipment- rated 1)
8 G Tanzania Textiles - yarn spinning 915,759 17/11/1998 Failed (under receivership- rated 1) Total Tanzania 6,105,335 500
9 H Kenya Floriculture – cut flowers 169,229 09/06/1995 Partially Successful (debts substantially recovered- rated 3)
10 I Kenya Floriculture and vegetable storage 225,357 01/06/1995 N.A Successful (debts fully paid- rated 4 )
11 J Kenya Food - salt processing 1,162,916 04/07/1997 500 Successful (fully paid- rated 4)
12 K Kenya Manufacturing - ceramic tiles 784,340 18/11/1996 300 Successful (servicing satisfactorily- rated 4)
13 L Kenya Food – dairy 483,000 31/12/1996 139 Successful (servicing satisfactorily- rated 4)
14 M Kenya Food - soft drinks 1,362,000 09/04/1998 Failed (debts substantially recovered- rated 3)
15 N Kenya Transport - bus company 1,600,000 21/09/1998 Failed (under receivership- rated 1) Total Kenya 5,786,842 939 16 O Uganda Agro-processing pyrethrum 400,612 01/06/1995 Failed (debts partially recovered- rated 2)
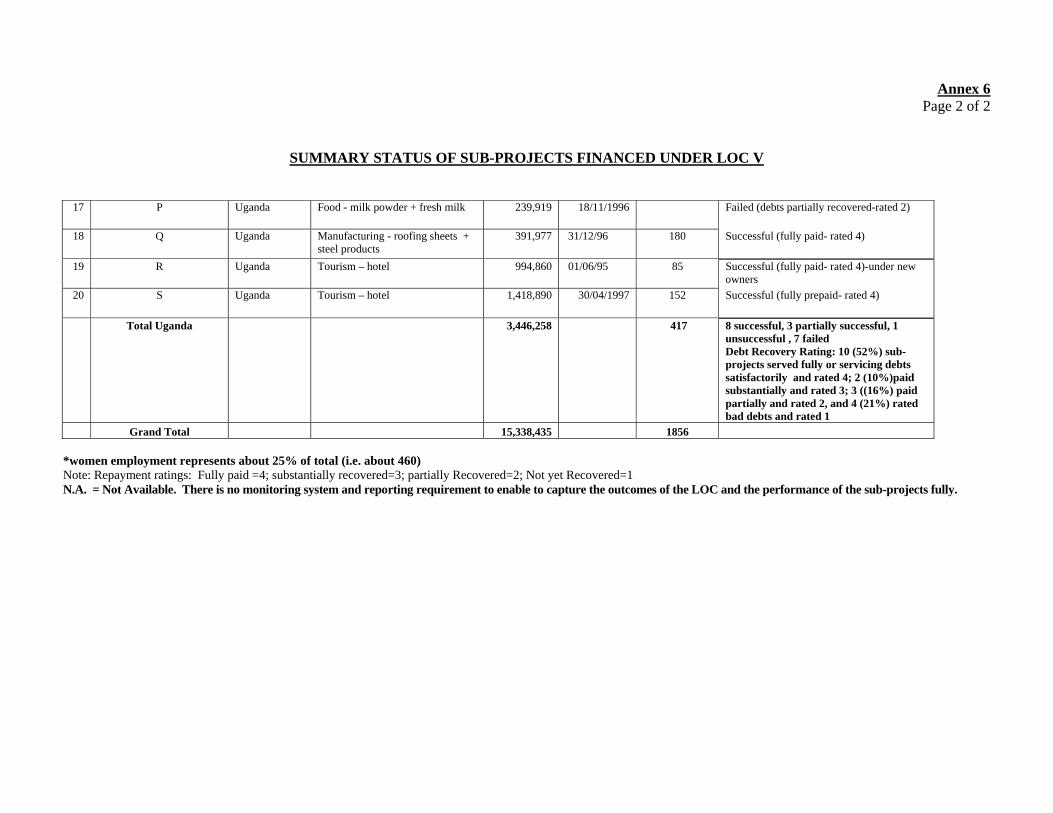
Annex 6 Page 2 of 2
SUMMARY STATUS OF SUB-PROJECTS FINANCED UNDER LOC V
17 P Uganda Food - milk powder + fresh milk 239,919 18/11/1996 Failed (debts partially recovered-rated 2)
18 Q Uganda Manufacturing - roofing sheets + steel products
391,977 31/12/96 180 Successful (fully paid- rated 4)
19 R Uganda Tourism – hotel 994,860 01/06/95 85 Successful (fully paid- rated 4)-under new owners
20 S Uganda Tourism – hotel 1,418,890 30/04/1997 152 Successful (fully prepaid- rated 4)
Total Uganda 3,446,258 417 8 successful, 3 partially successful, 1 unsuccessful , 7 failed Debt Recovery Rating: 10 (52%) sub-projects served fully or servicing debts satisfactorily and rated 4; 2 (10%)paid substantially and rated 3; 3 ((16%) paid partially and rated 2, and 4 (21%) rated bad debts and rated 1
Grand Total 15,338,435 1856 *women employment represents about 25% of total (i.e. about 460) Note: Repayment ratings: Fully paid =4; substantially recovered=3; partially Recovered=2; Not yet Recovered=1 N.A. = Not Available. There is no monitoring system and reporting requirement to enable to capture the outcomes of the LOC and the performance of the sub-projects fully.
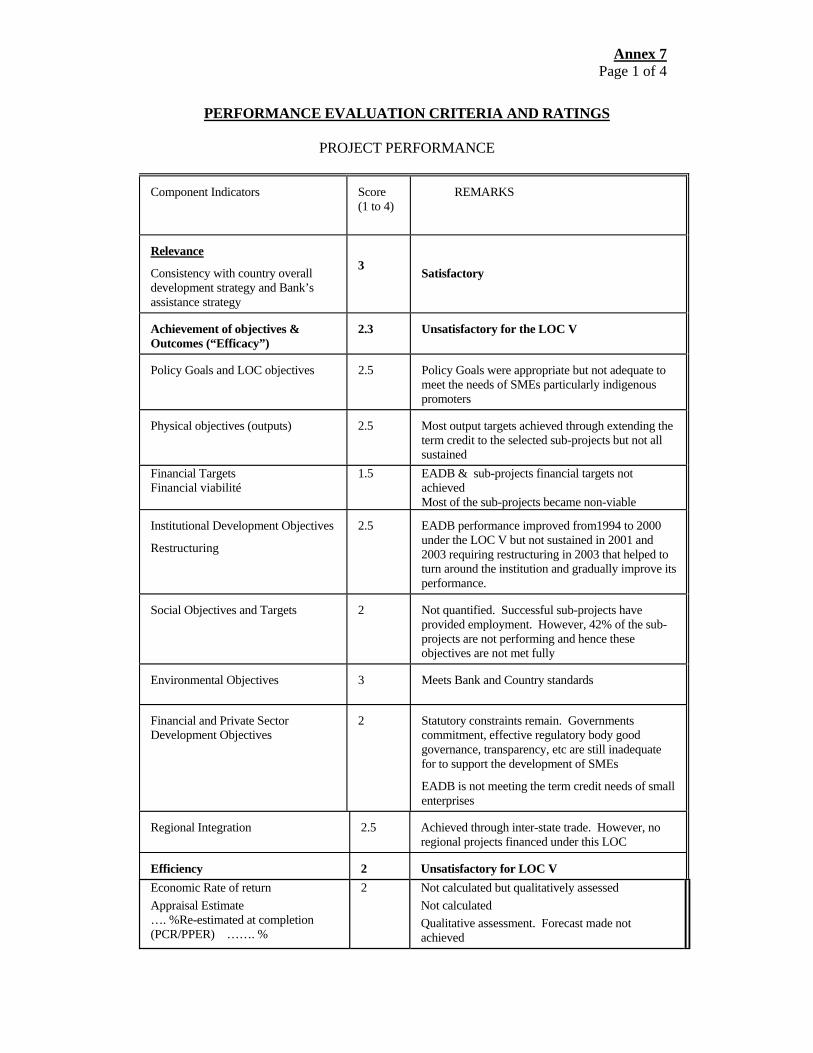
Annex 7 Page 1 of 4
PERFORMANCE EVALUATION CRITERIA AND RATINGS
PROJECT PERFORMANCE
Component Indicators Score (1 to 4)
REMARKS
Relevance
Consistency with country overall development strategy and Bank’s assistance strategy
3
Satisfactory
Achievement of objectives & Outcomes (“Efficacy”)
2.3 Unsatisfactory for the LOC V
Policy Goals and LOC objectives 2.5 Policy Goals were appropriate but not adequate to meet the needs of SMEs particularly indigenous promoters
Physical objectives (outputs) 2.5 Most output targets achieved through extending the term credit to the selected sub-projects but not all sustained
Financial Targets Financial viabilité
1.5
EADB & sub-projects financial targets not achieved Most of the sub-projects became non-viable
Institutional Development Objectives
Restructuring
2.5 EADB performance improved from1994 to 2000 under the LOC V but not sustained in 2001 and 2003 requiring restructuring in 2003 that helped to turn around the institution and gradually improve its performance.
Social Objectives and Targets
2 Not quantified. Successful sub-projects have provided employment. However, 42% of the sub-projects are not performing and hence these objectives are not met fully
Environmental Objectives 3 Meets Bank and Country standards
Financial and Private Sector Development Objectives
2
Statutory constraints remain. Governments commitment, effective regulatory body good governance, transparency, etc are still inadequate for to support the development of SMEs
EADB is not meeting the term credit needs of small enterprises
Regional Integration 2.5 Achieved through inter-state trade. However, no regional projects financed under this LOC
Efficiency 2 Unsatisfactory for LOC V Economic Rate of return Appraisal Estimate …. %Re-estimated at completion (PCR/PPER) ……. %
2 Not calculated but qualitatively assessed Not calculated Qualitative assessment. Forecast made not achieved
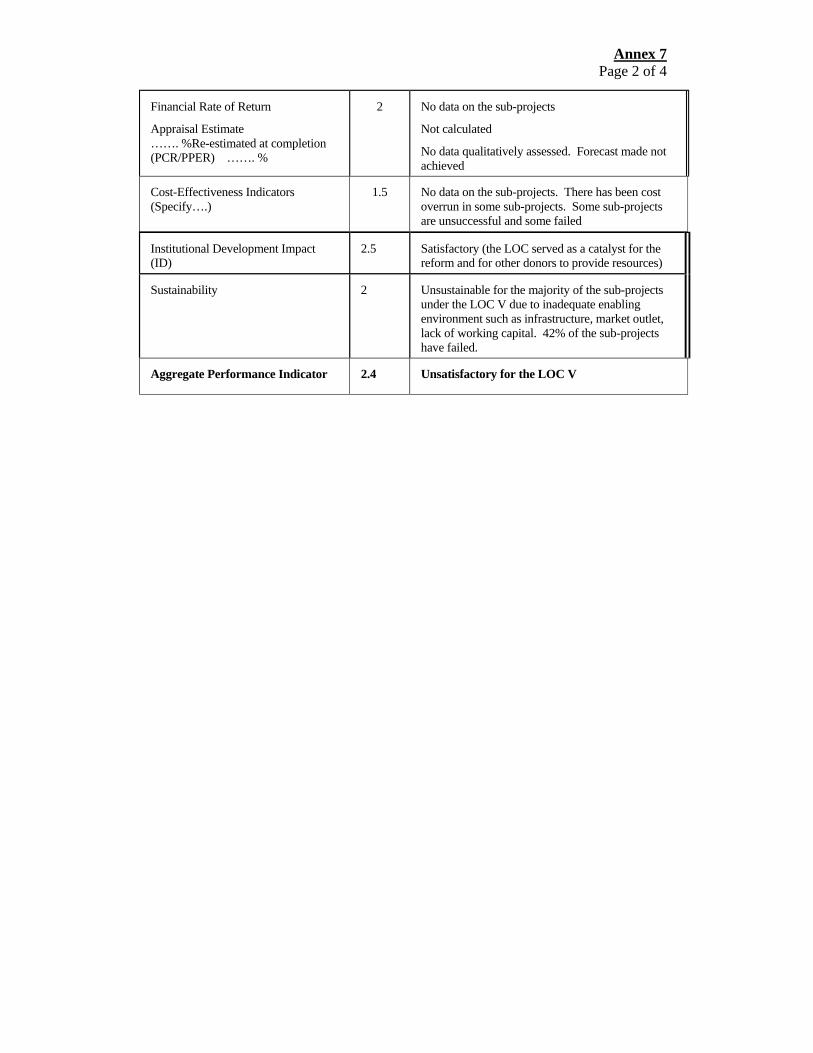
Annex 7 Page 2 of 4
Financial Rate of Return
Appraisal Estimate ……. %Re-estimated at completion (PCR/PPER) ……. %
2
No data on the sub-projects
Not calculated
No data qualitatively assessed. Forecast made not achieved
Cost-Effectiveness Indicators (Specify….)
1.5
No data on the sub-projects. There has been cost overrun in some sub-projects. Some sub-projects are unsuccessful and some failed
Institutional Development Impact (ID)
2.5 Satisfactory (the LOC served as a catalyst for the reform and for other donors to provide resources)
Sustainability 2 Unsustainable for the majority of the sub-projects under the LOC V due to inadequate enabling environment such as infrastructure, market outlet, lack of working capital. 42% of the sub-projects have failed.
Aggregate Performance Indicator 2.4 Unsatisfactory for the LOC V
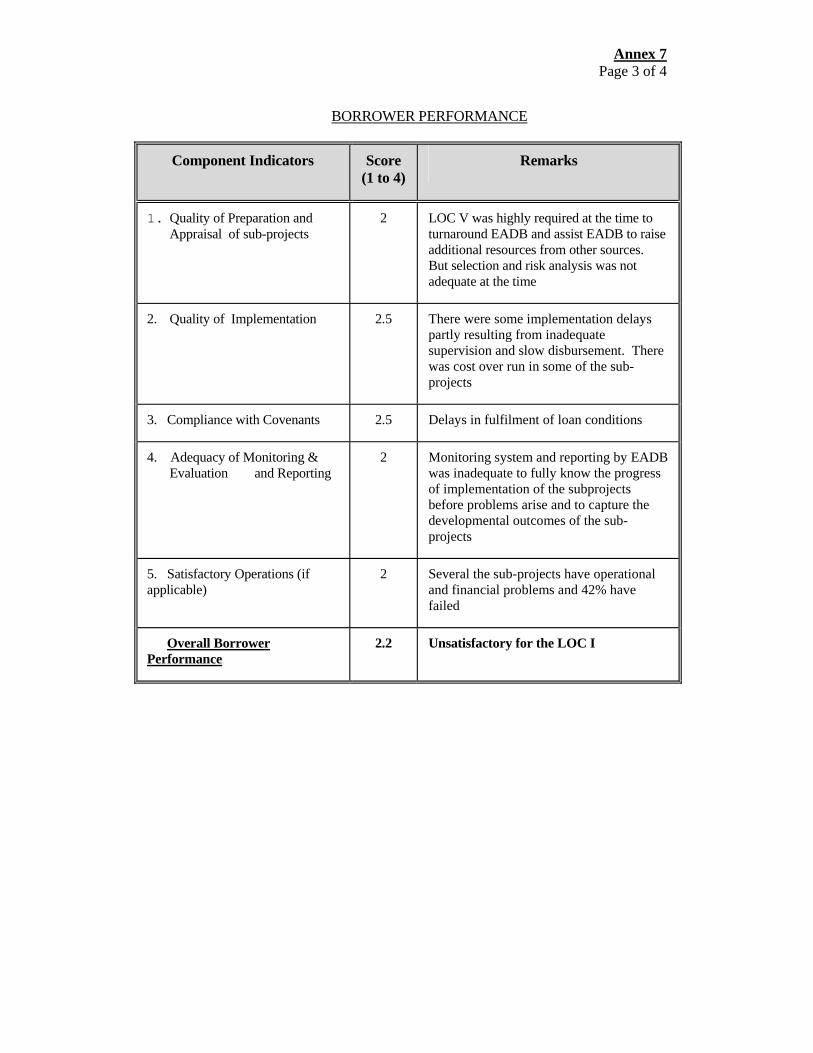
Annex 7 Page 3 of 4
BORROWER PERFORMANCE
Component Indicators Score (1 to 4)
Remarks
1. Quality of Preparation and Appraisal of sub-projects
2 LOC V was highly required at the time to turnaround EADB and assist EADB to raise additional resources from other sources. But selection and risk analysis was not adequate at the time
2. Quality of Implementation
2.5
There were some implementation delays partly resulting from inadequate supervision and slow disbursement. There was cost over run in some of the sub-projects
3. Compliance with Covenants 2.5 Delays in fulfilment of loan conditions
4. Adequacy of Monitoring & Evaluation and Reporting
2 Monitoring system and reporting by EADB was inadequate to fully know the progress of implementation of the subprojects before problems arise and to capture the developmental outcomes of the sub-projects
5. Satisfactory Operations (if applicable)
2 Several the sub-projects have operational and financial problems and 42% have failed
Overall Borrower Performance
2.2 Unsatisfactory for the LOC I
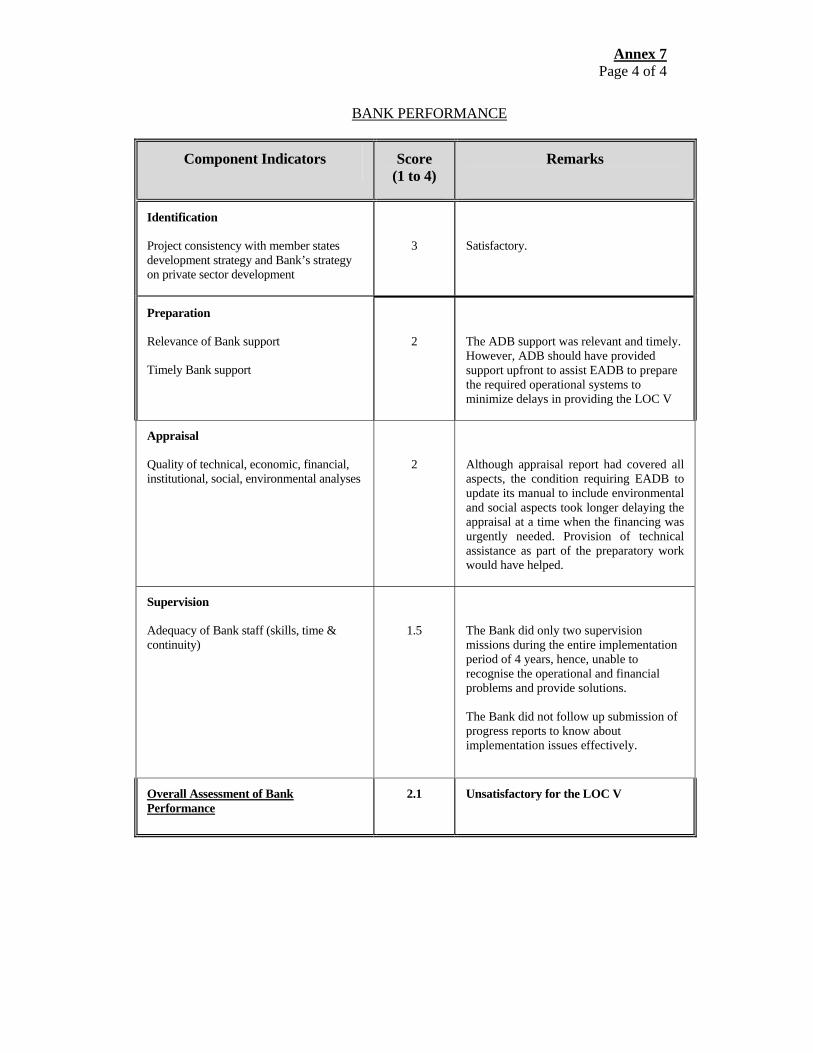
Annex 7 Page 4 of 4
BANK PERFORMANCE
Component Indicators Score (1 to 4)
Remarks
Identification
Project consistency with member states development strategy and Bank’s strategy on private sector development
3
Satisfactory.
Preparation
Relevance of Bank support
Timely Bank support
2
The ADB support was relevant and timely. However, ADB should have provided support upfront to assist EADB to prepare the required operational systems to minimize delays in providing the LOC V
Appraisal
Quality of technical, economic, financial, institutional, social, environmental analyses
2
Although appraisal report had covered all aspects, the condition requiring EADB to update its manual to include environmental and social aspects took longer delaying the appraisal at a time when the financing was urgently needed. Provision of technical assistance as part of the preparatory work would have helped.
Supervision
Adequacy of Bank staff (skills, time & continuity)
1.5
The Bank did only two supervision missions during the entire implementation period of 4 years, hence, unable to recognise the operational and financial problems and provide solutions.
The Bank did not follow up submission of progress reports to know about implementation issues effectively.
Overall Assessment of Bank Performance
2.1 Unsatisfactory for the LOC V

Annex 8 Page 1 of 2
HISTORICAL FINANCIAL STATEMENTS A. INCOME STATEMENT (USD ‘000)
2005 2004 2003 2002 2001 2000 Interest income
Loan interest 10,734 9,020 11,368 13,119 11,220 12,864
Promissory notes interest - 150 788 - - Trade finance interest - 31 246 280 Asset leasing 462 403 426 386 533 312 Short-term deposit interest 2,521 1,742 1,592 1,617 1,953 2,189 Total interest income 13,717 11,165 13,536 15,941 13,952 15,645 Interest expense Interest on borrowings 4,401 3,758 4,445 4,294 3,994 2,645 Interest on bonds 3,041 1,337 2,186 3,546 3,769 3,929 Bond issue costs 228 154 166 148 187 96
Interest on share capital advance 50
Total Interest expense 7,720 5,249 6,797 7,988 7,950 6,670 Net Interest Income 5,997 5,916 6,739 7,953 6,002 8,975 Non Interest Income Dividends 252 205 80 241 246 120 Other income 606 1,249 483 85 56 38 Commission 466 937 284 295 473 542 Commitment fees 94 25 90 266 133 64 Office and residential rent 502 470 419 605 537 334 1920 2,886 1,356 1,492 1,445 1,098 Gross operating income 7,917 8,803 8,095 9,445 7,447 10,073 Exchange movements (429) (666) (1,687) (8,414) 3,185 3,463 Non interest expense Staff costs 3,272 3,489 3,094 3,324 2,955 2,442 Administration expenses 1,447 1,940 1,170 1,643 1,313 1,352 Restructuring costs 0 31 410 - 4.719 5,460 4,674 4,967 4,268 3,794 Provisions Depreciation of fixed assets 717 421 703 686 611 614 Provision for Bad Debts 628 1, 830 3,975 14,316 4,259 3,494 1,345
2,251 4,678 15,002 4,870 4,108 Profit /(Loss) for the year 1,424 426 (2,944) (18,938) 1,494 5,634 Basic earnings /(loss) per share 97 (786) (5,) 399 1,568 Dividend per share - - - - 215 * 2005 Figures are from the draft financial statements
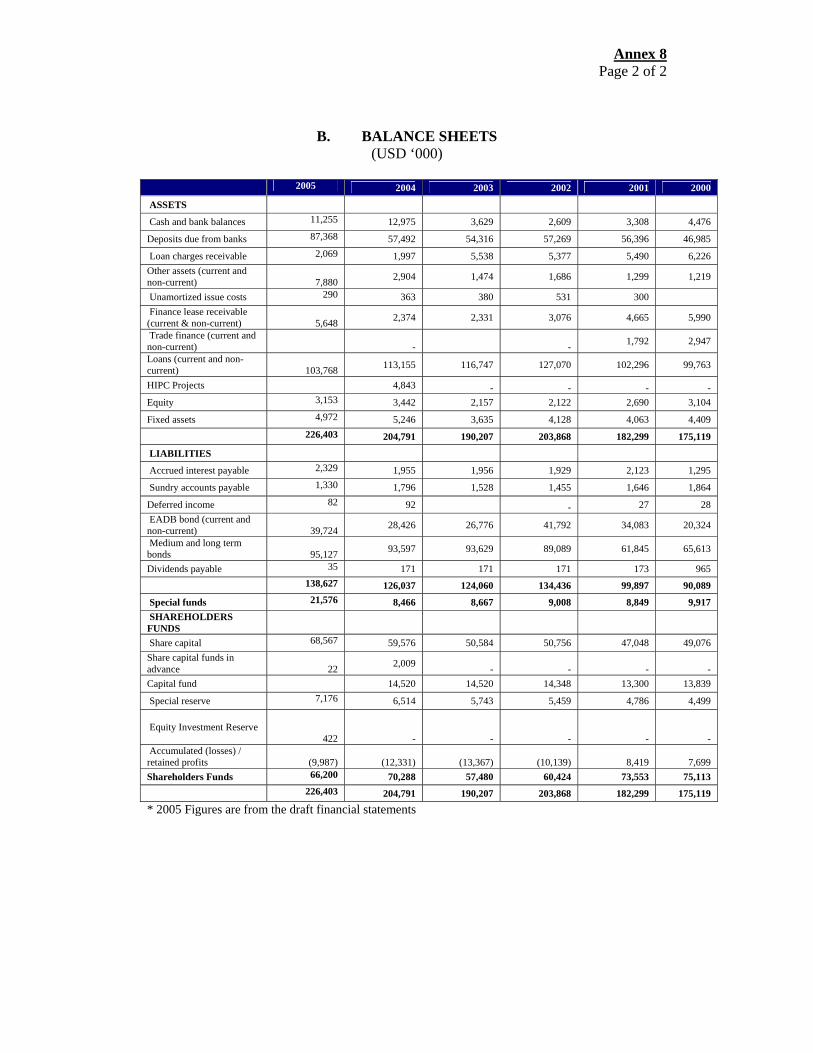
Annex 8 Page 2 of 2
B. BALANCE SHEETS (USD ‘000)
2005 2004 2003 2002 2001 2000
ASSETS
Cash and bank balances 11,255 12,975 3,629 2,609 3,308 4,476
Deposits due from banks 87,368 57,492 54,316 57,269 56,396 46,985
Loan charges receivable 2,069 1,997 5,538 5,377 5,490 6,226 Other assets (current and non-current)
7,880 2,904 1,474 1,686 1,299 1,219
Unamortized issue costs 290 363 380 531 300 Finance lease receivable (current & non-current)
5,648 2,374 2,331 3,076 4,665 5,990
Trade finance (current and non-current)
- - 1,792 2,947
Loans (current and non-current)
103,768 113,155 116,747 127,070 102,296 99,763
HIPC Projects 4,843 - - - - Equity 3,153 3,442 2,157 2,122 2,690 3,104
Fixed assets 4,972 5,246 3,635 4,128 4,063 4,409 226,403 204,791 190,207 203,868 182,299 175,119
LIABILITIES
Accrued interest payable 2,329 1,955 1,956 1,929 2,123 1,295
Sundry accounts payable 1,330 1,796 1,528 1,455 1,646 1,864
Deferred income 82 92 - 27 28 EADB bond (current and non-current)
39,724 28,426 26,776 41,792 34,083 20,324
Medium and long term bonds
95,127 93,597 93,629 89,089 61,845 65,613
Dividends payable 35 171 171 171 173 965 138,627 126,037 124,060 134,436 99,897 90,089
Special funds 21,576 8,466 8,667 9,008 8,849 9,917 SHAREHOLDERS FUNDS
Share capital 68,567 59,576 50,584 50,756 47,048 49,076 Share capital funds in advance
22 2,009 - - - -
Capital fund 14,520 14,520 14,348 13,300 13,839
Special reserve 7,176 6,514 5,743 5,459 4,786 4,499
Equity Investment Reserve
422 - - - - - Accumulated (losses) / retained profits
(9,987) (12,331) (13,367) (10,139) 8,419 7,699
Shareholders Funds 66,200 70,288 57,480 60,424 73,553 75,113
226,403 204,791 190,207 203,868 182,299 175,119
* 2005 Figures are from the draft financial statements
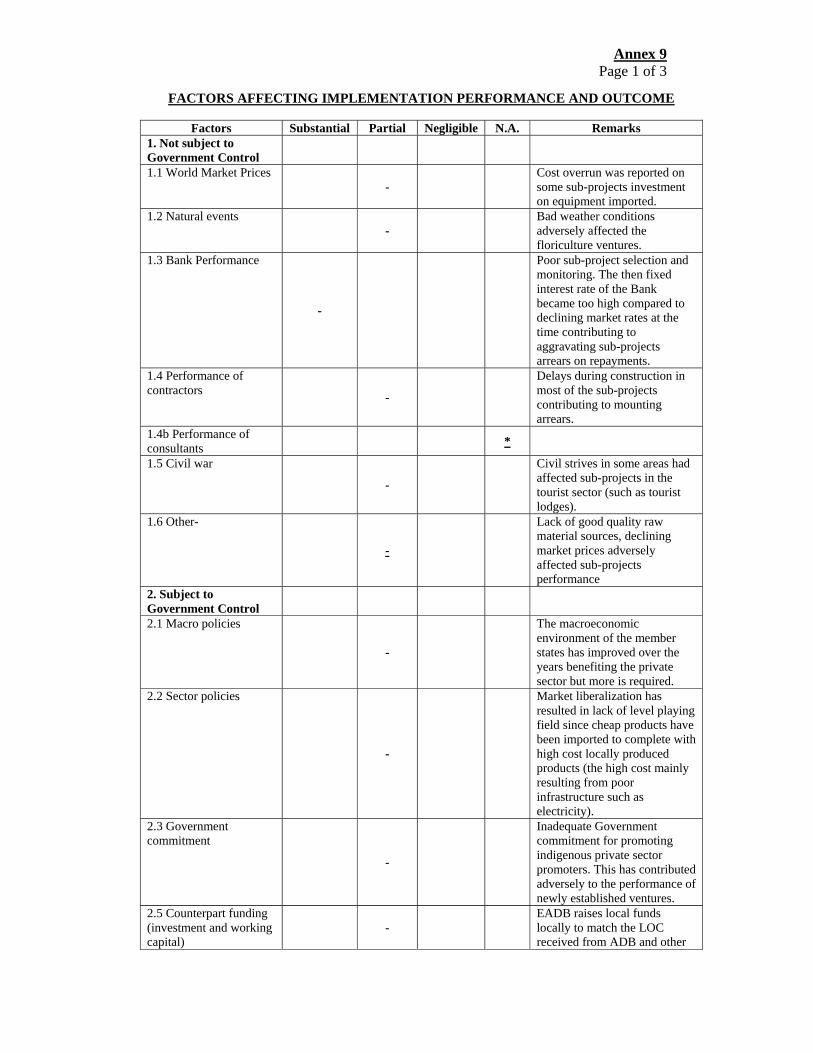
Annex 9 Page 1 of 3
FACTORS AFFECTING IMPLEMENTATION PERFORMANCE AND OUTCOME
Factors Substantial Partial Negligible N.A. Remarks 1. Not subject to Government Control
1.1 World Market Prices -
Cost overrun was reported on some sub-projects investment on equipment imported.
1.2 Natural events -
Bad weather conditions adversely affected the floriculture ventures.
1.3 Bank Performance
-
Poor sub-project selection and monitoring. The then fixed interest rate of the Bank became too high compared to declining market rates at the time contributing to aggravating sub-projects arrears on repayments.
1.4 Performance of contractors -
Delays during construction in most of the sub-projects contributing to mounting arrears.
1.4b Performance of consultants *
1.5 Civil war
-
Civil strives in some areas had affected sub-projects in the tourist sector (such as tourist lodges).
1.6 Other-
-
Lack of good quality raw material sources, declining market prices adversely affected sub-projects performance
2. Subject to Government Control
2.1 Macro policies
-
The macroeconomic environment of the member states has improved over the years benefiting the private sector but more is required.
2.2 Sector policies
-
Market liberalization has resulted in lack of level playing field since cheap products have been imported to complete with high cost locally produced products (the high cost mainly resulting from poor infrastructure such as electricity).
2.3 Government commitment
-
Inadequate Government commitment for promoting indigenous private sector promoters. This has contributed adversely to the performance of newly established ventures.
2.5 Counterpart funding (investment and working capital)
- EADB raises local funds locally to match the LOC received from ADB and other

Annex 9 Page 2 of 3
sources. However, ADB and EADB did not cover working capital.
2.6 Administrative capacity
-
Security registration process, legal recourse for payment of outstanding debts of failed sub-projects, internal processing such as custom clearance and approval of contract and disbursement processing, all contributed to delayed implementation and/or recovery of debts.
2.7 Other - -
Poor infrastructure adversely affected the performance of sub-projects.
3. Subject to Executing Agency Control (PTA Bank and Sub-Project Promoters)
3.1 Management
-
There has been poor governance in EADB in the past that adversely affected the selection and design as well as monitoring of the sub-projects; but this has improved over the years. While the successful sub-projects have good management, most of the sub-projects particularly new ones suffered from poor management during implementation and operation.
3.2 Staffing
-
EADB had to restructure and decentralize its operations to country offices with adequate staffing to improve performance.
3.3 Use of technical Assistance
+
Some TA was used to improve performance of EADB and some sub-projects had particularly in cut-flower business and tourism sector had hired external assistance
3.4 Monitoring & Evaluation -
Monitoring of the LOC V was poor at the level of EADB in the past but this has improved since 2003.
3.5 Beneficiary Participation *
3.6 Other - 4. Factors Affecting implementation
4.1 Changes in project Scope/scale/design -
There had been changes in sub-projects selection that contributed to implementation delays of the sub-projects.

Annex 9 Page 3 of 3
4.2 Deficiency in estimating physical inputs, the base unit costs +
Promoters contribution were inflated at times to make the sub-projects eligible for financing
4.3 Inadequacy of price/physical contingencies -
Physical and price contingencies were not made adequately at appraisal of the sub-projects to limit the term loan.
4.4 Changes in exchange rates, in financial and institutional arrangements
+(PTA) - (sub)
The institutional reforms of EADB have contributed to improve its operational and financial performance and its repayment capacity to ADB. Changes in exchange rates had burdened promoters to repay the credit. Underestimated working capital requirements that resulted in adversely affecting sub-project performance.
4.5 Unrealistic implementation schedule -
Implementation schedule was realistic but internal processing needs to be streamlined to minimized delays.
4.6 Quality of management including financial management
-
EADB’s operational and financial management was poor in 2001 and 2002 resulting mainly from high provisioning for arrears; but it has improved since then. Successful sub-projects have good operational and financial management while those unsuccessful suffer from poor operational and financial management
4.8 Inefficient procurement and disbursement procedures
-
The reimbursement method of disbursement delayed actual disbursements since promoters were required to disburse their contribution upfront before credit part was disbursed. Promoters find it hard to raise their counterpart funds on time.
4.9 Other (working capital in local currency) +
Lack of adequate working capital for the new enterprises adversely affected their success
Annex 10
SOURCES OF INFORMATION 1.) Project Appraisal Report 2.) Bank’s Project Completion Report 3.) Borrower’s Project Completion Report 4.) Report on the Bank Portfolio as at 31st December 2005 5.) Report and Recommendations of the Director General to the Board of
Directors on Indigo Export Processing Zone Limited, Nairobi-Kenya 6.) Report of the Director General to the Board of Directors and Governing
Council on Progress on Actions for Improving EADB’s Performance 7.) Annual Report and Accounts 1995 - 2004 8.) Study on Recapitalisation of EADB – Draft Final Report 9.) East African Development Bank Information Guide 10.) Loan Agreement between Blue Bay Company Limited Zanzisun Company
Limited and East African Development Bank 11.) Statement of Policy and Investment Guidelines 12.) Supervision Policy 13.) Project Supervision Manual 14.) Loan Provisioning Policy 15.) Environmental Analysis as part of Bank’s Overall Project Analysis 16.) Specimen Supervision Reports 17.) Risk Management Policy 18.) Bank of Tanzania Economic Bulletin for the Quarter ending December 2005 19.) Bank of Tanzania Annual Report 2004/2005 20.) Bank of Tanzania Monthly Economic Review February 2006 21.) Small and Medium Enterprise Development Policy, Ministry of Trade and
Industry, Tanzania 22.) HABARI Newsletter of Small Industries Development Organisation, Tanzania
January 2006 23.) ROAR the Voice of Simba – Newsletter of Simba Plastics Limited December
2005 24.) Bank of Uganda Monthly Economic and Financial Indicators – February 2006 25.) Bank of Uganda Quarterly Economic Report September 2005 26.) Consolidated Low and High Expenditure Motivation Survey – Report 2003;
Ministry of Tourism, Trade & Industry, Uganda 27.) The Marketing & Agro-Processing Strategy (MAPS) Ministry of Tourism,
Trade & Industry, Uganda 28.) Uganda Sustainable Tourism Development Programme: Marketing Strategy
2004-2008 29.) Tourism Policy for Uganda, Ministry of Tourism, Trade & Industry 30.) Uganda-An Elegant Adventure, Uganda Tourist Board 31.) Annual Report 2004 – DCFU Limited 32.) An Investment Guide to East African Community: Opportunities and
Conditions July 2005