multimodal assessment and speech perception outcomes … · hearing aids work supported by nidcd...
TRANSCRIPT

Karen Iler Kirk, Ph.D., CCC-SLP* Shahid and Ann Carlson Khan Professor and Head
Department of Speech and Hearing Science University of Illinois at Urbana-Champaign
Multimodal Assessment and Speech Perception Outcomes in Children with Cochlear Implants or
Hearing Aids
Work supported by NIDCD Grants R01 DC 008875 and P50 DC000242
DISCLOSURE: Test materials described in this presentation are licensed to G.N. Otometrics through The University of Iowa

Collaborators
� The University of Iowa � Karen Iler Kirk, PhD (PI) � Lindsay Prusick, AuD � Virginia Driscoll, MA � Nathaniel Wisecup, BA � Lauren Diamond, BA � Lauren Dowdy, BA � Ruth Flaherty, BA
� House Research Institute, Los Angeles � Laurie Eisenberg, PhD (PI) � Amy Martinez, MA � Dianne Hammes Ganguly, MA
� Children’s Memorial Hospital, Chicago � Nancy Young, MD (PI) � Susan Stentz, AuD � Lisa Weber, AuD � Iguehi James, MPH
� Washington State University � Brian French, PhD (PI) � Chad Gotch, MS
� University of Illinois � Michael Novak, MD � Jean Thomas, AuD � Michael Hudgins, BA

Introduction � Listeners must extract linguistic message from highly
variable acoustic speech signal
� Variability introduced by:
� Talker characteristics - gender, age, dialect and speech rate
� Environment – noise, reverberation
� Presentation format – A-only vs. Auditory-plus-Visual
� Linguistic characteristics
� Word frequency – how often words occur in language
� Lexical Density – the number of phonemically similar words or lexical
neighbors
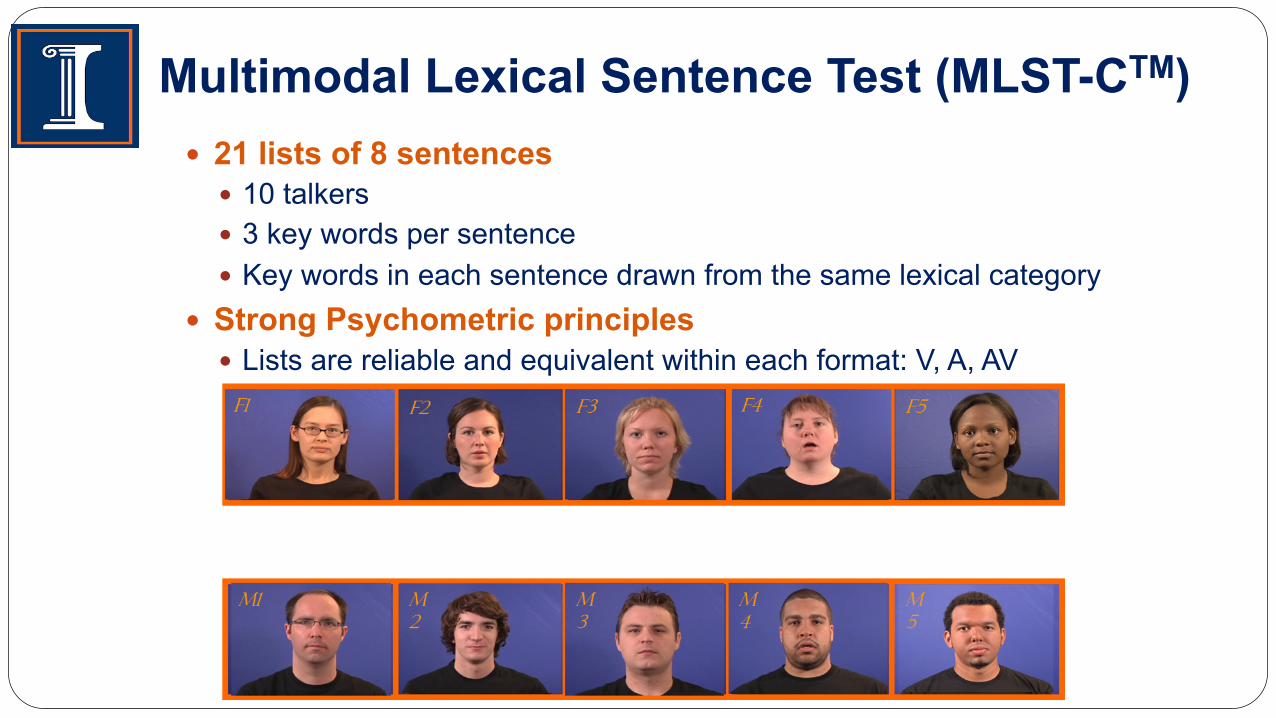
Multimodal Lexical Sentence Test (MLST-CTM) � 21 lists of 8 sentences
� 10 talkers � 3 key words per sentence � Key words in each sentence drawn from the same lexical category
� Strong Psychometric principles � Lists are reliable and equivalent within each format: V, A, AV

Purposes � To examine performance in quiet in children with cochlear
implants or hearing aids
� To examine performance in noise as a function of � Signal-to-Noise Ratio (SNR) � Group
� CI only � CI + HA
� To evaluate AV enhancement as a function of SNR
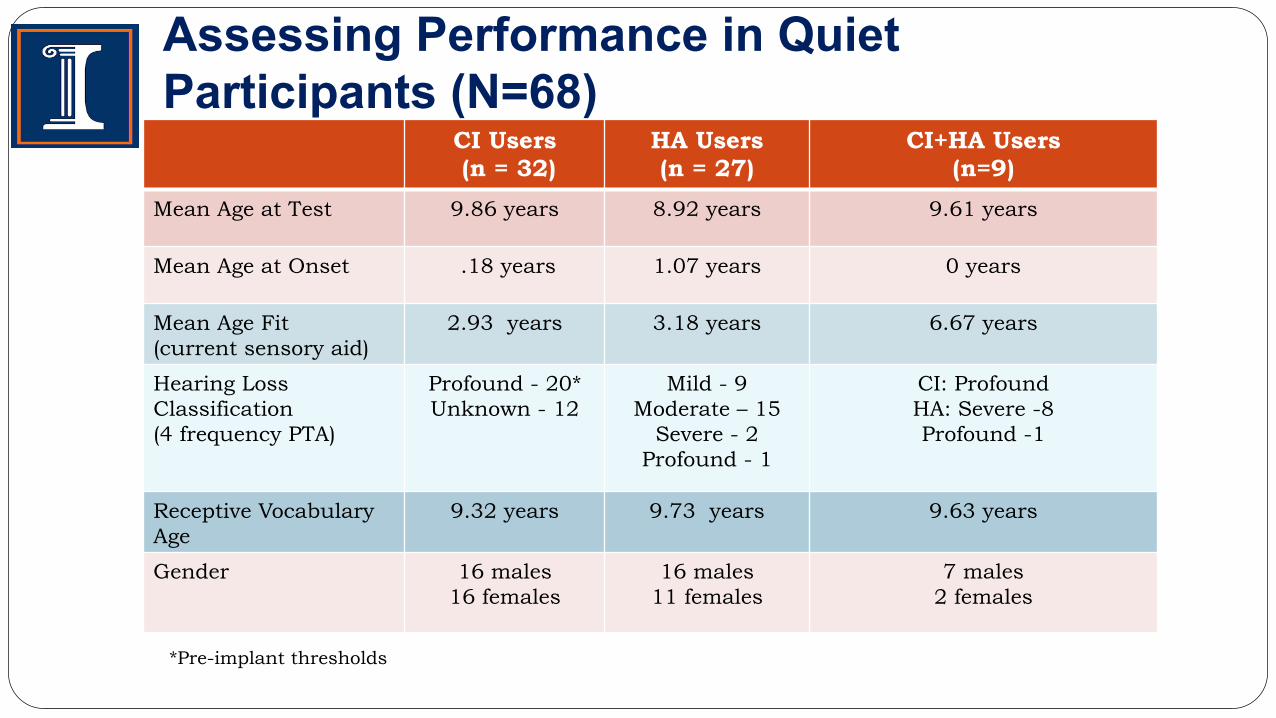
CI Users (n = 32)
HA Users (n = 27)
CI+HA Users (n=9)
Mean Age at Test 9.86 years 8.92 years 9.61 years
Mean Age at Onset .18 years 1.07 years 0 years
Mean Age Fit (current sensory aid)
2.93 years 3.18 years 6.67 years
Hearing Loss Classification (4 frequency PTA)
Profound - 20* Unknown - 12
Mild - 9 Moderate – 15
Severe - 2 Profound - 1
CI: Profound HA: Severe -8 Profound -1
Receptive Vocabulary Age
9.32 years 9.73 years 9.63 years
Gender 16 males 16 females
16 males 11 females
7 males 2 females
Assessing Performance in Quiet Participants (N=68)
*Pre-implant thresholds

Methods � All MLSTTM lists administered twice � Every participant tested in all 3 presentation formats
� 1/3 Visual Only � 1/3 Auditory Only � 1/3 Auditory + Visual
� Additional auditory only testing � Isolated word recognition (PBK) � 2 lists of HINT-C
� Procedures � Speech presented at 60 dB SPL in quiet
� Verbal responses scored as percent correct
� Receptive Vocabulary assessed using PPVT

Results: Multimodal Sentence Recognition

Auditory-Only Speech Recognition

Performance in Noise: CI Participants (n=20)
CI (n=14) CI+HA (n=6)
Mean Age at Test 12.1 yrs 9.8 yrs
Mean Age at Implantation 3.2 yrs 5.5 yrs
Mean Length of Device Use 9.9 yrs 4.5 yrs
Type of CI
Freedom (n=5) CI24M (n=5) CI24R (n=1)
Countour (n=3)
Hybrid L24 (n=2) Contour (n=1) Freedom (n=2)
CI512 (n=1)
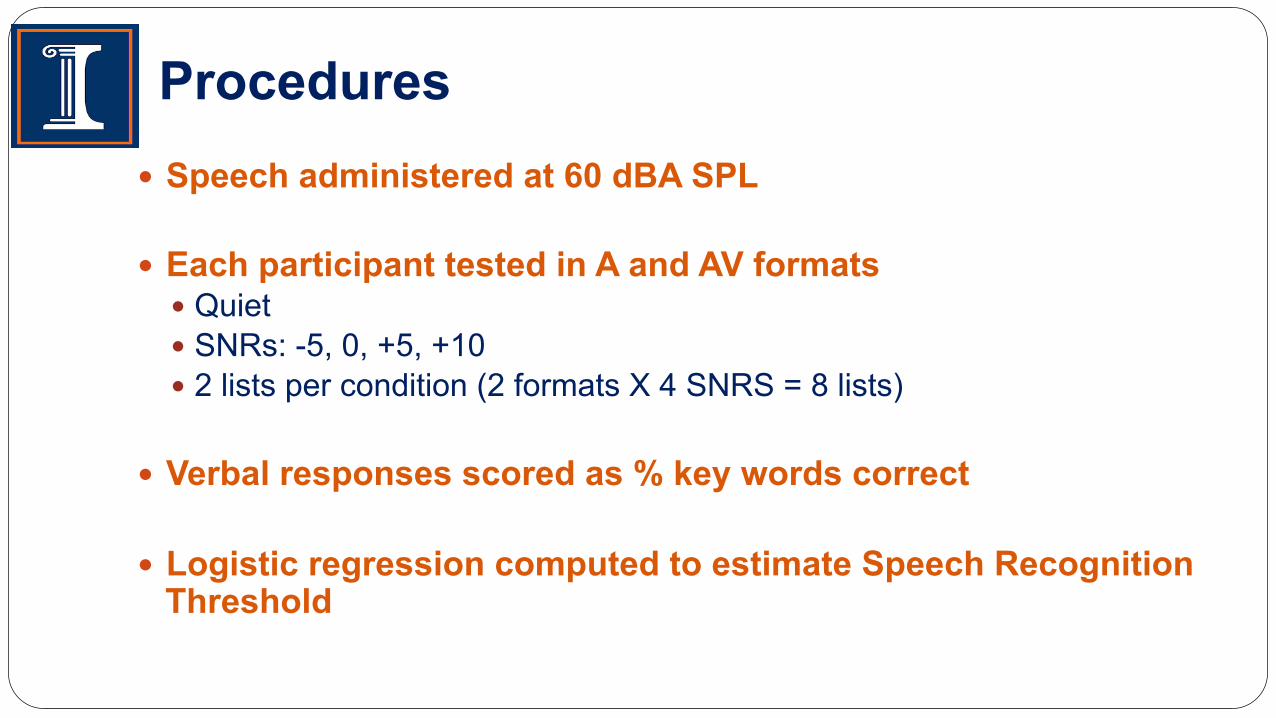
Procedures � Speech administered at 60 dBA SPL
� Each participant tested in A and AV formats � Quiet � SNRs: -5, 0, +5, +10 � 2 lists per condition (2 formats X 4 SNRS = 8 lists)
� Verbal responses scored as % key words correct
� Logistic regression computed to estimate Speech Recognition Threshold

Results
0
10
20
30
40
50
60
70
80
90
100
0 5 10 Q 0 5 10 Q
CI CI+HA
Perc
ent C
orre
ct
Signal-to-Noise Ratio
A
AV

Results: SRT
0.0
10.0
20.0
30.0
40.0
50.0
60.0
70.0
80.0
90.0
100.0
0 5 10
Perc
ent C
orre
ct
Signal-to-Noise Ratio
CI
0.0
10.0
20.0
30.0
40.0
50.0
60.0
70.0
80.0
90.0
100.0
0 5 10
Perc
ent C
orre
ct
Signal-to-Noise Ratio
CI + HA
A
AV
CI CI + HA A only 2.8 dB -0.6 dB
A + V -8.5 dB -13.1 dB

Audiovisual Gain
Ra = (AV-A)/(100-A)
� Relative gain in accuracy in AV condition relative to A only
� Used by Lachs et al. (2001) to examine AV speech perception in children with CIs

Ra by SNR
0.00
0.10
0.20
0.30
0.40
0.50
0.60
0.70
0 5 10 Q
Ra
Signal-to-Noise Ratio

Conclusions
� The MLST-CTM � Incorporates "real-world” stimulus variability
� Multiple talkers � Different presentation formats
� Is a more sensitive measure of performance than traditional tests
� The addition of visual cues enhances speech perception � Largest improvements at poorer signal-to-noise ratios
� Not all children show similar benefit � Enhancement is larger for children with acoustic low frequency hearing
� Future testing to examine factors related to AV enhancement