multi-objective success factor analysis for it based startups
TRANSCRIPT
Nithish Hulikanthe Math
Multi-Objective Success FactorAnalysis for IT based Startups

FACULTY OF COMPUTER SCIENCE
Master Thesis
Multi-Objective Success Factor Analysis for ITbased Startups
Author: Nithish Hulikanthe Math
Professor: Prof. Dr. Sanaz Mostaghim
Supervisor and Examiner: Prof. Dr. Sanaz Mostaghim
Examiner: Prof. Dr. André Presse,University of Bolzano, Italy
Winter term 2016/2017

Nithish Hulikanthe Math: Multi-Objective Success Factor Anal-ysis for IT based StartupsOtto-von-Guericke-UniversitätMagdeburg, 2016/2017.
Abstract
In this thesis, data set consisting of information regarding various phases ofthe new firm creation process of a number of IT based start-up companies aresubjected to the application of the modern method of computational science,multi-objective optimization. The dataset with a number of variables is sortedbased on certain objectives to identify successful start-ups. These start-upsare analyzed to determine the success factors responsible for the success ofthe companies. The identified success factors are further analyzed to measurethe performance of one objective over the other. The analysis resulted ininteresting facts from the most successful companies compared to the leastsuccessful companies.
I


Acknowledgement
First and foremost, I would like to express my deepest gratitude to Prof. Dr.Sanaz Mostaghim for providing me with this incredible opportunity to conductmy Master thesis at the department of Intelligent Systems, Otto von GuerickeUniversity Magdeburg. Also, I thank Prof. Sanaz for being my supervisor andmentor through out the thesis work guiding and supporting me with invaluableinsights in achieving the results.
I would also like to thank my parents, Aruna Himachal and Himachal H Mfor the financial and emotional support during the entire study program. Andlast but not the least, I would like to thank my brother and my friends forbeing there for me at every stage of my studies.
III

Contents
List of Figures VII
List of Tables IX
List of Acronyms XI
1. Introduction 1
2. Proposed Approach 32.1. Independent Variables . . . . . . . . . . . . . . . . . . . . . . . 32.2. Performance Measures . . . . . . . . . . . . . . . . . . . . . . . 4
3. PSED Dataset 73.1. PSED OUTCOME . . . . . . . . . . . . . . . . . . . . . . . . . 8
3.1.1. PSED Screener . . . . . . . . . . . . . . . . . . . . . . . 103.1.2. STATUS OF BUSINESS . . . . . . . . . . . . . . . . . . 103.1.3. TYPE AND LOCATION OF BUSINESS . . . . . . . . . 103.1.4. LEGAL FORM OF BUSINESS . . . . . . . . . . . . . . 113.1.5. START-UP ACTIVITIES . . . . . . . . . . . . . . . . . 113.1.6. START-UP FINANCES . . . . . . . . . . . . . . . . . . 123.1.7. ATTITUDES TOWARD COMPETITION . . . . . . . . 123.1.8. OWNERS, KEY NON-OWNERS, AND HELPERS . . . 133.1.9. OWNER DEMOGRAPHICS . . . . . . . . . . . . . . . 133.1.10. COMMUNITY RESOURCES . . . . . . . . . . . . . . . 133.1.11. START-UP INVESTMENTS, DEBTS AND NET
WORTH . . . . . . . . . . . . . . . . . . . . . . . . . . . 143.1.12. LEGAL ENTITY START-UP INVESTMENTS, NET
WORTH . . . . . . . . . . . . . . . . . . . . . . . . . . . 14
V
Contents
3.1.13. MARKET AND COMPETITION . . . . . . . . . . . . . 15
4. Multi – Criteria Optimization 174.1. Computational science and its potential . . . . . . . . . . . . . . 174.2. Multi-criteria optimization . . . . . . . . . . . . . . . . . . . . . 174.3. Multi-Objective Optimization Problem . . . . . . . . . . . . . . 18
4.3.1. The concept of Domination . . . . . . . . . . . . . . . . 194.3.2. Pareto Optimality and Pareto Optimal Fronts . . . . . . 19
4.4. Non-Dominated Sorting . . . . . . . . . . . . . . . . . . . . . . 204.4.1. Non-Dominated Sorting Algorithm . . . . . . . . . . . . 21
5. Analysis 255.1. Software used . . . . . . . . . . . . . . . . . . . . . . . . . . . . 255.2. Method used for Analysis . . . . . . . . . . . . . . . . . . . . . 28
5.2.1. Intra front analysis . . . . . . . . . . . . . . . . . . . . . 285.2.2. Inter Front Analysis . . . . . . . . . . . . . . . . . . . . 35
6. Conclution and Future Work 436.1. Conclution . . . . . . . . . . . . . . . . . . . . . . . . . . . . . . 436.2. Future Work . . . . . . . . . . . . . . . . . . . . . . . . . . . . . 44
Appendices 45
A. PSED Dataset Variables 47
B. Variable values 51
Bibliography 70
VI
List of Figures
2.1. Success Factors [Curtin, 2012] . . . . . . . . . . . . . . . . . . . 42.2. Analytical Model : Performance Measures . . . . . . . . . . . . 4
4.1. Non-Dominated Sorting Example . . . . . . . . . . . . . . . . . 204.2. First set of solutions . . . . . . . . . . . . . . . . . . . . . . . . 224.3. Second set of solutions . . . . . . . . . . . . . . . . . . . . . . . 234.4. Non-Dominated Sorting of Start-up Companies . . . . . . . . . 23
5.1. Pareto Fronts Representation . . . . . . . . . . . . . . . . . . . 265.2. Pareto Front 10 . . . . . . . . . . . . . . . . . . . . . . . . . . . 275.3. Pareto Optimal Front . . . . . . . . . . . . . . . . . . . . . . . . 275.4. Cases considered for Analysis . . . . . . . . . . . . . . . . . . . 29
VII


List of Tables
5.1. Front 1 vs 17 case 1 Analysis . . . . . . . . . . . . . . . . . . . . 365.2. Front 1 vs 17 case 2 Analysis . . . . . . . . . . . . . . . . . . . . 385.3. Front 1 vs 17 case 3 Analysis . . . . . . . . . . . . . . . . . . . . 40
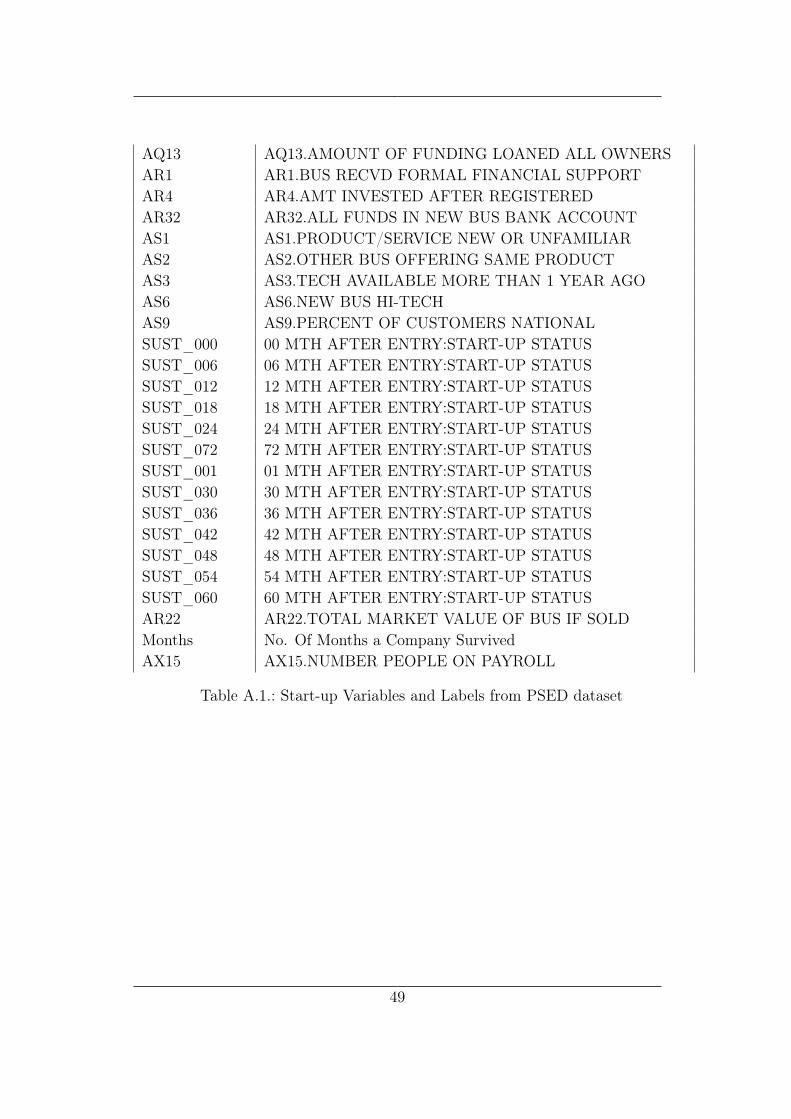
A.1. Start-up Variables and Labels from PSED dataset . . . . . . . . 49
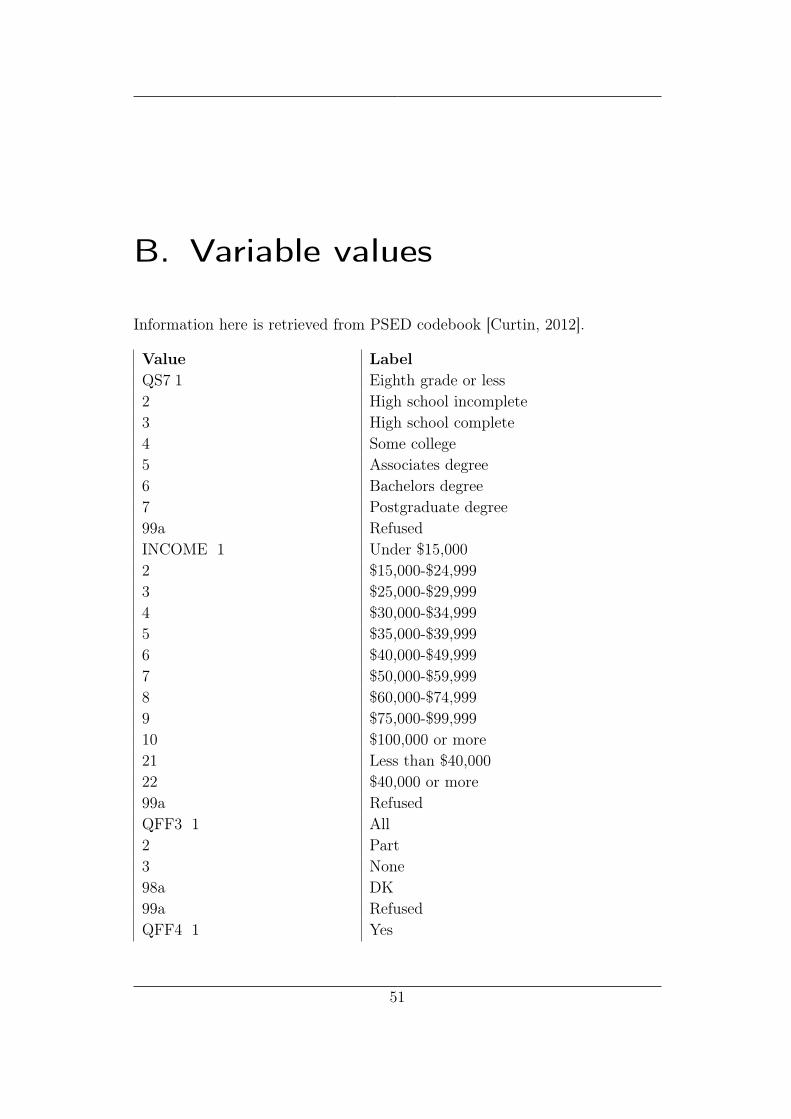
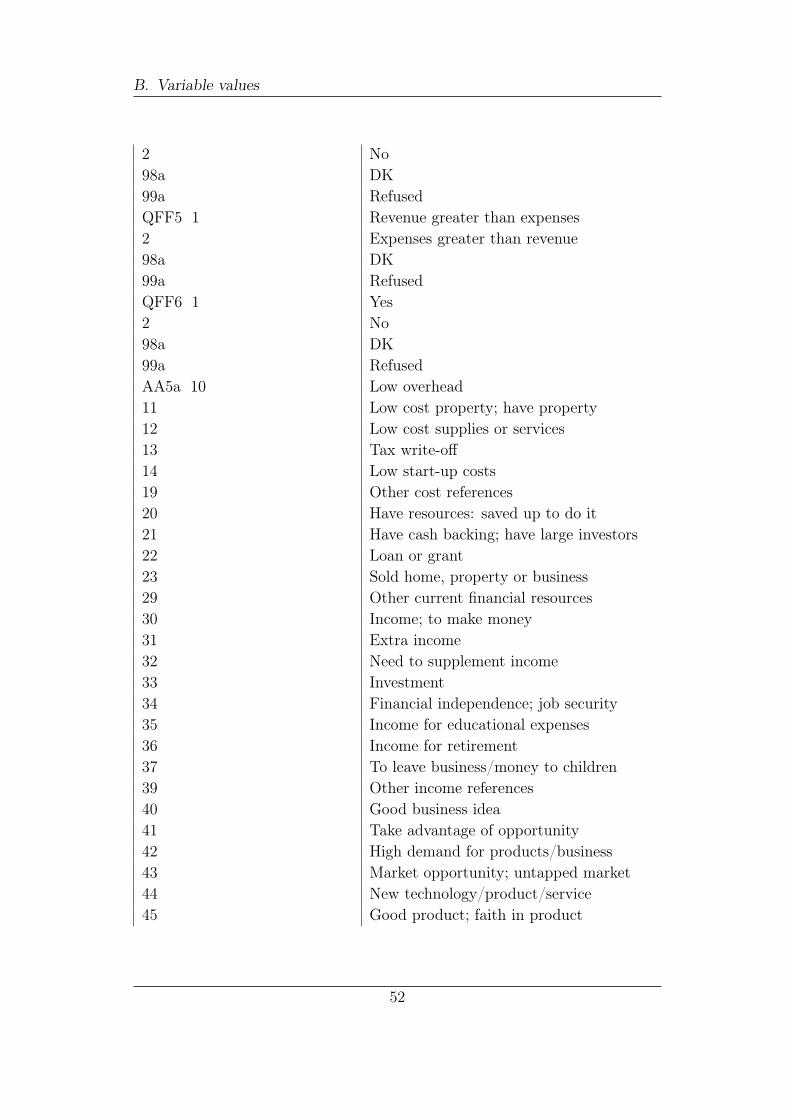
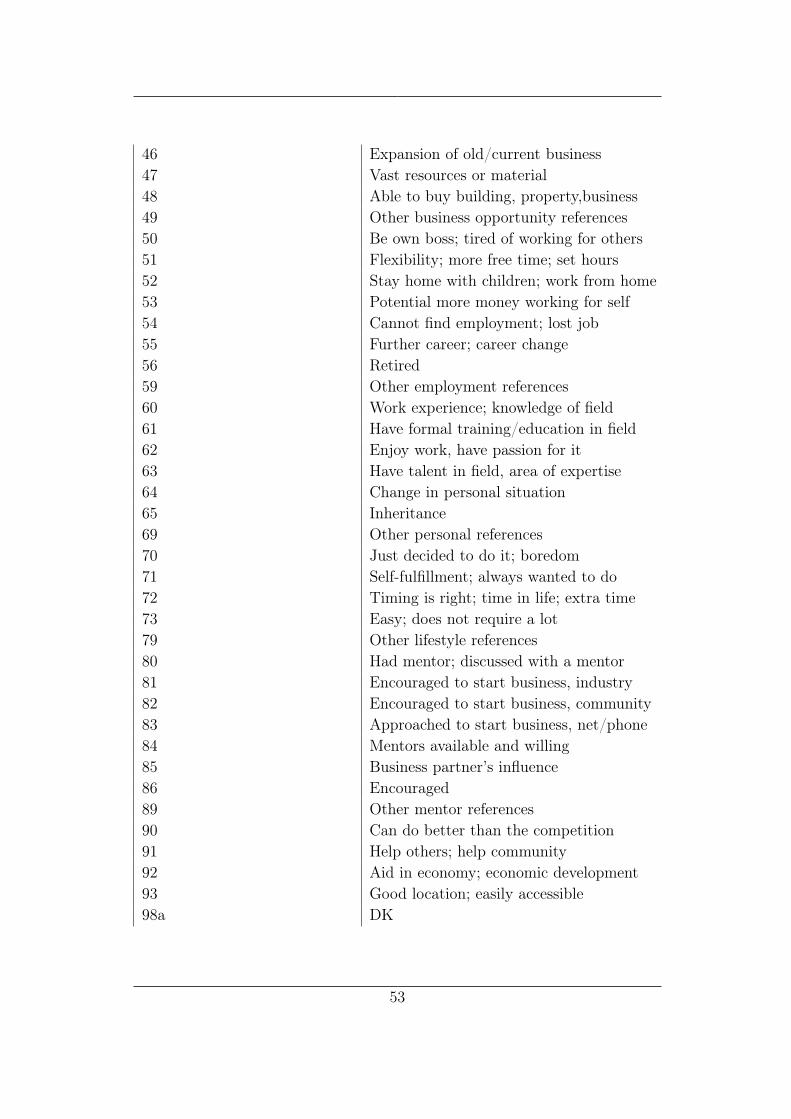
B.1. Start-up Variables and Value ranges from PSED dataset . . . . 67
IX


List of Acronyms
PSED - Panel Study Of Entrepreneurial DynamicsSPSS - Statistical Package for the Social SciencesOR - Operation ResearchSAS - Statistical Analysis System
XI

1. Introduction
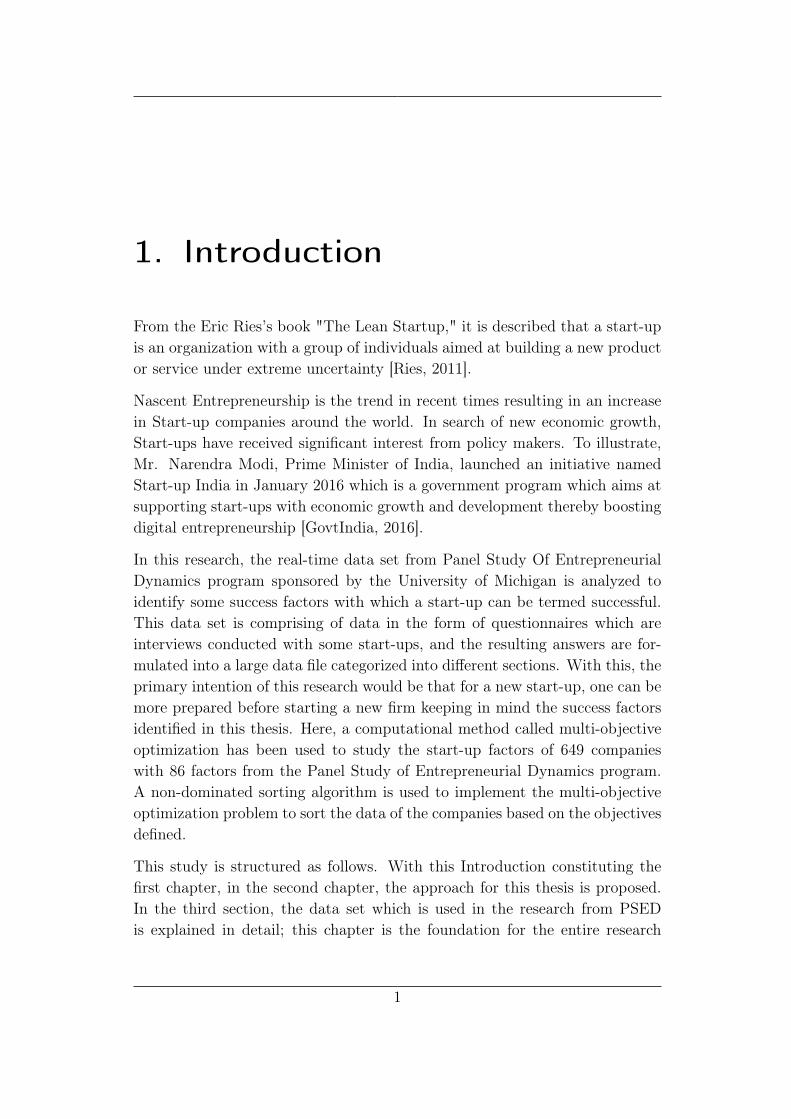
From the Eric Ries’s book "The Lean Startup," it is described that a start-upis an organization with a group of individuals aimed at building a new productor service under extreme uncertainty [Ries, 2011].
Nascent Entrepreneurship is the trend in recent times resulting in an increasein Start-up companies around the world. In search of new economic growth,Start-ups have received significant interest from policy makers. To illustrate,Mr. Narendra Modi, Prime Minister of India, launched an initiative namedStart-up India in January 2016 which is a government program which aims atsupporting start-ups with economic growth and development thereby boostingdigital entrepreneurship [GovtIndia, 2016].
In this research, the real-time data set from Panel Study Of EntrepreneurialDynamics program sponsored by the University of Michigan is analyzed toidentify some success factors with which a start-up can be termed successful.This data set is comprising of data in the form of questionnaires which areinterviews conducted with some start-ups, and the resulting answers are for-mulated into a large data file categorized into different sections. With this, theprimary intention of this research would be that for a new start-up, one can bemore prepared before starting a new firm keeping in mind the success factorsidentified in this thesis. Here, a computational method called multi-objectiveoptimization has been used to study the start-up factors of 649 companieswith 86 factors from the Panel Study of Entrepreneurial Dynamics program.A non-dominated sorting algorithm is used to implement the multi-objectiveoptimization problem to sort the data of the companies based on the objectivesdefined.
This study is structured as follows. With this Introduction constituting thefirst chapter, in the second chapter, the approach for this thesis is proposed.In the third section, the data set which is used in the research from PSEDis explained in detail; this chapter is the foundation for the entire research
1

1. Introduction
as the dataset described is the sole data utilized for the complete research.Then in the fourth chapter, the computational science method: Multi-objectiveoptimization is introduced followed by the non-dominated sorting algorithmused in this study to sort all the data for analysis. In chapter five, Analysis ofthe data set is conducted based on Multi-criteria optimization1 and obtainedresults from the non-dominated sorting algorithm. Research is concluded withan outlook on future work in chapter six.
1Multi-objective optimization and Multi-criteria optimization both are used invariably
2
2. Proposed Approach
In this research, the Multi-criteria optimization phenomenon is used to ana-lyze a real-time data set. Both Multi-criteria Optimization and the real-timedataset used are explained in separate chapters. As the name indicates, inmulti-criteria optimization, more than one criteria is used to solve a prob-lem which can be minimization or maximization problem[Deb, 2001]. Andoptimization is the process of finding one or more feasible solutions which cor-respond to extreme values of one or more criteria[Deb, 2001]. Therefore, theprimary objectives used in this study for maximization are: Number of monthsa company survived and Number of employees in a company at the end of thesurvival period. Here we further build our model to understand the approachof this study in a more precise way.
2.1. Independent Variables
The variables or the factors from the companies used in this analysis are cat-egorized as in 2.1.
3
2. Proposed Approach
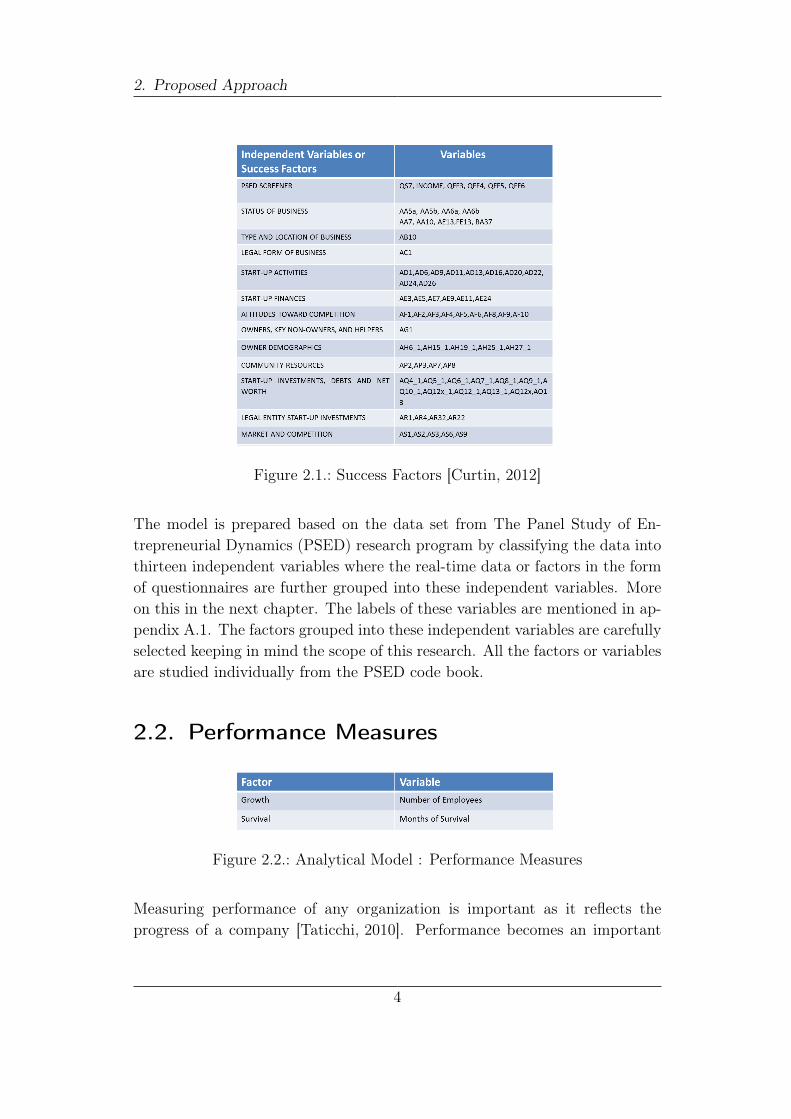
Figure 2.1.: Success Factors [Curtin, 2012]
The model is prepared based on the data set from The Panel Study of En-trepreneurial Dynamics (PSED) research program by classifying the data intothirteen independent variables where the real-time data or factors in the formof questionnaires are further grouped into these independent variables. Moreon this in the next chapter. The labels of these variables are mentioned in ap-pendix A.1. The factors grouped into these independent variables are carefullyselected keeping in mind the scope of this research. All the factors or variablesare studied individually from the PSED code book.
2.2. Performance Measures
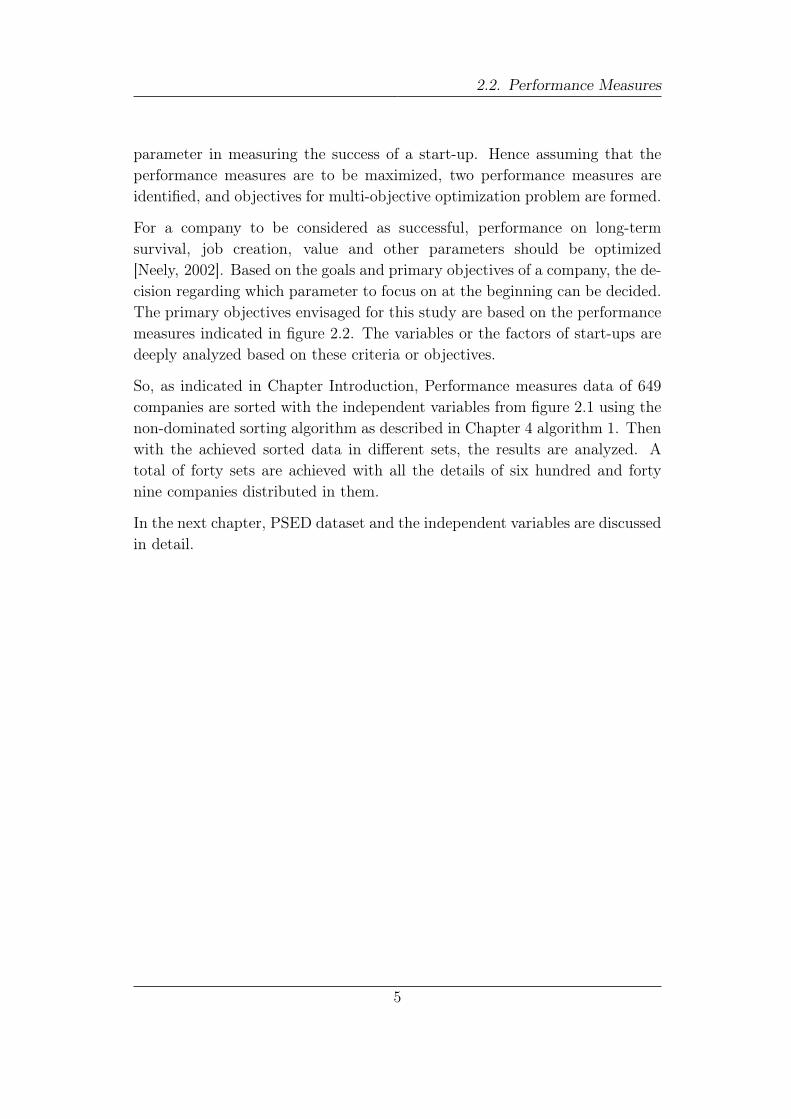
Figure 2.2.: Analytical Model : Performance Measures
Measuring performance of any organization is important as it reflects theprogress of a company [Taticchi, 2010]. Performance becomes an important
4
2.2. Performance Measures
parameter in measuring the success of a start-up. Hence assuming that theperformance measures are to be maximized, two performance measures areidentified, and objectives for multi-objective optimization problem are formed.
For a company to be considered as successful, performance on long-termsurvival, job creation, value and other parameters should be optimized[Neely, 2002]. Based on the goals and primary objectives of a company, the de-cision regarding which parameter to focus on at the beginning can be decided.The primary objectives envisaged for this study are based on the performancemeasures indicated in figure 2.2. The variables or the factors of start-ups aredeeply analyzed based on these criteria or objectives.
So, as indicated in Chapter Introduction, Performance measures data of 649companies are sorted with the independent variables from figure 2.1 using thenon-dominated sorting algorithm as described in Chapter 4 algorithm 1. Thenwith the achieved sorted data in different sets, the results are analyzed. Atotal of forty sets are achieved with all the details of six hundred and fortynine companies distributed in them.
In the next chapter, PSED dataset and the independent variables are discussedin detail.
5

3. PSED Dataset
Ewing Marion Kauffman Foundation, being a primary sponsor of the PanelStudy of Entrepreneurial Dynamics (PSED) research program, had the solepurpose of distributing knowledge and critical factors in the entrepreneurialprocess [Reynolds and Curtin, 2009]. The program focused on studying thesituations and circumstances of the people who decided to start a new ven-ture. Situations could be weather quitting a job or passion for solving aproblem and other instances which led to starting the new venture. Theprogram also tried to understand the factors which were for starting thenew venture and which factors acted as barriers in establishing a new firm[Reynolds and Curtin, 2009].
PSED takes into account each and every step right from idea gener-ation phase to subsequent stages until the creation of new company[Reynolds and Curtin, 2009]. These actions may include the creation of a busi-ness plan, marketing strategy, financial modeling, and others. However, PSEDdoes not concentrate much on the early years of the start-up. I.e. the sur-vival phase in the initial years of the start-up [Reynolds and Curtin, 2009]. Anascent enterprise is created if all the challenges and barriers are overcome.It is during the early years of the start-up that the discontinuation rate ofstart-ups is high [Reynolds and Curtin, 2009].
With the successful start of this project, Kauffman Foundation providedfunds for continuation of initial panel interviews and further research[Reynolds and Curtin, 2009]. It also decided to support second-panel projects.The data set obtained from these projects were used for analysis andalso, students and scholars used the dataset to conduct research and writetheir dissertations, books, and articles [Reynolds and Curtin, 2009]. Otherstudies followed by in other countries following the same design and pro-cedure as that of PSED resulting in further projects similar to PSED[Reynolds and Curtin, 2009]. Now countries like China, Sweden, Norway,
7
3. PSED Dataset
Austria, Canada, Netherlands have similar projects which give more op-portunities to students and scholars to conduct research all over the world[Reynolds and Curtin, 2009]. It is clear that PSED data is aimed at providinggreater opportunities for entrepreneurial and research scientists in the years tocome [Reynolds and Curtin, 2009].
3.1. PSED OUTCOME
Two projects namely Panel Study of Entrepreneurial Development I andII were conducted in U.S to study the business creation process of newfirms [Reynolds and Curtin, 2012]. First, the projects began with thescreening of samples of adults located in U.S to check if the people werestill active in the business creation process [Reynolds and Curtin, 2012].With the selected candidates from the selection, further interviews wereconducted to record the efforts and their outcome in the firm creationprocess[Reynolds and Curtin, 2012]. It is the answers of these interviews whichare converted into large sets of data files which is used in this research. Thedata files could be accessed using SPSS software.
The results of conducting such interviews were two large-scale, multi-wavedata sets [Reynolds and Curtin, 2012]. PSED I produced 1261 cases withfour waves of questionnaire and screener data amounting to 6000 variables[Reynolds and Curtin, 2012]. Out the 1261 cases, eight hundred and thirtywere nascent entrepreneurs. And PSED II produced 1214 cases with sixwaves of questionnaire and screener data resulting in eight thousand variables[Reynolds and Curtin, 2012]. In PSED II, all were nascent entrepreneurs. Itis a very tedious task to process and analyze such large amounts of data toany professional analyst. Hence, a consolidated data set is provided whichcontains 2,024 cases and one hundred and twenty-seven standardized variables[Reynolds and Curtin, 2012]. It is also reported in the outcome document thatafter six years of entry in the start-up process, forty-eight percent have quitand thirty percent have reported first profits [Reynolds and Curtin, 2012].
Panel Study Of Entrepreneurial Dynamics II is a program coordinated bySurvey Research Centre at the University of Michigan under the supervisionof co-principle investigator Paul Reynolds and Richard Curtin [Curtin, 2012].The design of screener and questionnaire of PSED were a group of researchers
8
3.1. PSED OUTCOME
working at the University [Curtin, 2012]. As said earlier panel participantswere identified before the launch of their new business based on screener ques-tions and these companies were tracked during every stage from launch to birthor death of a start-up [Curtin, 2012].
In this research, 649 cases have been selected with a range of companies whichcan be categorized into number of months a company survived and number ofemployees a company had until it quit or survived. Since the dataset includedtoo many businesses that survived for a very minimum period or had very feweremployees, these cases have not been considered to draw a meaningful analysisusing multi-objective optimization. Also, for the purpose of Multi-criteriaoptimization (which will be explained in detail in a later chapter) eighty-sixvariables are considered from the dataset which can be grouped under thirteenIndependent variables or success factors of our research.
From the PSED code book [Curtin, 2012], The thirteen independent variablesare:
• PSED SCREENER
• STATUS OF BUSINESS
• TYPE AND LOCATION OF BUSINESS
• LEGAL FORM OF BUSINESS
• START-UP ACTIVITIES
• START-UP FINANCES
• ATTITUDES TOWARD COMPETITION
• OWNERS, KEY NON-OWNERS, AND HELPERS
• OWNER DEMOGRAPHICS
• COMMUNITY RESOURCES
• START-UP INVESTMENTS, DEBTS AND NET WORTH
• LEGAL ENTITY START-UP INVESTMENTS
• MARKET AND COMPETITION
So here, from the questionnaire in the form of variables from the PSEDdata set, the factors mentioned above are being measured through a total
9
3. PSED Dataset
of eighty-six variables. Refer A.1 for the details of the variables used inthis research. To provide a better understanding, each of the factors isintroduced to justify its use and explain how they are measured throughthe variables. All the variable information discussed here are based onthe PSED code book [Curtin, 2012].
3.1.1. PSED Screener
The PSED Screener variable gives information of the business such aseducation of the owner, income of the owner before and after deciding tostart a new business, does the owner owns part or all of the new business,did the business make progress in terms of revenue in the first six monthsof its initiation and were the salaries included in the calculation of theexpenses.
3.1.2. STATUS OF BUSINESS
It is important to consider the status of the business as an independentvariable for our research because it gives some useful insights about thefirm during the early stages of the enterprise. The status of a business isan independent variable with variables involving questionnaire from thePSED dataset which gives information such as opportunities and majorproblems faced during the start of the business, was there already an ideaor the decision to initiate a trade was the first step to start the new firmand whether the company received income from sales during the first sixmonths of the new business.
3.1.3. TYPE AND LOCATION OF BUSINESS
The type and location of a business play a crucial factor for the firm. Herethe variables corresponding to the type and location are in the form ofquestions asked to the business owners about the type of their activitieswhich can be individual, independent, franchise, take-over business. Allpossible values of all the variables are presented in B.1. Location forsome businesses plays a vital role as it defines the market of a product or
10
3.1. PSED OUTCOME
service. Hence it is important to consider these variables as the measuresof success for a company
3.1.4. LEGAL FORM OF BUSINESS
It is important to see if the legal form of business has been formallyestablished by registering with the appropriate government agency andalso sometimes it is interesting to see if a business is carrying liabilityinsurance or plans to take it in the future or if its not relevant for thefirm.
3.1.5. START-UP ACTIVITIES
In this Independent variable, information related to Start-up activitiesis obtained. Information such as:
• Is there a business plan developed during the first six months of thestart-up
• Stage of product development
• Whether promotional activities have been started
• Has the business developed any proprietary technology, processes, orprocedures that no other company can use
• Has application for patent submitted
• Are major items relevant to business purchased, leased or rented
• Have there been discussions with potential customers
• Is information regarding competitors obtained?
• Are Market opportunities defined and
• Are Financial projections developed
These variables from the PSED code book [Curtin, 2012] are imperativeto analyze the start-up performance of a company and Start-up activitiesare an important success factor for this research.
11
3. PSED Dataset
3.1.6. START-UP FINANCES
It is evident that start-ups rely heavily on external funding.It may be through investors or public financing [Cable, 2010,Oranburg, 2016].During initial years, it is common for any new prospec-tive start-up owner to use his or her personal savings to fund the business[Cole, 2009, Oranburg, 2016]. In some cases, the funds during the gesta-tion phase of a firm may be from friends and family members or otherrelatives [Alden, 2011, Oranburg, 2016]. Hence, it is important to studyfinancial activities of a start-up. Variables used in this study as describedin PSED code book[Curtin, 2012] relating to finance are as follows:
• Have the start-ups received external funding through financial institutionor other people
• credit with a supplier established
• Are there any employees working for pay during the first six months ofthe firm creation process
• How many employees or managers work for more than 35 hours a week
• Is there a bank account opened exclusively for this business in the firstsix months
3.1.7. ATTITUDES TOWARD COMPETITION
In this research, the variables involved in defining this success factor are:
• Are lower prices important for a business to be an effective competitor
• Quality products or services are important for a business to be an activecompetitor
• Serving those missed by others is important for a business to be aneffective competitor
• Being first to market a new product or service is important for a businessto be an effective competitor
• Doing a better job of marketing and promotions
• A superior location and customer convenience
12
3.1. PSED OUTCOME
• Technical or scientific expertise of the start-up team is important
• Developing new or advanced product technology or process technologyfor creating goods or services is important
3.1.8. OWNERS, KEY NON-OWNERS, ANDHELPERS
It is a well-known fact that creation of a new business involves the con-tribution of many individuals. Here one variable is considered whichdepicts if the firm is self-owned, shared with a spouse or shared withother people.
3.1.9. OWNER DEMOGRAPHICS
Owner demographics helps in understanding the characteristics of theholder, and thereby it can be considered as a very important successfactor in analyzing the start-up performance of business. Here, followinginformation from the variables is considered for the research:
• Highest level of education of the owner
• Regarding work activity is the owner working for others for pay
• What is the owner’s primary role in the new business
• Does the owner have provided training with business related tasks orskills
• Is the owner provided with physical resources, use of land, space, build-ings or equipment
3.1.10. COMMUNITY RESOURCES
In some way, the attitude of the community plays a role in the successof a firm. Following are the information extracted from the variables ofCommunity resources:
13

3. PSED Dataset
• Do the social norms and culture of a society emphasize self-sufficiency,autonomy, and personal initiative
• Do the social norms and culture of a community encourage en-trepreneurial risk-taking.
• Do state and local governments in a community provide excellent supportfor those starting new businesses
• Do Bankers and other investors in a community go out of their way tohelp new businesses get started.
3.1.11. START-UP INVESTMENTS, DEBTS ANDNET WORTH
In this independent variable, information regarding how business wasfunded, were there any loans made to start a business is obtained. Theinformation from variables is as follows:
• Funds invested from personal savings
• Funds as loans from family
• Funds as loans from friends
• Funds from credit card loans
• Personal bank loans
• Funds from asset bank loan
• Funds from other sources
• Total amount of funding
• Total amount of funding as loans
• And total amount funding and funding as loans from all owners of acompany
3.1.12. LEGAL ENTITY START-UPINVESTMENTS, NET WORTH
From this independent variable, the information regarding financial sup-port, which bank account were the funds accommodated, the net worth
14
3.1. PSED OUTCOME
of the company is obtained from a legal perspective. So here the collectedinformation is:
• Whether business received formal financial support
• Amount invested after registration
• Whether all the funds were in new business bank account
• Total market value of the business if sold
3.1.13. MARKET AND COMPETITION
There were few questions in the questionnaire which were developed keep-ing both market and competition in mind. Here variables under this cat-egory are very interesting for the analysis as it gives an overall picture ofthe mindset of the start-up team on their market and competition. Theinformation obtained from the variables is:
• Whether all/some or none of the potential customers consider the pro-duct/service as new or unfamiliar
• Whether other businesses offer same or similar product/service to thepotential customers
• Were the technology/procedures required for this product or serviceavailable more than a year ago
• Whether the new business is hi-tech
• Expectation from owners regarding the percentage of National cus-tomers(Here it is U.S) within two to three years of operation.
Apart from the variables mentioned above, a measure of these factorsis also done through thirteen variables which provide information re-garding the status of each company. By an interval of three months,thirteen variables are divided from zero months a company survived tosixty months.
Above questionnaires are answered by all the companies considered inthis research and are used in determining the start-up performance ofenterprises using multi-criteria optimization.
15

3. PSED Dataset
It is important to note that not all companies answered all the ques-tions asked. Many businesses chose to ignore some of the questions andanalysis is conducted with the available data.
16
4. Multi – ObjectiveOptimization
4.1. Computational science and its potential
Now in this chapter let us understand how computational science, multi-criteriaoptimization, in particular, can help to find the companies which may beconsidered as successful in terms of objectives defined in chapter 2.
Computational Science is a very dynamically evolving area of research whichmainly focusses on building mathematical models and quantitative analysistechniques for problem-solving in various scientific disciplines [Maxville, 2013].The evolution of computational science has led researchers and scientists toperform complex computational tasks on large data sets [Peng, 2011]. With theavailability of large public datasets, one can perform computational techniquesinstead of using traditional techniques and contribute positively in the scientificstudy fields [Peng, 2011]. Computational science will contribute significantlyin the upcoming future advances in the field of science and technology. In thisstudy, out of many computational techniques, we introduce only the conceptmulti-criteria optimization which is relevant to this study. Here we familiarizeourselves with Pareto-optimality which is the base of our research.
4.2. Multi-Objective optimization
Optimization can be defined as the task of finding one or more feasible solu-tions by minimizing or maximizing one or more objectives of a mathematicallyformulated problem [Deb, 2001].
In every area of research, problems with multiple objectives are common andfinding solutions to it has been challenging to researchers for a long time.
17
4. Multi – Objective Optimization
Despite having various approaches and techniques in Operation Research (OR)and other disciplines to handle such problems, the complexity of their solutionsgives an opportunity for other alternate solutions [Coello et al., 2007]. Onesuch alternative is the use of multi-criteria optimization.
4.3. Multi-Objective Optimization Problem
A general multi-criteria optimization problem which is to be minimized ormaximized consists of a number of objectives and is associated with a numberof inequality and equality constraints which any feasible solution must satisfy[Deb, 2001]. Mathematically from [Deb, 2001], the problem can be written asfollows:
Maximize f1(x), f2(x), ...fN(x)
Subject to x ε S(4.1)
The solution x is a p dimensional vector having p decision variables and S isthe feasible region.
Solutions to a multi-criteria optimization problem are expressed in terms ofnon-dominated points. For a maximization problem, if a vector x(1) is greaterthan vector x(2) i.e. (x(1) > x (2)). If at least one value of x(1) is greaterthan x(2) and no value of x(2) is greater than x(1), we say x(1) dominatesx(2). Also, any such member of the problem which is non-dominated belongsto the non-dominated set of solutions, also known as Pareto-optimal solutions.In the sub-section Pareto-optimality, it is further illustrated with an exam-ple. Mathematically, an optimization algorithm should be terminated once aPareto-optimal solution is reached. In Practice, it is desirable to find all thePareto-optimal solutions as the suitability of the solution depend on a numberof factors like problem environment, designer’s choice.
In this research, it is very important for the analysis to find not one Paretooptimal set of companies but many such sets called Pareto fronts which aresorted based on above said principle. Algorithm and detailed explanation aregiven in the further sections.
18
4.3. Multi-Objective Optimization Problem
4.3.1. The concept of Domination
For a maximization problem, a solution x(1) is said to dominate solution x(2),if it satisfies both the conditions stated in equation 4.2 [Deb, 2001].
1. Solution x (1) is no worse than solutionx (2) in all objectives,
orfj (x (1)) ≥ fj (x (2)) for all j = 1, 2, 3...M.
2. Solution x (1) ; is strictly; better than x (2) in atleast oneobjective,
orfj(x (1)) > fj (x (2)) for atleast one j ε {1, 2, ....M} .
(4.2)
In multi-criteria optimization, there need not be only one optimal solution buta set of equally optimal values that are identified using the above equation.The objective value of each of these solutions is not dominated by any othersolution in the feasible objective region [Deb, 2001].
4.3.2. Pareto Optimality and Pareto Optimal Fronts
For a maximization problem, the entire feasible region contains solutions. Inthose solutions, the set of solutions which are not dominated by any othermember in the feasible region is called Pareto optimal set or Global Paretooptimal set [Deb, 2001].
After finding the Pareto-optimal front, other consecutive fronts can be foundby eliminating the members of the already found Pareto-optimal front in eachiteration.
It is tough to make decisions in multi-criteria optimization as there are somesolutions in the Pareto-optimal set, where none of the solutions can be said tobe better than any other solutions of the front. It is therefore required to makea trade-off between solutions by compromising with one objective to gain inother objectives.
19
4. Multi – Objective Optimization
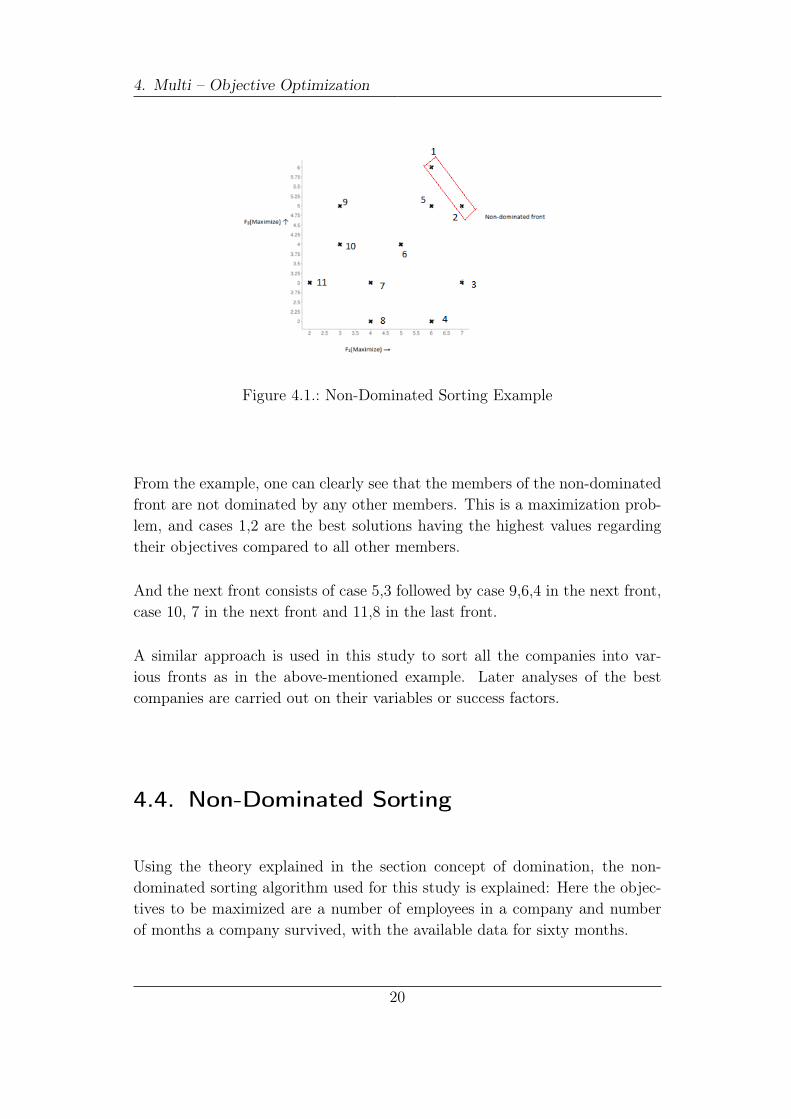
Figure 4.1.: Non-Dominated Sorting Example
From the example, one can clearly see that the members of the non-dominatedfront are not dominated by any other members. This is a maximization prob-lem, and cases 1,2 are the best solutions having the highest values regardingtheir objectives compared to all other members.
And the next front consists of case 5,3 followed by case 9,6,4 in the next front,case 10, 7 in the next front and 11,8 in the last front.
A similar approach is used in this study to sort all the companies into var-ious fronts as in the above-mentioned example. Later analyses of the bestcompanies are carried out on their variables or success factors.
4.4. Non-Dominated Sorting
Using the theory explained in the section concept of domination, the non-dominated sorting algorithm used for this study is explained: Here the objec-tives to be maximized are a number of employees in a company and numberof months a company survived, with the available data for sixty months.
20
4.4. Non-Dominated Sorting
The condition for domination is as follows:
if ((a (1) > b (1)) ∧ (a (2) ≥ b (2))) ∨ ((a (1) ≥ b (1)) ∧ (a (2) > b (2)))
a dominates b
elseif ((b (1) > a (1)) ∧ (b (2) ≥ a (2))) ∨ ((b (1) ≥ a (1)) ∧ (b (2) > a (2)))
b dominates a
(4.3)
a and b being two different companies and 1 and 2 are the objectives to bemaximized.
4.4.1. Non-Dominated Sorting Algorithm
The Non-dominated Sorting algorithm as described in the book Multi-Objective Optimization [Deb, 2001] is as follows:
Algorithm 1 Non-Dominated Sorting Algorithm [Deb, 2001]Input: Excel file with all the variables and objectives of all the companies1: procedure2: Set all non-dominated sets Pj, (j=1,2,...) as empty sets. Set non-
domination level counter j = 1.3: Initialize P’ = {1}. Set solution counter i = 2.4: Compare solution i with j from P’ for domination using equation 4.3.5: If i dominates j, delete the jth member from P’.If j <|P ’|,increment j by
one and go to step 4. Otherwise go to step 6. Alternatively, if jth memberof P’ dominates i, increment i by one and go to step 3.
6: Insert i in P’. If i< N, increment i by one and go to step 3. Otherwise,stop and declare P’ as the non-dominated set of Population P.
7: Update Pj = P’ and P = P’.8: If P 6= 0, increment j by one and go to step 3. Otherwise, stop and
declare all non-dominated sets Pj, for i = 1,2,..,j.
Output : Complete Excel file sorted according to equation 4.3 in 40 fronts
With the data of six hundred and forty nine companies, the non-dominationlevel counter of non-dominated empty sets is set to one.
21
4. Multi – Objective Optimization
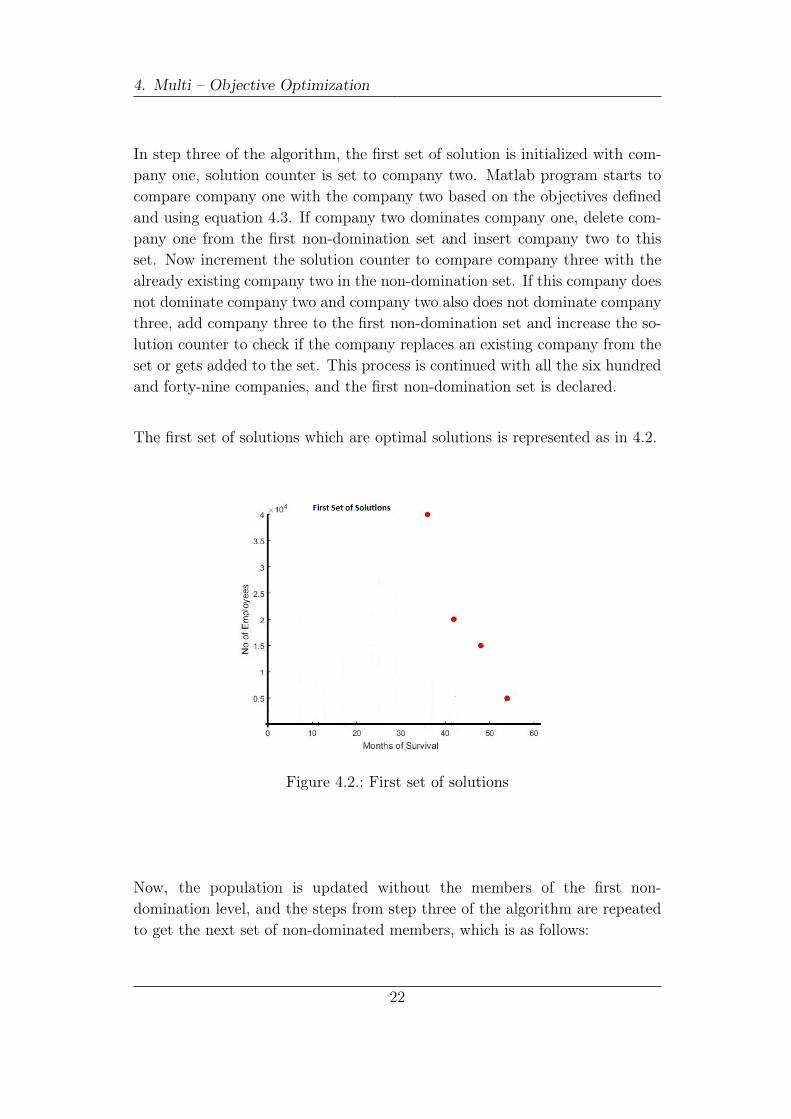
In step three of the algorithm, the first set of solution is initialized with com-pany one, solution counter is set to company two. Matlab program starts tocompare company one with the company two based on the objectives definedand using equation 4.3. If company two dominates company one, delete com-pany one from the first non-domination set and insert company two to thisset. Now increment the solution counter to compare company three with thealready existing company two in the non-domination set. If this company doesnot dominate company two and company two also does not dominate companythree, add company three to the first non-domination set and increase the so-lution counter to check if the company replaces an existing company from theset or gets added to the set. This process is continued with all the six hundredand forty-nine companies, and the first non-domination set is declared.
The first set of solutions which are optimal solutions is represented as in 4.2.
Figure 4.2.: First set of solutions
Now, the population is updated without the members of the first non-domination level, and the steps from step three of the algorithm are repeatedto get the next set of non-dominated members, which is as follows:
22
4.4. Non-Dominated Sorting
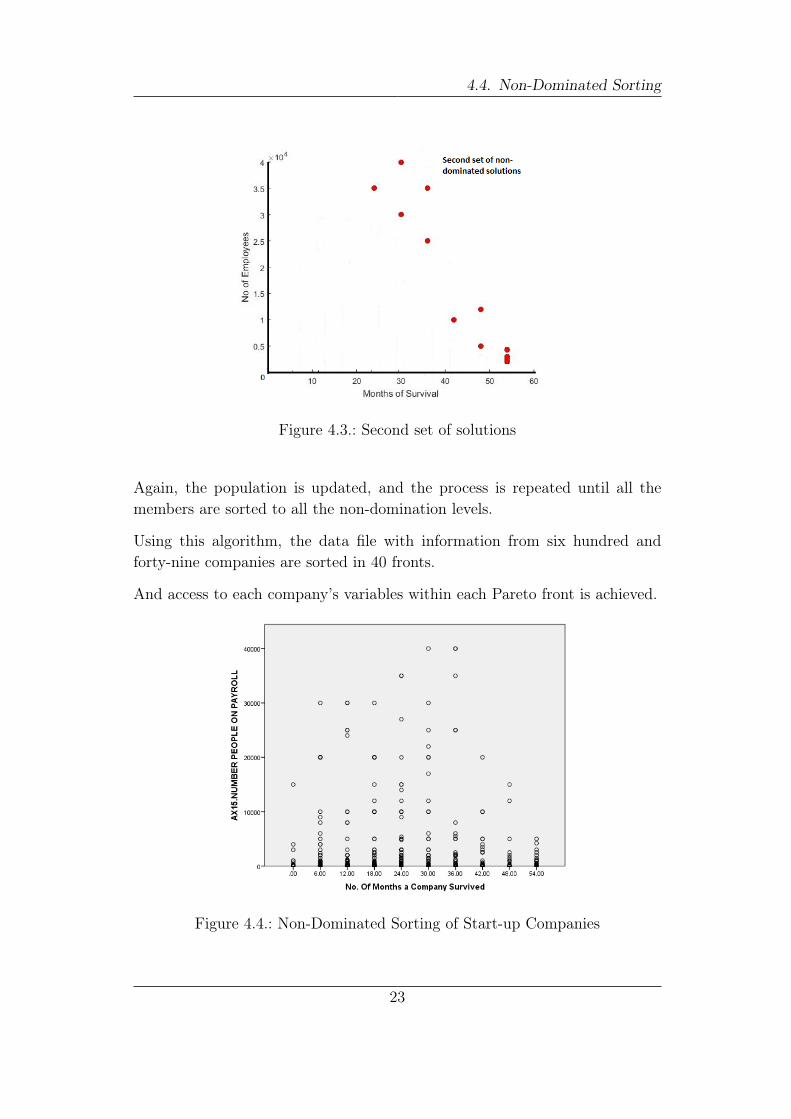
Figure 4.3.: Second set of solutions
Again, the population is updated, and the process is repeated until all themembers are sorted to all the non-domination levels.
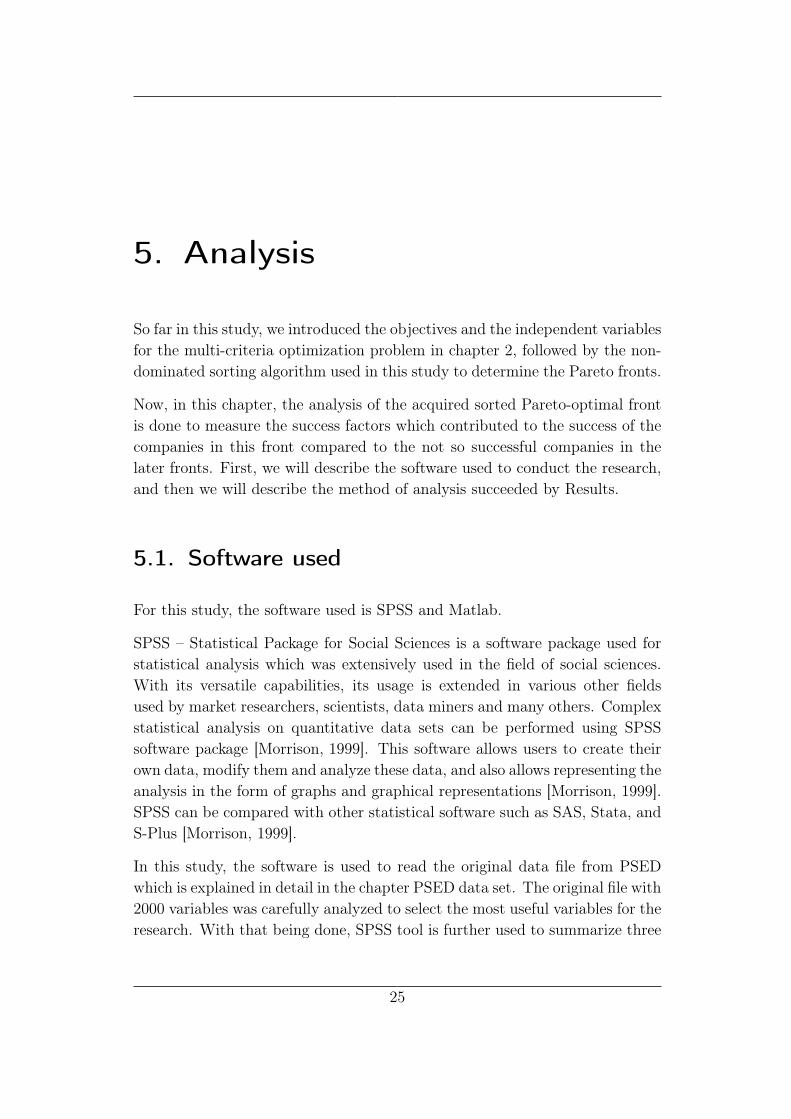
Using this algorithm, the data file with information from six hundred andforty-nine companies are sorted in 40 fronts.
And access to each company’s variables within each Pareto front is achieved.
Figure 4.4.: Non-Dominated Sorting of Start-up Companies
23

4. Multi – Objective Optimization
Figure 4.4 shows all the companies plotted with respect to their objectives.
In the chapter Analysis, we can see Pareto-Optimal fronts and other Paretofronts with their detailed analysis.
24
5. Analysis
So far in this study, we introduced the objectives and the independent variablesfor the multi-criteria optimization problem in chapter 2, followed by the non-dominated sorting algorithm used in this study to determine the Pareto fronts.
Now, in this chapter, the analysis of the acquired sorted Pareto-optimal frontis done to measure the success factors which contributed to the success of thecompanies in this front compared to the not so successful companies in thelater fronts. First, we will describe the software used to conduct the research,and then we will describe the method of analysis succeeded by Results.
5.1. Software used
For this study, the software used is SPSS and Matlab.
SPSS – Statistical Package for Social Sciences is a software package used forstatistical analysis which was extensively used in the field of social sciences.With its versatile capabilities, its usage is extended in various other fieldsused by market researchers, scientists, data miners and many others. Complexstatistical analysis on quantitative data sets can be performed using SPSSsoftware package [Morrison, 1999]. This software allows users to create theirown data, modify them and analyze these data, and also allows representing theanalysis in the form of graphs and graphical representations [Morrison, 1999].SPSS can be compared with other statistical software such as SAS, Stata, andS-Plus [Morrison, 1999].
In this study, the software is used to read the original data file from PSEDwhich is explained in detail in the chapter PSED data set. The original file with2000 variables was carefully analyzed to select the most useful variables for theresearch. With that being done, SPSS tool is further used to summarize three
25
5. Analysis
companies from each front to conduct an inter-front and intra-front analysiswhich will be explained more in detail in this chapter.
Matlab - The selected variables from the PSED dataset in SPSS is then ex-ported into an Excel file for use in Matlab for implementing the non-dominatedsorting algorithm.
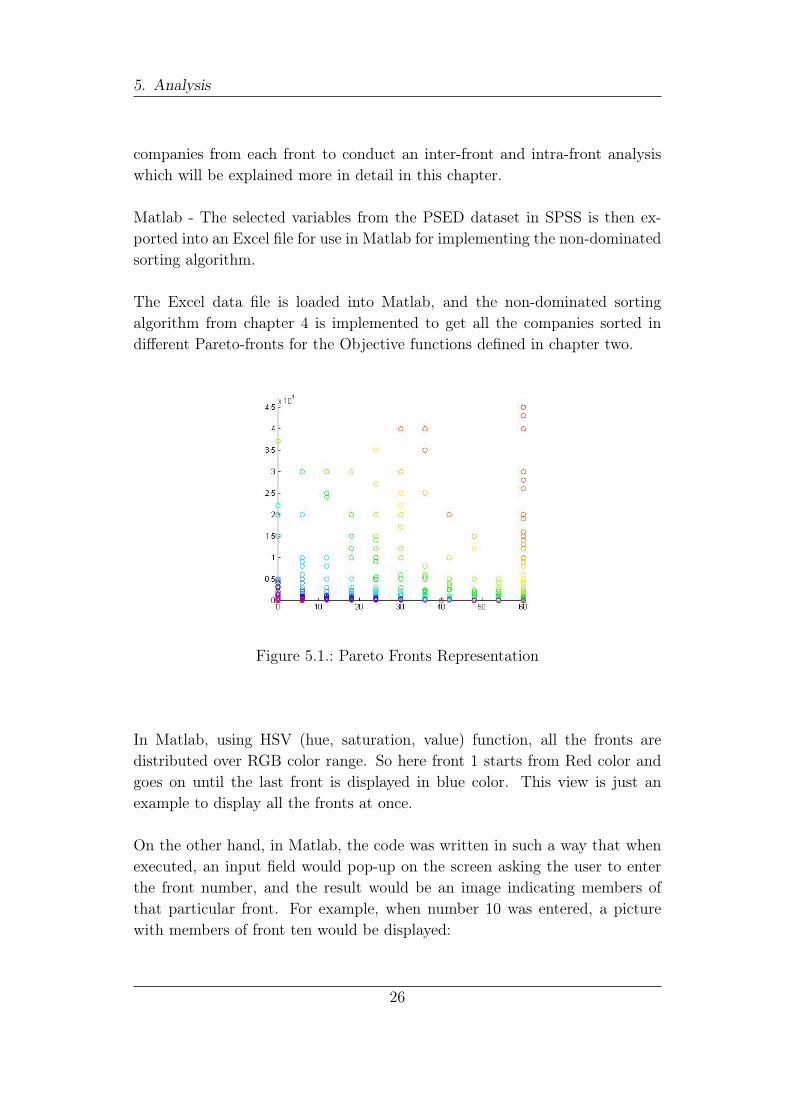
The Excel data file is loaded into Matlab, and the non-dominated sortingalgorithm from chapter 4 is implemented to get all the companies sorted indifferent Pareto-fronts for the Objective functions defined in chapter two.
Figure 5.1.: Pareto Fronts Representation
In Matlab, using HSV (hue, saturation, value) function, all the fronts aredistributed over RGB color range. So here front 1 starts from Red color andgoes on until the last front is displayed in blue color. This view is just anexample to display all the fronts at once.
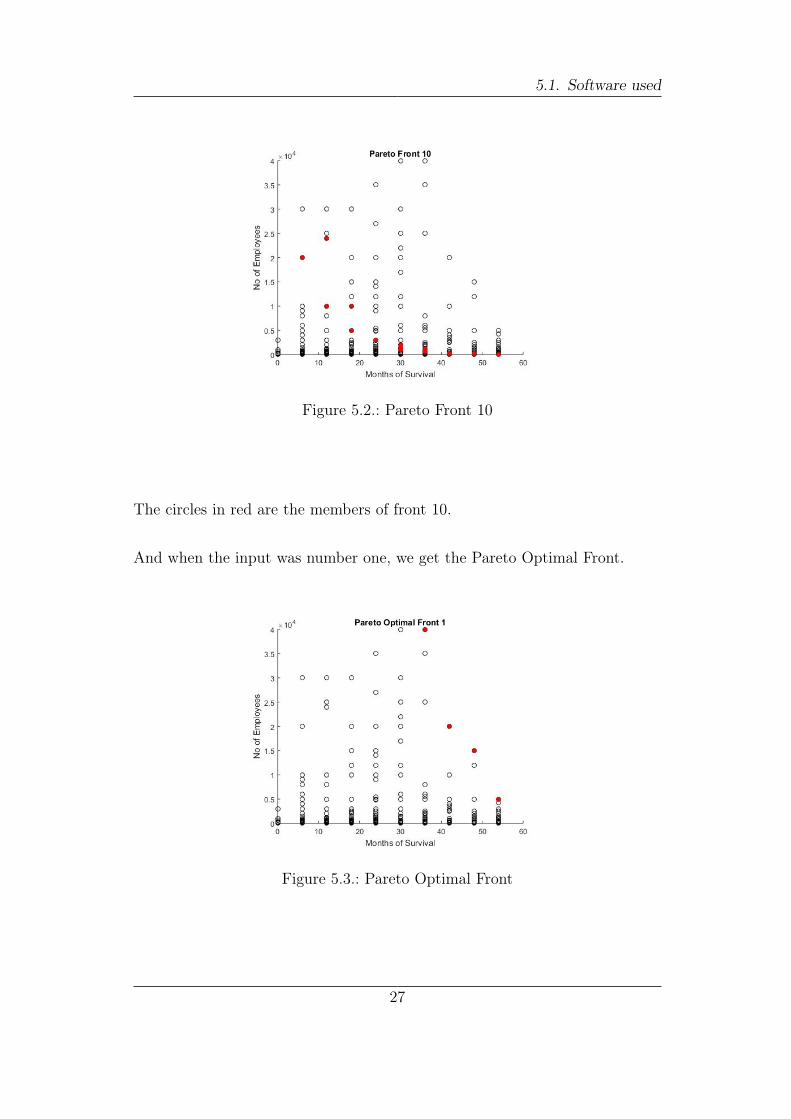
On the other hand, in Matlab, the code was written in such a way that whenexecuted, an input field would pop-up on the screen asking the user to enterthe front number, and the result would be an image indicating members ofthat particular front. For example, when number 10 was entered, a picturewith members of front ten would be displayed:
26
5.1. Software used
Figure 5.2.: Pareto Front 10
The circles in red are the members of front 10.
And when the input was number one, we get the Pareto Optimal Front.
Figure 5.3.: Pareto Optimal Front
27
5. Analysis
5.2. Method used for Analysis
Two approaches are used for in-depth analysis of fronts 1 and front 17 asone being the optimal front other being the front with very poor performingcompanies. And front 17 is considered as not much of a difference is seenfrom front 17 to front 40. I.e. all the members or the companies in thesefronts are not very successful, and hence it makes sense to analyze successfactors for front one compared to front 17. But as a future work, if one wouldlike to analyze details from other fronts, one can do it as all the informationpertaining to other members of other fronts can be retrieved quickly. The twoapproaches are:
1. Intra front analysis
2. Inter front analysis
5.2.1. Intra front analysis
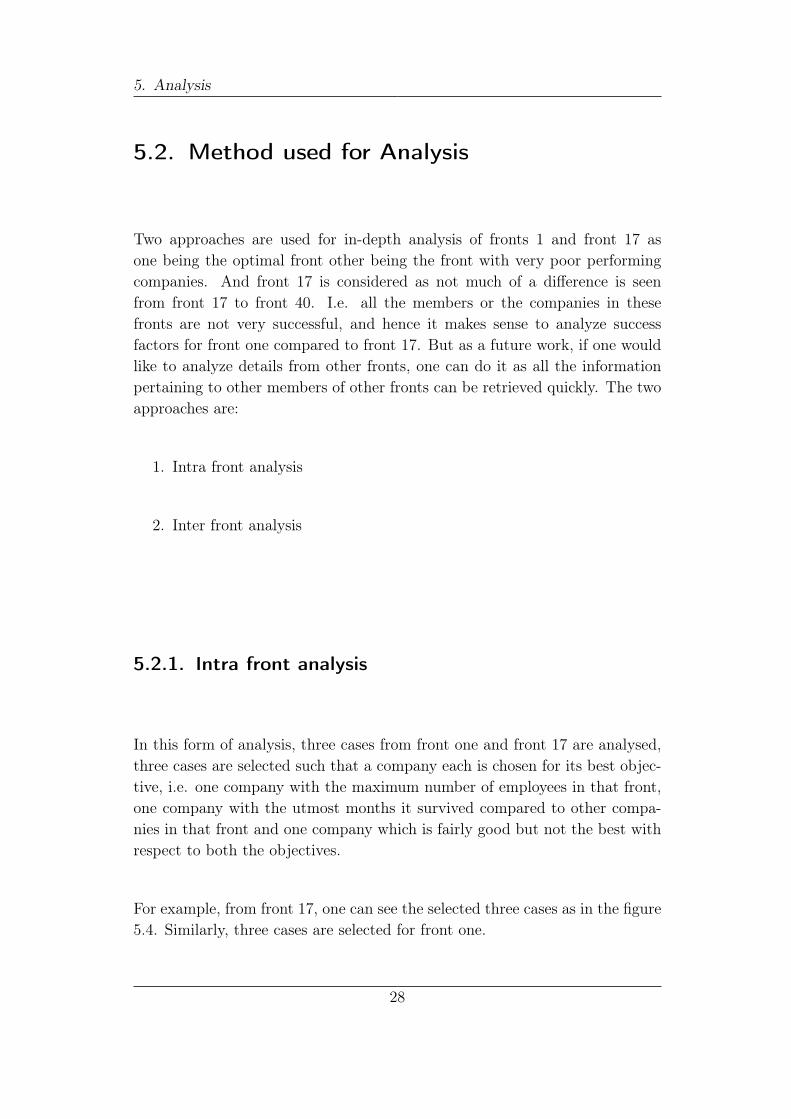
In this form of analysis, three cases from front one and front 17 are analysed,three cases are selected such that a company each is chosen for its best objec-tive, i.e. one company with the maximum number of employees in that front,one company with the utmost months it survived compared to other compa-nies in that front and one company which is fairly good but not the best withrespect to both the objectives.
For example, from front 17, one can see the selected three cases as in the figure5.4. Similarly, three cases are selected for front one.
28
5.2. Method used for Analysis
Figure 5.4.: Cases considered for Analysis
Now, in Intra-front analysis, the analysis is done in three steps:
1. Common variable of all the three cases are identified within front one
2. Unique features of each instance is outlined
3. Summary is drawn from the analysis
A similar structure is followed for front seventeen.
Common variables from all the three cases in Front one
1. Owners of all three cases are post graduates
2. All Business being owned by single Owner
3. Independent Business creation type
4. Agree that Quality of the Product is very important to be an effectivecompetitor
5. Serving those missed by others is Important
6. The social norms and culture of the community encourage en-trepreneurial risk-taking.
29
5. Analysis
Unique features of case 2
1. Household Income was 100,000$ greater than other two cases
2. The business received income for more than six months from the firsttwelve months whereas the other two cases failed to do so.
3. Revenue is greater than expenses. Other two cases did not have revenuegreater than expenses.
4. Case two and three devoted more than 160 hours in the first twelveMonths for the Business
5. Ph.D. or equivalent degree whereas other two cases had Master’s degree
6. No Business offer same product or service.
Unique features of case 1
1. Started promotional activities in the first six months whereas case twoand three did not start.
2. First and third case started collecting information about their competi-tors in the first six months.
3. Market opportunities defined in the first six months for case one andthree.
4. Case one agreed to have their product’s price to be lower than the com-petitors for the success of the Business, but other two cases disagreedwith this.
5. Superior Location is very important whereas other cases did not agree.
6. Some of the potential customers considered the product or service newand unfamiliar
7. No Business offer same product or service
8. 35 % National Customers expected
30
5.2. Method used for Analysis
Unique features of case 3
1. Financial Projections were already developed in the first six Monthswhereas case one considered it to be important in the future, case twoconsidered it to be not relevant at this stage.
2. In terms of current work activity, not working for others for pay whereasother two cases worked for others.
3. Business received financial support after being registered as a legal entity.
4. Many Businesses offer same product or Service.
5. 90% National customers expected.
Summary
It is interesting to see that all the three owners in front one are post graduatesand social norms and culture of the community encourage entrepreneurial risk-taking. So, it can be said that social norms and the level of education can playa very crucial role for start-ups to be at their best as it influences the attitudeand mind set of owners.
Apart from this, case two with its higher financial potential and the ownerholding a Ph.D. degree and considering a product or service which is not beingoffered by any other company made good sales and was able to generate revenuegreater than expenses. With these factors, it was able to be a successful start-up although not being the best with respect to any of the objectives.
Case one started promotional activities very soon and considered it is impor-tant that product’s price should be lower than competitors and consideredsuperior location very important for their business. Hence, it can be seen thatthis company had the attitude to grow faster and expenses were made on su-perior location and revenue generated initially was low, so although, it beinga successful company, it could not survive to a greater time compared to casetwo and case three.
Case three gave priority and focused on financial projections at a very earlystage, so it could be said that this could be the main reason for it to have agreater survival rate but many other businesses offer same service or product,and therefore growth of the company with respect to its employees was notthe best compared to other cases.
31
5. Analysis
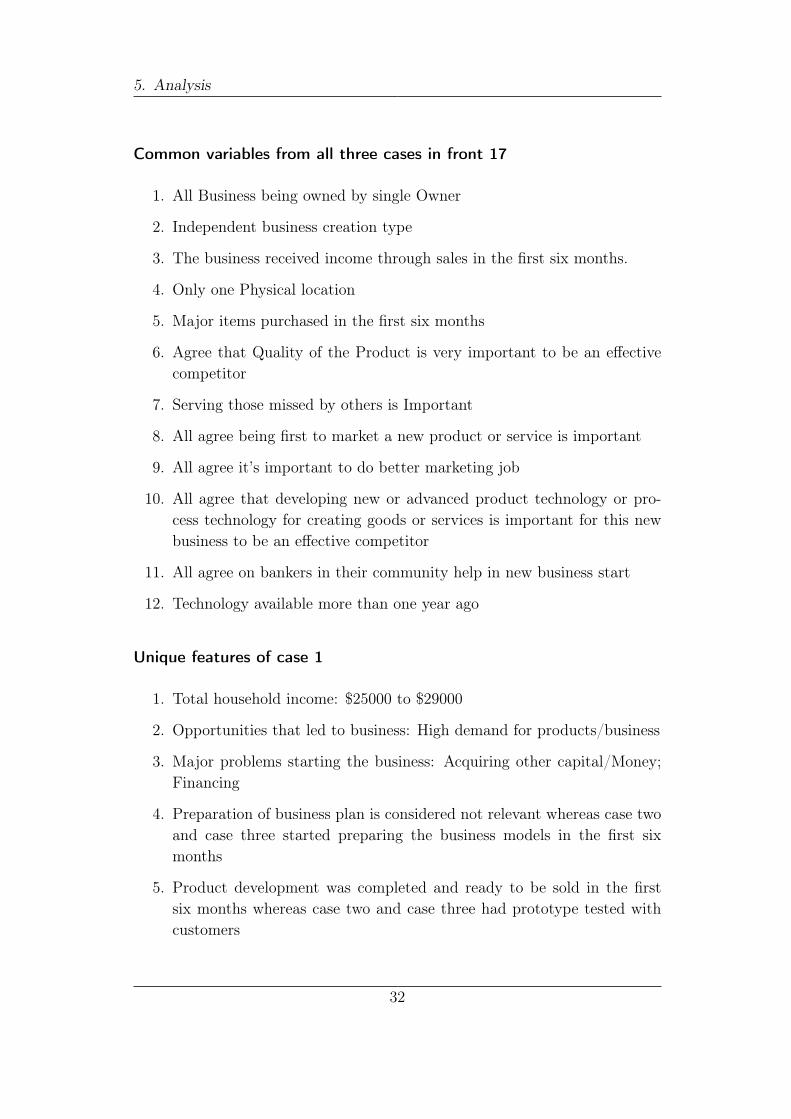
Common variables from all three cases in front 17
1. All Business being owned by single Owner
2. Independent business creation type
3. The business received income through sales in the first six months.
4. Only one Physical location
5. Major items purchased in the first six months
6. Agree that Quality of the Product is very important to be an effectivecompetitor
7. Serving those missed by others is Important
8. All agree being first to market a new product or service is important
9. All agree it’s important to do better marketing job
10. All agree that developing new or advanced product technology or pro-cess technology for creating goods or services is important for this newbusiness to be an effective competitor
11. All agree on bankers in their community help in new business start
12. Technology available more than one year ago
Unique features of case 1
1. Total household income: $25000 to $29000
2. Opportunities that led to business: High demand for products/business
3. Major problems starting the business: Acquiring other capital/Money;Financing
4. Preparation of business plan is considered not relevant whereas case twoand case three started preparing the business models in the first sixmonths
5. Product development was completed and ready to be sold in the firstsix months whereas case two and case three had prototype tested withcustomers
32
5.2. Method used for Analysis
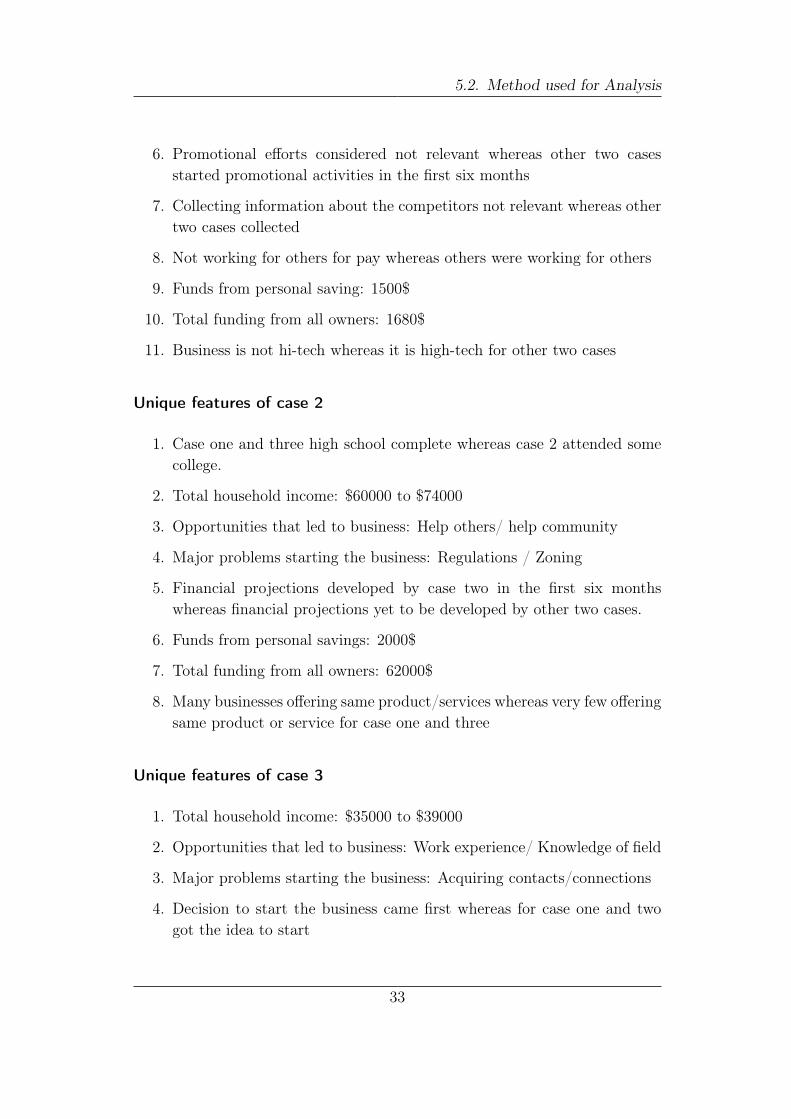
6. Promotional efforts considered not relevant whereas other two casesstarted promotional activities in the first six months
7. Collecting information about the competitors not relevant whereas othertwo cases collected
8. Not working for others for pay whereas others were working for others
9. Funds from personal saving: 1500$
10. Total funding from all owners: 1680$
11. Business is not hi-tech whereas it is high-tech for other two cases
Unique features of case 2
1. Case one and three high school complete whereas case 2 attended somecollege.
2. Total household income: $60000 to $74000
3. Opportunities that led to business: Help others/ help community
4. Major problems starting the business: Regulations / Zoning
5. Financial projections developed by case two in the first six monthswhereas financial projections yet to be developed by other two cases.
6. Funds from personal savings: 2000$
7. Total funding from all owners: 62000$
8. Many businesses offering same product/services whereas very few offeringsame product or service for case one and three
Unique features of case 3
1. Total household income: $35000 to $39000
2. Opportunities that led to business: Work experience/ Knowledge of field
3. Major problems starting the business: Acquiring contacts/connections
4. Decision to start the business came first whereas for case one and twogot the idea to start
33
5. Analysis
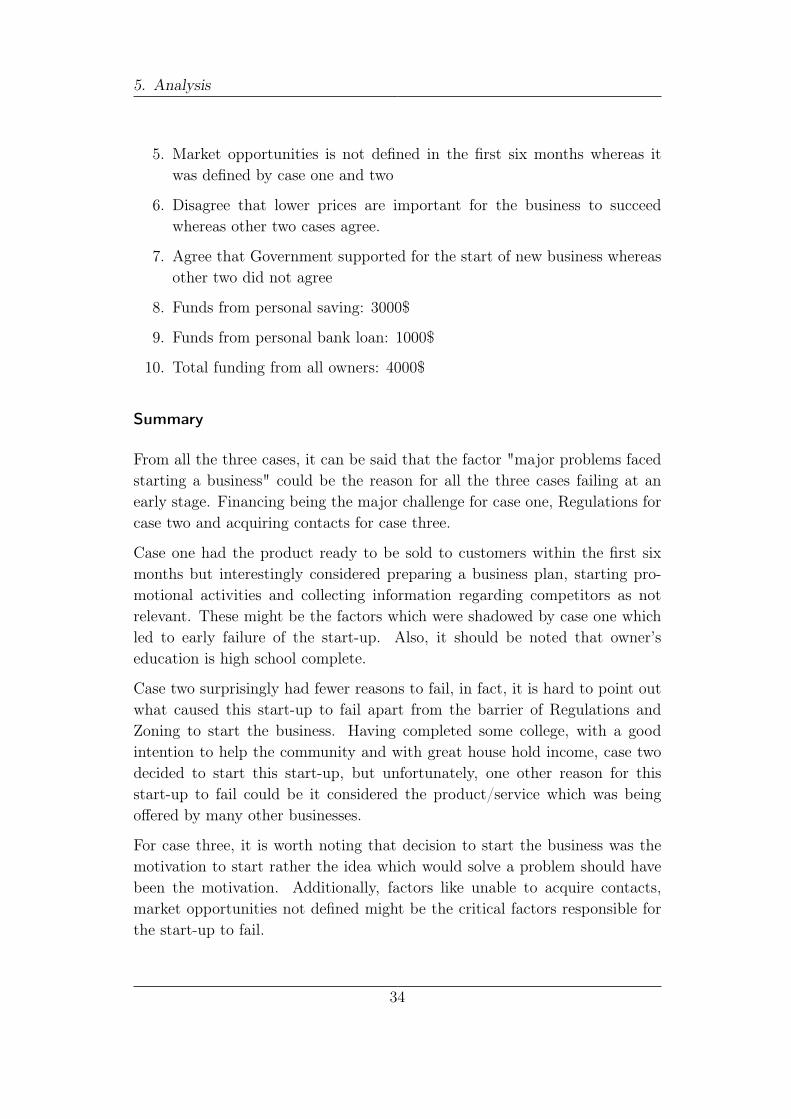
5. Market opportunities is not defined in the first six months whereas itwas defined by case one and two
6. Disagree that lower prices are important for the business to succeedwhereas other two cases agree.
7. Agree that Government supported for the start of new business whereasother two did not agree
8. Funds from personal saving: 3000$
9. Funds from personal bank loan: 1000$
10. Total funding from all owners: 4000$
Summary
From all the three cases, it can be said that the factor "major problems facedstarting a business" could be the reason for all the three cases failing at anearly stage. Financing being the major challenge for case one, Regulations forcase two and acquiring contacts for case three.
Case one had the product ready to be sold to customers within the first sixmonths but interestingly considered preparing a business plan, starting pro-motional activities and collecting information regarding competitors as notrelevant. These might be the factors which were shadowed by case one whichled to early failure of the start-up. Also, it should be noted that owner’seducation is high school complete.
Case two surprisingly had fewer reasons to fail, in fact, it is hard to point outwhat caused this start-up to fail apart from the barrier of Regulations andZoning to start the business. Having completed some college, with a goodintention to help the community and with great house hold income, case twodecided to start this start-up, but unfortunately, one other reason for thisstart-up to fail could be it considered the product/service which was beingoffered by many other businesses.
For case three, it is worth noting that decision to start the business was themotivation to start rather the idea which would solve a problem should havebeen the motivation. Additionally, factors like unable to acquire contacts,market opportunities not defined might be the critical factors responsible forthe start-up to fail.
34
5.2. Method used for Analysis
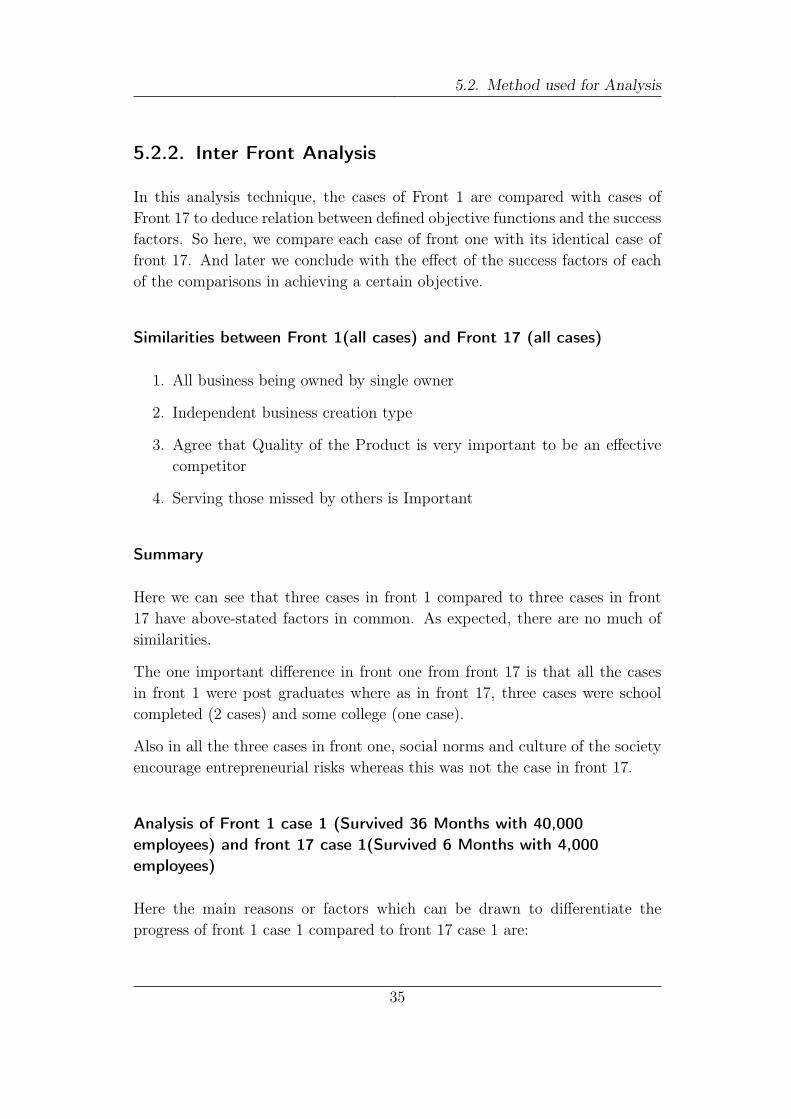
5.2.2. Inter Front Analysis
In this analysis technique, the cases of Front 1 are compared with cases ofFront 17 to deduce relation between defined objective functions and the successfactors. So here, we compare each case of front one with its identical case offront 17. And later we conclude with the effect of the success factors of eachof the comparisons in achieving a certain objective.
Similarities between Front 1(all cases) and Front 17 (all cases)
1. All business being owned by single owner
2. Independent business creation type
3. Agree that Quality of the Product is very important to be an effectivecompetitor
4. Serving those missed by others is Important
Summary
Here we can see that three cases in front 1 compared to three cases in front17 have above-stated factors in common. As expected, there are no much ofsimilarities.
The one important difference in front one from front 17 is that all the casesin front 1 were post graduates where as in front 17, three cases were schoolcompleted (2 cases) and some college (one case).
Also in all the three cases in front one, social norms and culture of the societyencourage entrepreneurial risks whereas this was not the case in front 17.
Analysis of Front 1 case 1 (Survived 36 Months with 40,000employees) and front 17 case 1(Survived 6 Months with 4,000employees)
Here the main reasons or factors which can be drawn to differentiate theprogress of front 1 case 1 compared to front 17 case 1 are:
35
5. Analysis
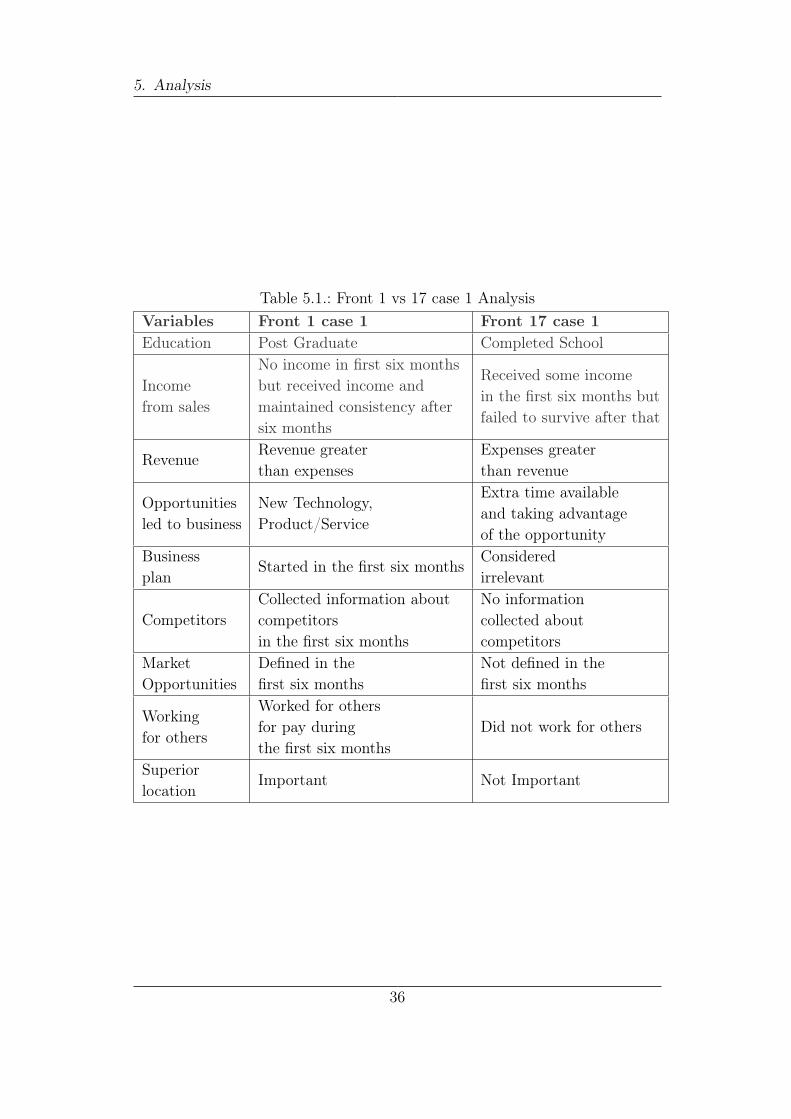
Table 5.1.: Front 1 vs 17 case 1 AnalysisVariables Front 1 case 1 Front 17 case 1Education Post Graduate Completed School
Incomefrom sales
No income in first six monthsbut received income andmaintained consistency aftersix months
Received some incomein the first six months butfailed to survive after that
RevenueRevenue greaterthan expenses
Expenses greaterthan revenue
Opportunitiesled to business
New Technology,Product/Service
Extra time availableand taking advantageof the opportunity
Businessplan
Started in the first six monthsConsideredirrelevant
CompetitorsCollected information aboutcompetitorsin the first six months
No informationcollected aboutcompetitors
MarketOpportunities
Defined in thefirst six months
Not defined in thefirst six months
Workingfor others
Worked for othersfor pay duringthe first six months
Did not work for others
Superiorlocation
Important Not Important
36
5.2. Method used for Analysis
From the table 5.1, it can be easily depicted that Front 1 case 1 were alwaysahead with their plans and executions whereas Font 17 case 1 contradicts Front1 in all the stated variables.
Here, one can declare the success factors for case one of Pareto-optimal frontto be:
1. Education
2. Income from sales
3. Revenue
4. New technology as the Opportunity which led to business
5. Business plan
6. collecting information from competitors
7. Market Opportunities
8. Location
9. Promotional activities
10. No business offer same product
All these factors with a positive and steady growth of some factors is an indi-cation for a successful start-up.
Common variables between Front 1 case 1 and Front 17 case 1
1. Both Independent Creation type
2. Both started promotional efforts in the first six months
3. Both agree that lower prices are important for the business to be impor-tant competitor
4. Both strongly agree that quality of products or services are importantfor the business to be successful.
5. Both agree serving missed by others is important
6. Both agree it’s important to do better marketing job
37
5. Analysis
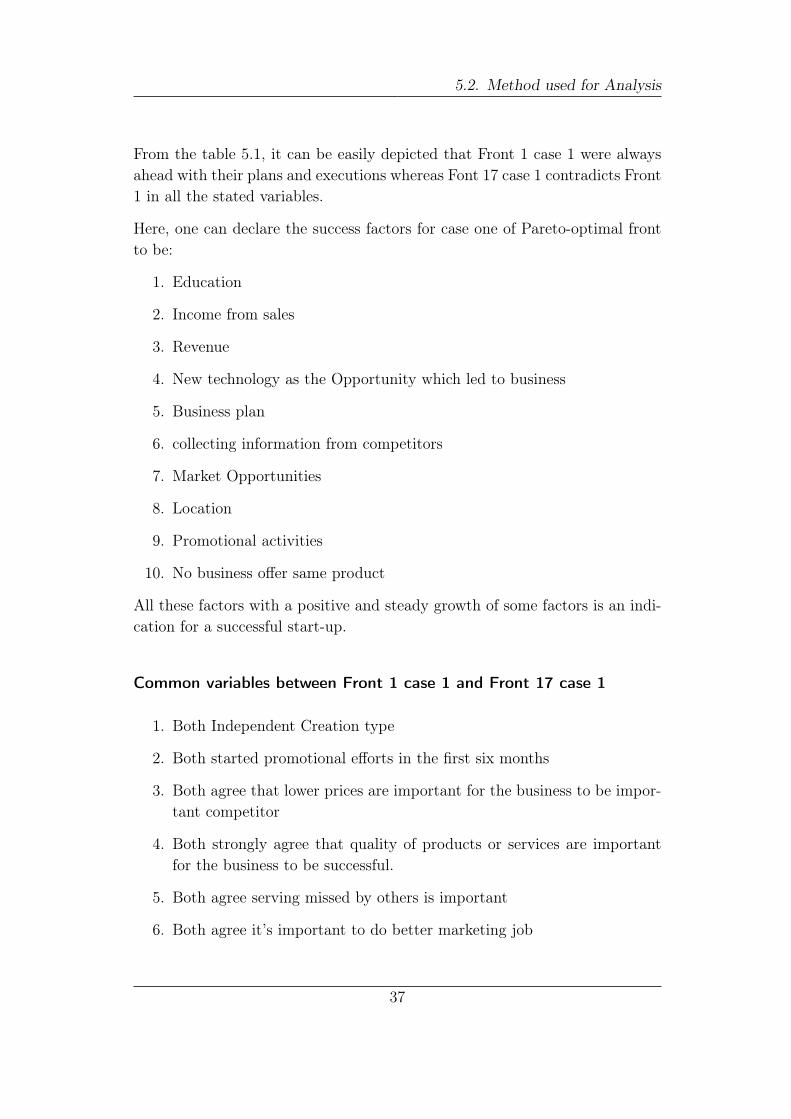
Table 5.2.: Front 1 vs 17 case 2 AnalysisVariables Front 1 case 2 Front 17 case 2Education Post Graduate Some college
RevenueRevenue greaterthan expenses
Expenses greaterthan revenue
Opportunitiesled to business
Able to buy property,Passion for business
Help others,help community
Competitors Not relevantInformation aboutcompetitors collected
Market Opportunities Not relevant Defined in the first six monthsAmount invested forloan or savings
10,000$ 62000$
Business offeringNo business offersame business
Other businessoffer same business
New Business Not hi-tech Hi-tech
7. Both agree The technical and scientific expertise of the start-up team isimportant for this new business to be an effective competitor
It can be estimated that to achieve comparatively high growth (number ofemployees), one should take care of the factors mentioned above.
Here, the success of a company keeping one objective in mind is analyzed.Concentrating on promotional efforts, considering lower prices than other com-petitors, serving those customers who were missed by others, and doing bettermarketing job, one can expand the company by the number of employees whichis one of the objectives.
Analysis of Front 1 case 2 (Survived 48 Months with 15,000employees) and front 17 case 2(Survived 30 Months with 260employees
Here, from table 5.2 it’s important to see that clearly the reason why case 2deserves to be in front 1 is the amount invested from personal savings is lowcompared to the one from front 17 and business is not high tech and is notbeing offered by others which are contrary to case 2 front 17.
38
5.2. Method used for Analysis
It could also be the reason for its stable performance in terms of objectives.Did not survive the highest number of months and did not have the greatestnumber of employees. A trade-off between both the objectives can be imaginedhere.
Hence, the success factors for case two of the Pareto-optimal front can bededuced as:
1. Education
2. Passion for business and able to buy a property
3. Revenue
4. Amount invested from loan or savings to be minimal
5. No business offering the same business
6. Not a hi-tech business
7. Devoting more than 160 hours per month
Similarities between Front 1 case 2 and Front 17 case 2
1. Both received Income from sales in the first six months.
2. Both agree that quality of products or services are important for thebusiness to be successful.
3. Both agree serving missed by others is important
4. Both agree it’s important to do better marketing job
5. Both agree The technical and scientific expertise of the start-up team isimportant for this new business to be an effective competitor
6. Both Technology available one year ago
Summary
From the above similarities, it can be said that the approach is very calculativeand risk is at minimal. So for any company to gradually progress, it is advisableto consider a technology which is already in the market, do good marketingjob and see to it that income is generated through sales from the start.
39
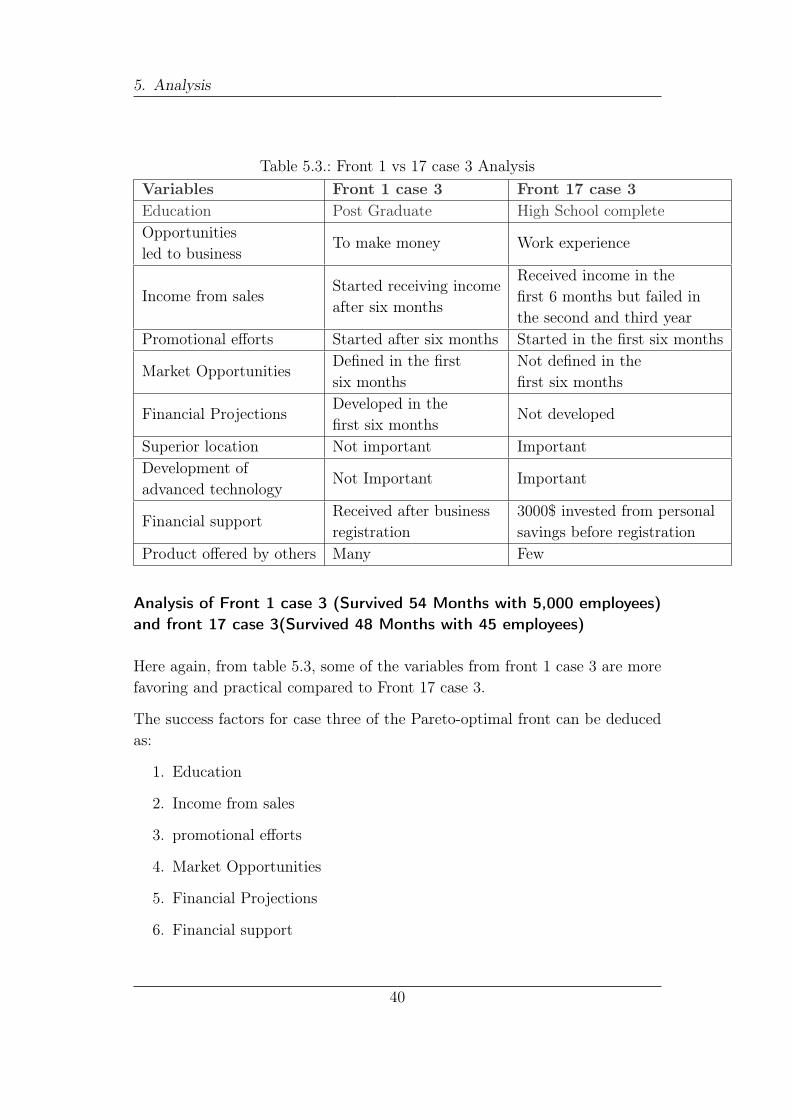
5. Analysis
Table 5.3.: Front 1 vs 17 case 3 AnalysisVariables Front 1 case 3 Front 17 case 3Education Post Graduate High School completeOpportunitiesled to business
To make money Work experience
Income from salesStarted receiving incomeafter six months
Received income in thefirst 6 months but failed inthe second and third year
Promotional efforts Started after six months Started in the first six months
Market OpportunitiesDefined in the firstsix months
Not defined in thefirst six months
Financial ProjectionsDeveloped in thefirst six months
Not developed
Superior location Not important ImportantDevelopment ofadvanced technology
Not Important Important
Financial supportReceived after businessregistration
3000$ invested from personalsavings before registration
Product offered by others Many Few
Analysis of Front 1 case 3 (Survived 54 Months with 5,000 employees)and front 17 case 3(Survived 48 Months with 45 employees)
Here again, from table 5.3, some of the variables from front 1 case 3 are morefavoring and practical compared to Front 17 case 3.
The success factors for case three of the Pareto-optimal front can be deducedas:
1. Education
2. Income from sales
3. promotional efforts
4. Market Opportunities
5. Financial Projections
6. Financial support
40
5.2. Method used for Analysis
7. Devoted more than 160 hours per month
Similarities between Font 1 case 3 and Font 17 case 3
1. Independent Business Type
2. Both collected information about competitors
3. Both Disagree that lower prices are important for the business to beimportant competitor
4. Both agree that quality of products or services are important for thebusiness to be successful.
5. Both agree serving missed by others is important
6. Both agree being first to market a new product or service is important
7. Both agree it’s important to do better marketing
8. Technology required for this business available more than one year agofor both the businesses
9. Business considered Hi-Tech
Summary
For a company to survive for a longer time with comparatively smaller employ-ees, it is important to consider a business with technology being available morethan one year ago, do better marketing job, be informed about competitors,have lower prices for the product/ Service and to serve the market which hasnot been considered by others.
41

6. Conclution and Future Work
6.1. Conclution
The objective of this study to identify the successful start-ups from a real-timedata set and identifying and analyzing the success factors of these start-upswas achieved through the application of Multi-criteria optimization supportedby the non-dominated sorting algorithm.
Two objectives were defined for the multi-criteria optimization problem, andall the start-up companies with their relevant factors or variables were sortedbased on the defined criteria using a non-dominated sorting algorithm. Paretooptimal front with the most successful companies was generated followed byall other members in different sets or fronts.
Intra and Inter front analysis were conducted to identify the success factorsand summaries are written depicting how success factors helped companies inPareto-optimal front to be successful compared to companies in front numberseventeen. Also, factors which are responsible for companies to fail in frontseventeen were identified.
The Inter-front analysis also tries to identify certain success factors with whicha start-up can achieve success with respect to one objective compared to otherand vice-versa.
43

6. Conclution and Future Work
6.2. Future Work
This study contributed to generalized analysis giving the opportunity for con-ducting specific analysis in the future such as how a success factor affectsother factors, how changing certain parameters of a success factor can make adifference in the overall performance of a start-up.
Other methods of computational science can be used to predict the success ofa new start-up with its variables based existing data.
Prediction of a start-up’s success can be revolutionary in this area of research.
44

Appendices
45


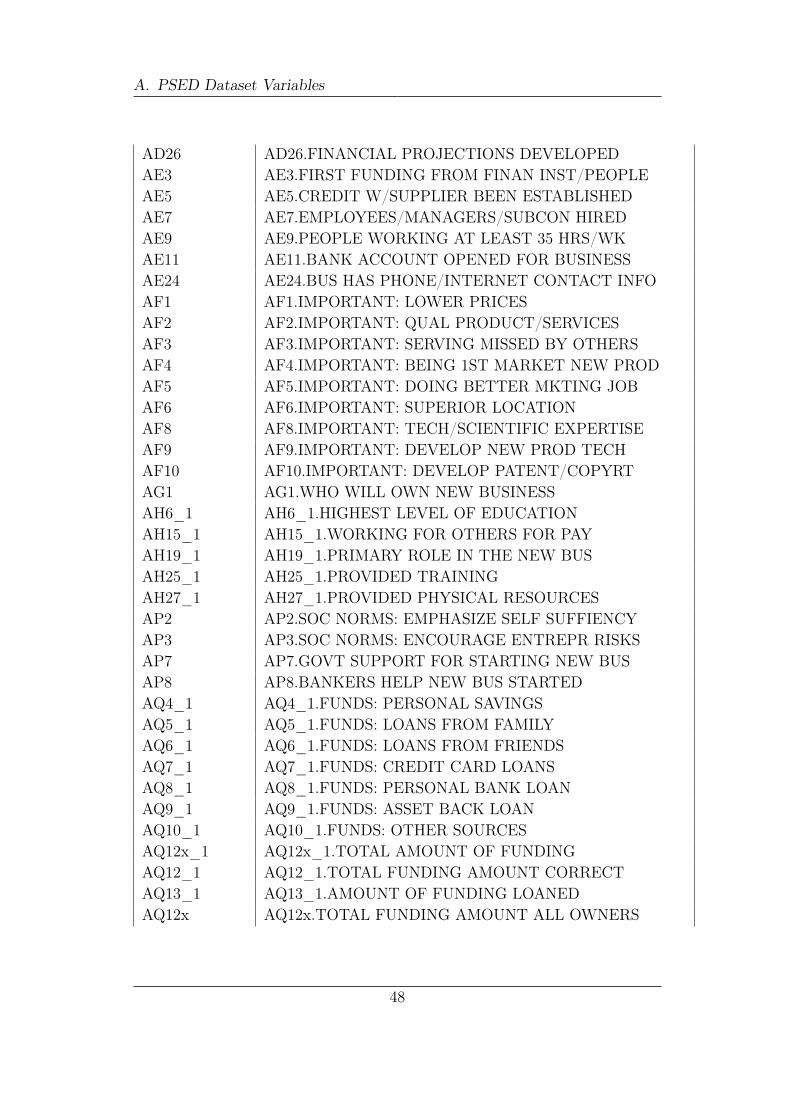
A. PSED Dataset Variables
Information here is retrieved from PSED codebook [Curtin, 2012].
VariableName
Variable Label
QS7 EDUCATIONINCOME INCOME SUMMARYQFF3 OWN ALL OR PART OF NEW BUSQFF4 BUS RECEIVED MONEY/INCOMEQFF5 MONTHLY REVENUE > EXPENSESQFF6 SALARY INCLUDED IN CALC OF EXPENSESAA5a AA5.OPPORTUNITIES LED TO BUSINESS (1)AA5b AA5.OPPORTUNITIES LED TO BUSINESS (2)AA6a AA6.MAJOR PROBLEMS STARTING BUS (1)AA6b AA6.MAJOR PROBLEMS STARTING BUS (2)AA7 AA7.CAME 1ST: BUS IDEA OR DECIS TO STARTAA10 AA10.BUSINESS CREATION TYPEAE13 AE13.BUS RECEIVED INCOME FROM SALESFE13 FE13.BUS RECEIVED INCOME FROM SALESBA37 BA37.PAST 12 MO WORKED ON BUS 160 HOURSAB10 AB10.BUSINESS LOCATION: ONE/SEVERAL/NONEAC1 AC1.CURRENT LEGAL FORM OF BUSINESSAD1 AD1.PREPARATION OF BUS PLAN STARTEDAD6 AD6.STAGE OF PRODUCT DEVELOPMENTAD9 AD9.PROMOTIONAL EFFORTS STARTEDAD11 AD11.BUSINESS DEVELOPED PROPRIETARY TECHAD13 AD13.APPLICATION FOR PATENT SUBMITTEDAD16 AD16.MAJOR ITEMS PURCHASED/LEASED/RENTEDAD20 AD20.DISCUSSION W/POTENTIAL CUSTOMERSAD22 AD22.COLLECT INFO ABOUT COMPETITORSAD24 AD24.MARKET OPPORTUNITIES DEFINED
47
A. PSED Dataset Variables
AD26 AD26.FINANCIAL PROJECTIONS DEVELOPEDAE3 AE3.FIRST FUNDING FROM FINAN INST/PEOPLEAE5 AE5.CREDIT W/SUPPLIER BEEN ESTABLISHEDAE7 AE7.EMPLOYEES/MANAGERS/SUBCON HIREDAE9 AE9.PEOPLE WORKING AT LEAST 35 HRS/WKAE11 AE11.BANK ACCOUNT OPENED FOR BUSINESSAE24 AE24.BUS HAS PHONE/INTERNET CONTACT INFOAF1 AF1.IMPORTANT: LOWER PRICESAF2 AF2.IMPORTANT: QUAL PRODUCT/SERVICESAF3 AF3.IMPORTANT: SERVING MISSED BY OTHERSAF4 AF4.IMPORTANT: BEING 1ST MARKET NEW PRODAF5 AF5.IMPORTANT: DOING BETTER MKTING JOBAF6 AF6.IMPORTANT: SUPERIOR LOCATIONAF8 AF8.IMPORTANT: TECH/SCIENTIFIC EXPERTISEAF9 AF9.IMPORTANT: DEVELOP NEW PROD TECHAF10 AF10.IMPORTANT: DEVELOP PATENT/COPYRTAG1 AG1.WHO WILL OWN NEW BUSINESSAH6_1 AH6_1.HIGHEST LEVEL OF EDUCATIONAH15_1 AH15_1.WORKING FOR OTHERS FOR PAYAH19_1 AH19_1.PRIMARY ROLE IN THE NEW BUSAH25_1 AH25_1.PROVIDED TRAININGAH27_1 AH27_1.PROVIDED PHYSICAL RESOURCESAP2 AP2.SOC NORMS: EMPHASIZE SELF SUFFIENCYAP3 AP3.SOC NORMS: ENCOURAGE ENTREPR RISKSAP7 AP7.GOVT SUPPORT FOR STARTING NEW BUSAP8 AP8.BANKERS HELP NEW BUS STARTEDAQ4_1 AQ4_1.FUNDS: PERSONAL SAVINGSAQ5_1 AQ5_1.FUNDS: LOANS FROM FAMILYAQ6_1 AQ6_1.FUNDS: LOANS FROM FRIENDSAQ7_1 AQ7_1.FUNDS: CREDIT CARD LOANSAQ8_1 AQ8_1.FUNDS: PERSONAL BANK LOANAQ9_1 AQ9_1.FUNDS: ASSET BACK LOANAQ10_1 AQ10_1.FUNDS: OTHER SOURCESAQ12x_1 AQ12x_1.TOTAL AMOUNT OF FUNDINGAQ12_1 AQ12_1.TOTAL FUNDING AMOUNT CORRECTAQ13_1 AQ13_1.AMOUNT OF FUNDING LOANEDAQ12x AQ12x.TOTAL FUNDING AMOUNT ALL OWNERS
48
AQ13 AQ13.AMOUNT OF FUNDING LOANED ALL OWNERSAR1 AR1.BUS RECVD FORMAL FINANCIAL SUPPORTAR4 AR4.AMT INVESTED AFTER REGISTEREDAR32 AR32.ALL FUNDS IN NEW BUS BANK ACCOUNTAS1 AS1.PRODUCT/SERVICE NEW OR UNFAMILIARAS2 AS2.OTHER BUS OFFERING SAME PRODUCTAS3 AS3.TECH AVAILABLE MORE THAN 1 YEAR AGOAS6 AS6.NEW BUS HI-TECHAS9 AS9.PERCENT OF CUSTOMERS NATIONALSUST_000 00 MTH AFTER ENTRY:START-UP STATUSSUST_006 06 MTH AFTER ENTRY:START-UP STATUSSUST_012 12 MTH AFTER ENTRY:START-UP STATUSSUST_018 18 MTH AFTER ENTRY:START-UP STATUSSUST_024 24 MTH AFTER ENTRY:START-UP STATUSSUST_072 72 MTH AFTER ENTRY:START-UP STATUSSUST_001 01 MTH AFTER ENTRY:START-UP STATUSSUST_030 30 MTH AFTER ENTRY:START-UP STATUSSUST_036 36 MTH AFTER ENTRY:START-UP STATUSSUST_042 42 MTH AFTER ENTRY:START-UP STATUSSUST_048 48 MTH AFTER ENTRY:START-UP STATUSSUST_054 54 MTH AFTER ENTRY:START-UP STATUSSUST_060 60 MTH AFTER ENTRY:START-UP STATUSAR22 AR22.TOTAL MARKET VALUE OF BUS IF SOLDMonths No. Of Months a Company SurvivedAX15 AX15.NUMBER PEOPLE ON PAYROLL
Table A.1.: Start-up Variables and Labels from PSED dataset
49

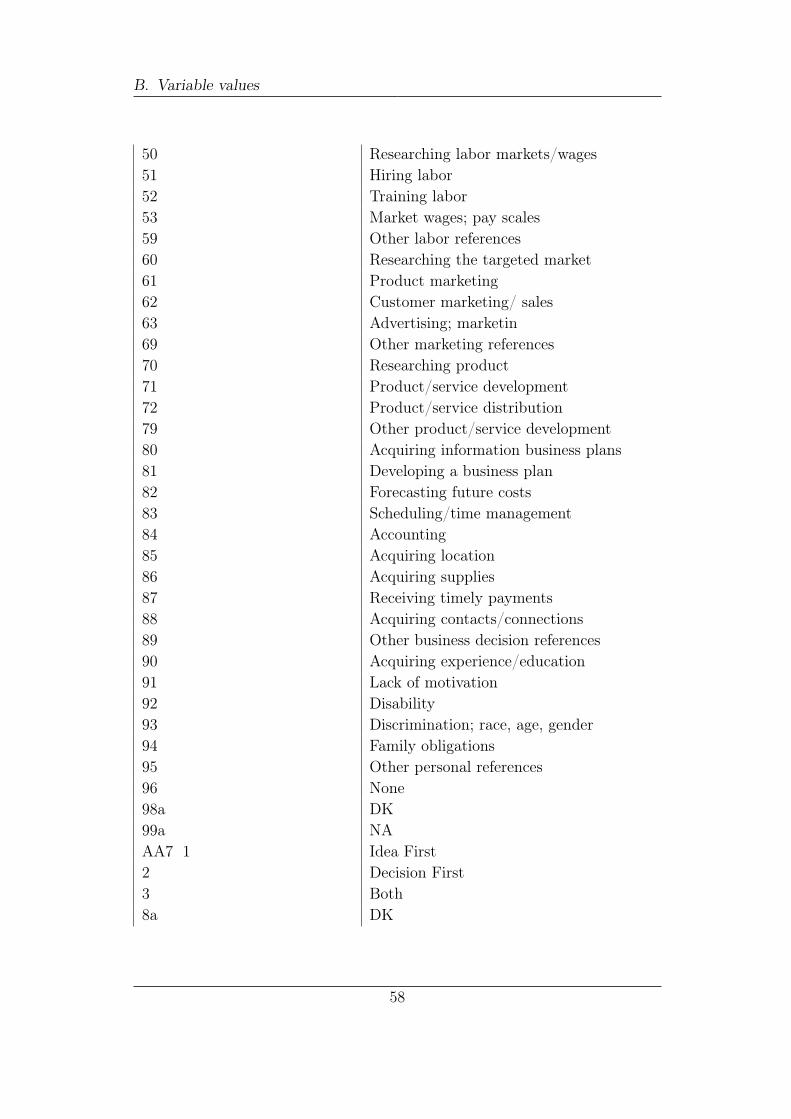
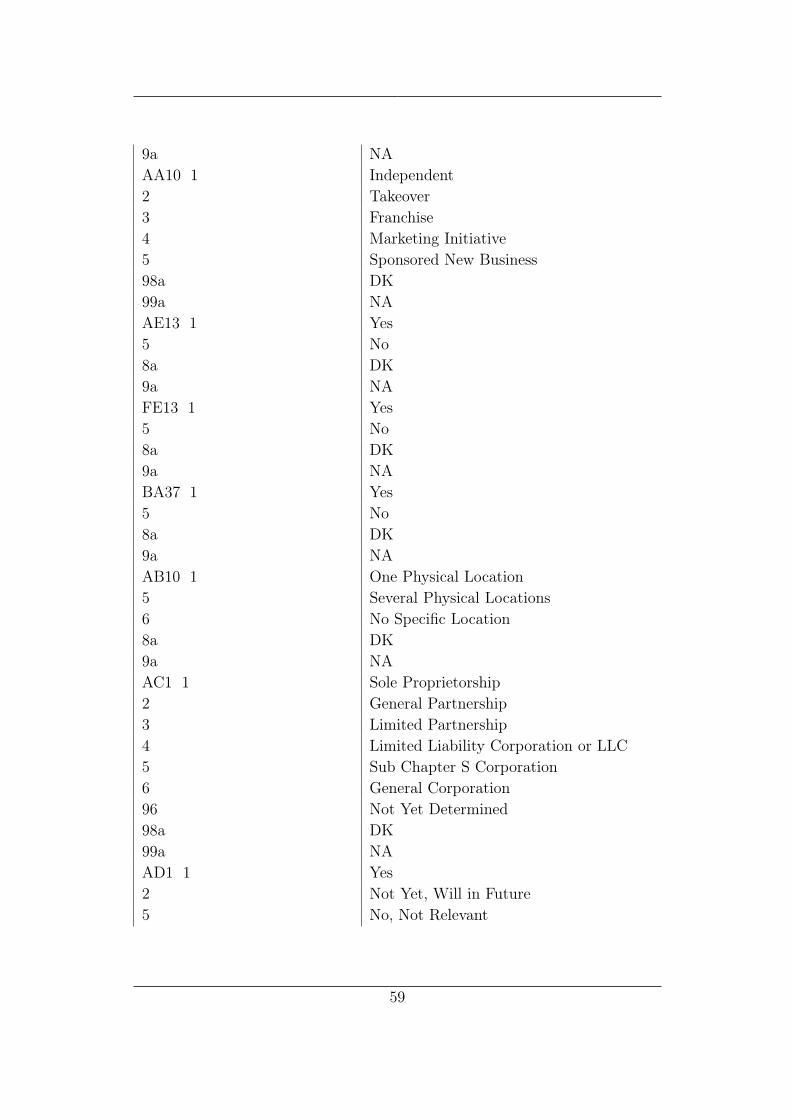
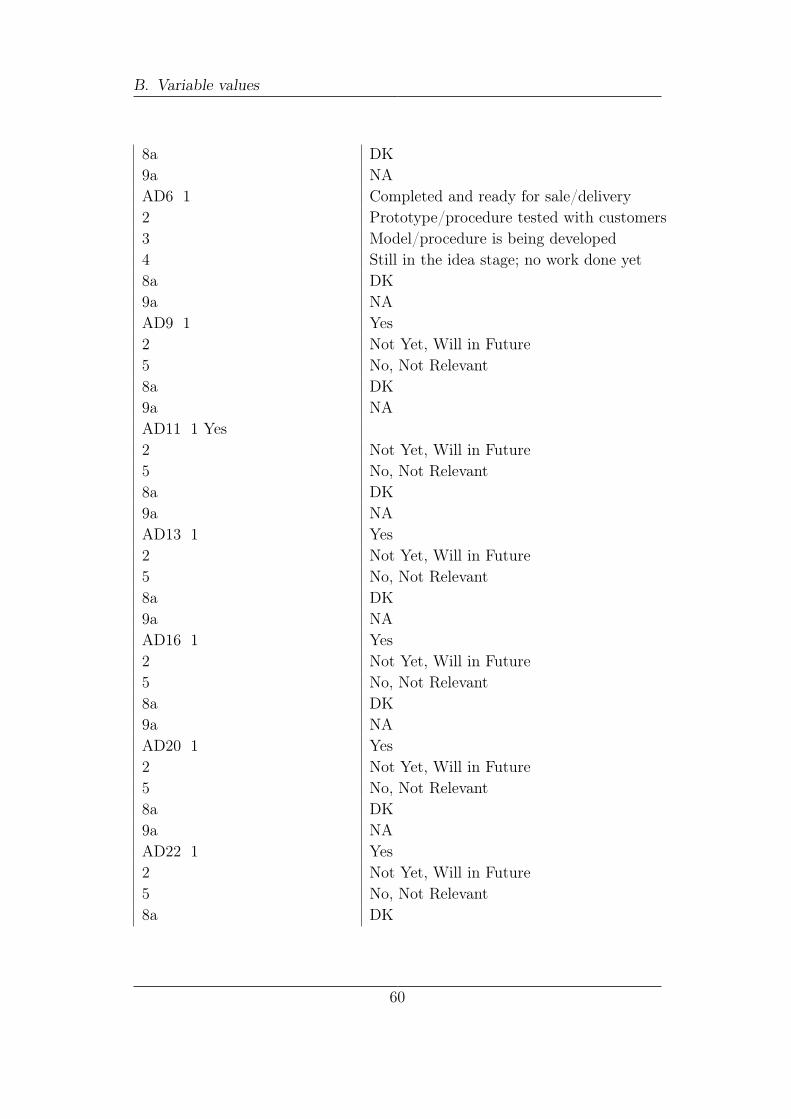
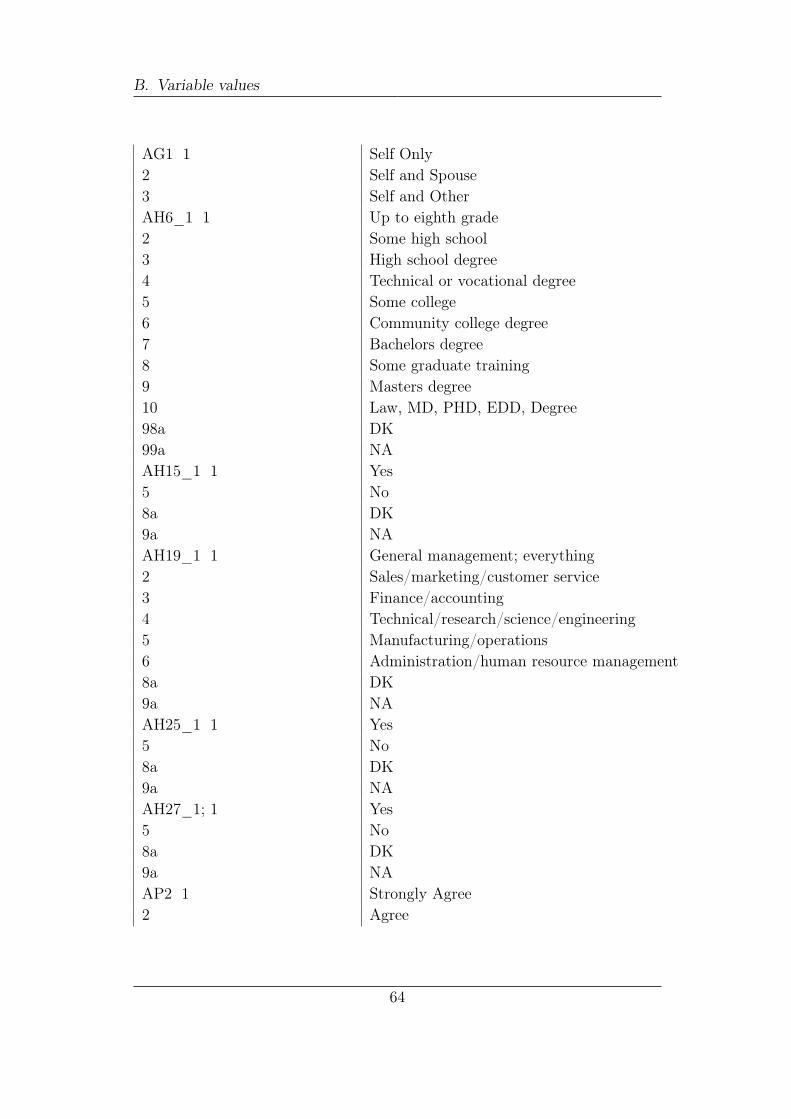
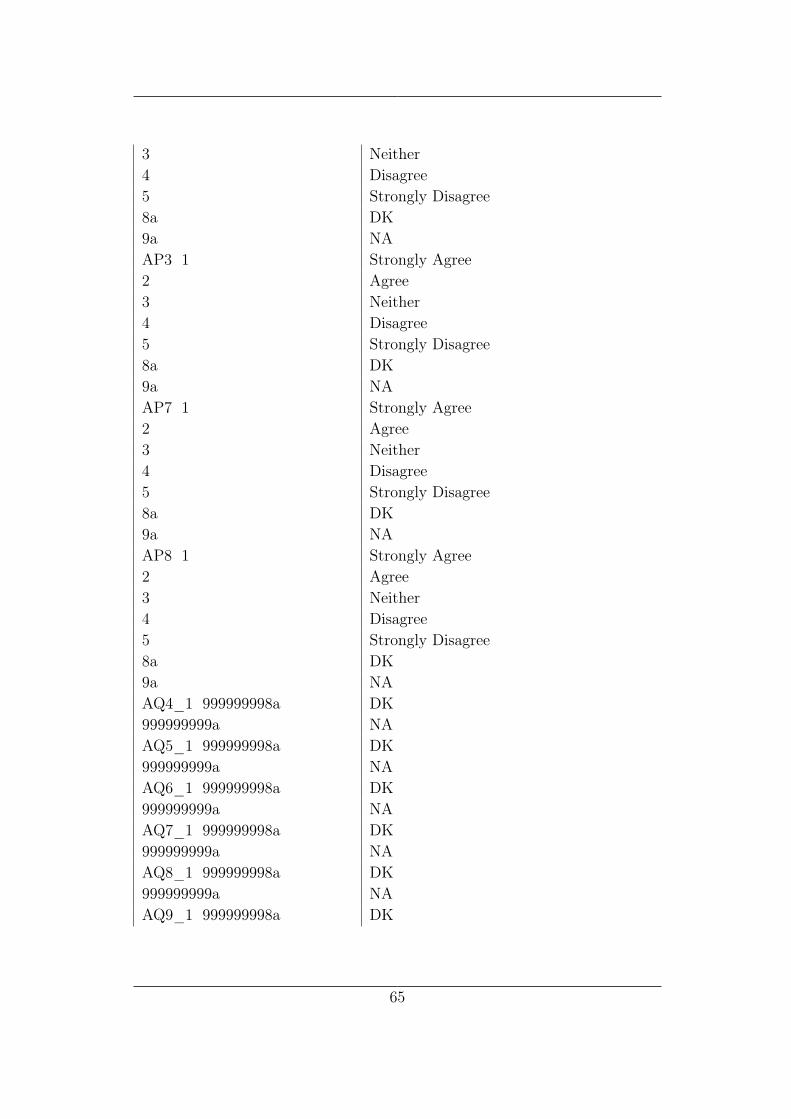
B. Variable values
Information here is retrieved from PSED codebook [Curtin, 2012].
Value LabelQS7 1 Eighth grade or less2 High school incomplete3 High school complete4 Some college5 Associates degree6 Bachelors degree7 Postgraduate degree99a RefusedINCOME 1 Under $15,0002 $15,000-$24,9993 $25,000-$29,9994 $30,000-$34,9995 $35,000-$39,9996 $40,000-$49,9997 $50,000-$59,9998 $60,000-$74,9999 $75,000-$99,99910 $100,000 or more21 Less than $40,00022 $40,000 or more99a RefusedQFF3 1 All2 Part3 None98a DK99a RefusedQFF4 1 Yes
51
B. Variable values
2 No98a DK99a RefusedQFF5 1 Revenue greater than expenses2 Expenses greater than revenue98a DK99a RefusedQFF6 1 Yes2 No98a DK99a RefusedAA5a 10 Low overhead11 Low cost property; have property12 Low cost supplies or services13 Tax write-off14 Low start-up costs19 Other cost references20 Have resources: saved up to do it21 Have cash backing; have large investors22 Loan or grant23 Sold home, property or business29 Other current financial resources30 Income; to make money31 Extra income32 Need to supplement income33 Investment34 Financial independence; job security35 Income for educational expenses36 Income for retirement37 To leave business/money to children39 Other income references40 Good business idea41 Take advantage of opportunity42 High demand for products/business43 Market opportunity; untapped market44 New technology/product/service45 Good product; faith in product
52
46 Expansion of old/current business47 Vast resources or material48 Able to buy building, property,business49 Other business opportunity references50 Be own boss; tired of working for others51 Flexibility; more free time; set hours52 Stay home with children; work from home53 Potential more money working for self54 Cannot find employment; lost job55 Further career; career change56 Retired59 Other employment references60 Work experience; knowledge of field61 Have formal training/education in field62 Enjoy work, have passion for it63 Have talent in field, area of expertise64 Change in personal situation65 Inheritance69 Other personal references70 Just decided to do it; boredom71 Self-fulfillment; always wanted to do72 Timing is right; time in life; extra time73 Easy; does not require a lot79 Other lifestyle references80 Had mentor; discussed with a mentor81 Encouraged to start business, industry82 Encouraged to start business, community83 Approached to start business, net/phone84 Mentors available and willing85 Business partner’s influence86 Encouraged89 Other mentor references90 Can do better than the competition91 Help others; help community92 Aid in economy; economic development93 Good location; easily accessible98a DK
53
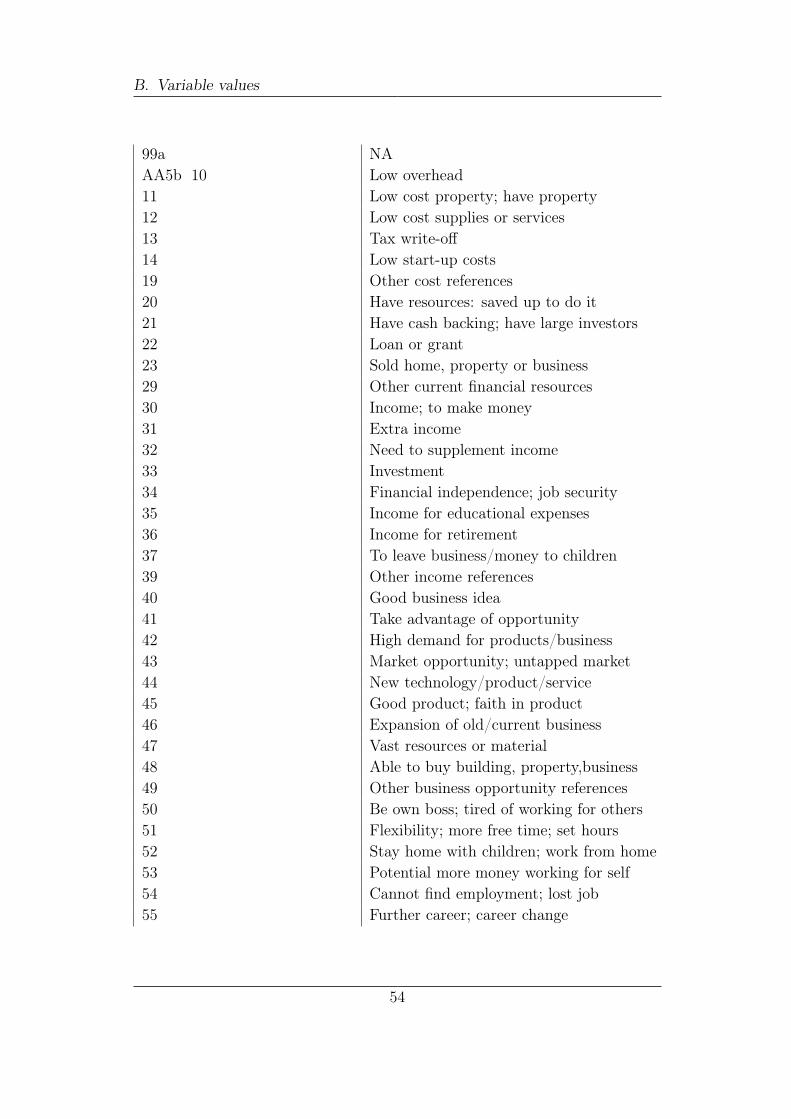
B. Variable values
99a NAAA5b 10 Low overhead11 Low cost property; have property12 Low cost supplies or services13 Tax write-off14 Low start-up costs19 Other cost references20 Have resources: saved up to do it21 Have cash backing; have large investors22 Loan or grant23 Sold home, property or business29 Other current financial resources30 Income; to make money31 Extra income32 Need to supplement income33 Investment34 Financial independence; job security35 Income for educational expenses36 Income for retirement37 To leave business/money to children39 Other income references40 Good business idea41 Take advantage of opportunity42 High demand for products/business43 Market opportunity; untapped market44 New technology/product/service45 Good product; faith in product46 Expansion of old/current business47 Vast resources or material48 Able to buy building, property,business49 Other business opportunity references50 Be own boss; tired of working for others51 Flexibility; more free time; set hours52 Stay home with children; work from home53 Potential more money working for self54 Cannot find employment; lost job55 Further career; career change
54
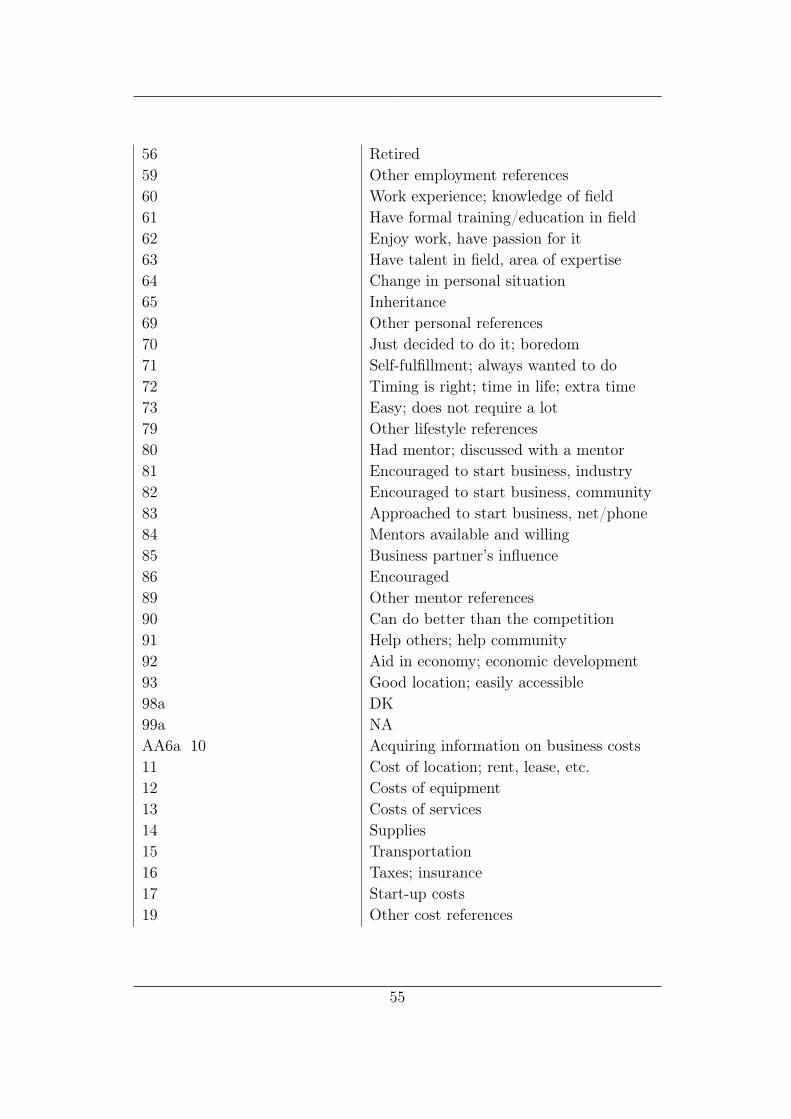
56 Retired59 Other employment references60 Work experience; knowledge of field61 Have formal training/education in field62 Enjoy work, have passion for it63 Have talent in field, area of expertise64 Change in personal situation65 Inheritance69 Other personal references70 Just decided to do it; boredom71 Self-fulfillment; always wanted to do72 Timing is right; time in life; extra time73 Easy; does not require a lot79 Other lifestyle references80 Had mentor; discussed with a mentor81 Encouraged to start business, industry82 Encouraged to start business, community83 Approached to start business, net/phone84 Mentors available and willing85 Business partner’s influence86 Encouraged89 Other mentor references90 Can do better than the competition91 Help others; help community92 Aid in economy; economic development93 Good location; easily accessible98a DK99a NAAA6a 10 Acquiring information on business costs11 Cost of location; rent, lease, etc.12 Costs of equipment13 Costs of services14 Supplies15 Transportation16 Taxes; insurance17 Start-up costs19 Other cost references
55
B. Variable values
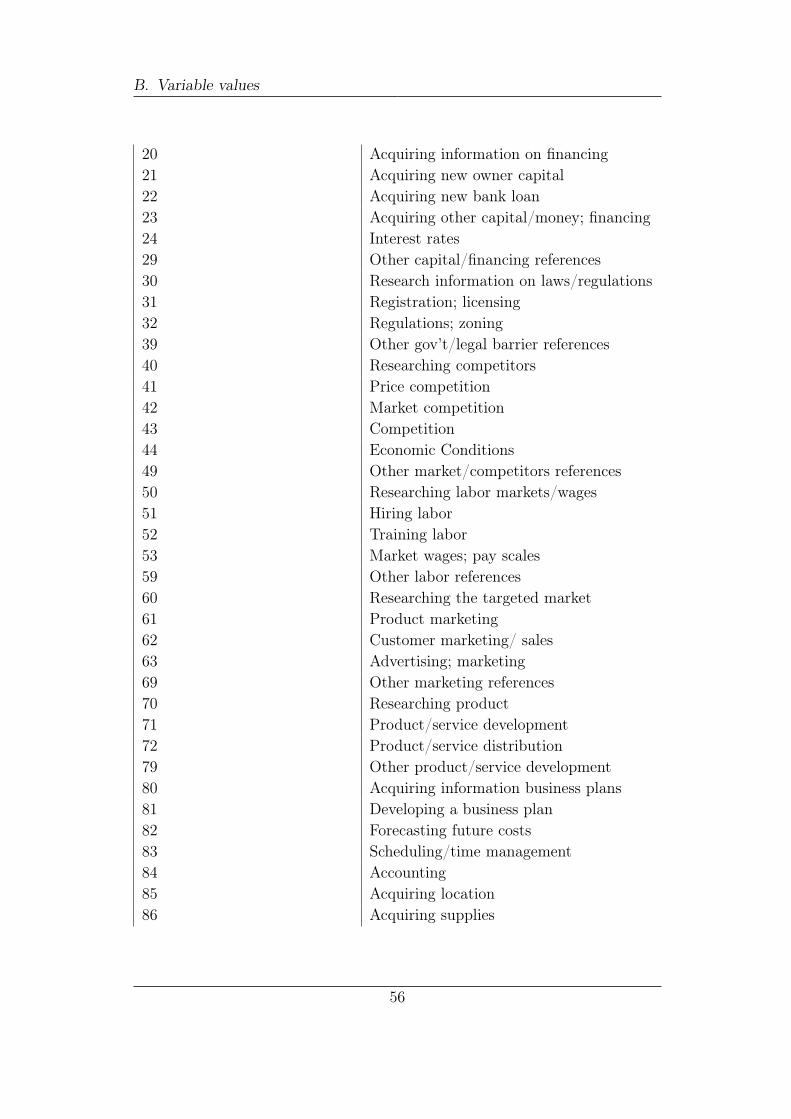
20 Acquiring information on financing21 Acquiring new owner capital22 Acquiring new bank loan23 Acquiring other capital/money; financing24 Interest rates29 Other capital/financing references30 Research information on laws/regulations31 Registration; licensing32 Regulations; zoning39 Other gov’t/legal barrier references40 Researching competitors41 Price competition42 Market competition43 Competition44 Economic Conditions49 Other market/competitors references50 Researching labor markets/wages51 Hiring labor52 Training labor53 Market wages; pay scales59 Other labor references60 Researching the targeted market61 Product marketing62 Customer marketing/ sales63 Advertising; marketing69 Other marketing references70 Researching product71 Product/service development72 Product/service distribution79 Other product/service development80 Acquiring information business plans81 Developing a business plan82 Forecasting future costs83 Scheduling/time management84 Accounting85 Acquiring location86 Acquiring supplies
56
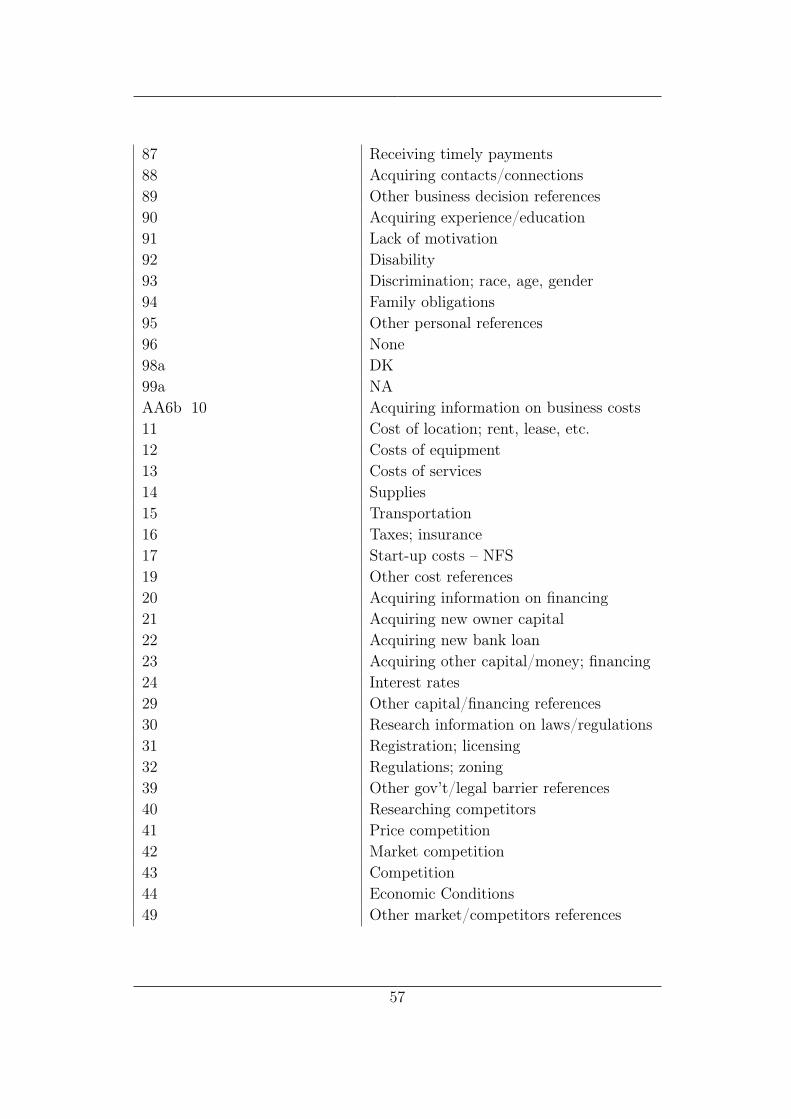
87 Receiving timely payments88 Acquiring contacts/connections89 Other business decision references90 Acquiring experience/education91 Lack of motivation92 Disability93 Discrimination; race, age, gender94 Family obligations95 Other personal references96 None98a DK99a NAAA6b 10 Acquiring information on business costs11 Cost of location; rent, lease, etc.12 Costs of equipment13 Costs of services14 Supplies15 Transportation16 Taxes; insurance17 Start-up costs – NFS19 Other cost references20 Acquiring information on financing21 Acquiring new owner capital22 Acquiring new bank loan23 Acquiring other capital/money; financing24 Interest rates29 Other capital/financing references30 Research information on laws/regulations31 Registration; licensing32 Regulations; zoning39 Other gov’t/legal barrier references40 Researching competitors41 Price competition42 Market competition43 Competition44 Economic Conditions49 Other market/competitors references
57
B. Variable values
50 Researching labor markets/wages51 Hiring labor52 Training labor53 Market wages; pay scales59 Other labor references60 Researching the targeted market61 Product marketing62 Customer marketing/ sales63 Advertising; marketin69 Other marketing references70 Researching product71 Product/service development72 Product/service distribution79 Other product/service development80 Acquiring information business plans81 Developing a business plan82 Forecasting future costs83 Scheduling/time management84 Accounting85 Acquiring location86 Acquiring supplies87 Receiving timely payments88 Acquiring contacts/connections89 Other business decision references90 Acquiring experience/education91 Lack of motivation92 Disability93 Discrimination; race, age, gender94 Family obligations95 Other personal references96 None98a DK99a NAAA7 1 Idea First2 Decision First3 Both8a DK
58
9a NAAA10 1 Independent2 Takeover3 Franchise4 Marketing Initiative5 Sponsored New Business98a DK99a NAAE13 1 Yes5 No8a DK9a NAFE13 1 Yes5 No8a DK9a NABA37 1 Yes5 No8a DK9a NAAB10 1 One Physical Location5 Several Physical Locations6 No Specific Location8a DK9a NAAC1 1 Sole Proprietorship2 General Partnership3 Limited Partnership4 Limited Liability Corporation or LLC5 Sub Chapter S Corporation6 General Corporation96 Not Yet Determined98a DK99a NAAD1 1 Yes2 Not Yet, Will in Future5 No, Not Relevant
59
B. Variable values
8a DK9a NAAD6 1 Completed and ready for sale/delivery2 Prototype/procedure tested with customers3 Model/procedure is being developed4 Still in the idea stage; no work done yet8a DK9a NAAD9 1 Yes2 Not Yet, Will in Future5 No, Not Relevant8a DK9a NAAD11 1 Yes2 Not Yet, Will in Future5 No, Not Relevant8a DK9a NAAD13 1 Yes2 Not Yet, Will in Future5 No, Not Relevant8a DK9a NAAD16 1 Yes2 Not Yet, Will in Future5 No, Not Relevant8a DK9a NAAD20 1 Yes2 Not Yet, Will in Future5 No, Not Relevant8a DK9a NAAD22 1 Yes2 Not Yet, Will in Future5 No, Not Relevant8a DK
60

9a NAAD24 1 Yes2 Not Yet, Will in Future5 No, Not Relevant8a DK9a NAAD26 1 Yes2 Not Yet, Will in Future5 No, Not Relevant8a DK9a NAAE3 1 Yes5 No8a DK9a NAAE5 1 Yes2 Not Yet, Will in Future5 No, Not Relevant8a DK9a NAAE7 1 Yes2 Not Yet, Will in Future5 No, Not Relevant8a DK9a NAAE9 999998a DK999999a NAAE11 1 Yes2 No, not yet; will in future5 No, not relevant6 Using exist account8a DK9a NAAE24 1 Phone2 Internet3 Both6 Neither
61

B. Variable values
8a DK9a NAAF1 1 Strongly Agree2 Agree3 Neither4 Disagree5 Strongly Disagree6 Not Relevant8a DK9a NAAF2 1 Strongly Agree2 Agree3 Neither4 Disagree5 Strongly Disagree6 Not Relevant8a DK9a NAAF3 1 Strongly Agree2 Agree3 Neither4 Disagree5 Strongly Disagree6 Not Relevant8a DK9a NAAF4 1 Strongly Agree2 Agree3 Neither4 Disagree5 Strongly Disagree6 Not Relevant8a DK9a NAAF5 1 Strongly Agree2 Agree3 Neither
62

4 Disagree5 Strongly Disagree6 Not Relevant8a DK9a NAAF6 1 Strongly Agree2 Agree3 Neither4 Disagree5 Strongly Disagree6 Not Relevant8a DK9a NAAF8 1 Strongly Agree2 Agree3 Neither4 Disagree5 Strongly Disagree6 Not Relevant8a DK9a NAAF9 1 Strongly Agree2 Agree3 Neither4 Disagree5 Strongly Disagree6 Not Relevant8a DK9a NAAF10 1 Strongly Agree2 Agree3 Neither4 Disagree5 Strongly Disagree6 Not Relevant8a DK9a NA
63
B. Variable values
AG1 1 Self Only2 Self and Spouse3 Self and OtherAH6_1 1 Up to eighth grade2 Some high school3 High school degree4 Technical or vocational degree5 Some college6 Community college degree7 Bachelors degree8 Some graduate training9 Masters degree10 Law, MD, PHD, EDD, Degree98a DK99a NAAH15_1 1 Yes5 No8a DK9a NAAH19_1 1 General management; everything2 Sales/marketing/customer service3 Finance/accounting4 Technical/research/science/engineering5 Manufacturing/operations6 Administration/human resource management8a DK9a NAAH25_1 1 Yes5 No8a DK9a NAAH27_1; 1 Yes5 No8a DK9a NAAP2 1 Strongly Agree2 Agree
64
3 Neither4 Disagree5 Strongly Disagree8a DK9a NAAP3 1 Strongly Agree2 Agree3 Neither4 Disagree5 Strongly Disagree8a DK9a NAAP7 1 Strongly Agree2 Agree3 Neither4 Disagree5 Strongly Disagree8a DK9a NAAP8 1 Strongly Agree2 Agree3 Neither4 Disagree5 Strongly Disagree8a DK9a NAAQ4_1 999999998a DK999999999a NAAQ5_1 999999998a DK999999999a NAAQ6_1 999999998a DK999999999a NAAQ7_1 999999998a DK999999999a NAAQ8_1 999999998a DK999999999a NAAQ9_1 999999998a DK
65

B. Variable values
999999999a NAAQ10_1 999999998a DK999999999a NAAQ12x_1 999999999a NAAQ12_1 999999998 DK999999999 NAAQ13_1 999999998a DK999999999a NAAQ13 999999999a NAAR1 1 Yes5 No8a DK9a NAAR4 999999998a DK999999999a NAAR32 1 Yes5 No8a DK9a NAAS1 1 All5 Some6 None8a DK9a NAAS2 1 Many5 Few6 No Other8a DK9a NAAS3 1 Yes5 No8a DK9a NAAS6 1 Yes5 No8a DK9a NA
66
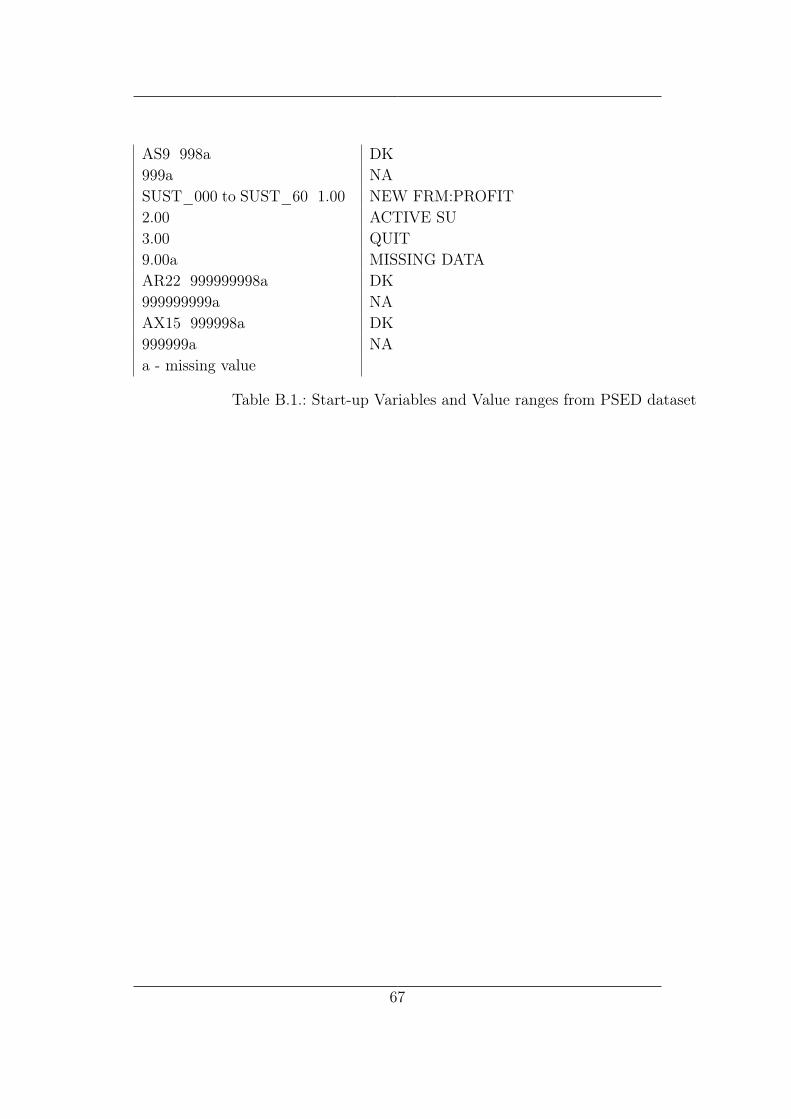
AS9 998a DK999a NASUST_000 to SUST_60 1.00 NEW FRM:PROFIT2.00 ACTIVE SU3.00 QUIT9.00a MISSING DATAAR22 999999998a DK999999999a NAAX15 999998a DK999999a NAa - missing value
Table B.1.: Start-up Variables and Value ranges from PSED dataset
67

Bibliography
[Alden, 2011] Alden, E. (2011). Primum non nocere: The impact of dodd-frank on silicon valley.
[Cable, 2010] Cable, A. J. (2010). Fending for themselves: Why securitiesregulations should encourage angel groups.
[Coello et al., 2007] Coello, C. A. C., Lamont, G. B., Van Veldhuizen, D. A.,et al. (2007). Evolutionary algorithms for solving multi-objective problems,volume 5. Springer.
[Cole, 2009] Cole, C. W. (2009). Financing an entrepreneurial venture: Nav-igating the maze of corporate, securities, and tax law. UMKC L. Rev.,78:473.
[Curtin, 2012] Curtin, R. (2012). Panel study of entrepreneurial dynamics ii:Codebook.
[Deb, 2001] Deb, K. (2001). Multi-objective optimization using evolutionaryalgorithms, 2001. Chicheter, John-Wiley.
[GovtIndia, 2016] GovtIndia (2016). Start-up India start-up india govt.project. http://www.startupindia.gov.in/. Accessed: 2017-02-27.
[Maxville, 2013] Maxville, V. (2013). Introducing: Computational science.Procedia Computer Science, 18:1456–1465.
[Morrison, 1999] Morrison, E. (1999). Introduction to spss. Center for SocialScience Computation and Research, Universidad de Washington.
[Neely, 2002] Neely, A. (2002). Business performance measurement: theoryand practice. Cambridge University Press.
[Oranburg, 2016] Oranburg, S. C. (2016). Start-up financing. Browser Down-load This Paper.
69
Bibliography
[Peng, 2011] Peng, R. D. (2011). Reproducible research in computationalscience. Science, 334(6060):1226–1227.
[Reynolds and Curtin, 2009] Reynolds, P. D. and Curtin, R. T. (2009). Newfirm creation in the United States: Initial explorations with the PSED IIdata set, volume 23. Springer Science & Business Media.
[Reynolds and Curtin, 2012] Reynolds, P. D. and Curtin, R. T. (2012). Psedi, ii harmonized transitions, outcomes data set.
[Ries, 2011] Ries, E. (2011). The lean startup: How today’s entrepreneursuse continuous innovation to create radically successful businesses. CrownBusiness.
[Taticchi, 2010] Taticchi, P. (2010). Business performance measurement andmanagement. Springer.
70

Declaration
I, Nithish Hulikanthe Math declare that this Master Thesis is a work composedsolely by myself and I confirm with the best of my knowledge that apart fromthe indicated resources, no other materials are used in the completion of thiswork.
Nithish Hulikanthe Math Magdeburg, March 6, 2017