multi-modal transport solution using e-scooters & public
TRANSCRIPT

DF
Multi-modal Transport Solution UsingE-scooters & Public TransportationTo support the transition to a car free society
Master’s thesis in Product Development
ADITYA GANESH
Department of Space, Earth and EnvironmentCHALMERS UNIVERSITY OF TECHNOLOGYGothenburg, Sweden 2020

Master’s thesis 2020
Multi-modal Transport Solution UsingE-scooters & Public Transportation
To support the transition to a car free society
ADITYA GANESH
DF
Challenge LabDepartment of Space, Earth and EnvironmentChalmers University of Technology
Gothenburg, Sweden 2020

Multi-modal Transport Solution Using E-scooters & Public Transportation:To support the transition to a car free society
Aditya Ganesh
c© Aditya Ganesh, 2020
Supervisor: Jaan-Henrik KainDepartment of Architecture and Civil Engineering
Examiner: John HolmbergDepartment of Space, Earth and Environment
Master’s Thesis 2020Department of Space, Earth and EnvironmentChalmers University of TechnologySE-412 96 GothenburgSweden
Cover: E-scooter parked in front of central station. Photograph from Pikist
Typeset in LATEXGothenburg, Sweden 2020

Multi-modal Transport Solution Using E-scooters & Public Transportation:To support the transition to a car free societyADITYA GANESHDepartment of Space, Earth and EnvironmentChalmers University of Technology
AbstractThe growth of cities have led to increase in cars on the roads. Thus cars put a greatdemand not just on the infrastructure but also the environment. Thus it is crucial toencourage the use of public transport systems. The public transport systems comewith there fair share of problems related to access and convenience to the users. Atthe same time the e-scooter services have been a new phenomenon in micromobilityand are touted by the pundits to solve the gaps in the way the transport systemsfunction in the cites and are also considered to be a sustainable alternative to thecars and help in achieving a car free society. Though these e-scooters are constantlyin conflict with the societies functioning and considered to be a problem by somesections of the society. The study looks into the aspects of if and how the e-scooterscan influence the car users to give up car and use more public transportation in VastraGotaland region. This is done by focusing the study on understanding the car userneeds through interviews and surveys. The study carries out Force Field Analysisto determine the forces acting towards and against a car free society. Additionallythrough systems mapping the study also captures the complexity of the system whichincludes car users, e-scooter services and public transportation.
Keywords: Personal Mobility, Car User Needs, E-scooters, Public Transportation
i

AcknowledgementI would like to thank Challenge Lab for allowing me to be part of a thesis contributingto sustainability in the society. I would also like to thank John Holmberg, JohanHolmen and Gavin McCrory for their patience and motivation throughout the thesis.A special thanks to Linnea Johansson for inspiring me to take up a thesis at ChallengeLab. Also, a special token of gratitude to all the stakeholders and interviewees fromthe city of Gothenburg and Vastra Gotaland region, without whom this study wouldnot have been possible. Finally, I would like to express gratitude to my supervisorJaan-Henrik Kain for providing continuous support and guidance throughout thislong journey.
ii

Contents
1 Introduction 11.1 Background . . . . . . . . . . . . . . . . . . . . . . . . . . . . . . . . 11.2 Local Context . . . . . . . . . . . . . . . . . . . . . . . . . . . . . . . 11.3 E-scooter Services . . . . . . . . . . . . . . . . . . . . . . . . . . . . . 21.4 Aim and Research Question . . . . . . . . . . . . . . . . . . . . . . . 31.5 Limitations . . . . . . . . . . . . . . . . . . . . . . . . . . . . . . . . 31.6 Help for Reading the Report . . . . . . . . . . . . . . . . . . . . . . . 4
2 Phase I at Challenge Lab 62.1 Introduction to Challenge Lab . . . . . . . . . . . . . . . . . . . . . . 62.2 Work and results of Phase I at Challenge Lab . . . . . . . . . . . . . 6
2.2.1 Backcasting Process . . . . . . . . . . . . . . . . . . . . . . . 72.2.2 Step 1 - Frame condition for a sustainable future . . . . . . . 82.2.3 Step 2 - Analyse the present situations in relation to the envi-
sioned conditions . . . . . . . . . . . . . . . . . . . . . . . . . 102.2.4 Step 3 - Identify leverage points for bridging the gaps. . . . . 122.2.5 Step 4 - Identify strategies for the the identified leverage . . . 13
3 Methods 143.1 Literature review . . . . . . . . . . . . . . . . . . . . . . . . . . . . . 143.2 Quantitative Research - Online Survey . . . . . . . . . . . . . . . . . 153.3 Qualitative Research - Personal Interviews . . . . . . . . . . . . . . . 16
3.3.1 KJ method & Force Field Analysis . . . . . . . . . . . . . . . 173.4 System Mapping . . . . . . . . . . . . . . . . . . . . . . . . . . . . . 18
4 Literature Review 194.1 Advantages and Disadvantages of E-scooter services . . . . . . . . . 19
4.1.1 Advantages . . . . . . . . . . . . . . . . . . . . . . . . . . . . 194.1.2 Disadvantages . . . . . . . . . . . . . . . . . . . . . . . . . . . 204.1.3 Inference on advantages & disadvantages . . . . . . . . . . . . 23
4.2 Policy comparison . . . . . . . . . . . . . . . . . . . . . . . . . . . . . 234.2.1 Safety . . . . . . . . . . . . . . . . . . . . . . . . . . . . . . . 244.2.2 Parking . . . . . . . . . . . . . . . . . . . . . . . . . . . . . . 244.2.3 Number of e-scooters and their distribution . . . . . . . . . . 254.2.4 Law Enforcement . . . . . . . . . . . . . . . . . . . . . . . . . 254.2.5 Inference on regulatory challenges . . . . . . . . . . . . . . . . 25
4.3 User Needs . . . . . . . . . . . . . . . . . . . . . . . . . . . . . . . . 274.3.1 Studies on user needs around the world . . . . . . . . . . . . . 274.3.2 Studies on user needs in Vastra Gotaland Region . . . . . . . 284.3.3 Travel patterns and preferences in Vastra Gotaland Region . . 304.3.4 Inference from the literature search on car user needs . . . . . 36
iii

5 Survey 385.1 Survey on car user needs . . . . . . . . . . . . . . . . . . . . . . . . . 38
5.1.1 Purpose of use . . . . . . . . . . . . . . . . . . . . . . . . . . 385.1.2 Important user needs of car users . . . . . . . . . . . . . . . . 395.1.3 Ratings of user needs . . . . . . . . . . . . . . . . . . . . . . . 405.1.4 Use of public transport by car users . . . . . . . . . . . . . . . 435.1.5 Purpose of use of public transport by car users . . . . . . . . . 445.1.6 Needs to be improved in public transportation . . . . . . . . . 455.1.7 Preferred mode of transport . . . . . . . . . . . . . . . . . . . 465.1.8 Effect of age on preferred transport mode . . . . . . . . . . . . 465.1.9 Effect of gender on preferred transport mode . . . . . . . . . . 475.1.10 Effect of gender on needs to be improved in public transportation 48
5.2 Survey on e-scooters . . . . . . . . . . . . . . . . . . . . . . . . . . . 485.2.1 Purpose of use of e-scooters . . . . . . . . . . . . . . . . . . . 495.2.2 Usage of e-scooters . . . . . . . . . . . . . . . . . . . . . . . . 495.2.3 How e-scooters are used . . . . . . . . . . . . . . . . . . . . . 505.2.4 E-scooter users needs in association with car user needs . . . . 505.2.5 Improvements expected in e-scooter services . . . . . . . . . . 515.2.6 Car usage and effect of e-scooters on car usage . . . . . . . . . 515.2.7 Age and kids factor . . . . . . . . . . . . . . . . . . . . . . . . 52
5.3 Non e-scooter users . . . . . . . . . . . . . . . . . . . . . . . . . . . . 525.3.1 Reason for not using e-scooters . . . . . . . . . . . . . . . . . 525.3.2 Possibility of using e-scooters with public transportation and
improvement in e-scooter services . . . . . . . . . . . . . . . . 535.4 Analysis of survey . . . . . . . . . . . . . . . . . . . . . . . . . . . . . 54
5.4.1 Comments from surveys . . . . . . . . . . . . . . . . . . . . . 55
6 Interviews 566.1 Transition to public transportation . . . . . . . . . . . . . . . . . . . 566.2 Drivers & barriers for transition to public transportation . . . . . . . 60
6.2.1 Driving forces . . . . . . . . . . . . . . . . . . . . . . . . . . . 626.2.2 Restrictive forces . . . . . . . . . . . . . . . . . . . . . . . . . 62
7 Systems Mapping 657.1 Step 1: Effect of public transportation on car users . . . . . . . . . . 65
7.1.1 Reinforcing and balancing loops . . . . . . . . . . . . . . . . . 677.2 Step 2: Effect of e-scooters on the system . . . . . . . . . . . . . . . . 68
7.2.1 Balancing loop . . . . . . . . . . . . . . . . . . . . . . . . . . 687.3 Analysis of the systems mapping . . . . . . . . . . . . . . . . . . . . 70
8 Discussion 718.1 Needs of private car users . . . . . . . . . . . . . . . . . . . . . . . . 718.2 Advantages and disadvantages offered by e-scooters . . . . . . . . . . 728.3 Barriers and drivers to provide a multi-modal transport solution . . . 738.4 Interesting observations . . . . . . . . . . . . . . . . . . . . . . . . . . 75
iv

8.5 Recommendations . . . . . . . . . . . . . . . . . . . . . . . . . . . . . 768.6 Inference on the method . . . . . . . . . . . . . . . . . . . . . . . . . 77
9 Conclusion 79
Appendices a
A Surveys aA.1 Survey on car user needs . . . . . . . . . . . . . . . . . . . . . . . . . aA.2 Survey on e-scooters . . . . . . . . . . . . . . . . . . . . . . . . . . . b
B Survey comments eB.1 Car users preferred mode of transport . . . . . . . . . . . . . . . . . . e
C Interview questions gC.1 Car Users . . . . . . . . . . . . . . . . . . . . . . . . . . . . . . . . . gC.2 E-scooter users . . . . . . . . . . . . . . . . . . . . . . . . . . . . . . gC.3 E-scooter service providers . . . . . . . . . . . . . . . . . . . . . . . . hC.4 Regulators & researchers . . . . . . . . . . . . . . . . . . . . . . . . . h
References i
v

List of Figures1 Backcasting process . . . . . . . . . . . . . . . . . . . . . . . . . . . . 72 Sustainability light house . . . . . . . . . . . . . . . . . . . . . . . . . 93 Sustainability principles . . . . . . . . . . . . . . . . . . . . . . . . . 104 Factors of the socio-technical system . . . . . . . . . . . . . . . . . . 115 Methods . . . . . . . . . . . . . . . . . . . . . . . . . . . . . . . . . . 146 Policy Comparison . . . . . . . . . . . . . . . . . . . . . . . . . . . . 267 Factors for modal shift . . . . . . . . . . . . . . . . . . . . . . . . . . 298 Factors which affect the choice of the mode of transport . . . . . . . . 309 Length of journey using different modes of transport . . . . . . . . . 3110 Average travel time for different purposes . . . . . . . . . . . . . . . . 3111 Average travel distance for different purposes . . . . . . . . . . . . . . 3212 Work travel distance in Gothenburg and other municipalities . . . . . 3213 Different purpose and modes of travel on weekdays . . . . . . . . . . 3314 Effect of household and age on travel mode . . . . . . . . . . . . . . . 3415 Usage of different modes of transport . . . . . . . . . . . . . . . . . . 3416 Trip share in the region . . . . . . . . . . . . . . . . . . . . . . . . . . 3517 Travel share based on age . . . . . . . . . . . . . . . . . . . . . . . . 3618 Purpose of use of car . . . . . . . . . . . . . . . . . . . . . . . . . . . 3919 The most important user needs of car users . . . . . . . . . . . . . . . 4020 Survey rating scale . . . . . . . . . . . . . . . . . . . . . . . . . . . . 4021 Average ratings of car user needs - Gothenburg city . . . . . . . . . . 4122 Importance of car user needs - Gothenburg city . . . . . . . . . . . . 4223 Average ratings of car user needs - VGR . . . . . . . . . . . . . . . . 4324 Importance of car user needs - VGR . . . . . . . . . . . . . . . . . . . 4325 Use of public transport by car users . . . . . . . . . . . . . . . . . . . 4426 Purpose of use of public transport by car users . . . . . . . . . . . . . 4427 Needs to be improved in public transportation . . . . . . . . . . . . . 4528 Preferred mode of transport . . . . . . . . . . . . . . . . . . . . . . . 4629 Preferred mode of transport based on age . . . . . . . . . . . . . . . . 4730 Preferred mode of transport based on gender . . . . . . . . . . . . . . 4731 Effect of gender on needs to be improved in public transport system . 4832 Purpose of use of e-scooters . . . . . . . . . . . . . . . . . . . . . . . 4933 Usage of e-scooters . . . . . . . . . . . . . . . . . . . . . . . . . . . . 4934 How e-scooters are used . . . . . . . . . . . . . . . . . . . . . . . . . 5035 E-scooter users association with car user needs . . . . . . . . . . . . . 5036 Improvements expected in e-scooter services . . . . . . . . . . . . . . 5137 Car usage by e-scooter users . . . . . . . . . . . . . . . . . . . . . . . 5138 effect of e-scooters on car usage . . . . . . . . . . . . . . . . . . . . . 5139 Age of e-scooter users . . . . . . . . . . . . . . . . . . . . . . . . . . . 5240 Number of kids . . . . . . . . . . . . . . . . . . . . . . . . . . . . . . 5241 Reason for not using e-scooters . . . . . . . . . . . . . . . . . . . . . 5242 Combining e-scooters with public transportation . . . . . . . . . . . . 53
vi

43 Factors to be improves in e-scooters to influence the usage . . . . . . 5344 Force field analysis . . . . . . . . . . . . . . . . . . . . . . . . . . . . 6145 Systems mapping - Effect of public transportation on car users . . . . 6646 Systems mapping - Effect of public transportation and e-scooter ser-
vices on car users . . . . . . . . . . . . . . . . . . . . . . . . . . . . . 6947 Systems mapping - Effect of recommendation on the system . . . . . 78
List of Tables1 Introduction of interviewees - Car users . . . . . . . . . . . . . . . . . 162 Introduction of interviewees - E-scooter users . . . . . . . . . . . . . . 173 Introduction of interviewees - Stakeholders . . . . . . . . . . . . . . . 174 Car user needs . . . . . . . . . . . . . . . . . . . . . . . . . . . . . . 375 Driving forces . . . . . . . . . . . . . . . . . . . . . . . . . . . . . . . 636 Restrictive forces . . . . . . . . . . . . . . . . . . . . . . . . . . . . . 64
vii

1
Introduction
1.1 Background
Since the invention of automobiles, cars have influenced largely how the cities andtowns of the modern world are designed. Cars have lead to a large portion of theland in cities and towns being dedicated for roads, parking lots, driveways and trafficsignal systems. Cars are an essential travel mode for people and influence the mobil-ity habits of people. Furthermore, the cities are growing rapidly, and by 2030 it isestimated that 70% of the world’s population would reside in urban spaces (Council,2017). This rapid growth of cities has increased the congestion in cities due to theincrease in the number of cars. Cars are a prevalent mode of transport amongst peo-ple but they do come with sustainability issues such as carbon emission, inaccessibleto all, congestion on the roads. The public transport system has been found capableof overcoming the problems with cars if planned properly (Pojani & Stead, 2015).But the exponential growth of cities creates a burden of the urban transportationsystems, as they find it harder to reach the ends of the ever-growing cities.
Due to the existing gaps in the transportation requirements micromobility optionsare cropping up across cities in the globe and they promise to address the transportproblems of cities. Additionally, they plan to fill the existing gap in the public trans-portation system (Alphabet, 2019). Micromobility is, especially expected to addressthe issue of first & last-mile commute. The most dominating new technology of mi-cromobility, which is currently occupying the city space are the e-scooters (NACTO,2019). The e-scooter services are easy to use and quick to travel. They are promotedas an alternative to the use of the car and most of the e-scooter service providersclaim they are the ideal platform to support the public transportation system (EY,2020)(Fong & Mcdermott, 2019). On the contrary, the e-scooters do have their fairshare of problems and often seen to be in conflict with the human population andthe exciting infrastructure (CNN, 2019). It is, therefore, the interest of this study todetermine the potential role, which the e-scooter services can play in the transitionfrom cars to the use of public transportation.
1.2 Local Context
By 2035 it is estimated that Gothenburg city will have a population of 17.5 millionpeople and Gothenburg would transform form a small city to a big city. According totransport administration (2014) of Gothenburg, there is a strategic plan to limit thenumber of vehicles in the transport system to ensure accessibility and transportationto all residents. Further, the strategy is to allow commuters to, travel to and from thecity without increasing the number of cars from current levels. The reduction of cars
1

is also part of Vastra Gotaland region’s future plan “Malbild Koll 2035”, where thegoal is to reduce the number of cars and increase access to more sustainable modesof transport such as cycling and walking (Gotalandsregionen, 2018). Vasttrafik, thetransport agency of Vastra Gotaland region as a part of their goal for 2035, conducteda user survey ”Hallplats 2019” and determined that 67% of the residents wantedmore space for cycling and 68% wanted the current car traffic levels to decrease.Furthermore, the Swedish transport administration calculates that the number of carsshould be reduced by 20% from the 2010 levels to achieve the climate objectives ofSweden. Few of the targets for 2035 by the urban transport committee of Gothenburgcity are listed bellow (transport administration, 2014):
1. At least 35% of journeys in Gothenburg should be taken on foot or by bicycle.
2. At least 55% of motorised journeys in Gothenburg should be by public transport.
3. The maximum time to travel between two random cores or key destinationshould not be more than 30 minutes.
There is a strong push from the region to not just limit the number of cars but alsoto reduce the number of cars on the roads. This is to target the congestion on theroads and cater to the environmental impact due to cars.
1.3 E-scooter Services
E-scooter services have been a new phenomenon in cities across Europe and the UnitedStates. They try to address the issues of portable personal mobility through micro-mobility to help people move within the cities (Ajao, 2019). Starting 2018 there hasbeen an explosion in app-based dockless e-scooter service providers across differentcities (Dimitrova, 2019). This new technology though popular amongst people hashad its fair share of negative publicity due to them being parked randomly in themiddle of a sidewalk and causing inconvenience to people walking and more impor-tantly to blind people. Furthermore, it has been a common occurrence to find them incanals or rivers (CNN, 2019). Also, the safety aspect has been frequently questionedwith the number of accidents increasing and leading to fatalities (Brustein, Lanxon,& Foy, 2019). In Sweden itself, 241 cases of accidents were reported in 2019 whichincluded the death of a person in Helsingborg, compared to 21 accidents the previousyear (Local, 2019). These issues have resulted in Swedish authorities starting to lookinto regulating the use of e-scooters (Dimitrova, 2019).
E-scooters have been found to replace the usage of cars. A study in Portland, USAfound that 34% of the respondents stopped using personal cars or car sharing. On thecontrary, they have an influence on lower emission transport methods such as walkingand cycling. 48% of the respondents said they choose to use e-scooters over walking orcycling (PBOT, 2019). Furthermore, they are found to be not environmental friendly.A study at North Carolina State University in the United States found that the carbonemission of e-scooter is more significant compared to that of walking, biking, public
2
transportation and even car in few cases while considering the entire life span of thee-scooters (Hollingsworth, Copeland, & Johnson, 2019). The e-scooters have theirfair share of advantages and disadvantages, which is discussed in section 4.1.
1.4 Aim and Research Question
The research aims to determine the possibility of using e-scooter services to facilitatethe transition of car users to use public transport system in Vastra Gotaland region,VGR. As explained in the section 1.2, e-scooters services are a new phenomenon inmicromobility. Therefore the research aims to determine the e-scooter’s potential tofulfill the needs of the car user. Thus, e-scooters creates a great interest to deter-mine the possibility of providing a multi-modal transport solution along with publictransportation. This leads to the research question:
“Can the e-scooter services play a role in car users adapting publictransport systems?”
To answer the research question it is important to evaluate the interplay between thecomplex dynamics of the technology of e-scooters, the current regulations, the currentinfrastructure, public transportation and the car user’s needs. This leads to the subquestions of:
i What are the needs of car users for transition to other modes of transport?
ii What are the advantages and disadvantages offered by e-scooters to facilitatethe transition?
iii What are the barriers and drivers to provide a multi-modal transport solution?
1.5 Limitations
The scope of the study was limited to using e-scooter services to address the needsof car users to transition to the public transportation system in Vastra Gotalandregion,VGR. Also, the study does not consider the effect of individual e-scooter own-ership. Furthermore, the study does not focus on other modes of transportation, suchas shared bikes or taxis due to limitation in time. However, the impact of shared carservices has been included in the study, as it was observed that it played a role in ful-filling a few of the needs of e-scooter users. The working and implications for sharedcar services are not studied in detail.
The empirical study of car users and e-scooter users using interview focuses only onthe aspect of using the e-scooters to fulfill the needs of car users to adopt the use ofpublic transport system, Vasttrafik. Furthermore, the subjects for empirical studyusing interviews were identified using the snowball process. This method runs therisk of not interviewing the right person. The study was affected by the onset of thepandemic of COVID 19, making it a challenge to access people for workshops. The
3

casual loop diagram (systems mapping) of the car users, public transportation and e-scooter services was thus carried out by the author instead of having a workshop withstakeholders. This runs the risk of not capturing the complete perspective. Finally,the outcome of the study is limited to recommendations for e-scooter service providersin VGR, though the findings can be applied to other regions in Sweden.
1.6 Help for Reading the Report
This section provides a brief information on “what to expect?”, from the forthcomingchapters in the report. The purpose is to help the reader understand the methodologyfollowed in the study.
Chapter 2: Phase I at Challenge LabThis chapter focuses on the work done in the Phase I at Challenge lab to determinethe leverage point and research question related to sustainability issues in transporta-tion for Vastra Gotaland region.
Chapter 3: MethodsThis chapter provides information on the methods followed in the Phase II of Chal-lenge Lab to answer the research question.
Chapter 4: Literature ReviewThe literature review was carried out to determine the pros and cons due to thee-scooter services across the globe. Additionally, it also gathers information on theneeds of car users from around the world. The information in this chapter was instru-mental in developing questions for the qualitative and quantitative studies regardingthe needs of the user in VGR concerning the mobility of people.
Chapter 5: SurveysThis chapter presents the data gathered and the analysis of the surveys on car user’sand e-scooter user’s needs. The surveys were used to determine the applicability ofthe user needs identified in the literature review. Additionally, it also captures thefactors which the users felt the necessity to be improved in e-scooter services and pub-lic transportation. This information was instrumental in helping developing questionsfor personal interviews.
Chapter 6: InterviewsThe interviews were used to confirm the findings from the literature review and sur-veys. This chapter presents the analysis of the data gathered in the interviews withthe help of KJ method. Additionally, it also uses force field analysis to analyse thedata from interviews to determine the drivers and barriers for the transition of carusers to public transportation. The analysis tools of KJ method and the force fieldanalysis are explained in detail in Chapter 3, methods.
4

Chapter 7: Systems MappingThis chapter puts together the information from the analysis of surveys and inter-views to develop a causal loop diagram of the current landscape of VGR to includethe effects of car users, e-scooter services and public transportation. This is instru-mental in visualising the interplay between the factors affecting the use of e-scooterservices and public transportation system from a car user perspective.
Chapter 8 & 9: Discussion and ConclusionThese two chapters put together all the information gathered in the study and pro-vides the author’s inference on the current set up and possible recommendation tohelp in the transition of private car users to use more public transportation.
5

2
Phase I at Challenge Lab
2.1 Introduction to Challenge Lab
In the current scenario in the world, it is crucial to address the environmental impactof human’s behaviour and actions. Furthermore, while addressing the environmentalimpact it is important to consider the challenges it poses to sustainability to mankind.To address this, the United Nations came up with seventeen sustainable developmentgoals, SDG to transform the world. Furthermore, these goals were adopted by all theUN member nations in 2015 (United Nations, 2020).
The critical issues being faced now is the challenge with countries, agencies or evenorganizations trying to address the SDG identified individually. The individualisticgoal approach causes the lack of synergy to achieve the SDG and does not factor inthe issues it causes on the other sustainable development goals.
The “Challenge Lab” at Chalmers started in 2014, focuses on addressing the sustain-ability challenges related to Vastra Gotaland region. The Challenge Lab is a uniqueinitiative which identifies the importance of transformation supported by integrationof all the sustainability challenges. Additionally it tries to bring in a systematicchange by providing a platform for stakeholders in academia, industry, the publicsector and the civil society to collaborate to solve sustainability challenges related toVastra Gotaland region.(Challenge Lab, 2020)
2.2 Work and results of Phase I at Challenge Lab
Phase 1 of the the Challenge Lab focused on identifying the sustainability challengesrelated to Vastra Gotaland region and further identify and develope a related researchquestion for the thesis study. The thematic area to be addressed for the year 2020 waschoosen by Challenge Lab as “Mobility” in Vastra Gotaland region by the ChallengeLab. Further, the thematic area was categorized into the below mentioned fourthemes.
1. Mobility due to tourism.
2. Mobility of goods.
3. Collective mobility.
4. Personal (Individual) mobility.
6

2.2.1 Backcasting Process
It is very natural to be influenced by the ongoings in the present societal systems, beit the current technological influence or the societal norms. Thus planning a futurebased on the current trends, would limit the vison and the possibility of an idealfuture. Backcasting as a planning method overcomes this flaw. Backcasting helpsto visualize the complex societal systems coupled with ecological challenges. Fur-thermore it provides an opportunity to visualize a future towards sustainability byconsidering socio-ecological principles as a base (Azar, Holmberg, & Lindgren, 1996).These socio-ecological principles envisioned, would enable handling the complex soci-etal systems in a systematic and coordinated way (Holmberg & Robert, 2000). Thissection highlights the backcasting process (figure 1) followed at Challenge Lab toidentify the leverage point related to issues with mobility in Vastra Gotaland region.
Backcasting process follows four steps mentioned below:
1. Frame condition for a sustainable future.
2. Analyse the present situations in relation to the envisioned conditions.
3. Identify leverage points for bridging the gaps.
4. Identify strategies for the the identified leverage.
Figure 1: Backcasting process
The following steps explains the process set up by Challenge Lab to define the desiredfuture and develop the research question.
7

2.2.2 Step 1 - Frame condition for a sustainable future
Self-leadership WorkshopThe self-leadership is the first activity carried out as a part of the Challenge Labprocess to help students identify their core values and strengths. The self awarenessabout the values and the strengths is crucial for students while going forward withthe research project.
The workshop started with each student identifying upto five core values which theyfeel is important to them. Then the the group is divided into groups of three. Ineach group the students are allowed to express the importance of “storytelling” andits purpose is to build trust and openness. Each person in the group are assignedseparate roles, focus person, listener and observer. Starting with focus person, whoshares personal experience related to the chooses values. The listener’s role is to listento the focus person without commenting or asking questions. The listener is only al-lowed to affirm the communication through body language, such as nodding the heador a smile. This allows the focus person to express what he/she is thinking withoutbeing influenced by the other person. Simultaneously the observer, is supposed toobserve the interaction between the focus person and the listener. Furthermore theobserver is also responsible to monitor the time. This exercise is repeated until allthe members in the group have expressed about their values. Later, each person isallowed to express what they perceive are the three main strength of the other twostudents. Thus, this exercise helps in building trust and bond between students duethe sharing of experience.
The “storytelling” exercise is then followed by personal strength exercise. In thisexercise the students are tasked with identifying three of their strengths and thendiscussing them with another students. The strength identification is crucial to beaware of the strengths of the group, as it is improves coordination during the processof identifying leverage points during phase I. Furthermore it also helps students iden-tify the negative aspects of the strengths when overdone and how could it be balanced.
The sustainability light houseThe visualizing the desirable future was the next activity in the process at Chal-lenge Lab. This visualization was achieved by using the sustainability light house(Holmberg & Larsson, 2018). The sustainability light house (figure 2) provides aframework to facilitate the transformative change to achieve sustainability. It allowsto visualize and encompass the desirable future uninfluenced by the current dynam-ics of the society. The sustainability light house identifies four dimensions based onsocio-ecological principles which are interdependent on each other and are crucial tovisualize the the desired future. The dimensions are namely, human needs and well-being, social sustainability, economic sustainability and environmental sustainability(Holmberg & Larsson, 2018).
8

Figure 2: Sustainability light house
To formulate the principles for a desired future, the sustainability light house was usedin backcasting process during the workshop. The whole group was divided into fourgroups based on the identified thematic areas of mobility. These groups were theninvolved in formulating the principles for the four dimensions of the sustainability lighthouse. The groups used brainstorming technique to come up with keywords/principlesto identify the respective sustainability principles. The identified keywords/principleswere then grouped depending on their relevance to each other, followed by identifyinga common keyword to represent the grouped keywords/principles. This result wasthen presented to the other groups followed by a discussion to combine, refine andunderstand the underlying reason for the keywords. The identified principles relatedto mobility can be seen in figure 3.
9

Figure 3: Sustainability principles
2.2.3 Step 2 - Analyse the present situations in relation to the envisionedconditions
System mappingSystem mapping uses the multi layer perspective, MLP, to capture the current hap-penings in the society. As Geels (2005) describes the MLP has three levels, namely,meso-level, micro-level and macro-level. The meso-level captures the current regimes(system) and primarily captures “how things are working currently”. The micro-levelon the other hand looks at the new niches (technology, regulations etc) which arecropping up and they provide a greater learning opportunity to challenge the currentregime. Finally the macro-level captures the socio-technical landscape, which includesthe wider exogenous environment and affects the socio-technical development (glob-alization, environmental problems etc)(Geels, 2005).
Socio-technical systemIt is critical to understand that the aspect of the current regimes are affected by thesocio-technical actors such as regulators, politicians and society (A. Smith, Stirling,& Berkhout, 2005). The society and technology are interconnected to each other andinfluence each other at different levels with six factors of knowledge, societal norms,regulations, market dynamics, existing technology and infrastructure influencing eachother (figure 4)(Geels, 2002).
10

Figure 4: Factors of the socio-technical system
Challenge Lab works to bring changes at the macro-level to have a sustainable soci-ety. The current meso-level (regimes) and micro-level (niches) were captured usingsystem mapping in the four thematic areas identified. This was achieved by splittingthe challenge lab students in four groups to work on one thematic each. The groupsthen captured the regimes and niches in Vastra Gotaland region through brainstorm-ing. The captured information were further categorised based on the six factors ofsocio-technical systems. Once the regime and niches were captured the groups alsoworked on the other three themes to discuss and add any missed out information.Furthermore the system mapping and grouping of the tasks acted as enablers to formquestions in the four thematic areas to be taken into the stakeholder discussions.
Stake holder dialogueThe stakeholder dialogue was carried out after the system mapping of the regimesand niches of Vastra Gotaland region. The purpose of the dialogue was to verify thesystem mapping and to fill possible gaps in the captured system mapping. Further-more, dialogue with the stakeholders would help in identifying challenges which theyare facing in the current system to attain the future determined in step 1. Also, itwould help to identify the drivers and barriers to bring change in the system.
The stakeholder dialogue was carried out in a fishbowl setting. Fishbowl settingprovides an opportunity to encourage dynamic group interactions and active partic-ipation in a large group setting. This is achieved by having a small group whichincludes the experts in the field to carry out the discussion in the inner circle and therest of the group in the outer circle observing the discussion. Sometimes it is allowedto interact with the outer circle to keep the energy and flow of the discussion progres-
11

sive (Arivananthan, 2015). The challenge lab students facilitated the dialogues withstakeholders by sharing the roles of facilitators, active dialoguers and metalisteners.Each dialogue had inner circle with the experts, facilitators and the active dialoguersto engage the conversation with the experts. The outer circle consisted of metalis-teners to observe the dialogue and the notetakes.
Totally three dialogues were carried out. One for the theme for mobility of goods,followed by mobility due to tourism. The final dialogue included both personal mobil-ity and collective mobility. The experts invited to the dialogues represented a broadspectrum of expertise. It included, researchers, experts from the public sector andprivate sectors.
The dialogues resulted in the updating of the system mapping. Furthermore providean insight into niche areas in the current setup in the region and developing tech-nologies where further research needed to be carried out to understand and arriveat the envisioned future. Also, after the dialogue the themes of personal mobilityand collective mobility was decided to be combined into mobility of people, as it wasidentified during the dialogue that they are dependent on each other.
2.2.4 Step 3 - Identify leverage points for bridging the gaps.
The outcome of the dialogue was the identification in existing challenges and barriersfor sustainable mobility. The Challenge Lab students were split into groups based onthe three thematic ares of, mobility due to tourism, mobility of goods and mobility ofpeople based on the interest of the students. A second system mapping was carriedout to identify the leverage points. The leverage point is an “area of potential” in asystem where a smaller intervention can lead to larger changes in the system. Thestudents identified one or two leverage points in each thematic area. During theidentification of the leverage points the following questions were factored in.
1. Sustainability challenge: What is the biggest challenge to address?
2. Static/Dynamic system: Which “lock-in” to address? and which factors areimportant related to the regional problem?
3. Stakeholders/processes: Which individuals and/or organizations are interested?and which are the connected ongoing processes?
The “leverage point” identified for the thematic area of mobility of people was “Ac-tual vs perceived needs of cars”. This identified leverage point was then linked tothe top five key factors which affected it: perceived convenience of users, existinginfrastructure of the region, business model of car manufacturers, alternate modesof transportation and public transport. These five factors were identified based onsystem mapping done initially and the stakeholder dialogues. Furthermore, it wasmapped how these factors are connected to each other and the leverage point. Thisled to the identification of the objective “Reduce the number of cars on the roads”.
12

2.2.5 Step 4 - Identify strategies for the the identified leverage
Based on the objective identified “Reduce the number of cars on the roads” andthe information gathered during the phase I of the research, it was observed duringpreliminary literature search that, there has been a lot of work carried out to deter-mine solutions to reduce cars. The findings have been to increase public transporta-tion (Pojani & Stead, 2015), to provide multi-modal transport solutions (Kabashkin,2015) and even to plan/design car free societies (Khreis, Nieuwenhuijsen, & Basti-aanssen, 2017). Also, during the backcasting process at Challenge Lab, e-scooterswere identified as a niche new technology which could influence how people travel.The motivation to reduce the number of cars with the help of e-scooters and theresearch question has been explained in the sections 1.2 & 1.4 respectively.
13

3
MethodsThis section describes the methodology, which was followed to answer the researchquestions. The figure 5 shows the different methods which will be used to gatherinformation and analyze it. The research’s primary focus is to determine the car userneeds, which needs to be fulfilled by e-scooters to help in the transition to using publictransportation. The empirical evidence was collected through surveys and interviews.To analyze the collected information KJ method and force field analysis was carriedout to determine the barriers and drivers. Furthermore, systems mapping was carriedout to visualize the current system along with the user needs to determine the existinginterplay and disconnect.
Figure 5: Methods
3.1 Literature review
A literature review provided the opportunity to gather background information on theexisting research and also capture the findings from those researches. The traditionalliterature review is used to analyse and summarise researches and to identify gaps inthe study. Further, it helps in defining objectives to carry out a study(O’Gorman &MacIntosh, 2015).
14

Literature review was carried out through internet search, Google scholar and Chalmerslibrary to find relevant research and articles regarding the topic. The literature searchand review focused on two aspects.
1. Identify the needs of the car users for transition to other modes of transport.
2. Identification of advantages and disadvantages of e-scooter services.
The most important aspect of the literature search was to identify the needs of carusers, as this determines the goals for e-scooter services to fulfil. The literature searchthus provided key insights into the e-scooter technology and user needs. Additionally,the literature search helped in identifying key factors which are important to providea multi-modal transport solution using e-scooters and public transport system. Ad-ditionally helping in forming questions for online surveys and personal interviews.
To determine the car user needs the following keywords and phrases were used forliterature search to identify the car users needs “car user needs”, “needs of car users”,“public transportation & cars”, “car use and public transportatio”, “reduce car us-age”, “car users Gothenburg”, “public transportation and cars in Gothenburg” and“car usage in Vastra Gotaland region”.
The literature review was also used to identify the advantage and disadvantages ofe-scooter services. Additionally the literature review was instrumental in identifyinghow different cites across the globe are adopting to this new mode of transporta-tion and the challenges they are facing. This was determined by searching for keywords and phrases of “e-scooters advantages”, “benefits of e-scooter services”, “e-scooters policies”, “e-scooters in Sweden”, “e-scooters safety”, “e-scooters accidents”,“e-scooters in Europe”, “e-scooter policies”, “e-scooters and regulations”, “e-scooterlife-cycle”, “e-scooters and environment” and “issues with e-scooters”.
3.2 Quantitative Research - Online Survey
A quantitative research allows to investigate facts and confirm results from otherexperiments. Thus, it provides an opportunity to build further knowledge in a sys-tematic way and support in carrying out new studies (Apuke, 2017).
The quantitative research was carried out through customer surveys. Two customersurveys were carried out online. The questions of the customer survey were developedbased on the results from the literature review. Furthermore, the customer surveyfocused on confirming the applicability of the car user needs in the local contextrelated to Vastra Gotaland region. The second survey focused on determining theuser needs which were being fulfilled by e-scooters. The purpose of the online surveywas to generate information on needs and identify patterns through quantitative data.Also, the surveys had some non-quantitative open ended questions to understand thereasons for the choices made. The results from the survey were used in developingquestions for the interviews to carry out a detailed qualitative analysis.
15

3.3 Qualitative Research - Personal Interviews
Qualitative research supports creating high-quality information by contacting the cus-tomers directly. Interviews provide an opportunity to come in direct contact with thecustomers and concerned stakeholders also allowing to capture non-verbal informa-tion (Ulrich & Eppinger, 2012).
The personal interviews were based on the factors identified from the literature searchand the results from online surveys. They were in-depth interviews. Interviews werecarried out online using video sharing platforms of Skype & Zoom. Additionally, theinterviews were of semi-structured type. The semi-structured interviews are found tocontribute towards a qualitative discussion with open-ended question without stick-ing to a definitive question pattern (Adams, 2015). The interviews were recorded toensure all the minute and valuable details can be captured and later converted totranscripts (Rutakumwa et al., 2019). Additionally, the identity of the intervieweeshas been made anonymous by changing the names, as few interviewees requested foranonymity.
The interview focused on three groups of people, the first two groups being the carusers and e-scooter users who are introduced in table 1 and table 2. The questionsfor the car user group was directed to understand there needs of car usage and also todetermine their perception of public transport and e-scooter services.The informationfrom the car users interview played a primary role in identifying the drivers andbarriers for modal shift to public transportation, further these identified drivers andbarriers were used to carry out the force field analysis (figure 44). The questions tothe e-scooter users were directed to understand how they use the e-scooters and whatuser needs they are fulfilling. The guiding questions for the interviews can be foundin appendix C.
Table 1: Introduction of interviewees - Car usersDaniel Lars Jessica Joakim
Residence Ale municipality Gothenburg Boras GothenburgGender Male Male Female MalePeople inhousehold
2 3 3 >3
Age group 26-35 51-65 36-50 26-35
16
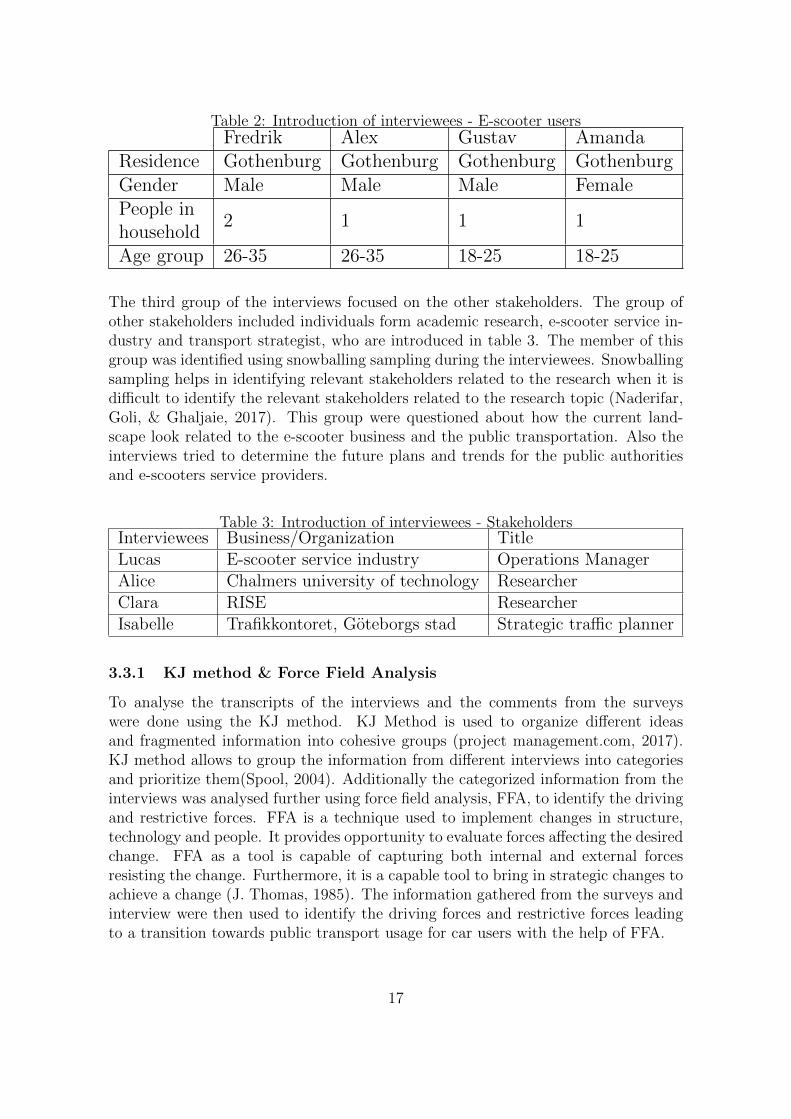
Table 2: Introduction of interviewees - E-scooter usersFredrik Alex Gustav Amanda
Residence Gothenburg Gothenburg Gothenburg GothenburgGender Male Male Male FemalePeople inhousehold
2 1 1 1
Age group 26-35 26-35 18-25 18-25
The third group of the interviews focused on the other stakeholders. The group ofother stakeholders included individuals form academic research, e-scooter service in-dustry and transport strategist, who are introduced in table 3. The member of thisgroup was identified using snowballing sampling during the interviewees. Snowballingsampling helps in identifying relevant stakeholders related to the research when it isdifficult to identify the relevant stakeholders related to the research topic (Naderifar,Goli, & Ghaljaie, 2017). This group were questioned about how the current land-scape look related to the e-scooter business and the public transportation. Also theinterviews tried to determine the future plans and trends for the public authoritiesand e-scooters service providers.
Table 3: Introduction of interviewees - StakeholdersInterviewees Business/Organization TitleLucas E-scooter service industry Operations ManagerAlice Chalmers university of technology ResearcherClara RISE ResearcherIsabelle Trafikkontoret, Goteborgs stad Strategic traffic planner
3.3.1 KJ method & Force Field Analysis
To analyse the transcripts of the interviews and the comments from the surveyswere done using the KJ method. KJ Method is used to organize different ideasand fragmented information into cohesive groups (project management.com, 2017).KJ method allows to group the information from different interviews into categoriesand prioritize them(Spool, 2004). Additionally the categorized information from theinterviews was analysed further using force field analysis, FFA, to identify the drivingand restrictive forces. FFA is a technique used to implement changes in structure,technology and people. It provides opportunity to evaluate forces affecting the desiredchange. FFA as a tool is capable of capturing both internal and external forcesresisting the change. Furthermore, it is a capable tool to bring in strategic changes toachieve a change (J. Thomas, 1985). The information gathered from the surveys andinterview were then used to identify the driving forces and restrictive forces leadingto a transition towards public transport usage for car users with the help of FFA.
17

3.4 System Mapping
System mapping was carried out based on the information form FFA, user surveys andpersonal interviews. This was be achieved by using casual loop diagram to capturethe dynamics of the complete system. The casual loop diagrams helps in visualizingthe current system and additionally helps to map out relations between seeminglyisolated things (Bala, Arshad, & Noh, 2017).
The end result of the system mapping therefore enabled to identify the effects of caruser needs for transition to using public transportation. Also, it helped to determinethe effect the e-scooters are having on the current system to support this change.
18

4
Literature Review
4.1 Advantages and Disadvantages of E-scooter services
This section looks into the media reports on e-scooters to identify the advantages anddisadvantages created after the introduction of the e-scooter services. Further, thissection also includes information from the scholarly articles and literature availableon these advantages and disadvantages.
4.1.1 Advantages
Travel time & cost of travelStudies have determined that e-scooters have a capability to travel quickly and at alower costs compared to car. A study carried out by C. S. Smith and Schwieterman(2018) in Chicago, USA found that, for shorter trips between 0.8 to 4.2 kilometersthe e-scooters were a good alternatives costing less than the cars and public trans-portation. additionally they even out performed the bike sharing service availableand saved upto four minutes of travel time. The study further determined that thee-scooters were successful in providing a quick access to jobs compared to publictransportation or walking within the city limits of Chicago.
Convenience of useE-scooters have been found to be convenient for people to use it. E-scooters aresmaller compared to bicycles and thus can be made to be available at more spaces.Further the e-scooter services work on the dockless parking platform, thus they arefree standing and provides a greater flexibility for users for parking (C. S. Smith &Schwieterman, 2018). Robinson (2018) expresses the usage of e-scooter services areperceived by users to be easy, with mobile applications being used to find the locationof the e-scooter and using the same application to lock,unlock and make payments.
Replacing car usageSome studies have found that, e-scooters have a potential to reduce the car usage.In a pilot program carried out in Portland, USA by PBOT (2019) it was found that38% of residents and 48% of visitors to the city used e-scooters instead of using car.Further 6% of the respondents in the study claimed that they had gotten rid of thecar and another 16% were considering selling their cars. In a Survey by e-scooterservice provider Voi, 12% of the e-scooter users responded that it had replaced carusage (EY, 2020).
19

Lower carbon emissions on useIt has been found that, while using a e-scooter its carbon footprint is much lowerthan a petrol or diesel powered car. Further the efficiency related to power is alsoconsiderably high. 1 kWh (Kilowatt Hour) of energy allows an e-scooter to travelaround 128 kilometres, where as the same 1kWh allows a petrol-powered car to travelless than 1.6 kilometers (The Royal Society for the Prevention of Accidents, 2019).This energy efficiency of the e-scooters is due to the fact that they have less weightper person compared to cars. Additionally for the same reason of lower weight perperson, they are more energy efficient to manufacture compared to cars. In Portlandduring the pilot, it was determined that e-scooters prevented automobiles for emitting122 metric tons of carbon emissions (PBOT, 2019). Further they are estimated toproduce 25% of the CO2 emissions of the car (France 24, 2019).
Potential to solve last mile problemE-scooters provide advantage in parking constrained environments, they fill a voidwhere their is limited access to public transport. Accessing a e-scooter is easiercompared to public transport or shared bike service. The use of e-scooters do notface last-mile problems. In Portland, USA, the results of the e-scooter pilot programdetermine that they provided travel opportunities when the public transportationis lacking. In East Portland where the public transportation is underrepresentedcompared to rest of the city, when e-scooters were introduced it was found to helppeople in movement. The result found that the average travel distance using e-scooters was 2.6 kilometers compared to the city average of 1.6 kilometers (PBOT,2019). The survey by e-scooter service provider, Voi, determined that 63% of itsrespondents use e-scooters in combination with public transportation (EY, 2020).
4.1.2 Disadvantages
Safety ConcernE-scooters have created a major safety concern, with the number of accidents anddeaths increasing as the number of users increase. In the United States 8 deaths werereported in 2017 while using e-scooter services (The Royal Society for the Preventionof Accidents, 2019) and has seen more than 300% increase in deaths with 29 beingreported in 2019 (Quartz, 2019). The injuries reported due to e-scooters has also seenan exponential increases, with injuries increasing 83% from 8,016 in 2017 to 14,651in 2018 in the United States (Pesce, 2020). These accidents and injuries with use ofe-scooters can be attributed to lack of awareness of regulations or disregard to theregulations. This has lead to illegal and risky riding habits, such as riding in areaswhere they are not allowed, double riding (i.e passenger doubling), or not using hel-mets. In Portland, USA it was found that 90% of the users did not use helmet whileriding, even though its an offence. Further it was also found that e-scooter users usedsidewalks in the absence of bike lanes and this caused people walking to feel unsafe(PBOT, 2019). Additionally a study by Haworth and Schramm (2019) in Brisbane,Australia determined that more than half the population rode the e-scooters illegallyby riding on roads and not using helmets. The study further identified that even the
20

service providers didn’t follow the rules, thus encouraging risky riding. The studyfound that, when Lime a e-scooter service provider introduced their services in Bris-bane the helmet were easily available but with time the helmets were not found withthe scooters.
Weather factorWeather has so far played a role in determine the availability of e-scooters services.Bad weather causes a safety concern for the usage of e-scooters and it is not advisedto ride in icy or snowy conditions as it leads to the e-scooters slipping and result-ing in accidents. It is a common sight that the e-scooters services are withdrawnduring winter, thus affecting the services depending on the season. Voi the Swedishe-scooter service provider had suspended the service over a week in Stockholm in2018 (Griswold, 2019). In Milwaukee, USA the e-scooter service providers monitorthe weather and decide if the services are available or not (Carson, 2020).
Non-Profitable BusinessAlthough the dock-less sharing services provide advantages, none of the e-scooter ser-vice providers has been profitable yet. The main reasons for this have been immensecompetition, which forces the e-scooter services to lower the price for usage to havea user base. The e-scooters are expected to have a life span of 5 months, but inreality, it is found to be much lower, which is around 28 days (Faxer, 2019). Further-more, the business model works by using trucks to pick up scooters to charge andredistribute the e-scooters and adds additional logistical cost to the businesses. Thelow lifespan and the high operating price has increased operational cost comparedto returns on the service provided. Some basic calculation carried out by Griswold(2019) in Louisville, USA found that Bird the e-scooter service provided looses 293$per e-scooter over its lifespan. The main reason for low lifespan has been attributed tobe vandalism. The e-scooters have been found in canals, rivers and bushes. Also, inmany cases, the reckless riding on the user’s part results in damaging the e-scooters,thus lowering the life of the scooters (CNN, 2019). All these factors together haveresulted in the e-scooter services to be nonprofitable.
PollutionE-scooters have also come into conflict with the society, primarily due to the waythe dock-less bike-sharing services work. Since they can be parked anywhere, theycan often be found to be parked on roads and sidewalks and causes inconvenienceto other modes of transport. Further, the business models focus on increasing thesupply of e-scooters in areas of high usage, resulting encroachment of public placesfor parking and results in blockage of parts and visual pollution. Additionally, thentend to fall in heavy winds and thus end up blocking the sidewalks. Also, due to theissue with vandalism, they have often ended up in rivers and canals, thus pollutingthem since they are equipped with batteries this further causes a significant threatto the organisms in the water (CNN, 2019).
21

The e-scooter service business model uses redistribution using cargo trucks. The car-bon emissions are found to be high when the manufacturing, charging, redistributionand the lower lifespan of e-scooters are considered. Therefore no advantage over carsis seen. The life cycle assessment carried out by (Hollingsworth et al., 2019) foundthat e-scooter emits 202 grams of CO2 per passenger-mile, which is similar to thatof combustion engine cars. The CO2 emission by e-scooters is 3.5 times than that ofelectric cars (Fournier, 2019). Additionally, even while just considering the journey,the emission by e-scooters is 40 times of public transportation (France 24, 2019).
AvailabilityThe way the e-scooter services are set up to maximize the profitability, they providea more significant number of scooters based on the density of the population. Thus,increasing the usage and generating revenue for the companies. This results in thecity centers having greater availability of e-scooters and reduction in supply as onemove towards the suburbs. In the pilot program at Portland, USA, it was foundthat despite regulations requiring the deployment of e-scooters in East Portland, onlyone company complied (PBOT, 2019). Further, due to this dependency, there is alack of services in rural areas or towns as profitability is a challenge (Zipper, 2020).Additionally, due to the dockless nature of the parking of e-scooters, it cannot beconsidered to be always available at the same location.
Replacing lower emission travel modesTh e-scooter have been found to replace waking or cycling as a mode of transport.Walking and cycling are considered to be beneficial for the individuals’ health andto have a low carbon footprint. In Portland, USA it was found that 42% of thee-scooter users said, they would have walked or cycled in case of the absence of e-scooters (PBOT, 2019). In Paris, France it was found that e-scooters replace half ofthe trips which were walk able and 30% of the users said they would of used publictransportation if e-scooters were not available (Wired, 2019).
Size RestrictionsE-scooters are designed to carry one person and the form factor also does not allowusers to carry big bags. This limits the usage of this new travel mode for variouspurposes, such as to go for groceries shopping, moving furniture and also for multiplepeople to travel. In a focus group conducted by PBOT (2019) Portland, USA, theusers expressed that transporting kids was not possible with e-scooters.
Regulatory challengesOne primary concern with the e-scooters is the ambiguity over the regulations neededfor e-scooters. E-scooters are relatively a new mode of transport which shares theinfrastructure of the existing transport modes. E-scooters being a novel technologyand also with the cities looking for alternatives to decongest the roads, has resulted inthe regulations being updated as more data is received on the usage and functioningof the e-scooter services. When the e-scooters arrived in the American cities, theydid not have any permit, which later lead to the introduction of orders and fines to
22

regulate the services (smart city, 2020). In European countries such as Austria andSweden have categorized them in the same categories as bicycles, even though theyrun on electric motor and can travel much faster than a bicycle (The Local, 2019)(smart city, 2020).
The regulatory concerns for e-scooters includes issues such as categorisation of trans-port mode, safety aspects and use of infrastructure. To understand the issues due tounclear or lack of regulations, a literature study was carried out to determine howregulators and different cities across the world are adapting to this new phenomenonof e-scooters, which is explained in detail in the section 6.
4.1.3 Inference on advantages & disadvantages
The literature search on e-scooters services have found it to be cost effective andquicker for shorter distances than public transportation. Furthermore they have agreat potential to solve the last mile problem, whenever the public transportationhas been lacking. This factors are helped by the dockless nature of the services withthe support of small size of e-scooters making it easier to ride and park. But thesmall size and dockless nature brings in challenges such as allowing only one personto travel and limitation carrying big bags and constant availability of the service beinga concern. Also, the weather has been found to have an effect on choice of e-scooteras a mode of transport.
Additionally, it has had an positive effect in reducing car usage especially in USA.But the e-scooters have also resulted in reduction in people using more sustainabletransport modes such as walking or biking. Also a conflict is seen with regard toenvironmental benefits with studies showing benefits on usage, but having a seriouscarbon implications over its life cycle, which is found to be short due to a serious issueof vandalism. Additionally the short life cycle of the e-scooters has had a profoundeffect on the balance sheets of the e-scooter service providers.
Furthermore, the e-scooters conflict with the other modes of transport. There hasbeen an increase in injuries and accidents. The accidents are commonly observedand are mostly attributed to bad riding habits and confusion created due to lack ofdedicated riding space, as they mostly tend to use bike paths.
4.2 Policy comparison
This section looks at the regulations related to four areas of “safety”, “parking”,“number and distribution” and “law enforcement”. For the comparison purpose sixcities namely Portland, Dallas, Paris, Stockholm, Berlin and Brisbane spread overthree continents of North America, Europe and Australia were picked with no specificreasoning going into their selection other than for the geographic spread. They werepicked based on their mentions in literature and newsletter during the preliminary
23

literature research on e-scooter services. The comparison is also summarized in thefigure 6.
4.2.1 Safety
Safety has been a concern after the launch of e-scooter services in cities. To avoidconflict with the other travel modes especially pedestrians, the e-scooters have beenbanned to be ridden on sidewalks which is seen in four of the six cities. With excep-tions of Dallas where barring one restricted zone in the center of the city it could beused on sidewalks and Brisbane making it mandatory to use on sidewalks instead ofbikepaths (Riga, 2019). Additionally all the cities have some form of speed limit rang-ing from 20 to 25 kms/hour with an exception of Dallas which has a relatively higherspeed limit of 56 kms/hour(City of Dallas, 2019). It is observed that in the citiesof Paris, Berlin, Portland and Stockholm they share the rules and infrastructure ofbicycles and are supposed to use bike paths available and in case of absence of themto be ridden on roads (PBOT, 2019) (Gossling, 2020) (Tidey, 2019) (QueenslandGovernment, 2019)(Kreuzer, 2019).
All the cities also have age limits set to use the e-scooters, the age restrictions rangingfrom 12 to 18 years. Where Paris has the lowest age limit with 12 years of usersand on the other end in Stockholm and Dallas the users should be an adult, i.eat least 18 years old (Tier, 2020). Along with the age limit the cities of Portland,Dallas and Brisbane have made it mandatory to wear an helmet while riding an e-scooter. Whereas in Paris, it is mandatory to have an helmet on using on faster roads,otherwise it is just an recommendation (BBC, 2019)(Crellin, 2019).
4.2.2 Parking
E-scooters have had a lot of issues related to bad parking (CNN, 2019). Also dueto the dockless business model there is no dedicated parking space (C. S. Smith &Schwieterman, 2018). Though the e-scooter companies and authorities in the citeshave placed restriction on parking in few areas with the help of geofencing technolo-gies and information provided through e-scooter applications (Brandt & Toll, 2019).None of the cities were found to have any regulations on how to park other than forguidelines (City of Dallas, 2019). The same guidelines are communicated by e-scooterservice providers, such as, parking in a way that it does not block the movement ofpedestrian or other vehicles or cause public safety risk (VOI Technologies, 2020).Also Bird, a e-scooter service provider in Paris has started to provide incentives forriders for parking in dedicated spaces (Bird, 2019). Thus the parking behaviour havemainly been dependent on the user of the e-scooter making it a challenge to regu-late the parking. Further enforcement of good parking habits is difficult as they aredependent on the interpretation of the law enforcing officers.
24

4.2.3 Number of e-scooters and their distribution
It was found that the cities of Portland, Berlin, Paris and Brisbane have some form oflimiting factor on the number of e-scooters which could operate in the cities to avoidthe clutter on the streets (Wired, 2019). Further authorities in Portland have madeit mandatory for e-scooter services providers to evenly provide services in all parts ofthe city while emphasising a greater supply of e-scooters where the access to publictransport is lower (PBOT, 2019). On the contrary on such restrictions were found tobe existing in the cities of Stockholm and Dallas.
4.2.4 Law Enforcement
In Brisbane the users are fined for not wearing a helmet, riding on bikepaths and overspeeding by the police (Riga, 2019). It was also found that the cities of Berlin andParis has been enforcing laws on the usage of e-scooters by issuing fines for bad parkingand riding on sidewalks (Marcus, 2020) (Crellin, 2019). Though the challenge hasbeen, when the e-scooters are already parked it is not possible to determine the user,The city of Dallas has addressed this by picking up e-scooters which are not parkedproperly around and fines the e-scooter operator. Furthermore in Dallas the e-scootersare subjected to the same laws as cars and the police has started to fine on sidewalkriding and riding without a helmet (Lawrence, 2019). In Portland though there wereno fines during the first pilot program in 2018, during the second pilot program in2019 fines were introduced for riding on sidewalks or bad parking habits, along withcompanies being asked to use geofencing technology to limit parking in areas such aspublic parks (K. Thomas, 2019). In Stockholm no visible law enforcement was foundas the e-scooters are treated in the same categories as bikes.
4.2.5 Inference on regulatory challenges
Literature search determines that most of the cites have been reacting to the e-scooterservices baring Portland who have been proactive in promoting safer use of e-scootersand training residents to use them. It is common finding that there are regulationsrelated to both speed and age. Additionally it has been a common practice to regulatethe use of e-scooters on bike paths. The use of helmets was found to be mandatoryor recommended.
The literature search also found that regulating the parking of e-scooters has been achallenge, with only guidelines in place to promote safer parking habits. Additionallythe cities have been issuing fines for badly parked e-scooters. But it is importantto note that Sweden has not been enforcing regulations on e-scooters as they arecategorized in the same category of bikes.
25

Figure 6: Policy Comparison
26

4.3 User Needs
The focus of the study is to determine the possibility of e-scooters to fill needs ofcar users to use public transportation. To make this possible the study focuses oncapturing and understanding the needs of the car users. To initiate the capturing ofthe needs of car users a literature search was carried out to identify these needs.
4.3.1 Studies on user needs around the world
This section includes the information on the studies carried out in the different coun-tries such as Australia, Scotland, Netherlands and England to determine the reasonsfor the modal chose for transportation and the user needs which needs to be fulfilled.
AustraliaCorpuz (2007) carried out a study in New South Wales, Australia to determine thereasons affecting the choice of the travel mode. Corpuz (2007) determined that socio-demographic characteristics played a significant role. Having a job, having a higherhousehold income, having kids at home resulted in using the car over public trans-portation. On the other hand, students, 11 to 20 year old and the ones with nocars used public transportation more. The study determined that the factors of thepurpose of travel and time of the day played a significant role.
Furthermore, it was determined that the most crucial factors affecting the choice ofthe mode were access & frequency of public transportation, travel time, availability ofparking, cost of travel, comfort and convenience. The study found that a third of theprivate vehicle uses would use more of public transportation if it were more accessibleand frequent. It also determined that half the people who use public transport did itto avoid issues with parking.
ScotlandStradling and Anderson (2012) as the part of Sottish Social Attitudes Survey in 2002conducted surveys and interviews in Scotland to determine the attitude to modalshift from car to other modes. The study determined that 80% of the populationdepended on using car neither structurally or consciously. Further, the study deter-mined 29% were able to substitute short car journeys with bus and 23% were willingto use more of public transportation if they were improved. The study also foundno statistical difference in variation over different age groups. The study determinedthe underling needs and factors of car users which needs to be fulfilled to enable thetransition for modal shift. The factors identified were: Convenience, journey time,the cost of travel, the weather condition, comfort and safety. It also found of all themen three quarters drove compared to half of female respondents. It also determinedfactors such as health and environment affected the mode used to travel.
The study also looks at using push or pull methods to bring in a modal shift from carto public transport. These methods could be increase in petrol cost, levying peak fee
27

in the city center, making public transport reliable and cheaper. Almost half of therespondents said any of these factors would result in shifting to public transportation.
NetherlandsSteg (2003) in her study in Netherlands identified that, car use was evaluated morepositively over public transportation. The main reasons for this were found to be con-venience, independence, flexibility, comfort, speed, pleasurable and reliability. But,she also found that people who don’t use cars and use public transport for travelling,perceived it to be safer. But, the car users said it was safer over public transport. Italso found that people who don’t use cars also perceived the use of cars to be moreattractive. The study determined women, young people and low-income used carless compared to men. The use of car was evaluated positively in densely populatedNetherlands, where public transport was widely available. But the study also foundthat their is a possibility to persuade people to use public transport. The study alsoidentified the negative aspects from frequent car drivers to be travel cost, traffic safetyand status. Steg concludes saying people who relate the use of car to freedom will bethe hardest to persuade and it is better to not try doing that.
EnglandWebb (2011) carried out a study on the attitude of people towards public transportin Plymouth, England. The study determined that women perceived public transportpositively as cheaper and frequent. On the other hand, men preferred cars, sayingthey were quicker and reliable. The central negative aspect associated with cars wasidentified to be the issues with expensive parking cost. Still, at the same time, theavailability of parking was found to be positive in Plymouth. The other main advan-tages were determined to be flexibility, convenience, shorter travel time, cleanlinessand comfort. Webb concludes saying the use of public transport can be encouragedby using push/pull policies as seen in the German city of Freiburg.
4.3.2 Studies on user needs in Vastra Gotaland Region
This section looks into the user needs related to Vastra Gotaland Region which hasbeen identified by the survey of “Hallplats 2019”, carried out by Vasttrafik (2019)on the usage of different modes of transport. Also “Resvaneundersokning 2017” con-ducted by Goteborgs Stad (2018), which looked into travel patterns in VGR.
User needs defining car usageThe surveys determined that the need to be spontaneous and the feeling of indepen-dence offer by car led to the ownership of cars. Further the car users felt that the costof using is much cheaper than public transport. 50% of the car users believe that, us-ing car is more affordable than using public transport. The survey found that the carusers believed, cars provided an opportunity to be spontaneous (79%). Furthermore,59% of the car users said, they use car because they enjoyed driving. The surveylooked into how important the cars are perceived by the population. Compared tothe urban residents the rural residents living in rural areas believed car was a neces-
28

sity. 27% in Gothenburg municipality said they could travel without a car comparedto 92% in rural areas who said they could not (Vasttrafik, 2019).
Modal shift needsA willingness to pick more sustainable modes of transport over car was found to exisitamongst the population. It found 28% were willing to travel more collectively and27% wanted to cycle more often (Vasttrafik, 2019).
Three main factors that would influence the modal shift from cars (figure 7) wereidentified during the survey by Vasttrafik (2019). First factor was, the change in lifesituations such as job location, relocation and finances would influence it (39%). Thesecond factor was personal values such as environmental impact and health benefits(22%). The third factor was external factors such as fuel price and public transportcost would impact their choice (4%). The survey also found that majority of peopleagreed that, the important factors affecting there choice of mode were duration oftravel (82%) and cost of travel (65%). Also 48% of the respondents said environmen-tal factor played a role (figure 8).
Figure 7: Factors for modal shift(Vasttrafik, 2019)
29

Figure 8: Factors which affect the choice of the mode of transport(Vasttrafik, 2019)
4.3.3 Travel patterns and preferences in Vastra Gotaland Region
This section looks into the travel preferences in Vastra Gotaland Region in the sur-veys of “Hallplats 2019” and “Resvaneundersokning 2017”.
Effect of Duration and Distance of travelThe travel distance on weekdays were determined to be relatively short. 20% of thetrips are shorter than 2 kilometers, followed by 23% of the trips in the range of 2 to5 kilometers, 18% of the trips in the rage of 5 to 10 kilometers,17% of the trips inthe range of 10-20 kilometers and 22% of the trips greater than 20 kilometers. Thestudy further determined for trips shorter than 2 kms, 58% walked followed by 24%using car, cycling is 12% and collective journey using bus and tram is 5%. (figure9)(Goteborgs Stad, 2018).
30

Figure 9: Length of journey using different modes of transport(Goteborgs Stad, 2018)
Additionally the average travel time to school was found to be 40 minutes. The timeto pick/drop children to school was 39 minutes and the work commute time was 30minutes (figure 10). The average travel distance was found to be highest for com-muting for business purposes with 28 Kilometers followed by 17 kilometers for bothschool and work (figure 11)(Goteborgs Stad, 2018).
Figure 10: Average travel time for different purposes(Goteborgs Stad, 2018)
31

Figure 11: Average travel distance for different purposes(Goteborgs Stad, 2018)
Furthermore, it found that work travel distance of 11% of the population in VGR wasless than 2 kilometers. 17% in Gothenburg municipality and 20% in other municipal-ities travelled between 2 and 5 kilometers. The break up of distances can be foundin the figure 12 below. It was also found that 71% of the population in Gothenburgmunicipality and 63% in the other municipalities of the region travelled less than 20kilometers for work(Goteborgs Stad, 2018).
Figure 12: Work travel distance in Gothenburg and other municipalities(Goteborgs Stad, 2018)
32

Purpose of travelThe survey also identified different reasons for travel and the modes of travel onweekdays and determined the use of car was high for all purposes other than pickingand dropping kids to school (figure 13). It was found that the 33% of the travel onweekdays is for work, followed by leisure/pleasure/exercise activities with 20% andtravel for shopping was 17%. Furthermore, majority of the travel to work is done bycar by 51% followed by 27% using public transportation. Travel by bicycling and onfoot is 10% each.When travelling to school/training the public transport use is highwith 66%. Travel to pick and drop kids to school was 66% by public transportation.The share of car use was less with 8% (Goteborgs Stad, 2018).
Figure 13: Different purpose and modes of travel on weekdays(Goteborgs Stad, 2018)
Choice of travel modeHousehold and kids at home plays a role in the choice of mode for travel. Peopleliving in households with two adults and households with two adults & kids carriedout 70% of the car travel. At the same time it was found that households with oneadult living, mostly walked or used public transportation (figure 14)(Goteborgs Stad,2018).
33
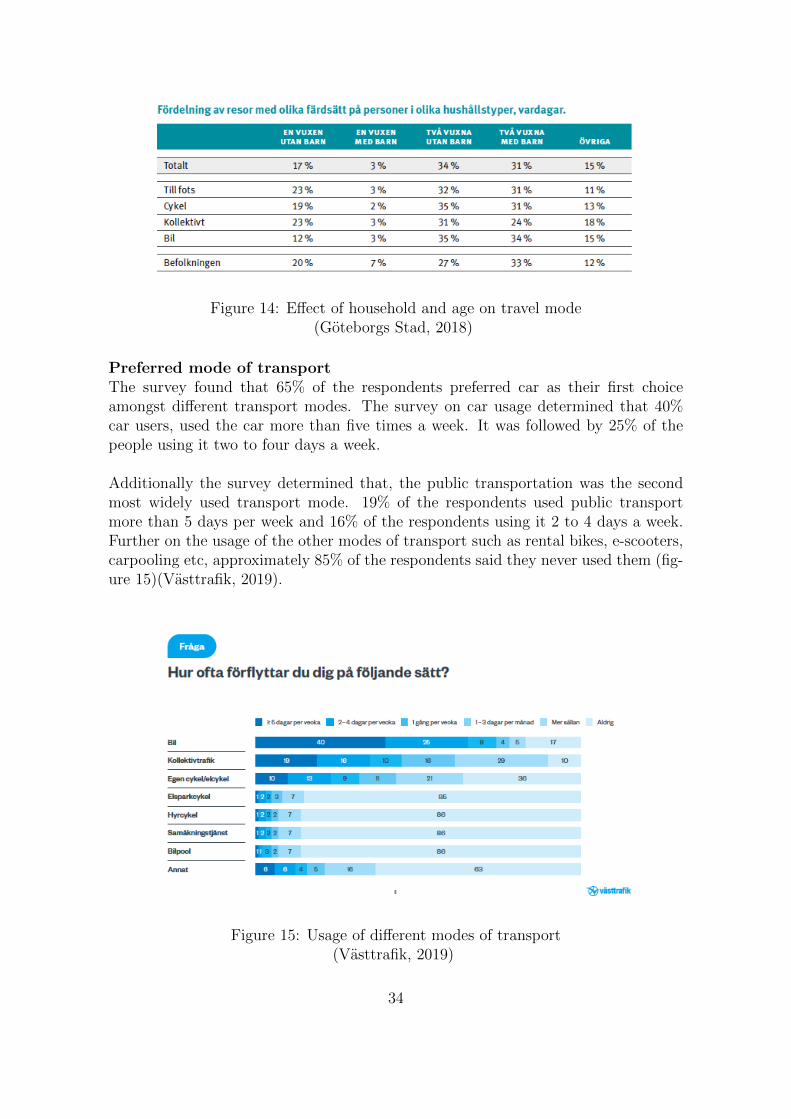
Figure 14: Effect of household and age on travel mode(Goteborgs Stad, 2018)
Preferred mode of transportThe survey found that 65% of the respondents preferred car as their first choiceamongst different transport modes. The survey on car usage determined that 40%car users, used the car more than five times a week. It was followed by 25% of thepeople using it two to four days a week.
Additionally the survey determined that, the public transportation was the secondmost widely used transport mode. 19% of the respondents used public transportmore than 5 days per week and 16% of the respondents using it 2 to 4 days a week.Further on the usage of the other modes of transport such as rental bikes, e-scooters,carpooling etc, approximately 85% of the respondents said they never used them (fig-ure 15)(Vasttrafik, 2019).
Figure 15: Usage of different modes of transport(Vasttrafik, 2019)
34

In a survey conducted by Goteborgs Stad (2018) in Vastra Gotaland Region in 2017,determined that 80% of the inhabitants carried out 1 trip in a day and 2.5 trips ona weekend. It also determined that the majority of the travel happened within theGothenburg municipality, with 90% of the total travel. The study also found out that53% of the travel was done by cars.
Furthermore the car journey was identified to be higher amongst men (57%) thanwomen (49%). Also the age group of 45 to 54 was identified to be using cars morethan the other age groups. Gothenburg municipality has significantly low car use with49%, when compared to other municipalities which have 65% (Goteborgs Stad, 2018).
41% of the population in Vastra Gotaland Region is concentrated in Gothenburg city,and the city accounts for 75% of the trips. On weekdays 62% of the Gothenburg city’spopulation uses public transportation followed by 28% using car. The other regionsin proportion has less percentage of both car and public transportation as seen infigure 16 (Goteborgs Stad, 2018).
Figure 16: Trip share in the region(Goteborgs Stad, 2018)
35

Age factor was found to play a role in the the choice of the mode of transport (figure17). People in the age group of 25 to 44 years accounts for almost half of the tripsmade on foot or by bicycle. Further it determined that the people in the age group25 and 64 accounted for the 77% of the car trips (Goteborgs Stad, 2018).
Figure 17: Travel share based on age(Goteborgs Stad, 2018)
4.3.4 Inference from the literature search on car user needs
The literature search found that having kids at home resulted in people preferring touse more cars. The use of car was found to be higher amongst men. As men perceivecars to be more reliable and convenient compared to women. Also, cars are expectedto provide advantage over public transportation in terms of travel time, accessibilityand flexibility. It was also found that cost of travel also plays a important role inchoosing the mode of transport. The literature search also identifies that reliabil-ity of public transportation is questioned by users across countries. Furthermore,it was identified that the weather and parking availability are influencing factors inthe choice of the mode of travel. Bad weather and parking availability would havea positive effect on the use of car. On the other hand, good weather lack of parkingwould have the opposite effect.
The surveys in Sweden also agrees with the findings in other countries, with peopleperceiving cars to be more cost efficient, reliable, convenient. But it was also foundthat place where people live influence the mode of transport, with urban populationusing more public transportation compared to rural population. In Sweden too peo-ple find duration and cost of travel plays a crucial role.
The literature research helped in identifying various needs of the car users which thecurrent public transportation system is not able to fulfil. The identified needs havebeen listed down and then grouped into two categories as seen in table 4, instrumen-tal needs which are easily quantifiable and perceived needs which needs to be lookedinto depth by interacting with people to understand what it means to the individual.
36

These needs acted as a foundation for forming the questions for survey and interviews.
Table 4: Car user needs
Perceived Needs
1. Convenience (Stradling & Anderson, 2012)(Webb, 2011)2. Comfort (Steg, 2003)(Webb, 2011)3. Flexiblity (Steg, 2003)(Webb, 2011)(Vasttrafik, 2019)4. Saftey (Steg, 2003)(Vasttrafik, 2019)5. Accessibility (Corpuz, 2007) (Vasttrafik, 2019)6. Status (Steg, 2003)7. Independence/Freedom (Steg, 2003)(Vasttrafik, 2019)8. Reliability (Stradling & Anderson, 2012)(Steg, 2003)(Webb, 2011)9. Pleasurable (Steg, 2003) (Vasttrafik, 2019)10. Control (Stradling & Anderson, 2012)11. Sustainability(Vasttrafik, 2019)
Instrumental Needs
1. No waiting (Steg, 2003)2. Speed of travel (Corpuz, 2007)(Webb, 2011)3. Travel Time (Webb, 2011)(Vasttrafik, 2019)4. Arriving closer to destination(Corpuz, 2007)5. Cost of travel (Stradling & Anderson, 2012)(Vasttrafik, 2019)
37

5
SurveyTwo surveys with the titles “Survey on car user needs” and “Survey on E-scooters”were conducted to obtain primarily quantitative data. The first survey focused onthe needs of the car users and the second one focused on gathering information onE-scooters users and their needs being fulfilled. Furthermore, the surveys were con-ducted on social media targeting the residents of Vastra Gotaland region. The pur-pose of the survey was to determine the opinions of residents of Vastra Gotalandregion regarding the needs for car usage,user needs of the e-scooters and the factorsneeding improvement in the current public transport system.
5.1 Survey on car user needs
In this survey a total 117 responses were received from across the world of which103 were from Vastra Gotaland region. Furthermore, out of 103 respondents 82 usedcar. For the analysis of the survey only the respondents in Vastra Gotaland regionwho use car has been considered. To analyse the survey the respondents have beencategorized into two groups residents of Gothenburg city (38%)and the rest of theresidents of Vastra Gotaland region (62%). It can be noted that some of the graphsand statistic total up more than 100%. This is due to the fact that some respondentsused multiple options for questions.
5.1.1 Purpose of use
Gothenburg CityIn total 31 respondents from Gothenburg city said they used car. The car was usedfor multiple purposes (figure 18). Most of the respondents used the car for dailycommuting purposes, with 61% using it to travel to work and 42% using it to travelto school or for training purposes. Furthermore 94% of the respondents said theyused the car for leisure & travelling purpose. 19% of the respondents used it to pick& drop children, this was followed by 13% for shopping and 13% for visiting friends& relatives.
38

Figure 18: Purpose of use of car
Rest of VGRTotal of 51 respondents from rest of VGR responded that they used car, see figure 18.Majority of the residents used the car for daily commuting, with 80% using it to travelto work and 27% using it to travel to school or for training purposes. Furthermore92% of the respondents said they used the car for leisure & travelling purpose. 88%of the respondents used it for for visiting friends & relatives, followed 57% to pick &drop children and finally 6% for shopping.
5.1.2 Important user needs of car users
Gothenburg cityThe survey asked the respondents to rate the importance of the user needs identifiedin literature review for car use (figure 19). The most important needs were determinedto be convenience and flexibility with 87% and 81% of the respondents agreeing toit. The other needs of independence/freedom (68%), comfort (61%), accessibility(52%), safety (39%) and reliability (35%) were also considered to be of importance.Whereas, cost (3%) and status (19%) was not considered to be of an greater need bythe respondents.
39

Figure 19: The most important user needs of car users
Rest of VGRThe VGR residents (figure 19), responded flexibility was the most important need,with 75% respondents. This was followed by convenience and independence/freedomwith both having 73% respondents. Comfort (67%), accessibility (59%), safety (47%)and reliability (43%) were also considered to be important needs. Whereas, cost (2%)and status (14%) was not considered to be of an greater need by the respondentssimilar to Gothenburg city.
5.1.3 Ratings of user needs
The eight needs of car users of convenience, comfort, flexibility, safety, accessibility,status, independence/freedom and reliability were asked to be rated on a scale of 1to 5. Furthermore this question was to determine the importance of these car userneeds. In the rating scale, 1 corresponded to not important and 5 corresponded tovery important (figure 20). The average ratings of car user needs can be seen in figure21.
Figure 20: Survey rating scale
40

Gothenburg city
1. Convenience had a average rating of 4.35 and 90% of the respondents consid-ered convince to be either very important (48%) or important (42%).
2. Reliability had the highest average rating of all the user needs with 4.39 and84% considered it to be either very important (58%) or important (26%).
3. Flexibility had the same average rating as convenience, i.e 4.35. 84% of therespondents considered it to be either very important (55%) or important (29%).
4. Independence/Freedom with an average rating of 4.16 came next. 74% ofthe respondents considered it to be either very important (48%) or important(26%). Furthermore 19% of the respondents had a neutral opinion about thefeeling of independence & freedom.
5. Accessibility had an average rating of 4.13. 74% of the respondents consideredit to be either very important (39%) or important (35%). Furthermore 26% ofthe respondents said they had a neutral opinion about accessibility to car.
6. Safety had an average rating of 3.9 with the opinion of very important andimportant getting 32% of responses. This was followed by neutral getting 29%of the response.
7. Comfort had an average rating of 3.71. 45% of the respondents had a neutralopinion associated with the comfort of the car. Whereas, 29% said it wasimportant followed by 23% responded it was very important.
8. Status had the lowest average rating with 1.97. 45% of the respondents saidit was not important, followed by 29% saying it was of low importance and13% had a neutral opinion about it. Only 13% considered it to be either veryimportant (3%) or important (10%).
Figure 21: Average ratings of car user needs - Gothenburg city
41

Figure 22: Importance of car user needs - Gothenburg city
Rest of VGR
1. Convenience had a average rating of 4.14 and 82% of the respondents consid-ered convince to be either very important (35%) or important (47%).
2. Reliability had a average rating of 4.35 and 88% considered it to be eithervery important (53%) or important (35%).
3. Flexibility had the highest average rating of 4.37. 83% of the respondentsconsidered it to be either very important (59%) or important (24%). Further,14% have a neutral opinion about it.
4. Independence/Freedom with an average rating of 3.98. 70% of the respon-dents considered it to be either very important (43%) or important (27%).Fur-thermore 18% of the respondents had a neutral opinion about the feeling ofindependence & freedom.
5. Accessibility had an average rating of 4.00. 70% of the respondents consideredit to be either very important (39%) or important (31%).Furthermore 22% ofthe respondents said they had a neutral opinion about accessibility to car.
6. Safety had an average rating of 4.2. 82% of the respondents considered it tobe either very important (45%) or important (37%).Furthermore 14% of therespondents said they had a neutral opinion.
7. Comfort had an average rating of 3.65. 65% of the respondents considered itto be either very important (20%) or important (45%). Further, 20% have aneutral opinion about it.
8. Status had the lowest average rating with 2.10. 39% of the respondents saidit was not important, followed by 25% saying it was of low importance and
42

25% had a neutral opinion about it. Only 10% considered it to be either veryimportant (4%) or important (6%).
Figure 23: Average ratings of car user needs - VGR
Figure 24: Importance of car user needs - VGR
5.1.4 Use of public transport by car users
Gothenburg CityOf the 31 respondents 32% of the car users did not use public transportation. It wasfound that 45% used it 2 to 5 times per week. Further 19% of the population used itmore than 10 times a week. 6% using once a week and another 6% using 2 to 3 timesa month.
43
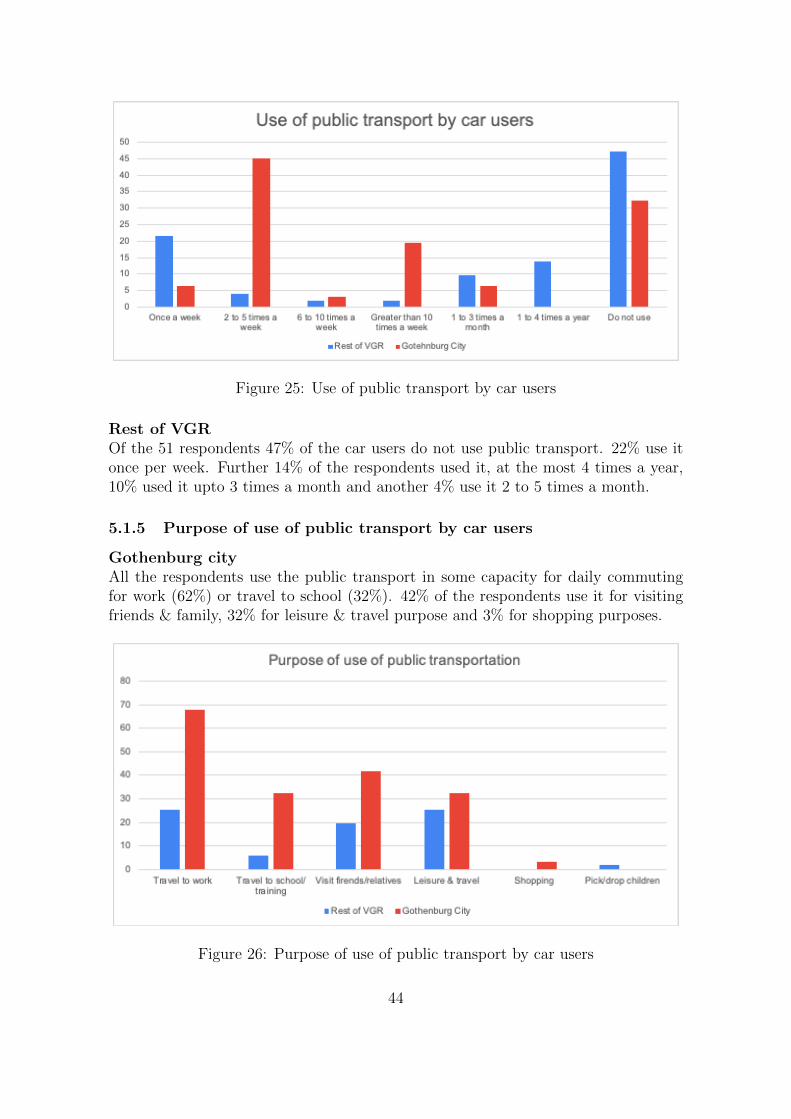
Figure 25: Use of public transport by car users
Rest of VGROf the 51 respondents 47% of the car users do not use public transport. 22% use itonce per week. Further 14% of the respondents used it, at the most 4 times a year,10% used it upto 3 times a month and another 4% use it 2 to 5 times a month.
5.1.5 Purpose of use of public transport by car users
Gothenburg cityAll the respondents use the public transport in some capacity for daily commutingfor work (62%) or travel to school (32%). 42% of the respondents use it for visitingfriends & family, 32% for leisure & travel purpose and 3% for shopping purposes.
Figure 26: Purpose of use of public transport by car users
44

Rest of VGR68% of the 27 respondents who used public transport, used it for commuting to work,followed by 42% using it for leisure & travel, 32% of the respondents used it forvisiting friends & family and another 32% for travel to school.
5.1.6 Needs to be improved in public transportation
Gothenburg cityFrequency, accessibility, speed and reliability of the public transportation were themain factors (figure 27), which the car users felt, had to improved in the currentpublic transport system. 45% of the respondents said frequency has to be improved,followed by 42% for improved accessibility, 35% for improved speed of travel and 32%for improved reliability. A small portion of the respondents said, improved safety(10%), reduced crowding (6%), reduced cost (6%) and improved comfort (3%) asother user needs which needed to be bettered.
Figure 27: Needs to be improved in public transportation
Rest of VGRSimilar to Gothenburg city, frequency, accessibility, speed and reliability of the thepublic transportation were the main factors 27) which the car users of rest of VGRfelt which need to improved in the current public transport system. 67% of the re-spondents said frequency has to be improved, followed by 63% for improved reliabilityand 48% for improved accessibility. Furthermore 26% felt the need to improve thespeed followed by improved safety (19%), reduced cost (15%), and improved comfort(4%).
45

5.1.7 Preferred mode of transport
Gothenburg cityOf the 31 responses received from car users in Gothenburg city, 52% said they pre-ferred mode of transport is car, followed by 19% opting for public transport system,16% preferring bicycles, 10% preferring walking and 3% preferring using E-bicycle.
Figure 28: Preferred mode of transport
Rest of VGR71% of the 51 respondents said their preferred mode of transport is car, followed by20% preferring bicycle, 4% each for public transportation and walking and only 2%preferred e-scooters.
5.1.8 Effect of age on preferred transport mode
It was determined from the survey that people preferred car as their primary modeof transportation (figure 29). 52% of respondents amongst across all age groupsresponded that they prefer car. The preference for the car peaks in the age groupof 36-50 years with 65% voting for it as there most preferred mode. This is followedby bicycle which is preferred by 20% of the car users. Another 12% of the car usersprefer pubic transportation followed by 10% preferring to walk.
46
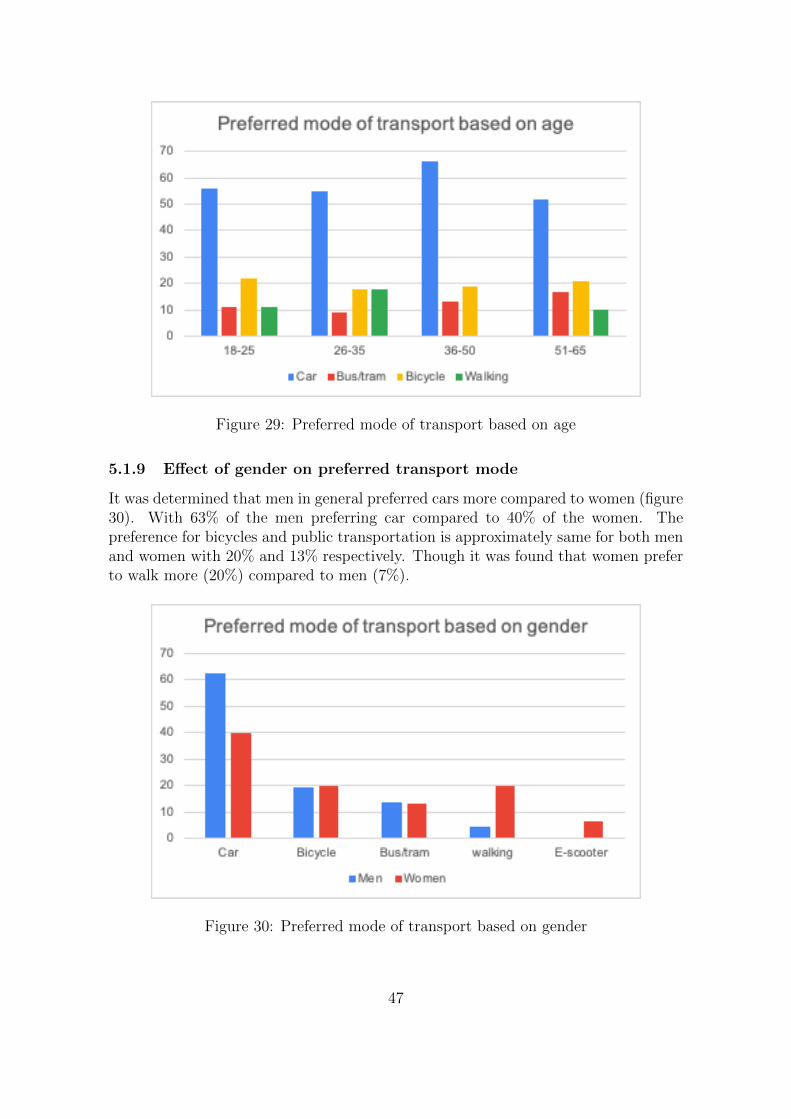
Figure 29: Preferred mode of transport based on age
5.1.9 Effect of gender on preferred transport mode
It was determined that men in general preferred cars more compared to women (figure30). With 63% of the men preferring car compared to 40% of the women. Thepreference for bicycles and public transportation is approximately same for both menand women with 20% and 13% respectively. Though it was found that women preferto walk more (20%) compared to men (7%).
Figure 30: Preferred mode of transport based on gender
47

5.1.10 Effect of gender on needs to be improved in public transportation
The needs of reliability, frequency and accessibility were rated as the most importfactors which needed to be improved in the current public transport system by bothmen and women (figure 31). Further speed was also identified as a important need tobe fulfilled by the respondents. Though men tended to rate these four needs higherthan women. But the factors of comfort, safety and crowing of public transport wasrated higher by women compared to men, though they were low in number, less than13%.
Figure 31: Effect of gender on needs to be improved in public transport system
5.2 Survey on e-scooters
In this survey a total of 55 responses were received from Vastra Gotaland region.Further of the 55 respondents, 36 claimed to use e-scooters. All the e-scooter userswere residents of the city of Gothenburg. It can be noted that some of the graphsand statistic total up more than 100%. This is due to the fact that some respondentsused multiple options for questions.
48

5.2.1 Purpose of use of e-scooters
The e-scooters similar to cars was found to be used for multiple purpose (figure32), with it being used highest for daily commuting 67%, which included travellingfor work (56%) and travelling to school (11%). This was followed by it being usedfor leisure/holiday/travel (56%) purposes. Further 39% used it to visit friends orrelatives.
Figure 32: Purpose of use of e-scooters
5.2.2 Usage of e-scooters
The survey showed that the usage of e-scooters was relatively low (figure 33), with44% using it twice a week, 22% using it once a week and 17% using it 2-5 times aweek. Only 6% of the respondents claimed to use it more than 10 times a week.
Figure 33: Usage of e-scooters
49

5.2.3 How e-scooters are used
The survey also tried to identify how e-scooters are used (figure 34), i.e. only thee-scooters, walking to reach a e-scooter before using it or combining e-scooter withpublic transportation. 50% of the respondents used the e-scooters in combination withwalking. This was followed by 28% using it in combination with public transportation.The remaining 22% of the respondents claimed to have direct access to e-scooters.
Figure 34: How e-scooters are used
5.2.4 E-scooter users needs in association with car user needs
The survey tried to determine to what extent the e-scooter users associated the caruser needs identified (figure 35). 78% found the e-scooters to be convenient followedby flexibility (61%), accessibility (50%), comfort (44%) and independence/ freedom(39%). Though only a small number of respondents agreed on the e-scooter servicesto be reliable (17%) and cost efficient (28%).
Figure 35: E-scooter users association with car user needs
50

5.2.5 Improvements expected in e-scooter services
The survey tried to determine what needs to be improved in e-scooter services toincrease the user experience (figure 36). 50% of the respondents wanted the e-scootersusage cost to be reduced. Further 44% wanted the safety aspect of the usage to beimproved, 33% wanted the availability to be increased and 28% wanted the speed tobe increased. Further the reliability aspect only 6% wanted it to be improved.
Figure 36: Improvements expected in e-scooter services
5.2.6 Car usage and effect of e-scooters on car usage
It was found that 50% of the e-scooter users used car. Further 56% believed e-scootershad resulted in reduction in car usage. On the other hand 44% responded it had noeffect on the car usage.
Figure 37: Car usage by e-scooter users Figure 38: effect of e-scooters on car usage
51

5.2.7 Age and kids factor
The age of the e-scooter users who responded was found to be relatively low with72% falling in the age group of 26-35 years and another 17% in the group 18-25 years.Also it was found that the majority of the e-scooter users (72%) did not have kids.
Figure 39: Age of e-scooter users Figure 40: Number of kids
5.3 Non e-scooter users
The survey on e-scooter users also captured information from non users. The moti-vation was to capture the reasons for not using the e-scooter service. In total therewere 19 responses.
5.3.1 Reason for not using e-scooters
The main two reason stated by respondents for not using e-scooter services were thecost (53%) of it and the the belief that they caused more problem than solving it(42%). Further 16% claimed their accessibility was not consistent and they did notprovide the opportunity to carry bags.
Figure 41: Reason for not using e-scooters
52

5.3.2 Possibility of using e-scooters with public transportation and im-provement in e-scooter services
53% of the non e-scooter users believed the e-scooter could be combined with publictransport to improve the travel experience. Further the respondents expressed costof the e-scooter services (79%) should be reduced for them to use it. The othersizable contributing reasons were availability of parking near bus/tram stops (37%)and availability of e-scooters (32%).
Figure 42: Combining e-scooters with public transportation
Figure 43: Factors to be improves in e-scooters to influence the usage
53

5.4 Analysis of survey
Car usersSurvey results suggest the all people who use car, usually use it for daily commut-ing. It is also suggests in Gothenburg city, the use of car is mostly done for travel& leisure, where as, a sizable population of people living in other municipalities ofVastra Gotaland region, use it for other purposes such as visiting friends & relativesand pick &drop children. The survey also determined that the car is used by almosteveryone in rest of VGR compared to Gothenburg city.
The car user needs of convenience, flexibility, Independence & freedom, comfort andavailability was rated highly by all respondents. But the user needs of status andcost was considered to be not important irrespective of the municipality they livein.Rest of VGR rated the need to improve frequency, reliability, accessibility, speedand safety in public transportation higher compared to Gothenburg city. But a fewrespondents considered that the cost and comfort factors should be improved.
Gothenburg city residents have a higher tendency to use public transport comparedto residents of rest of VGR. The residents of the city use the public transport mainlyfor daily commuting purposes. The use of public transport was also found to below amongst residents of rest of VGR, but they did use it more often for leisure &travel purposes. Though it was foudn that the car usage was very prevalent amongstthe population. A high number of car users rated the car as the preferred mode oftransport. With 52% in Gothenburg city and 71% in rest of VGR. Public transportand bicycle were the second most preferred modes of transport in Gothenburg cityand rest of VGR respectively. Further the effect of age and gender seem to follow thesame trend as the general population.
E-scooter usersThe survey results determine that the use of e-scooters is low, even amongst the e-scooters users with 94% using it less than 5 times a week. Furthermore the mainpurpose of use was found to be daily commuting or using it for leisure& travel pur-poses.Furthermore age and having kids at home can be related to the use of e-scooters.It was found that the population of the e-scooter users was relatively young with 89%of the respondents being younger than 35 years. Further it was also found that ma-jority of the users did not have kids (72%).
The effect of e-scooters on car usage was found to be limited. Half of the e-scooterusers still used car. Further, 50% of the respondents believed that, the availabilityof e-scooter services has resulted in less usage of the car. But it was found that thee-scooter users associate with some of the user needs of car users while using the e-scooters. The e-scooter users associate to the car user needs of convenience, flexibility,accessibility and independence/freedom while using the e-scooters in a positive way.Thought the respondents expect the cost, safety and availability factors of e-scooterservices to be improved.
54

Non-e-scooter usersThe main reason for respondents not using e-scooter was determined to be theirbelief that the e-scooters caused more problems. This was in addition to the beliefthat the cost of e-scooter usage was high. Though the majority respondents believedin the possibility of combining e-scooters with public transport system. They furtherbelieved, improved availability, parking option closer to bus/tram stops and reducedcost of usage would influence them in using the e-scooters.
5.4.1 Comments from surveys
In the quantitative surveys, there were section in the surveys where the respondentscould comment on the preferred mode of transport. Further in the survey on e-scooters the respondents could comment on what needs to be improved in e-scootersand its effect on their lives. A total 57 comments were collected during the surveysand the results can be found in appendix B. In order to analyze the received com-ments, they were separated into five different categories.
Better parking: It was expressed that the parking of e-scooters needs to be im-proved. The respondents believed there was chaos created due to bad parking habits.They have found them parked badly blocking paths and fallen over. This is believedto have a negative impact on the opinion on the mode of transport according to therespondents.
Reduce cost: The cost of the usage for e-scooters was expressed to be high by boththe e-scooter users and non users. The respondents expressed the reduced cost wouldlead them to use it more often.
Effect on other modes: The e-scooter users expressed that the usage has reducedthe use of public transportation and also resulted in people walking to destinationswhich are at closer distances. But few of the respondents did express that they werea good alternative for shorter trips in the absence or delay of public transportation.
Perception about car: The car users had a positive perception about the car as atransport mode. The common belief was that, the cars were easily available as theyowned it. Also, it made it flexible to travel. The cars were also believed to be thequickest way to travel between two places compared to other transport modes. Addi-tionally the residents in rural areas had limited or no access to public transportationor e-scooters, thus making car the obvious choice as the preferred mode of transport.
Awareness on sustainability: The awareness related to sustainability of usingpublic transportation was evident amongst the respondents. The respondents ex-pressed their willingness to use public transportation more, if it were more accessible.Further the respondents also expressed to walk or use bicycle if they had to travelshorter distances.
55

6
InterviewsThe interviews were analysed using KJ method and categorised into six categorieswhich is explained below in section 6.1. In total 12 interviews were carried out. Theinterviews were split into three groups,which are listed below.
1. Private car users
2. E-scooter users
3. Other stakeholders
6.1 Transition to public transportation
The interview analysis highlighted both similarities and differences on how the carusers perceived their needs for transportation. The information from the interviewswere grouped into six categories after analyzing the interview transcripts. The sixcategories are namely, dependency, activities & leisure, mindset, landscape, economicsand shopping. These categories are further explained below along with few exampleof the statements from the interviews. Additionally the effect of e-scooters are addedwhere ever applicable from the e-scooter user perspective.
Dependency:This category includes the reasons which create a dependency of the choice of caras travel mode. During the interviews it was identified that, factors such as havingkids or pets, the weather condition and the need to have the opportunity to travelquickly created dependency and are a great barrier, thus affecting the choice of publictransportation. It was determined that the same factors of bad weather or the needfor multiple people to travel together limited the choice of e-scooter as a travel mode.
“We have a dog, so if we have to go on a picnic to the ocean then its much easier totake the car instead of a tram” - Daniel, car user
“If in need to pick up my kids when they are sick or something, there are no busesfrom my workplace from 11 A.M to 2 P.M or very limited, so I cant use public
transportation.” - Joakim, car user
“E-scooters don’t go fast so its safe, but if its icy or raining then it would beslippery and I would not use it” - Amanda, e-scooter user
56

Activity & leisure:This category include the factors which influence the effect on the choice of travelmode for visiting friends and family or to travel for recreational purposes. The in-terviewees expressed the lack of public transportation when they have to visit theirfamilies who live in the rural areas. Further they found it to be inconvenient to carrybags while using public transport to reach their families living in rural areas. Onthe other hand the interviewees expressed positive opinion of using public transportto travel to meet friends & family living within the city. Furthermore the intervie-wees were positive about the possibility of using car sharing services for long distancetravels.
“I use the car extensively in summer, when I go to visit my parents who live in thenorth of Sweden, I cant get there using bus. Also, when we go the car is always
packed and its harder to take it on a train or a bus” - Joakim, car user
“When I travel to the city to meet my friends, I always take public transport, theaccess in the city center is very good.”- Daniel, car user
“We have been living in a big apartment and we have car sharing service here, in thefuture we can join one of those and will have no difference at all” - Lars, car user
“I don’t own a car, I don’t have a need for it. I only use it if it’s a road trip or if Ihave to move to a new apartment. Then I use the shared car service.” - Fredrik,
e-scooter user
“In Sweden when I lived Lund I had a car for 8 months. But it did not make sensewith the parking fee and less availability of parking space. I do rent cars over theweekend to do trips otherwise I don’t need to own them.” - Alex, e-scooter user
Mindset:This category includes factor which are influenced by the awareness and attributes ofthe car user with regard to the choice of the transport mode. It was determined that,there was a broad awareness of environmental benefits of not using the car. Furtherthe interviewees believed that the technology available with mobile applications madeit easier to use both the public transportation and e-scooters. On the other hand itwas found that there was a lack of willingness to wait for public transportation. Theinterviewees believed “being used to car” made it difficult to try other modes oftransport. Furthermore both the e-scooter users and car users believed the e-scooterswere unsafe to use.
“When I take a flight and take an airport bus, the bus stops 2 kilometers away frommy home then I take a e-scooter.” - Amanda, e-scooter user
“I am all for public transportation. I have kids without a car licence and I wantthem to use public transportation as much as possible.” - Jessica, car user
57

“Now the apps are good and tell if the bus is coming and I know the right directionto stand in. Now I know the timings and it avoids me getting anxiety.” - Lars, car
user
“I save lot of time when I take the car. Because I spend a lot of time waiting for theconnection, since I don’t have a direct bus to my workplace.” - Joakim, car user
“I would say I have been lazy to use other modes of transport.” - Lars, car user
“E-scooters are a safety concern. I am responsible and know the rules to follow andI am following them. But you could still can have a crash. While not wearing anhelmet you can crash at 20 Km/h and injure yourself” - Fredrik, e-scooter user
Landscape:The category of landscape include the current system set up of how the public trans-portation or the e-scooters are perceived. Furthermore it also includes how the currentinfrastructure in VGR functions along with implications of the current undertakingsby the public agencies and the e-scooter service providers.
There a quite a few drivers towards the use of public transport system in the Gothen-burg city limits. The interviewees find driving car around the center of the city tobe inconvenient. On the other hand it is found that there is a satisfaction with thepublic transport or the e-scooter within the city, especially around the center of thecity. Furthermore the e-scooters providers are looking into the possibility of providingservices in other cities of VRG along with the use of fencing technology to improvethe usage patterns.
“Cars are tough to use in big cities such as Gothenburg, but in smaller cities it isconvenient to use car than public transportation.” - Amanda, e-scooter user
“If using car, most of the trips would take longer and cost a bit more. They areexpensive to own here with parking fee.” - Alex, e-scooter user
“Boras is a good example for small cities. We plan to provide our e-scooter servicethere in the coming months.” Lucas, operations manager, e-scooter service company
“I can quickly travel from A to B without waiting for the bus, that’s the advantagethe e-scooters are bringing. They are available within 200 meters. And boom you
are at your destination.” - Fredrik, e-scooter user
“In the future the geofencing will be better, so parking will be better as we will alsomark e-scooter parking spaces, so that e-scooter users will use this parking spaces” -
Isabelle, Trafikkontoret, strategic traffic planner
58

The public transportation also had barriers. The interviewees expressed dissatisfac-tion with the public transport system, specifically in the suburbs and the rural areas.Furthermore the trams are considered to be unreliable and uncomfortable to travel.For e-scooter services the major concern is the non profitably and the lack of urbanspace. E-scooter services are also found to be unreliable. Further the interview withthe e-scooters providers and the city strategist reveled that there is a lack of coherencebetween them.
“The trams are very uncomfortable, they shake a lot.” - Amanda, e-scooter user
“I have 20 kilometers to Hestra and 10 kilometers to the closest bus stop, so there isreally no other option than car.” - Jessica, car user
“One sense where we lack urban space is parking space, we can pick up and dropwherever we want to. If city can provide dedicated parking space that would be
really helpfull.” - Lucas, operations manager, e-scooter service company
“The policy makers take their own time to come back to update the policies, theyhave to go through their bureaucracy and it takes time, it’s a bit frustrating , but
that’s how it works.” - Lucas, operations manager, E-scooter service company
“E-scooter companies are not economically sustainable on there own currently, sowe are not sure if they will be around after a few years.” - Isabelle, Trafikkontoret,
strategic traffic planner
“We cant actually force e-scooter companies to do anything, we have volunteeragreement and its voluntary for them, but they are positive about it.” - Isabelle,
Trafikkontoret, strategic traffic planner
Economic benefits:This category looks at the economic aspects of the transport mode. It was foundduring the interviews that, there is an understating of the cost benefits of usingpublic transportation over car. Also, it was also found that the usage of e-scooter iseconomical for short distances.
“I am not satisfied with public transportation, but at the same time they are notexpensive, so really can’t complain.” - Joakim, car user
“For a longer distance, like 5 kilometers bus is better compared to e-scooters. Bute-scooters are good for short distances of 1 to 2 kilometers.” - Amanda, e-scooter
user
“The way the e-scooters are set up, it works really well at least around Gothenburg.They can add a subscription model, so incentivize the usage. I find them to be a bit
expensive compared to public transportation.” - Fredrik, e-scooter user
59
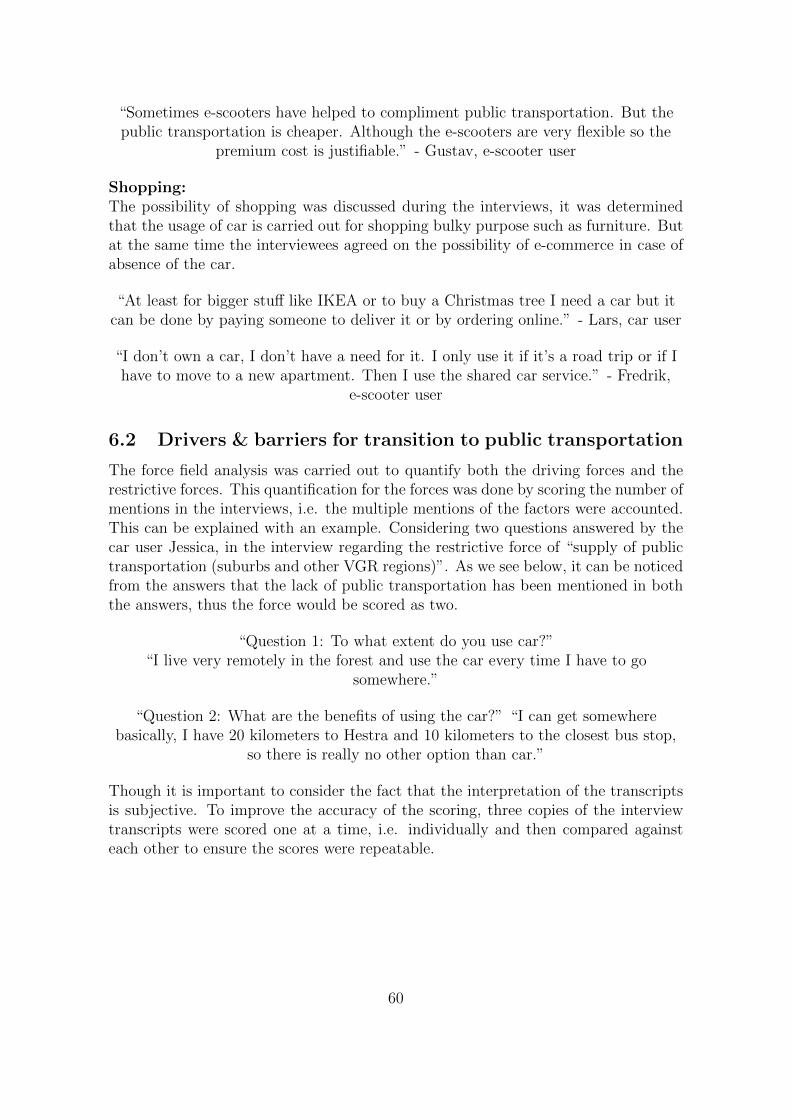
“Sometimes e-scooters have helped to compliment public transportation. But thepublic transportation is cheaper. Although the e-scooters are very flexible so the
premium cost is justifiable.” - Gustav, e-scooter user
Shopping:The possibility of shopping was discussed during the interviews, it was determinedthat the usage of car is carried out for shopping bulky purpose such as furniture. Butat the same time the interviewees agreed on the possibility of e-commerce in case ofabsence of the car.
“At least for bigger stuff like IKEA or to buy a Christmas tree I need a car but itcan be done by paying someone to deliver it or by ordering online.” - Lars, car user
“I don’t own a car, I don’t have a need for it. I only use it if it’s a road trip or if Ihave to move to a new apartment. Then I use the shared car service.” - Fredrik,
e-scooter user
6.2 Drivers & barriers for transition to public transportation
The force field analysis was carried out to quantify both the driving forces and therestrictive forces. This quantification for the forces was done by scoring the number ofmentions in the interviews, i.e. the multiple mentions of the factors were accounted.This can be explained with an example. Considering two questions answered by thecar user Jessica, in the interview regarding the restrictive force of “supply of publictransportation (suburbs and other VGR regions)”. As we see below, it can be noticedfrom the answers that the lack of public transportation has been mentioned in boththe answers, thus the force would be scored as two.
“Question 1: To what extent do you use car?”“I live very remotely in the forest and use the car every time I have to go
somewhere.”
“Question 2: What are the benefits of using the car?” “I can get somewherebasically, I have 20 kilometers to Hestra and 10 kilometers to the closest bus stop,
so there is really no other option than car.”
Though it is important to consider the fact that the interpretation of the transcriptsis subjective. To improve the accuracy of the scoring, three copies of the interviewtranscripts were scored one at a time, i.e. individually and then compared againsteach other to ensure the scores were repeatable.
60

As explained in the section 6.1, the driving forces and restrictive forces were identifiedby analyzing the interviews. This helped to determine the forces in play which wouldfacilitate or restrict the transition of car users to use public transportation. The forceswere categorized into six groups. The six categories being, “dependency”, “activities& leisure”, “mindset”, “landscape”, “economics” and “shopping”. The FFA can beseen in the figure 44.
In total 80 driving forces and 99 restrictive forces were identified across all categories.The tables 5 & 6 provides information on the number of forces determined frominterviewing the three groups, i.e. car users, e-scooter users and the stakeholders.
Figure 44: Force field analysis
61

6.2.1 Driving forces
The top three categories which contributed to the driving forces were landscape (32),Mindset (20) and Economics (13). Further the top three driving forces were thegood supply of public transportation within Goteborg city which had 13 mentionsfollowed by higher supply of e-scooters in Gothenburg city and low cost of publictransportation both getting 10 mentions each.
6.2.2 Restrictive forces
The top three categories which contributed to the restrictive forces were, landscape(38), mindset(23) and dependency (14). Further the top three restrictive forces wereidentified to be poor supply of public transportation in the suburbs of Gothenburgand the rest of VGR (14), followed by unwillingness to wait for public transportation(13) and e-scooters being expensive to travel over longer distances (10).
62

Categories Driving forces Car users E-scooter users Stakeholders TotalDependency Having no kids 2 0 0 2
Activity and leisureAvailability of shared car services 3 2 0 5Enable visit to friends and family (city) 3 1 0 4
Mindset
Environmental benefits of public transportation 5 0 0 5Mobile application technology 3 1 0 4Willingness to use public transportation 3 4 0 7Willingness to use e-scooters 4 0 0 4
Landscape
Supply of public transportation(city) 6 6 1 13Inconvenience of driving car (city) 2 2 0 4supply of e-scooters( center of the city) 3 4 3 10Geofencing technology to regulate e-scooter usage 0 0 2 2E-scooters service to suburbs and small towns 0 0 3 3
EconomicsEconomic benefit of using public transportation 3 7 0 10Cost of e-scooters (short distances <3 km) 0 2 1 3
Shopping Possibility of home delivery 2 2 0 4Total driving forces 80
Table 5: Driving forces
63

Categories Restraining forces Car users E-scooter users Stakeholders Total
DependencyHaving pets and kids at home 7 0 0 7Bad weather 1 3 0 4Emergency travel 3 0 0 3
Activity and leisureRestrains visit to friends and family in rural areas 3 0 0 3Inconvenience to carry baggage during vacation 2 0 0 2
MindsetUsed to using car 5 0 0 5Unwillingness to wait for public transportation 10 3 0 13Safety concerns e-scooters 1 3 1 5
Landscape
Bad comfort of trams 0 2 1 3Supply of public transportation (suburbs and VGR) 9 3 2 14E-scooter business not profitable 0 0 6 6Poor supply of e-scooters (suburbs and other regions) 3 1 3 7Lack of urban space for e-scooters 0 0 5 5Slow/lack of working with public agencies 0 0 3 3
Economics E-scooters expensive to use for long distances 2 7 1 10
ShoppingTransportation of bulky items using bus/tram 2 2 0 4Inconvenience of carrying bags in buses and e-scooters 3 2 0 5
Total driving forces 99
Table 6: Restrictive forces
64
7
Systems MappingThe information on the needs of the car users obtained from the surveys, the inter-views and the driving & restrictive forces from FFA acted as inputs to develop thesystem mapping.
The systems mapping was carried out in two steps, In the first step the current publictransportation system was captured along with the effect it has on the possibility ofcar users adopting the public transport system. The second step introduces the e-scooter service to determine the effect it is having on the car users and the usage ofpublic transport system.
1. Step 1: Effect of public transportation on car users.
2. Step 2: Effect of e-scooters on the system (Step 1).
7.1 Step 1: Effect of public transportation on car users
System mapping was developed with the primary purpose of car users adopting pub-lic transportation (figure 45). The system was developed including the car users andtheir needs and the public transportation system. Additionally the developed systemswas then grouped into three categories based on commonalities to analyse the map.
Group 1: Convenience of private car due to discomfort of public trans-portationThe discomfort of the public transportation is a major concern for the car users. Itwas found during the interviews that, bad weather resulted in the car users wantingnot to use the public transportation. Additionally the need to carry bags, or movefurniture made it inconvenient to use the public transportation. Also, having kids orpets at home meant, it is easier to use the car especially for recreational purposes suchas picnics or outings. Also having young kids at home created a fear of emergency,in case parents need to get to the children quickly form the workplaces. The usersbelieved having a car is convenient and it would take away the dependency on publictransportation.
65

Figure 45: Systems mapping - Effect of public transportation on car users
66

Group 2: Time factor and access to public transportationIt was also determined that, there is a strong unwillingness to wait for the publictransportation. This time factor is greatly influenced the supply and access of thepublic transportation. Further in cases where the user missed a bus or a tram, theylacked a willingness want to wait for the next bus/tram. In addition the time oftravel was considered to be slow, as the bus or tram don’t follow the shortest travelpaths to the destination, in addition to having many stops in between. In generalthe perception of supply and access to the public transposition in the center of thecity was considered to be very good. The opinion changed to being unsatisfied whenthey stay in the suburbs or other areas of VGR. The location of residence created agreater effect on the waiting time for public transportation. As it meant the usershad to plan and wait for the bus/tram to arrive. Also in many case the access to thepublic transposition was low due to less supply or being at a far distance especiallyin rural areas where the friends or relatives lived. This factor reinforced the needto own a personal car to reach the final destination without being dependent on thepubic transportation.
Group 3: Financial & environmental benefits of using public transporta-tionIn was determined that the users were aware of the financial benefits of the publictransportation and admitted that, the cost of maintaining a car was high comparedto using public transportation. Also, due to the initial investment on the cars, theywanted to maximize the car usage. At the same time it was also found that theydid consider not buying a new car once the current one reaches its end of life. Thisthought was influenced by availability of shared car services. The car users believedthey could use public transportation for daily commuting and rent or share a car ifthey need to travel outstation for vacation. Further they believed they could use theshared car services in the future as it would lead to no effort in maintenance of the car.
In general, the awareness of the environmental benefits of not using a car was foundto be high. With many user either switching to electric cars or wanting to switch.Also the understanding of ecological benefits of using shared service, such as publictransportation and shared car services was high.
7.1.1 Reinforcing and balancing loops
In the system two reinforcing loops, R1 and R2 and a balancing loop B1 was deter-mined (figure 45). In the reinforcing loop R1, the convenience of the private car hasa negative impact towards private car users adopting public transportation, which inturn has a negative impact on the convenience of the car. The reinforcing loop R2,used to using private cars has a similar impact as the loop R1.
The balancing loop B1 start by private car users adopting public transportationhaving a positive effect on revenue for public transportation agency, then the increasedrevenue being used to increase the supply of the public transportation. Further the
67
increase in supply would in turn lead to increase in access to public transportation,which would then have a positive affect on car users to use more public transportation.
7.2 Step 2: Effect of e-scooters on the system
In step 2 the elements of the e-scooter service system was added to the system map-ping, as seen in figure 46. Further the influence it has been bearing on the publictransportation and car usage was mapped.
Effect on Group 1Here the e-scooters were found to encounter the same issues such as the public trans-portation, such as bad weather, traveling with kids or pets and the need to carrybags. On the positive side, the e-scooters were found capable of addressing the caruser needs of fear of emergency and need to arrive closer to destination.
Effect on Group 2E-scooters were found have the highest effect in this category, where they were usedby e-scooter users as an alternative to pubic transport in case of delayed transport.Though it must be noted that the e-scooter service do come with a risk of being notavailable always due to there dockless nature. The e-scooter users even mentionedthat they used it connect to public transport to travel one part of the journey to avoidwaiting for the pubic transport. It was identified that the e-scooters were either usedduring emergencies, such as late nights where public transport is not available, or theusers did not have time to wait for public transportation. Though few of the usersdid admit to using it on a daily basic for commuting.
Effect on Group 3E-scooter were perceived to be quite expensive to use it for longer distances comparedto public transportation. Though the user believe they are priced ok for short distancetravel of two to three kilometers. On the environmental benefits it as seen in theliterature review, the interviewees were skeptical about the benefits of it.
7.2.1 Balancing loop
One balancing loop, B2 was found in the e-scooter system. Non profitability of e-scooter was found to have a negative effect on the supply of e-scooters. And furthera increased supply of e-scooters will have a positive effect on utilization of e-scooters,which would then have a negative effect on the non profitability of it.
68

Figure 46: Systems mapping - Effect of public transportation and e-scooter services on car users
69

7.3 Analysis of the systems mapping
It can be determined form the systems map and the interviews analysis that the e-scooter services are having little effect on the private car users. Also it can be foundthe e-scooters cannot address few of the needs of the car users, especially with regardto having kids, carrying bags or address the effect of bad weather. Further it is ob-served in that the e-scooters along with public transportation, need to influence thereinforcing loops R1 and R2 related to private car use to support the transition topublic transportation. The interference on the reinforcing loops would then have anpositive impact on the balancing loop B1, and help in improvement of the utilizationand funds to public transport system to make it better and result in making it a moreattractive proposition as a transport mode. Currently the availability of shared carservices and e-commerce are the factors which is seen to have an opposite effect onthe reinforcing loops R1 and R2.
Furthermore the balancing loop of B1 is greatly affected by the need of the usersto be independent. E-scooter services have been able to address and support theissues in public transportation related to access and delays. As e-scooter services arerelatively new and private car owners not willing to try different modes, the privatecar users are oblivious to the possibility and potential of e-scooter services to supportthe public transportation. Thus, even though the e-scooter services are disconnectedwith the private car users, it is found to be helping out people who do not own a car.The e-scooters are helping bridge the gap in the public transportation by improvingthe access to the end destination or providing an alternative transport mode in caseof delays of buses or trams, thus taking away the need to own a car. Further it canbe determined that having shared car services have been instrumental in making upfor the limitations in public transportation and e-scooter services by helping peoplewho do not own a car by fulfilling few of the needs, especially related to leisure travelor moving bulky items. It is evident for the casual loop diagram, that the e-scootersand the shared car services together are a cost effective alternative to fill the gap inpublic transportation and have taken away the need to own a car for residents whohave never owned a car before.
70
8
Discussion
This section presents the arguments related to the research questions, specifically fo-cusing on the three research sub questions in relation to car usage and transition topublic transportation with the help of e-scooter services. Also the section providesfew additional interesting findings from the interviews and surveys.
8.1 Needs of private car users
The first research sub-question was “What are the needs of car users for the transi-tion to other modes of transport?”. The research was able to identify the needs ofcar users of VGR. The user studies confirmed most of the user needs identified in theliterature search. The user needs such as the need to be independent, reliability andconvenience were rated highly. But the user studies also determined that the localpopulation in VGR did not associate with the ”status” aspect as a need. Additionallyit did not recognize the cost of ownership of a car as a significant factor, contraryto findings from other researches. The residents of VGR though they acknowledgethat the cost of car ownership is higher. The higher cost is considered to be tangibleenough as it overcomes the gaps in the public transportation concerning reliability,accessibility and flexibility. From the interviews, two needs were found to contributeheavily towards private car users not using public transport.
Having kids or pets at home was found to be a significant stumbling block for thetransition to the public transport system. Having kids at home, especially young kidswho are dependant on parents to travel played a vital role in users preferring car overother modes of transport. Also, the literature study confirms this as Goteborgs Stad(2018) found that car use was higher amongst people with kids. Moreover, the sur-veys conducted in VGR determined that the highest use of the car was for travel andleisure purpose. This need can directly be associated with the need to be indepen-dent/freedom as the users mitigate the dependency on others in their personal livesduring this time and allow them to be spontaneous. Thus having a car at home madeit convenient to travel or go on vacations. The same reasons were found to apply topeople having pets at home. This purpose and need to be independent for vacationtravel is currently being fulfilled only by cars. However, the need to own a car can bemitigated with the help of shared car services in this scenario. Further having kidsat home was found to arouse a need to travel quickly in case of emergency, such asgoing to school to pick them up.
Furthermore, the literature search determined that the ownership of cars were influ-enced by the income and the location of jobs or residence. This factor was found to bevalid with the local population. The residents who live in the suburbs of Gothenburg
71

and other areas of VGR tend to have higher ownership of cars. They tend to use thecar for daily purposes of commuting. This factor was also found to be true in casesof having friends and relatives in the rural area, as they believe having a car at homemade it convenient to travel.
Also, a critical reason of unwillingness to wait was evident in the research, withthe car users expressing the need to improve the reliability and frequency of publictransportation. This unwillingness to wait for public transit was determined to beinstrumental in creating other users needs of the feeling of Independence& freedomof using car, reliability and frequency issues related to the use of public transporta-tion. As owning a car made it always accessible. Further corroborated by the fact of,the spare or non-existent supply of public transit in the suburbs of Gothenburg andother parts of VGR. This further reinforces towards the need of unwillingness to wait.Thought it identifed that, the car users had a broad understating of implications ofthe financial aspect of having increased public transportation in rural areas on thetransport agency. The car users understood that it might not be financially feasiblefor Vasttrafik to increase the supply of public transportation.
Additionally a need to be sustainable was identified in the user studies and the lit-erature on the local population of VGR. Many of the car users were found to betransitioning towards electric cars to reduce the carbon footprint. In general, peo-ple were willing to travel more collectively if the issues with public transportationimproved concerning reliability, frequency and accessibility.
8.2 Advantages and disadvantages offered by e-scooters
The second research sub-question was “What are the advantages and disadvantagesoffered by e-scooters to facilitate the transition?”. The study of the e-scooters de-termined that the e-scooters have been successful in filling the limitations in pubictransportation identified by the car users related to reliability, frequency and acces-sibility. However, the e-scooters are mostly used by residents of Gothenburg whodo not own a car. The unwillingness to wait for public transportation was also evi-dent among the e-scooter users. But primarily it was found that the e-scooter usesused the services only in case of emergencies where they did not have time to waitfor public transportation. The reason for this being, the cost of e-scooter servicesare considered to come at a premium. The premium cost of the e-scooters thus hasensured in public transportation being the preferred mode of transport amongst thee-scooter users. Though it must be noted that the car users felt that the cost of thee-scooter services was high.
Additionally, the feeling of independence & freedom was found to be associated withe-scooters too similar to cars, the contributing factor being the ability to control thee-scooter and not being dependent on the public transport system. The residentsof Gothenburg agreed the opinion of e-scooters being quick and easy to use, similarto users in the other cites such as Portland. Additionally, the supply of e-scooters
72

was found to be high and accessible in the center of the city of Gothenburg. Theusers were happy with the availability of them, though the e-scooters services are notavailable always in other parts of Gothenburg. Still, it was determined during theinterviews that the e-scooter service providers plan to service other areas along withextending the services to smaller cities in the future. Currently, the e-scooters servicesare not available elsewhere in VGR, and the expansion to other cities would thus playa vital role in solving the last mile problem for commuters who travel between cities,encouraging them to use commuter trains more.
This reason of e-scooters being used during an emergency can be attributed to unsaferiding leading to accidents as people are in a hurry to get to the destination and mayoverlook the safety requirements such as riding on sidewalks. Furthermore, the studyconfirms the impact on sustainable modes of transport concerning e-scooter users ad-mitting to walk or bike less. But due to the premium cost factor, the e-scooters werenot found to have affected the use of buses or trams in the city of Gothenburg as itwas found in the other cities across the globe.
It is imperative to consider that the e-scooters do not solve the issues for car users incase they have kids at home. The e-scooters, due to the limitation of the size factor,cannot support multiple people to travel together and also does not provide the re-quired safety to have kids on them. Additionally, they do not offer the opportunity tocarry bulky items. The e-scooters users though admitted that the e-scooters helpedin travelling between destinations, solely for commuting purposes. Thus e-scootersprovided a great potential in supporting the public transport system concerning com-muting in the city of Gothenburg, where it was determined that the 90% of the travelof VGR takes place. The e-scooter users also confirmed with the literature that thebad weather affected the use of them, but that led to the usage of public transporta-tion more.
Though the literature determined the environmental concerns of the e-scooters withe-scooters producing higher Co2 compared to public transportation. It was deter-mined that the residents of VGR were not aware of the sustainability challenges ofthe e-scooter services. Thus the negative implications of the e-scooter towards theenvironment did not affect the usage. Additionally as mentioned earlier the premiumcost of e-scooters has resulted in residents picking up sustainable mode of transport,i.e. the pubic transportation as a primary choice without being aware of it.
8.3 Barriers and drivers to provide a multi-modal transportsolution
The third research sub-question to be answered was “What are the barriers and driversto provide a multi-modal transport solution?”. The main driving force supporting theuse of public transportation was determined to be availability of car sharing services.The car sharing services were determined to play a major role in fulfilling few of the
73

user needs of e-scooter users. The e-scooter have a limitation in size, which meantthat the e-scooter users relied on car sharing services to go on vacations and to moveand using online delivery service more for shopping purposes. The non private carusers are using these services to fulfill the gaps created by the public transportation.It is important to consider the age factor with regard to non ownership of the cars,they users of e-scooters and shared car services they tend to be younger and haveno kids at home. Usually students or new graduates, the age of the these users areapproximately below 35 years. These users are observed to be using a multi-modalcombination of shared cars, e-scooter services and public transportation to fulfill theirtravel needs. Being younger and with a need to invest a substantial amount in carownership has led then to try different modes of transportation, thus being able toreap the benefits of e-scooters and shared car service, both of which can be considera new way of traveling. Though it is crucial to consider that the study could notdetermine the effect of the having kids on the e-scooter users. It is a possibility inthe future that the non private car users once they have kids at home, might considerbuying cars. The way the shared car services evolves and the extended availabilityof the shared car services can be instrumental in deterring in the need for car own-ership. The car sharing services are becoming popular as they provide advantage oftaking away the burden of maintenance of a private car. This was corroborated bythe car users admitting to the possibility of using this car sharing service to fulfillfew of there needs such as visiting friends and relatives in rural areas. Thus it isvery important to have car sharing services to compliment the e-scooter services andpublic transportation in fulfilling few needs of people.
Additionally the need to be sustainable was identified as an instrumental driving force.The residents of VGR were aware of the environmental implications of gasoline cars.This aspect leading few of the interviewees to buy electric cars to reduce the carbonimpact on the environment. Many of the users wanted to use public transportationwhenever possible as it is believed to be sustainable and pocket friendly. Though itwas found that having car at home created a self-reliance on car, i.e it stopped thecar users from trying out other modes of transport. The car users from the city ofGothenburg admitted that the public transport was good in the city especially aroundthe center, but still they used car as they had one at home. This mindset of beingused to using a car, due to owning a car was evident during the interviews.
Disconnect between e-scooter services and private car usersAs observed in the second step of system mapping (figure 46), there is a clear dis-connect between private car users and the e-scooter services. This disconnect can beconsidered the biggest contributing factor for non existence of a multi modal transportsolution of e-scooters and public transportation. The research determined that theuse of e-scooters was majorly amongst younger population, i.e younger than 35 years.As it is well know that e-scooters is a new mode of transport which started a couple ofyears ago the younger population was quick to adopt. Additionally, this quick adap-tation can be attributed to the high investment requirement to own a private car.This investment for owning a car is quite hard for students or young professionals.
74
Thus they are forced to try out different modes and methods of transportation whichtry to fulfill the gap created due to the absence of a private car. On the contrary theolder population, which owns a private car thus have no push to use e-scooters.
Negative perception of e-scootersE-scooters have been found to be in bad news due to bad riding habits, not beingsustainable and the conflict with the other modes due to sharing infrastructure. Mostimportantly as identified in the literature, bad parking habits have been a significantconcern for the residents of Gothenburg. The bad habits have resulted in e-scootersblocking sidewalks. Additionally, with Sweden categorizing the e-scooters in the samecategory of bikes, makes it challenging to regulate them. Therefore, making it depen-dent on the recommendations of the e-scooter service providers and good Samaritanhabits. There is a strong need to address these issues as it has been affecting theperspectives of the residents who don’t use them.
Lack of infrastructureThe lack of infrastructure was identified as a concern which could limit the growthto the e-scooter services. The increase in e-scooters would burden the bikepaths andcreate conflict with the bike users. Additionally the city of Gothenburg was neverplanned to include e-scooters as a travel mode. This means there is a lack of dedicatedriding and parking place. Thus leading to the e-scooters taking up space in publicareas dedicated for walking,or parking bikes. This factor will play a limiting role inincreasing the availability of the e-scooters as they get popular in the future.
8.4 Interesting observations
Cost dilemma of e-scooter servicesAs discussed earlier, the e-scooter service providers found the e-scooter services to beexpensive. Additionally from the surveys the car users expressed that reducing theprices of e-scooter services would make them use the e-scooters. As it has been foundthat the high prices of e-scooter services is resulting in e-scooter users using publictransportation as primary mode. Thus making e-scooters services cheaper thoughmight encourage private car users to use e-scooters, it might lead to e-scooter usersusing less of public transportation.
E-scooter services providers committedThe research also determines a strong commitment from e-scooter service providesto be sustainable. Over the last few months it has been found that the e-scooterservice provides have been introducing new e-scooter models which have a greater lifeexpectancy of up to two years. If the e-scooter if span is going to last the life span oftwo years, they would help in improving the revenues for e-scooter service providersand help them to be profitable along with making e-scooters more environmentallyfriendly.
75

During the interviews it was also determined that the e-scooter services providersare working towards being environmentally sustainable. They have been introduc-ing new e-scooter models with swappable batteries and these swappable batteries arebeing replaced using electric cargo bikes for transportation. This in turn reducesthe carbon footprint of the e-scooters, as they don’t need to use trucks replace thee-scooters. Also with the introduction of swappable batteries the service providersavoiding moving the e-scooters form its location, ensuring the e-scooter is available tothe previous user, thus addressing the last mile problem. It was also determined thatthe e-scooter service providers are trying to work closely with the public agencies andtransportation authorities to address the concerns related to regulations. Further-more as discussed earlier the e-scooter service provided were found to be committedtowards servicing smaller cities in Vastra Gotaland region.
Opposite effects of bad weatherIt was also found from the interviews that, e-scooter users preferred to use publictransportation more during bad weather when it is raining or roads are icy. On thecontrary the car users considered bad weather to be a detrimental factor for usingpublic transportation, which made cars a better option.
8.5 Recommendations
The most important factor identified in the study was the gap between the e-scooterservice and the private car users. Though the e-scooters have been able fulfil few ofthe limitations of public transportation especially with regard to residents who don’town a car in Gothenburg city. It is crucial for private car users to try using e-scooterservices to understand the possibility it offers to overcome the gaps in public trans-portation. i.e similar to how the current e-scooter users are using them. To encourageprivate car users to use e-scooters services three are three recommendations.
Recommendation 1: Introduction of designated and widespread parkingHaving dedicated parking spaces not only solves the current problem of bad park-ing. It also has an effect of the visual appeal of the e-scooters. This would help inovercoming the barrier related to negative perception about e-scooters with regardto causing inconvenience to other modes of transport. Additionally the continuousavailability and appeal of e-scooters would encourage people to use e-scooters more.As seen in the figure 47, it would not only solve the issues of parking it would have apositive influence on convenience aspect of using e-scooters. Furthermore it is impor-tant to have the dedicated parking facility widespread closer to, residences, bus/tramstops, workplaces and commercial places. This would ensure in developing the senseof continuous availability of the e-scooters. Though it is important to still have theoption of the ability to park closer to final destinations as it will not be possibleto provide dedicated parking spaces everywhere, so as to not loose the advantage ofdockless parking. The option to have dockless parking has been the selling point forthe e-scooter services and the this was confirmed in the interviews and the surveys,with respondents claiming the dockless nature making it very convenient to use. The
76

use of dedicated parking spaces can be promoted through parking recommendationand financial incentives for using them.
Recommendation 2: Training to use e-scooters targeting private car usersThe e-scooter service providers should run training programs. This training wouldhelp in imbibing safe riding habits, such as being considerate to other people whoshare the infrastructure, such as bike paths and parking on side walks. The trainingprograms are very important to change way people use e-scooters and also changethe perception about the lack of safety in e-scooters. Additionally the training shouldtarget private car users and older people. This would let the user interact with theservice providers and get familiar to using e-scooters in safe controlled environment.Thus providing an opportunity to try the e-scooters. The training could also be useto promote the advantages of e-scooter and also train in safe riding and good parkinghabits. This focused training then would affect the perception of being used to usingcars (figure 47) and help the private car users to visualize the possible benefits ofusing the e-scooters along with public transportation.
Recommendation 3: Financial incentives for older usersThe e-scooter services should provide financial incentives for older e-scooter users, i.eapproximately 35 years and older. As this group is found to own cars and not tryother modes of transport. The financial incentives would encourage the private carusers to try e-scooter services. But it is to be noted that this is more a complementaryrecommendation to the other two recommendations, to tilt the balance of the finicalbenefits towards using e-scooters and public transportation.
8.6 Inference on the method
The study started with backcasting process in Phase I of Challenge Lab. The meth-ods in the phase I was exercised through with a lot of dialogues and interaction withstakeholders. The other methods followed in phase II of the study has used the KJMethod, force field analysis and systems mapping to analyze the information gatheredthrough the interviews and surveys. It is essential to consider the fact that, the datacollected through the surveys and especially interviews are a small sample and runsthe risk of being biased and not being representative of the whole population of VGR.
Also, the methods used to analyze the data, KJ method, FFA and systems mappinghave been carried out by one individual, i.e. the author. At the same time, thesemethods are recommended to be carried out by a group of stakeholders. However,effort and precaution have been taken to have an unbiased analysis by continuousevaluation of the results. The e-scooter service providers need to gather more infor-mation from users and involve other stakeholders to determine the needs of privatecar users to address them in the local context.
77

Figure 47: Systems mapping - Effect of recommendation on the system
78

9
ConclusionTo address the challenge created by cars towards a sustainable society related toVastra Gotaland region. The first part of the thesis aimed to assess the possibility ofe-scooter services to help fulfill the needs of car users, along with public transporta-tion in VGR. The region has a plan to reduce the number of journeys carried out bycars and increase the use of public transport.
From the study, it was found to be evident that the push and pull forces exists in thesystem concerning buying new cars, with higher taxes and parking costs being thepush force towards the use of public transportation. The low cost of public transportand availability of e-scooter services and shared car services acting as a pull force.But it was found that cars were necessary to fulfill a few of the needs of the users.Thus the need for a car is created. But the need to have a personal vehicle can beovercome with the help of shared car services. Though this shared service is availableat a premium cost, they provide an advantage in terms with taking away the necessityto invest in buying and maintaining a car. The e-scooter users, younger in age werefound to be successfully using the e-scooter services, shared car services and publictransportation as a multi-modal transport solution to mitigate the need to own a carand use more sustainable methods of travel. Additionally, the study determines thatthe e-scooter are capable of supporting the gaps in the public transport concerningfrequency, reliability and accessibility. These aware the same needs identified by carusers as a crucial to be addressed in public transportation. E-scooters thus can beinstrumental in helping in travelling between two destinations, such as for daily com-muting between two places.
The study also identifies that the e-scooter services are limited to the city. Thus the e-scooters can only be effective complementing public transport system in Gothenburgand municipalities around it. Though e-scooters companies are planning to extendthe services to smaller cities, they might start to have a similar effect in other partsof VGR. It is imperative that e-scooters alone cannot fulfill all the needs of the users.Thus shared car services are needed to satisfy some of the needs of the residents.Therefore, shared car services need to grow in other parts of VGR.
The crucial finding of the study was the disconnect between private car users ande-scooter services. Impact of the push forces is absent on residents who already owna car. Thus the transition to other modes of transport has is solely depended on thepull forces. Additionally, the findings of the research are that the e-scooters wouldhave limited effect on private car users. Following the three recommendations of thestudy, there is a possibility to make private car users use e-scooters. The use of e-scooters would begin with leisure trips, which could potentially grow into commuting
79

trips and replacing few journeys which would otherwise be carried out using cars, es-pecially alone. The use of the e-scooters thus would help in car users understandingthe benefits they offer in filling the gaps in public transportation.
Though it can be concluded that cars cannot be completely be rid off, and as Steg(2003) says not all car users can be convinced to use public transportation. The e-scooter services if they manage to be sustainable both environmentally and financially,they along with shared car services will be instrumental in fulfilling the limitationsof public transportation to the extent of influencing the residents not to buy cars.Additionally with cars and public transport system moving towards being powered byelectric motors along with the e-scooter services can shape into a potent multi-modaltransport alternative in the near future as it takes away need for car ownership in thecity of Gothenburg. Thus the e-scooters along with shared car services are showinga trend in having detrimental effect on the increase in the number of car ownershipin Vastra Gotaland region, especially in the city of Gothenburg.
80

AppendicesA
Surveys
A.1 Survey on car user needs
1.Do you own a car?•Yes •No
2.Do you plan on buying a car?•Yes •No
3.Do you use a car?•Yes •No
4.For what purpose do you use the car?•work/school •Shopping •Visit friends/relatives •Leisure/holidays/travel •Others
5. What factors mentioned below influence the use of the car?•Convenience •Comfort •Flexibility •Safety •Accessibility •Status•Independence/Freedom •Reliability •Pleasurable •Control •Other
6.How important is “convenience” when you use the car? (On the scale 1 to 5)
7.How important is “comfort” when you use the car? (On the scale 1 to 5)
8.How important is “flexibility” when you use the car? (On the scale 1 to 5)
9.How important is “safety” when you use the car? (On the scale 1 to 5)
10.How important is “accessibility” when you use the car? (On the scale 1 to 5)
11. How important is “status” when you use the car? (On the scale 1 to 5)
12. How important is “independence/freedom” when you use the car? (On the scale1 to 5)
13. How important is “reliability” when you use the car? (On the scale 1 to 5)
14.Do you use public transport?•Yes •No
a

15.For what purpose do you use public transportation?•work/school •Shopping •Visit friends/relatives •Leisure/holidays/travel •Other
16.How often do you use public transportation?•Once a week •Twice a week •2-5 times a week •6-10 times a week •>10 times a week
17.What needs to be improved to make you use make you use more of public trans-portation?•Frequency •Reliability •Speed •Safety •others•Accessibility (last-mile/first-mile problem)Elaborate on your choice (optional)
18.Which are the modes of transport you use for commuting?•Car •bus/tram •Walking •bike/bicycle •E-scooter •other
19.Which is your preferred mode of transport?(select the top three in the order of preference)•Car •bus/tram •Walking •bike/bicycle •E-scooter •other
20.Describe why did you choose any particular mode of transport.
21.How old are you?•<18 •18-25 •26-35 •36-50 •51-65 •>65
22.What is your gender?•Male •Female •Other
23.How many people live in your household?•1 •2 •3 •>3
24.How many kids do you have?•None •1 •2 •3 •>3
25.Where do you live?•Gothenburg city •Vastra Gotaland region •Stockholm •Others
A.2 Survey on e-scooters
1.Do you use e-scooters?•Yes •No
2.How do you use e-scooters?•Just the e-scooter (it is always available to where I am)•Walking + E-scooter ( I have a walk a bit to access the e-scooters)•E-scooters + public transportation (last mile/first mile)
b
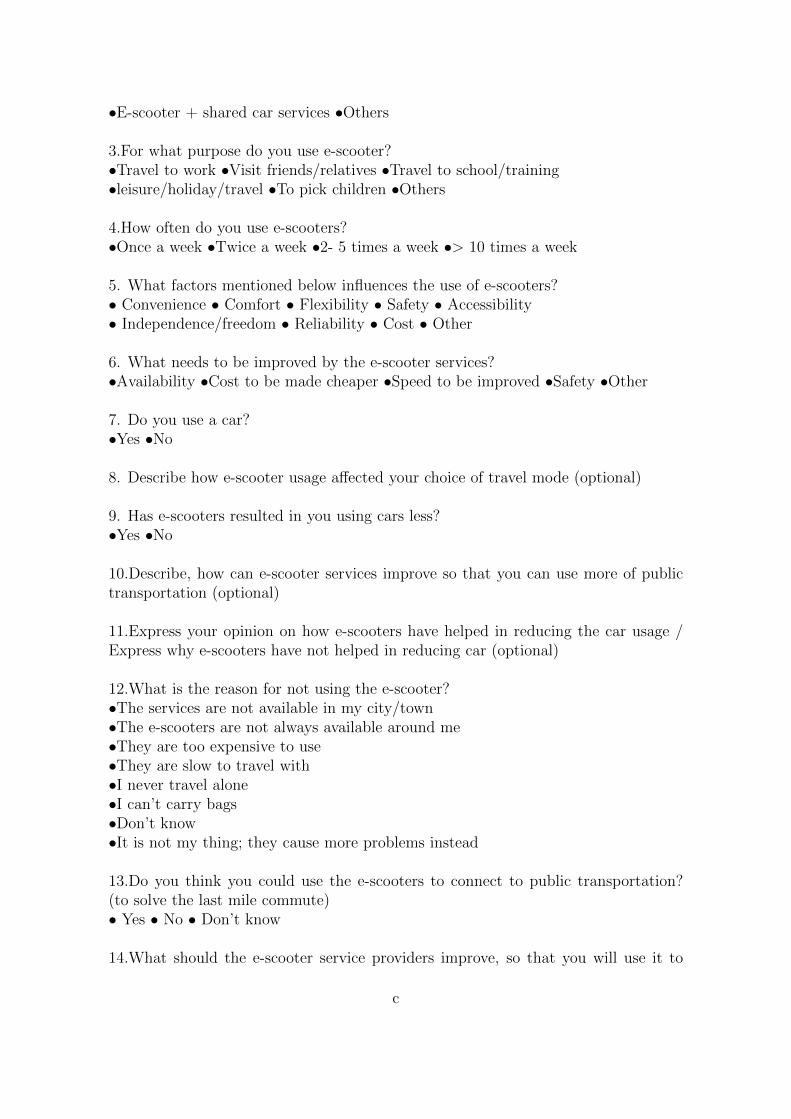
•E-scooter + shared car services •Others
3.For what purpose do you use e-scooter?•Travel to work •Visit friends/relatives •Travel to school/training•leisure/holiday/travel •To pick children •Others
4.How often do you use e-scooters?•Once a week •Twice a week •2- 5 times a week •> 10 times a week
5. What factors mentioned below influences the use of e-scooters?• Convenience • Comfort • Flexibility • Safety • Accessibility• Independence/freedom • Reliability • Cost • Other
6. What needs to be improved by the e-scooter services?•Availability •Cost to be made cheaper •Speed to be improved •Safety •Other
7. Do you use a car?•Yes •No
8. Describe how e-scooter usage affected your choice of travel mode (optional)
9. Has e-scooters resulted in you using cars less?•Yes •No
10.Describe, how can e-scooter services improve so that you can use more of publictransportation (optional)
11.Express your opinion on how e-scooters have helped in reducing the car usage /Express why e-scooters have not helped in reducing car (optional)
12.What is the reason for not using the e-scooter?•The services are not available in my city/town•The e-scooters are not always available around me•They are too expensive to use•They are slow to travel with•I never travel alone•I can’t carry bags•Don’t know•It is not my thing; they cause more problems instead
13.Do you think you could use the e-scooters to connect to public transportation?(to solve the last mile commute)• Yes • No • Don’t know
14.What should the e-scooter service providers improve, so that you will use it to
c

connect to public transportation?•Availability of e-scooters•Speed of e-scooters•Parking facility near bus/tram stops•Cost factor should be improved •Others
15.Express your opinion on what the e-scooter services should offer for you to use it
16.How old are you?•<18 •18-25 •26-35 •36-50 •51-65 •>65
17.What is your gender ?• Male • Female
18.How many kids do you have?•0 •1 •2 •3 •>3
19.What is the number of people in your household?•1 •2 •3 •>3
20.Where do you live?•Gothenburg city •Vastra Gotaland region •Stockholm •Others
d

B
Survey comments
B.1 Car users preferred mode of transport
Car users Gothenburg cityPeferede modeof transport
Comments
bike/cycle Convenient, good exercise, saving time and moneyCar FreedomCar Speed and save timeCar Convenience and costbike/cycle Elektrici bicykle is fantastik but the Winter is to coldbike/cycle Convinience of the bike in yhe cityCar To commute to work takes too long time Vs carCar Convenience and reliability with the car over bus/trambike/cycle Cycling gives training and transport to workCar Time to get to work + too far to walkwalking Environmental reason. I also have a Tesla.walking Self employedBus/tram I have a fast and nice car. Its enogh for me.
CarI walk when I can, i.e. when there’s no load to carry or distanceis within 3/4 km. Car to and from work, to save time. If a client isin the town city, I sure go by bus and subway.
CarIt is flexibel, and easy. I do allot of business calls while drivning,that you cannot do using public transportation
Car Convenience
CarI love to cycle but I live too far from work and 3 kids need to bedriven to school and preschool.
Bus/tramBus/Tram when going to places where public transport is fastest,using car when I need flexibility. Always prefer to walk when ashorter distance if I have the time
Bus/tram Climate and relaxation
e

Car users - Rest of VGRPreferred modeof transport
Comments
bike/cycle Fresh air, light exercise.Car Live in Countryside. Nearly impossible to take buses.bike/cycle Least travel timeCar I live in a rural area, there is really no alternative.Train Train is comfortable for longer travel. Electric car for daily travels.Car Superior flexibility and comfort.Car Most convenient where I live
bike/cycleIt depends on the distance. Most destinations – I would atleast 95% – a bike is sufficient for me.
Car Quick, flexible and lowest cost with our electric hybridCar The car takes me were I want when I want it to.
CarTo long time from door to work and back home with publictransportation, uses car instead
Car Easy and fastCar Flexibility, reliability, safety, efficiency, speed and much moreCar EasyCar Most suitableCar Better for the environment and healthE-scooters Love the feelingCar Most comfortableCar Distance
CarI live in a rural area, public transport is not a viableoption most of the time. Also I drive an electric carand thus feel the load on the environment is quite low.
Car Easybike/cycle Because of the Climate CrisisRunning DistanceCar ConvenienceCar EV car, convenienceCar If I have to travel long I take the car otherwise I try to walk.bike/cycle Suite most needsbike/cycle Distance and weatherCar being able to have wheelchair and other necessities with us.Car Se tidigare svar
walkingI like to walk when the distance is reasonable, because itrequires no tools nor machines, and it gives me exercise.
Car The flexibility and travel timeCar I need a car for my work
f

C
Interview questions
C.1 Car Users
1. To what extent do you use the car, compared to other modes of transport Alta: Why do you prefer the car over other transport modes? Alt b: Why do youprefer other transport modes?
2. How satisfied are you with your preferred mode of transport?
3. For what purposes do you use the car?
4. What benefits do you see in owning/using a car?
5. What challenges do you see in the current public transport system?
6. How satisfied are you with the current public transport system?
7. How do you think it should improve for you to use it more?
8. Does the location where you stay affect your choice of your mode of transport?
9. How would you feel about living without a car?
10. What do you think of other modes of transport? (walking, electric-bikes, e-scooters)
11. Have you used e-scooters? Or do you consider using them?
12. If you have used e-scooters, for what purpose did you use?
13. Anything more you would like to add?
C.2 E-scooter users
1. What is your preferred mode of transport and why?
2. For what purposes do you use e-scooters? And before e-scooters, which modesdid you use for these purposes?
3. Do you see, e-scooters changing the way people travel?
4. How has using e-scooters changed the way you travel?
5. Has e-scooters made you use the car less?
6. Do you think e-scooters has made you use more public transportation?
g

7. Has e-scooters made you bike or walk less?
8. How satisfied are you with e-scooters?
9. What challenges do you see with e-scooters?
10. What do you think the e-scooter services should improve in the product or theservice?
C.3 E-scooter service providers
1. How do you think e-scooters can solve the mobility issue?
2. What challenges do you see with urban spaces?
3. Co2 emissions is greater with redistribution how are you tackling it?
4. The profitability of the business model? When it is expected to get profitable?
5. Plans for implementing the services in rural areas and the challenges faced withit?
6. Do you plan on having them located close to residential areas, so people canuse it to connect to public transportation?
7. What are the challenges you are facing with regulations?
8. Have you thought about working with the local public transportation to act asa complementing system?
9. Do you work with municipalities to get favourable regulations for business? Orthe challenges you are facing?
10. What role do politicians have to play?
11. How are you planning on taking the issue with vandalism?
C.4 Regulators & researchers
1. Do you see e-scooters as a solution or a problem?
2. What challenges do you think the e-scooters create?
3. E-scooters share the infrastructure but are not designed for the current infras-tructure? How do you think they should be addressed?
4. Dock less parking is an issue, how are the regulators planning to address this?
5. Carbon emission with redistribution or replacing batteries is high, localisedcharging is needed?
h

6. Do you think the e-scooters can act as a complimentary service to public trans-portation? Or work together with them?
7. Can it help reduce the number of cars on the roads?
8. They are non-existing in other parts of VGR or outskirts of the city, this iswhere they can have a bigger impact due to lack of public transportation. Howdo you think this should be addressed?
i
ReferencesAdams, W. C. (2015). Conducting Semi-Structured Interviews. Handbook of Practical
Program Evaluation: Fourth Edition(August 2015), 492–505. doi: 10.1002/9781119171386.ch19
Ajao, A. (2019). Electric Scooters And Micro-Mobility: Here’s Everything YouNeed To Know. Retrieved 2020-03-05, from https://www.forbes.com/sites/
adeyemiajao/2019/02/01/everything-you-want-to-know-about-scooters
-and-micro-mobility/{\#}152bcb255de6
Alphabet. (2019). Micro-mobility and the last-mile trend — Alphabet. Retrieved2020-06-04, from https://www.alphabet.com/en-ww/blog/micro-mobility
-and-last-mile-trend
Apuke, O. D. (2017). Quantitative Research Methods : A Synopsis Approach. KuwaitChapter of Arabian Journal of Business and Management Review , 6 (11), 40–47.doi: 10.12816/0040336
Arivananthan, M. (2015). FishBowl - Maximizing participation in direct conversationswith experts. Unicef , 1–6.
Azar, C., Holmberg, J., & Lindgren, K. (1996). ECOLOGICAL ECONOMICSMethodological and Ideological Options Socio-ecological indicators for sustain-ability (Vol. 18; Tech. Rep.).
Bala, B. K., Arshad, F. M., & Noh, K. M. (2017). Causal Loop Diagrams. (January2004), 37–51. doi: 10.1007/978-981-10-2045-2 3
BBC. (2019). Electric scooters: France introduces new rules to ’restore tranquillity’- BBC News. Retrieved 2020-06-14, from https://www.bbc.com/news/world
-europe-50189279
Bird. (2019). Bird Introduces Designated Parking in Paris - Bird · Enjoy the ride.Retrieved 2020-06-15, from https://www.bird.co/press/bird-introduces
-designated-parking-in-paris/
Brandt, P., & Toll, M. (2019). Stockholm tar fram nytt regelverk forelscootrar. Retrieved 2020-06-15, from https://www.stockholmdirekt.se/
nyheter/stockholm-tar-fram-nytt-regelverk-for-elscootrar/
repscu!o@95lFIFWJQQAi6unSZafQ/
Brustein, J., Lanxon, N., & Foy, S. (2019). Why E-Scooters Are on theRise, Along With Injuries: QuickTake - Bloomberg. Retrieved 2020-03-05, from https://www.bloomberg.com/news/articles/2019-07-20/why
-e-scooters-are-on-the-rise-along-with-injuries-quicktake
Carson, S. (2020). Milwaukee e-scooters in winter: What happens to them, where dothey go. Retrieved 2020-05-25, from https://eu.jsonline.com/story/news/
local/2019/11/06/milwaukee-e-scooters-winter-what-happens-them
-where-do-they-go/4116010002/
Challenge Lab. (2020). About Challenge Lab – Challenge Lab. Retrieved 2020-03-03,from https://www.challengelab.chalmers.se/about/
City of Dallas. (2019). Dockless vehicles. Retrieved 2020-06-15, fromhttps://dallascityhall.com/departments/transportation/Pages/
i

Dockless-Vehicles-.aspxhttps://data.louisvilleky.gov/dataset/
dockless-vehicles
CNN. (2019). Electric scooters face bans and restrictions around the world —CNN Travel. Retrieved 2020-03-05, from https://edition.cnn.com/travel/
article/electric-scooter-bans-world/index.html
Corpuz, G. (2007). Public transport or private vehicle: Factors that impact on modechoice. 30th Australasian Transport Research Forum, 1–11.
Council, W. W. (2017). 70 % of the World ’ s Population Will Live in Cities by 2030, While 60 % of Urban Settlements Remain to be Built ( UN-Habitat , WorldCities Report ) The World Water Council unites with major city networks • By2030 there will be a 50 % increase in deman.
Crellin, F. (2019). Paris clamps down on electric scooters as law of the jungle rules- Reuters. Retrieved 2020-06-15, from https://www.reuters.com/article/
us-france-paris-scooters/paris-clamps-down-on-electric-scooters
-as-law-of-the-jungle-rules-idUSKCN1TP1ZV
Dimitrova, M. (2019). Swedish authorities are looking into possi-ble new rules for e-scooters — TheMayor.EU. Retrieved 2020-03-05, from https://www.themayor.eu/en/swedish-authorities-are-looking
-into-possible-new-rules-for-e-scooters
EY. (2020). Micromobility: Moving cities into a sustainable future (Tech. Rep.).Faxer, A. (2019). A Tough Game for Electric Scooters — Drive Sweden. Retrieved
2020-06-01, from https://www.drivesweden.net/en/tough-game-electric
-scooters
Fong, J., & Mcdermott, P. (2019). Micro-Mobility , E-Scooters and Implications forHigher Education. (May), 1–21.
Fournier, C. (2019). Sustainable Mobility: Are Electric Scooters Eco-Friendly?- Youmatter. Retrieved 2020-06-01, from https://youmatter.world/en/
sustainable-mobility-electric-scooters-28897/
France 24. (2019). Activists sabotage ’ecologically catastrophic’ e-scooters in France- France 24. Retrieved 2020-06-01, from https://www.france24.com/en/
20191205-activists-sabotage-ecologically-catastrophic-e-scooters
-in-france
Geels, F. W. (2002). Technological transitions as evolutionary reconfiguration pro-cesses: A multi-level perspective and a case-study. Research Policy , 31 (8-9),1257–1274. doi: 10.1016/S0048-7333(02)00062-8
Geels, F. W. (2005). Processes and patterns in transitions and system innovations:Refining the co-evolutionary multi-level perspective. Technological Forecastingand Social Change, 72 (6 SPEC. ISS.), 681–696. doi: 10.1016/j.techfore.2004.08.014
Gossling, S. (2020). Integrating e-scooters in urban transportation: Problems, poli-cies, and the prospect of system change. Transportation Research Part D:Transport and Environment , 79 (January), 102230. Retrieved from https://
doi.org/10.1016/j.trd.2020.102230 doi: 10.1016/j.trd.2020.102230Gotalandsregionen, V. (2018). Goal image Koll2035 for the urban traffic’s core
network - Vastra Gotaland region. Retrieved 2020-03-05, from https://
ii

www.vgregion.se/kollektivtrafik/trafikforsorjningsprogrammet--sa
-utvecklas-kollektivtrafiken/malbild-koll2035-for-stadstrafikens
-stomnat/
Goteborgs Stad. (2018). Resvaneundersokning 2017. Retrieved from https://
goteborg.se/wps/wcm/connect/6c603463-f0b8-4fc9-9cd4-c1e934b41969/
Trafikstrategi{\ }eng{\ }140821{\ }web.pdf?MOD=AJPERES
Griswold, A. (2019). How European scooter companies plan to beat the winter —Quartz. Retrieved 2020-05-25, from https://qz.com/1762010/how-european
-scooter-companies-plan-to-beat-the-winter/
Haworth, N. L., & Schramm, A. (2019). Illegal and risky riding of electric scootersin Brisbane. Medical Journal of Australia, 211 (9), 412–413. doi: 10.5694/mja2.50275
Hollingsworth, J., Copeland, B., & Johnson, J. X. (2019). Are e-scooters polluters?the environmental impacts of shared dockless electric scooters. EnvironmentalResearch Letters , 14 (8). doi: 10.1088/1748-9326/ab2da8
Holmberg, J., & Larsson, J. (2018). A sustainability lighthouse-supporting transitionleadership and conversations on desirable futures. Sustainability (Switzerland),10 (11). doi: 10.3390/su10113842
Holmberg, J., & Robert, K. H. (2000). Backcasting — a framework for strategicplanning. International Journal of Sustainable Development and World Ecology ,7 (4), 291–308. doi: 10.1080/13504500009470049
Kabashkin, I. (2015). Modelling of Regional Transit Multimodal Transport Accessi-bility with Petri Net Simulation. Procedia Computer Science, 77 , 151–157.Retrieved from http://dx.doi.org/10.1016/j.procs.2015.12.373 doi:10.1016/j.procs.2015.12.373
Khreis, H., Nieuwenhuijsen, M., & Bastiaanssen, J. (2017). Creating Car FreeCities: Rational, Requirements, Facilitators and Barriers. Journal of Trans-port & Health, 5 , S65–S66. Retrieved from http://dx.doi.org/10.1016/
j.jth.2017.05.210 doi: 10.1016/j.jth.2017.05.210Kreuzer, A. (2019). Electric scooters: get to know the new regula-
tions - Bavarian News, U.S. Army Garrison Bavaria. Retrieved 2020-06-15, from https://www.bavariannews.com/blog/2019/07/19/electric
-scooters-get-to-know-the-new-regulations/
Lawrence, M. (2019). DPD Has Issued About 20 Scooter Citations. Re-trieved 2020-07-24, from https://www.dallasobserver.com/news/
dallas-police-have-issued-about-20-citations-to-people-riding
-scooters-illegally-11727533
Local, T. (2019). Sweden to crack down on e-scooter ’mess’ with new regulations -The Local. Retrieved 2020-03-05, from https://www.thelocal.se/20190912/
sweden-to-crack-down-on-e-scooter-mess-with-new-regulations
Marcus, I. (2020). Berlin Police Log High Number of E-Scooter Accidents – TheBerlin Spectator. Retrieved 2020-07-24, from https://berlinspectator.com/
2020/06/18/berlin-police-log-high-number-of-e-scooter-accidents/
NACTO. (2019). Shared Micromobility in the U.S.: 2018 — National Association ofCity Transportation Officials. Retrieved 2020-06-04, from https://nacto.org/
iii

shared-micromobility-2018/
Naderifar, M., Goli, H., & Ghaljaie, F. (2017). Snowball Sampling: A PurposefulMethod of Sampling in Qualitative Research. Strides in Development of MedicalEducation, 14 (3). doi: 10.5812/sdme.67670
O’Gorman, K., & MacIntosh, R. (2015). Research Methods for Business & Man-agement. In (2nd ed., pp. 31–49). Goodfellow Publishers Ltd. doi: 10.23912/978-1-910158-51-7-2790
PBOT. (2019). 2018 e-scooter findings report (Tech. Rep.). Retrieved from https://
www.portlandoregon.gov/transportation/77294
Pesce, N. L. (2020). Electric scooter injuries jumped 222% over the past four years- MarketWatch. Retrieved 2020-05-25, from https://www.marketwatch.com/
story/your-first-e-scooter-ride-will-probably-land-you-in-the
-hospital-2019-05-03
Pojani, D., & Stead, D. (2015). Sustainable urban transport in the developingworld: Beyond megacities. Sustainability (Switzerland), 7 (6), 7784–7805. doi:10.3390/su7067784
project management.com. (2017). Affinity Diagram – Kawakita Jiro or KJMethod. Retrieved 2020-09-08, from https://project-management.com/
affinity-diagram-kawakita-jiro-or-kj-method/
Quartz. (2019). At least 29 people have died in electric scooter crashes — Quartz.Retrieved 2020-05-25, from https://qz.com/1793164/at-least-29-people
-have-died-in-electric-scooter-crashes/
Queensland Government. (2019). Rules for personal mobility devices —Transport and motoring — Queensland Government. Retrieved 2020-06-15, from https://www.qld.gov.au/transport/safety/rules/wheeled
-devices/personal-mobility-devices
Riga, R. (2019). Brisbane scooter riders fined for hundreds of safetybreaches in Queensland - ABC News. Retrieved 2020-07-25, fromhttps://www.abc.net.au/news/2019-03-30/electric-scooters-riders
-fined-safety-breaches-brisbane-qld/10956110
Robinson, M. (2018). Should You Ride an Electric Scooter? - The Atlantic. Retrieved2020-06-01, from https://www.theatlantic.com/technology/archive/
2018/05/electric-scooters-are-the-cargo-shorts-of-transportation/
561440/
Rutakumwa, R., Mugisha, J. O., Bernays, S., Kabunga, E., Tumwekwase, G.,Mbonye, M., & Seeley, J. (2019). Conducting in-depth interviews with andwithout voice recorders: a comparative analysis. Qualitative Research, 15–17.doi: 10.1177/1468794119884806
smart city, B. (2020). E-Scooters: A Collision Between Innovation And Contro-versy. Retrieved 2020-05-26, from https://hub.beesmart.city/solutions/
en/smart-mobility/e-scooters-a-collision-between-innovation-and
-controversy
Smith, A., Stirling, A., & Berkhout, F. (2005). The governance of sustainable socio-technical transitions. Research Policy , 34 (10), 1491–1510. doi: 10.1016/j.respol.2005.07.005
iv

Smith, C. S., & Schwieterman, J. P. (2018). E-Scooter Senarios: Evaluating thepotential mobility benifits of sharde dockless scooters in chicago.
Spool, J. M. (2004). The KJ-Technique: A Group Process for Establishing Priorities.User Interface Engineering . Retrieved from https://articles.uie.com/kj{\
}technique/http://www.uie.com/articles/kj{\ }technique/
Steg, L. (2003). Can Public Transport Compete With the Private Car? IATSSResearch, 27 (2), 27–35. doi: 10.1016/s0386-1112(14)60141-2
Stradling, S., & Anderson, S. (2012). Unable or unwilling? Attitudes to modal shiftin Scotland. , 17 (4), 291–297.
The Local. (2019). Sweden to crack down on e-scooter ’mess’ with new regulations -The Local. Retrieved 2020-05-26, from https://www.thelocal.se/20190912/
sweden-to-crack-down-on-e-scooter-mess-with-new-regulations
The Royal Society for the Prevention of Accidents. (2019). The Royal Society for thePrevention of Accidents Road Safety Factsheet: Electric Scooters (E-Scooters)Electric Scooters (E-Scooters) What are E-Scooters?
Thomas, J. (1985). Force field analysis: A new way to evaluate your strategy. LongRange Planning , 18 (6), 54–59. doi: 10.1016/0024-6301(85)90064-0
Thomas, K. (2019). E-scooter pilot program will return to Portlandwith new rules, enforcement fines — KATU. Retrieved 2020-07-24, from https://katu.com/news/local/e-scooter-pilot-program-will
-return-to-portland-with-new-rules-and-enforcement
Tidey, A. (2019). Germany legalises e-scooters but bans them from the pavement —Euronews. Retrieved 2020-06-15, from https://www.euronews.com/2019/05/
17/germany-legalises-e-scooters-but-bans-them-from-the-pavement
Tier. (2020). Help – TIER. Retrieved 2020-06-15, from https://www.tier.app/
help/
transport administration, U. (2014). Adopted By the Urban Transport CommitteeFebruary 2014 Transport Strategy for a Close-Knit City. (February).
Ulrich, K. T., & Eppinger, S. D. (2012). Product design and development. In Mcgraw-hill (5th ed., pp. 91–117). McGraw-Hill. doi: 10.1016/0956-5663(92)90013-D
United Nations. (2020). Home - 2019 - United Nations Sustainable Development.Retrieved 2020-03-03, from https://www.un.org/sustainabledevelopment/
Vasttrafik. (2019). Vasttrafik 2035 - framtidens kollektivtrafik — Vasttrafik. Retrieved2020-03-05, from https://www.vasttrafik.se/info/vasttrafik-2035/
VOI Technologies. (2020). Voi Scooters - FAQ. Retrieved 2020-06-15, from https://
www.voiscooters.com/faq/
Webb, R. (2011). Public transport versus the private car: a study of attitudes towardstransport modes in Plymouth. (1), 325–371.
Wired. (2019). Paris Ends an E-Scooter Melee With New Rules of the Road —WIRED. Retrieved 2020-06-01, from https://www.wired.com/story/paris
-escooters-regulation/
Zipper, D. (2020). Local Regulations Can Be an E-Scooter Killer - Bloomberg. Re-trieved 2020-06-19, from https://www.bloomberg.com/news/articles/2020
-02-10/local-regulations-can-be-an-e-scooter-killer
v