multi-asset market outlook
TRANSCRIPT

For professional investors
Bitcoin as digital gold – a multi-asset perspective
Multi-asset market outlook
April 2021

Economy Equities Fixed Income FX Special Topic Heatmap
General overview
2
March: a terrible month for commodities
Positions: still reflationary but more selective
> While fixed income markets mainly remained under pressure, they were not the worst performing asset class in March. That honor went to commodities. After leading the way over the past months, commodities came under pressure in March. The decline was broad based. Crude oil lost more than 10% of its value in four days. The exact reason why this happens remains unknown. The slowly strengthening US dollar and the prospects of slower demand due to less expansive policies in China, along with an increase in coronavirus infections in Europe, probably played a part.
> The top performer was real estate. This equity sector lagged the rebound seen in equities over the past months but started to make an impressive comeback. Equities in general also did quite well in March. Within equity markets, however, there were substantial performance differences. Small caps and value stocks did very well while growth stocks had a difficult month.
> We continue to run a procyclical portfolio that benefits from economies that continue to reflate. We did however become more selective on how to play this. The slowly increasing US dollar triggered us to close our exposure to emerging markets in both equities and fixed income. We added to our regional equity trade in which we prefer exposure to Europe and Japan at the expense of US equities. The former markets are more skewed towards value stocks, which is an equity style we think will continue to do well. No changes were made to our exposure to commodities, Investment grade corporate bonds and US Treasuries.
Source: Bloomberg, Robeco
Source: Robeco All market data to 31 March unless mentioned otherwise
Economy Equities Fixed Income FX Special Topic Heatmap
Theme of the monthBitcoin as digital gold – a multi-asset perspective (I)
3
An historical perspective: gold versus inflation
Average annualized returns: exceptional returns for bitcoin
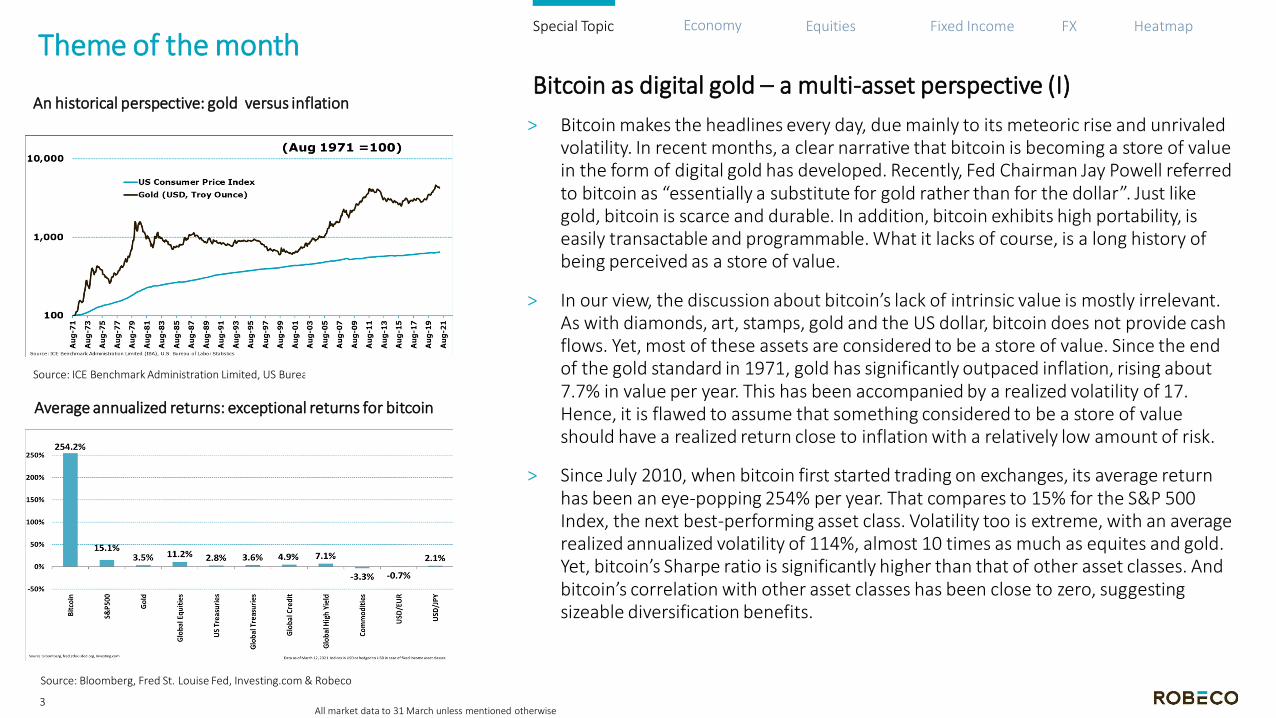
> Bitcoin makes the headlines every day, due mainly to its meteoric rise and unrivaled volatility. In recent months, a clear narrative that bitcoin is becoming a store of value in the form of digital gold has developed. Recently, Fed Chairman Jay Powell referred to bitcoin as “essentially a substitute for gold rather than for the dollar”. Just like gold, bitcoin is scarce and durable. In addition, bitcoin exhibits high portability, is easily transactable and programmable. What it lacks of course, is a long history of being perceived as a store of value.
> In our view, the discussion about bitcoin’s lack of intrinsic value is mostly irrelevant. As with diamonds, art, stamps, gold and the US dollar, bitcoin does not provide cash flows. Yet, most of these assets are considered to be a store of value. Since the end of the gold standard in 1971, gold has significantly outpaced inflation, rising about 7.7% in value per year. This has been accompanied by a realized volatility of 17. Hence, it is flawed to assume that something considered to be a store of value should have a realized return close to inflation with a relatively low amount of risk.
> Since July 2010, when bitcoin first started trading on exchanges, its average return has been an eye-popping 254% per year. That compares to 15% for the S&P 500 Index, the next best-performing asset class. Volatility too is extreme, with an average realized annualized volatility of 114%, almost 10 times as much as equites and gold. Yet, bitcoin’s Sharpe ratio is significantly higher than that of other asset classes. And bitcoin’s correlation with other asset classes has been close to zero, suggesting sizeable diversification benefits.
Source: ICE Benchmark Administration Limited, US Bureau of Labor Statistics
Source: Bloomberg, Fred St. Louise Fed, Investing.com & Robeco
Special Topic
All market data to 31 March unless mentioned otherwise

Economy Equities Fixed Income FX Special Topic Heatmap
Theme of the monthBitcoin as digital gold – a multi-asset perspective (II)
4
Global market portfolio: does bitcoin deserve a place?
Allocation trade-off: substituting equity for a bitcoin allocation
> Based on the price of USD 55,000 on 29 March, the market cap of bitcoin is roughly USD 1,000 billion. This translates into a weight of just 0.6% in the Global Multi-Asset Market Portfolio. As we acknowledge bitcoin’s potential as digital gold, we assume it reaches the USD 3 trillion market cap of investable gold somewhere in the next 5 to 10 years. This implies an expected return range of 12%-25% per year.
> To judge the attractiveness of bitcoin in the strategic mix, we use our ‘smart’ mean variance optimization framework in combination with a well-diversified 60/40 portfolio. This framework does not only look at historical data, but also takes into account our ‘5-year Expected Returns’, reducing the risk of extrapolating historical returns. To deal with the relatively high level of uncertainty surrounding bitcoin’s characteristics, we look at 36 different combinations of risk, return and correlation.
> Our results are unambiguous. For all 36 combinations of risk-return-correlation, our smart optimization allocates the maximum 2.5% towards bitcoin. This is better than we anticipated, expecting some drop-off as the combination of characteristics ‘worsens’. In all 36 combinations, the weight of equities decreases; in some cases, the required reduction tops 10%. Under the restriction that the volatility of the portfolio can’t rise, bitcoin’s average share of total risk is more than 6%, rising to as much as 15% in some scenarios.
> Based on our impact analysis, together with the fact that bitcoin’s volatility is currently still well above our highest estimate of 60%, we believe further capping the maximum weight of bitcoin to 1% is warranted. A 1% weight also better aligns with overall portfolio management, including rebalancing.
Source: Robeco
Special Topic
All market data to 31 March unless mentioned otherwise
Source: “The Global Multi-Asser Portfolio, 1959-2012” by Doeswijk, Lam & Swinkels

Economy Equities Fixed Income FX Special Topic Heatmap
United States
5
Prices paid index: rising inflationary pressures
Unemployment rate: improving across all cohorts
> Going into the last Fed meeting there was some speculation that the central bank could signal a change in the hiking path through updated economic projections. This turned out to be unfounded as the path of rate hikes was kept unchanged. What did become clear is that the Fed is positive on the economic outlook. Both inflation and growth expectations were upgraded. The Fed also expects the median-term inflation rate to rise above 2%. Taking the unchanged path for rate hikes into consideration, this means that the Fed is willing to tolerate higher inflation.
> The current rise in interest rates is not seen as a threat to the recovery but as a sign of improving conditions. The rise therefore is not viewed as having an adverse impact on financial conditions. While current financial conditions are generally seen as being supportive, the Fed will continue to be reactive to market conditions.
> The Fed will only tighten policy when there is substantial progress in actual employment and inflation data. With inflation already moving above 2%, and the expectation that this will remain so in the near to mid term, the focus will be on employment.
> The non-farm payrolls new jobs figure for March almost hit a million. The rapid roll-out of the vaccination program is paying off. The positive news was not only the quantity of the job gains, but also the quality of them. Jobs increased across different cohorts of the population and a broad array of sectors. The positive impact of the reopening is also seen in business confidence – both the ISM manufacturing and non-manufacturing ISM readings increased substantially.
Source: Bloomberg, Robeco
Source: US Bureau of Labor Statistics, Robeco
Economy
All market data to 31 March unless mentioned otherwise
%

Economy Equities Fixed Income FX Special Topic Heatmap
Europe
6
Eurozone recovery: economic sentiment is at a 13-month high
Unemployment: little progress has been made
The Eurozone is still in the midst of the third wave of the Covid-19 pandemic. Restrictions remain in place in most European countries and the risk is that these could get stricter. France has already introduced new lockdown measures. The pace of the vaccination roll-out remains disappointing. On top of the already known supply issues, hesitation to use the AstraZeneca vaccine is growing, due to possible side effects.
While this will undoubtfully push forward the full reopening of the economy, this has so far not caused the recovery to stall. The economic sentiment indicator of the European Commission came in at 100.9, a 13-month high. Both purchasing manger indices continue to improve. The manufacturing PMI came in at a staggering 62.5 and non-manufacturing was only slightly below 50. Economic surprise indices are also firmly positive, indicating that the numbers continue to come in above expectations.
We think that current developments around the pandemic will only cause short-term headwinds that will only impact the pace of the recovery. The reason for this optimistic view is that there is still sufficient fiscal support and abundant monetary support in place. The ECB has been very clear that it will do everything it can to ensure that financial conditions remain accommodative. A positive side effect of this policy has been that it helped to weaken the euro over the past period.
While we are positive on the outlook, the slack in the economy remains substantial. This is evident by the slow pace of decline in the unemployment rate.
Economy
Source: Blomberg, Robeco
Source: Refinitiv, Robeco
All market data to 31 March unless mentioned otherwise
Economy Equities Fixed Income FX Special Topic Heatmap
Japan
7
Japanese Tankan: steadily improving conditions for firms
Inflation continues to improve
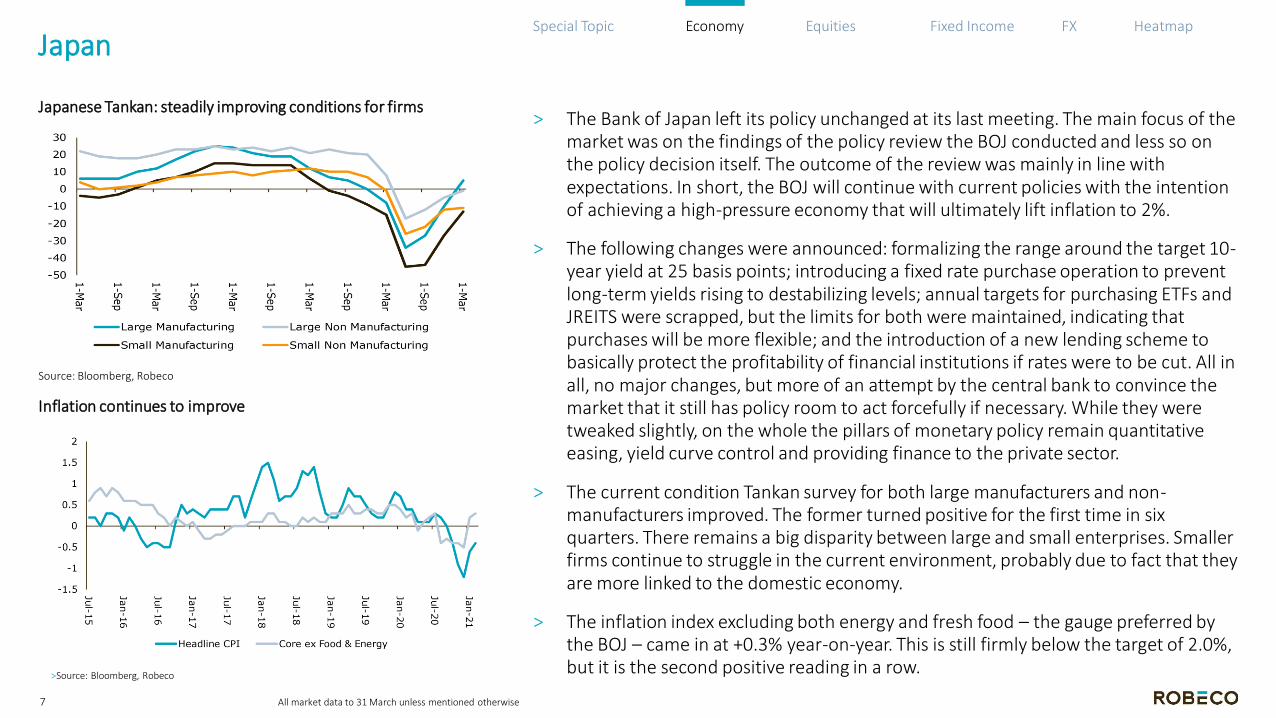
> The Bank of Japan left its policy unchanged at its last meeting. The main focus of the market was on the findings of the policy review the BOJ conducted and less so on the policy decision itself. The outcome of the review was mainly in line with expectations. In short, the BOJ will continue with current policies with the intention of achieving a high-pressure economy that will ultimately lift inflation to 2%.
> The following changes were announced: formalizing the range around the target 10-year yield at 25 basis points; introducing a fixed rate purchase operation to prevent long-term yields rising to destabilizing levels; annual targets for purchasing ETFs and JREITS were scrapped, but the limits for both were maintained, indicating that purchases will be more flexible; and the introduction of a new lending scheme to basically protect the profitability of financial institutions if rates were to be cut. All in all, no major changes, but more of an attempt by the central bank to convince the market that it still has policy room to act forcefully if necessary. While they were tweaked slightly, on the whole the pillars of monetary policy remain quantitative easing, yield curve control and providing finance to the private sector.
> The current condition Tankan survey for both large manufacturers and non-manufacturers improved. The former turned positive for the first time in six quarters. There remains a big disparity between large and small enterprises. Smaller firms continue to struggle in the current environment, probably due to fact that they are more linked to the domestic economy.
> The inflation index excluding both energy and fresh food – the gauge preferred by the BOJ – came in at +0.3% year-on-year. This is still firmly below the target of 2.0%, but it is the second positive reading in a row.
Economy
Source: Bloomberg, Robeco
>Source: Bloomberg, Robeco
All market data to 31 March unless mentioned otherwise

Economy Equities Fixed Income FX Special Topic Heatmap
China
8
Rate hike appetite should be restrained by subdued inflation
Fading pent-up demand from consumer side
> Since China signaled some worries about market bubbles in general, and excesses in its own real estate sector in particular, most Chinese macroeconomic data has come in better than expected. The Caixin Services PMI rose to 54.3 in March, against the 52.1 reading expected. Industrial production and retail sales numbers also were better than expected.
> Chinese exports measured in US dollars rose by more 60% year-on-year in February, underpinning the Covid-19-related base effects that we will see for most macro data in the coming months. The growth number was 20 percentage points higher than expected. A strong recovery in global trade is also one of the reasons why the IMF has lifted its 2021 China GDP growth estimate to a formidable 8.4%. The ongoing stimulus in the US and its effects on global activity are of importance here.
> In recent weeks, comments by Chinese government members suggest that while China will impose curbs in some areas such as housing and credit growth, we are not at the start of a clear tightening cycle.
> Still, the Chinese credit impulse is likely to slow significantly, and affect other countries in the region as well. The credit impulse is also positively correlated with commodity prices. But as we do not expect the impulse to become negative, and as fiscal stimulus in other parts of the world is focused heavily on the real economy, we expect a mitigating effect from here.
> Headline inflation that is currently still in negative territory while core inflation is 1.3% is also now a reason for a stringent tightening cycle. Yet it seems obvious that most of the economic acceleration in China is behind us.
Economy
Source: Caixin, IHS Markit
Source: CEIC, CRU
All market data to 31 March unless mentioned otherwise

Economy Equities Fixed Income FX Special Topic Heatmap
Equities (I)
9
Equities have fully recouped their losses from the pandemic slide
Annual change in SPX coincides strongly with inflation risk
> Positive momentum has been building in equity markets in the last couple of months, with March seeing generous returns of 6.7% for the MSCI World index (unhedged in euros). With the global economy now in the third month of expansion, according to our scenario analysis monitor, and inflationary pressures building due to supply side bottlenecks, cheap assets with inflation hedging capabilities did well. Value stocks and financials that benefit from steepening yield curves experienced strong tailwinds. In regional terms, this translated into large gains for core and peripheral Eurozone countries, with German equities gaining 8.9% in March. European equities were the last region apart from frontier markets to recoup the losses that emerged after the pre-pandemic peak of 19 February 2020.
> With the laggards having now recouped the losses from the Covid-19 recession, the question is how much upside is left. We believe that the reflation trade has somewhat further to run. We prefer to play this from a regional angle rather than an outright overweight in equities. Our cautious approach is inspired by the observation that the equity market is exhibiting late-cycle characteristics such as elevated sentiment, stretched valuation levels, high leverage (margin debt) and the occasional hedge fund or family office getting in trouble as we have seen in the case of Archegos. While the economic expansion is still in its infancy, the equity market has already heavily discounted the future, spurred by unprecedented levels of monetary and fiscal stimulus. The Fed has indicated it will not raise rates as long as specific unemployment targets are met, thereby indicating that it is willing to run the economy hot in the interim. From the fiscal side, the USD 2.25 trillion American Jobs plan is yet another boost for the global economy, and not only the US.
Equities
Source: Refinitiv, Robeco
All market data to 31 March unless mentioned otherwise
Source: Refinitiv,Robeco

Economy Equities Fixed Income FX Special Topic Heatmap
Equities (II)
10
High yield spread is below the US equity risk premium
A very high-risk appetite among retail investors
> To some extent, this late-cycle behavior is understandable. As JP Morgan CEO Jamie Dimon wrote in his annual shareholder letter, the US could be booming for the next few years thanks to excess savings, huge deficit spending, more QE, the potential infrastructure bill, a successful vaccine and euphoria around about the end of the pandemic. From a portfolio construction perspective, the ‘There Is No Alternative’ force is still very much with us. Equities are not only attractive compared to sovereign bonds, but also compared to high yield.
> However, by now, investors have had ample time to digest these positive elements. What is much less discussed is how the stimulus will actually be paid for. The reversal of the Trump 2016 corporate tax cuts to fund the American Jobs plan could give investors some jitters.
> The current extremely high-risk appetite could increase the misallocation of capital, which could lead to another round of idiosyncratic risk events like the Archegos firesale. The reflation trade could enter a consolidation period after a steep repricing of real assets in which the cheap laggards have been scooped up. This could lead to an increased focus of market participants on balance sheet quality.
> For now, seasonality is still positive, and with the IMF lately raising its global GDP growth forecast for 2021 and 2022, the reflation theme still has favorable winds blowing into its sails. We are now neutral on equities, but within our regional equity allocation we have a strong preference for relatively cheap, high-beta regions such as Japan and Europa at the expense of the more duration sensitive and expensive regions like the US.
Equities
Source: Shiller, Robeco
Source: Refinitiv, Robeco
All market data to 31 March unless mentioned otherwise

Economy Equities Fixed Income FX Special Topic Heatmap
Emerging Equities
11
IMF: global growth and divergence
Emerging market equities: relative valuation
> Emerging market equities rose 1.7% in March. While the return was positive, the underperformance of the asset class relative to developed markets was significant at 5%. Since the start of the year, however, emerging markets are still marginally ahead of their developed counterparts. We closed our overweight in emerging markets equities back in February.
> A couple of factors prevent emerging markets from outperforming in the short term, we believe. First, while global growth will be very strong this year and next, as shown in the IMF chart on the top left, the growth differential between EM and DM is below average. This has to do with both the extraordinary fiscal stimulus in developed countries, as well as the longer-lasting impact of Covid-19 in emerging markets. Ex-China, which is expected to grow by 8.4%, growth is pretty much the same. Historically, larger and growing GDP growth differentials have benefited EM.
> Next to that, both the strengthening of the US dollar and higher bond yields put pressure on the relative performance of EM, as this tightens financial conditions. In addition, the rise in the US dollar also halted the rally in commodities, to which EM equities are more vulnerable.
> We do expect emerging market equities to profit from their relatively high operational leverage as global growth picks up. Also, valuation of the asset class is still reasonable from both an absolute as relative view. Yet other segments of the markets, like European equities, are more attractively valued.
> We remain neutral on emerging markets.
Equities
Source: IMF
Source: Refinitiv, Robeco
All market data to 31 March unless mentioned otherwise

Economy Equities Fixed Income FX Special Topic Heatmap
AAA Bonds (I)
12
10-year yields: a difficult quarter for bonds
Unemployment: The Fed looking for a substantial decline
> It has been a tough quarter for bonds. Yields were pressured higher across the board as the bond market finally started to reprice the better economic outlook. The main pressure was felt in the longer maturities as central banks continue to hold a strong grip on the shorter maturities through forward guidance. We expect the majority of major central banks not to raise rates anytime soon.
> The Fed expects unemployment to reach 4.5% by the end of the year, more than 1.5% percentage point below the current level. Bringing unemployment down by that much in a relatively short time by itself is a challenge. But the bar is being set even higher, as the Fed doesn’t only want to lower the level, but also to accomplish this with a higher participation rate. The latter goal achieves the broader and more inclusive employment mandate the Fed currently has. It does mean we will need substantial increases in non-farm payroll new jobs (on average more than 500,000) over the coming period if the unemployment target is to be reached.
> The rapid roll-out of vaccinations does indeed open the door for a rapid increase in employment, as it enables the return of in-person service jobs, a part of the market that has been hit extremely hard by the pandemic. Still, we find it difficult to see that the Fed will change anything in its policy setting anytime soon.
> It is becoming increasingly clear that the Fed has a strong preference to run the economy hot. In its latest economic projections, the median expectation is that unemployment will dip below its long run level in 2023, but that this will not trigger a rate hike .
Fixed Income
Source: Bloomberg & Robeco
>Source: Bloomberg & Robeco
All market data to 31 March unless mentioned otherwise
6.0%
3.5% 4.5%
Fed target for Q42021
Economy Equities Fixed Income FX Special Topic Heatmap
AAA Bonds (II)
13
Inflation expectations are still anchored
GDP growth: strong growth in 2021 is expected globally
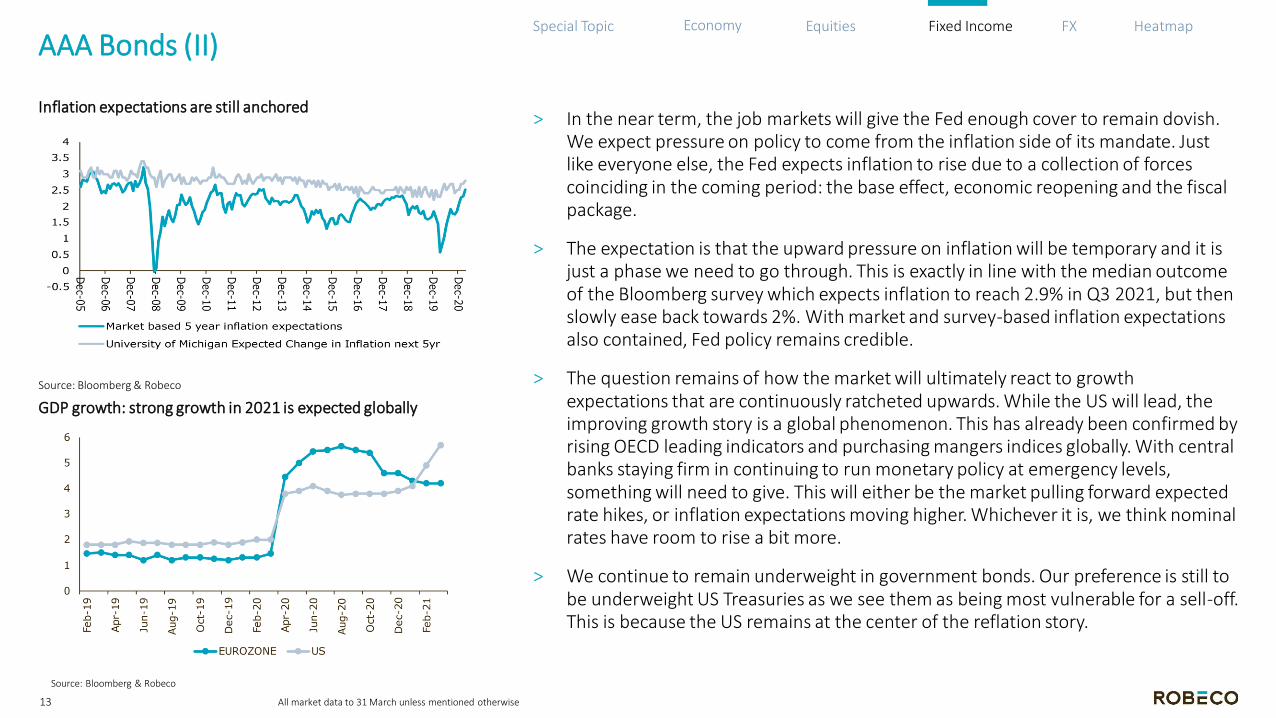
> In the near term, the job markets will give the Fed enough cover to remain dovish. We expect pressure on policy to come from the inflation side of its mandate. Just like everyone else, the Fed expects inflation to rise due to a collection of forces coinciding in the coming period: the base effect, economic reopening and the fiscal package.
> The expectation is that the upward pressure on inflation will be temporary and it is just a phase we need to go through. This is exactly in line with the median outcome of the Bloomberg survey which expects inflation to reach 2.9% in Q3 2021, but then slowly ease back towards 2%. With market and survey-based inflation expectations also contained, Fed policy remains credible.
> The question remains of how the market will ultimately react to growth expectations that are continuously ratcheted upwards. While the US will lead, the improving growth story is a global phenomenon. This has already been confirmed by rising OECD leading indicators and purchasing mangers indices globally. With central banks staying firm in continuing to run monetary policy at emergency levels, something will need to give. This will either be the market pulling forward expected rate hikes, or inflation expectations moving higher. Whichever it is, we think nominal rates have room to rise a bit more.
> We continue to remain underweight in government bonds. Our preference is still to be underweight US Treasuries as we see them as being most vulnerable for a sell-off. This is because the US remains at the center of the reflation story.
Fixed Income
Source: Bloomberg & Robeco
Source: Bloomberg & Robeco
All market data to 31 March unless mentioned otherwise

Economy Equities Fixed Income FX Special Topic Heatmap
Investment Grade Credits
14
Investment grade credits: spreads
Investment grade credits: duration
> After a poor February, investment grade bonds had another tough month, realizing a negative return of 1.1%. As a result, corporate bonds were the worst-performing asset class in March. Since the start of the year, corporate bonds are down 3.5%. Spreads were unchanged at 95 basis points.
> The outlook for global investment grade credits remains negative compared to other asset classes. Duration of corporate bonds, which in the US is even higher than for government bonds, remains the main reason for that. With stimulus ongoing, again especially in the US where President Biden aims for another big package, risks of higher inflation and higher bonds yields are real.
> As mentioned before, duration is much lower in Europe. We do believe, however, that bond yields will start to rise here also. The fiscal impulse, while less eye-catching and more fragmented than in the US, is quite formidable as well. In addition, yields are still extremely low, with the average yield-to-worst at just 0.35% at the end of March. The provides little buffer for any increase in bond yields
> While we don’t expect spreads to hit the lows of 2004, a bit more tightening is on the horizon. Continuous upward revisions of global GDP growth and ample amounts of liquidity could push spreads down even further. This, however, provides little buffer against rising bond yields.
> We remain underweight global investment grade credits as we expect bond yields to continue their increase, with current spread levels offering little buffer.
Fixed Income
Source: Bloomberg & Robeco
Source: Bloomberg & Robeco
All market data to 31 March unless mentioned otherwise

Economy Equities Fixed Income FX Special Topic Heatmap
High Yield
15
Global high yield: relative spread level versus global credits
Global high yield: issuance
> Global high yield bonds realized a negative return of 0.4% in March, matching the performance of global government bonds, but outperforming both investment grade bonds as well as local currency emerging market debt. The spread was virtually unchanged at 380 basis points.
> Last month was a good reflection of the fact that high yield bonds exhibit both bond-like as well as equity-like characteristics. In March, the former dominated the latter, and rising bond yields hurt performance.
> Yet with a spread of 380 basis points, the buffer is much bigger compared to investment grade corporate bonds, which also come with much higher duration. With economic growth prospects revised upward again, and even more stimulus on the way, especially in the US, the odds of some further spread tightening has increased. This is a small change from our stance in previous months.
> At the same time, our conviction that bond yields will continue to go up has also increased, and as the March returns show, high yield bonds are not immune from such a development.
> In addition, high yield bond issuance is at record levels. While most of that is related to refinancings, corporate leverage is increasing. With GDP growth set to explode, we do not think issuance and/or leverage pose imminent danger, but we are tracking developments in this area.
> We hold on to our neutral stance on high yield bonds for now.
Fixed Income
Source: Bloomberg & Robeco
>Source: Bloomberg
All market data to 31 March unless mentioned otherwise

Economy Equities Fixed Income FX Special Topic Heatmap
Emerging Market Debt
16
Emerging market debt in local currency: spread and yield
Emerging market currencies against the euro
> Local currency emerging market bonds realized a negative of return of 1.1% in March. Together with investment grade bonds, EM bonds were the worst-performing asset class. As you can see in the chart on the top left, bond yields continued to rise globally, negatively impacting the return on local currency EM bonds. The spread relative to 5-year US Treasuries was little changed.
> We closed our small overweight in local currency bonds in March. An important reason for this is an increase in conviction that global bond yields can go higher from here. While duration at just over five years is much lower than for developed government bonds and US corporate bonds, rising bond yields will also be a headwind for EM bonds. With monetary stimulus less explicit than in most developed markets, there is also less ‘weight’ keeping bond yields low.
> Most emerging currencies gained relative to the euro, but this was mostly euro-related. Volatility remains elevated and idiosyncratic risks remain abundant, with Brazil clearly behind on the path to reopening, and political risks still an issue in Turkey. As the chart on bottom left reveals, the Turkish lira was the worst performing major emerging currency, dropping as much as 7% against the euro in March.
> We do think, however, that emerging currencies offer some upside as the global recovery takes hold and carry trades can come back into play. Also, investors tend to discriminate less between EM countries when sentiment is buoyant.
> We are neutral on local currency emerging market bonds.
Fixed Income
Source: Bloomberg & Robeco
Source: Refinitiv, Robeco
All market data to 31 March unless mentioned otherwise

Economy Equities Fixed Income FX Special Topic Heatmap
FX (I)
17
G-10 currencies: the Norwegian krona was the strongest
2-year rates: currencies that offer carry mostly did well
> It is difficult to find a general driver of G-10 currencies for March. Both the weakest and the strongest performers are so-called commodity currencies. The euro strengthened against some safe haven and commodity currencies and weakened against others. The progress of vaccinations doesn’t seem to have been a major differentiating factor in March. The currencies of developed market countries that have led the way when it comes to vaccinations, such as the British pound and US dollar, have not been the strongest performers.
> What does seem to have been a driver is interest rate differentials. The weakest currencies offer less carry than the strongest. The odd one out on here is the New Zealand dollar, which has one of the highest yields, but was the weakest within the G-10 in March. This weakness was triggered by market participants toning down rate hike expectations. The market had expected the New Zealand central bank to hike rates to cool down the housing market, but this was not necessary following action by the government to do it instead.
> A general observation that can be made is that the narrative has changed, and the US dollar is no longer seen as a consensus short. The driver of this change in sentiment is an increasing growth differential in favor of the US. The Biden administration is having a firm impact on growth, not only through the substantial fiscal package that has been approved, but also from rapidly vaccinating a substantial part of the US population.
FX
Source: Bloomberg, Robeco
Source: Bloomberg, Robeco
All market data to 31 March unless mentioned otherwise
Economy Equities Fixed Income FX Special Topic Heatmap
FX (II)
18
The percentage of the population that received at least one vaccine dose
5Y real rates continue to move in favor of the USD
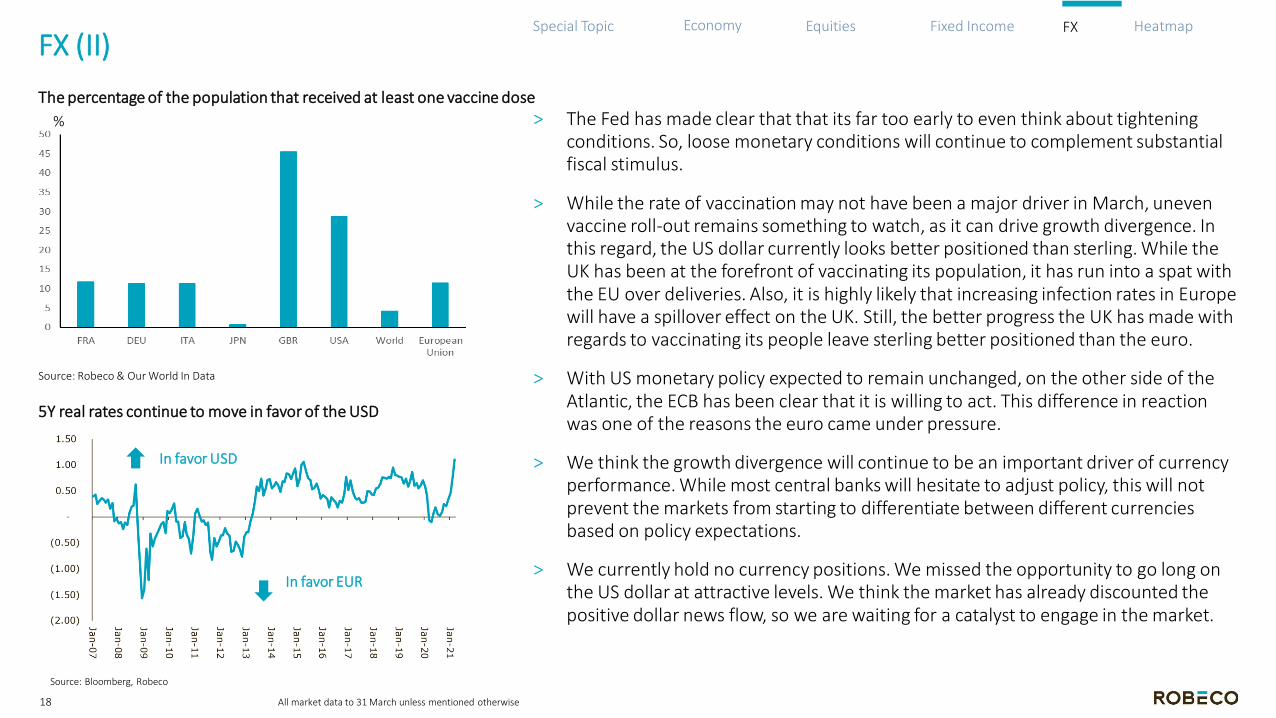
> The Fed has made clear that that its far too early to even think about tightening conditions. So, loose monetary conditions will continue to complement substantial fiscal stimulus.
> While the rate of vaccination may not have been a major driver in March, uneven vaccine roll-out remains something to watch, as it can drive growth divergence. In this regard, the US dollar currently looks better positioned than sterling. While the UK has been at the forefront of vaccinating its population, it has run into a spat with the EU over deliveries. Also, it is highly likely that increasing infection rates in Europe will have a spillover effect on the UK. Still, the better progress the UK has made with regards to vaccinating its people leave sterling better positioned than the euro.
> With US monetary policy expected to remain unchanged, on the other side of the Atlantic, the ECB has been clear that it is willing to act. This difference in reaction was one of the reasons the euro came under pressure.
> We think the growth divergence will continue to be an important driver of currency performance. While most central banks will hesitate to adjust policy, this will not prevent the markets from starting to differentiate between different currencies based on policy expectations.
> We currently hold no currency positions. We missed the opportunity to go long on the US dollar at attractive levels. We think the market has already discounted the positive dollar news flow, so we are waiting for a catalyst to engage in the market.
FX
Source: Robeco & Our World In Data
Source: Bloomberg, Robeco
All market data to 31 March unless mentioned otherwise
%
In favor EUR
In favor USD

Economy Equities Fixed Income FX Special Topic HeatmapHeat Map Asset Returns (in euros)
19
Heatmap
All market data to 31 March unless mentioned otherwise
Source: Bloomberg

Important Information
Robeco Institutional Asset Management B.V. has a license as manager of Undertakings for Collective Investment in Transferable Securities (UCITS) and Alternative Investment Funds (AIFs) (“Fund(s)”) from The Netherlands Authority for the Financial Markets in Amsterdam. This marketing document is solely intended for professional investors, defined as investors qualifying as professional clients, have requested to be treated as professional clients or are authorized to receive such information under any applicable laws. Robeco Institutional Asset Management B.V and/or its related, affiliated and subsidiary companies, (“Robeco”), will not be liable for any damages arising out of the use of this document. Users of this information who provide investment services in the European Union have their own responsibility to assess whether they are allowed to receive the information in accordance with MiFID II regulations. To the extent this information qualifies as a reasonable and appropriate minor non-monetary benefit under MiFID II, users that provide investment services in the European Union are responsible to comply with applicable recordkeeping and disclosure requirements. The content of this document is based upon sources of information believed to be reliable and comes without warranties of any kind. Without further explanation this document cannot be considered complete. Any opinions, estimates or forecasts may be changed at any time without prior warning. If in doubt, please seek independent advice. It is intended to provide the professional investor with general information on Robeco’s specific capabilities, but has not been prepared by Robeco as investment research and does not constitute an investment recommendation or advice to buy or sell certain securities or investment products and/or to adopt any investment strategy and/or legal, accounting or tax advice. All rights relating to the information in this document are and will remain the property of Robeco. This material may not be copied or used with the public. No part of this document may be reproduced, or published in any form or by any means without Robeco's prior written permission. Investment involves risks. Before investing, please note the initial capital is not guaranteed. Investors should ensure that they fully understand the risk associated with any Robeco product or service offered in their country of domicile. Investors should also consider their own investment objective and risk tolerance level. Historical returns are provided for illustrative purposes only. The price of units may go down as well as up and the past performance is not indicative of future performance. If the currency in which the past performance is displayed differs from the currency of the country in which you reside, then you should be aware that due to exchange rate fluctuations the performance shown may increase or decrease if converted into your local currency. The performance data do not take account of the commissions and costs incurred on trading securities in client portfolios or on the issue and redemption of units. Unless otherwise stated, the prices used for the performance figures of the Luxembourg-based Funds are the end-of-month transaction prices net of fees up to 4 August 2010. From 4 August 2010, the transaction prices net of fees will be those of the first business day of the month. Return figures versus the benchmark show the investment management result before management and/or performance fees; the Fund returns are with dividends reinvested and based on net asset values with prices and exchange rates of the valuation moment of the benchmark. Please refer to the prospectus of the Funds for further details. Performance is quoted net of investment management fees. The ongoing charges mentioned in this document are the ones stated in the Fund's latest annual report at closing date of the last calendar year. This document is not directed to, or intended for
distribution to or use by any person or entity who is a citizen or resident of or located in any locality, state, country or other jurisdiction where such distribution, document, availability or use would be contrary to law or regulation or which would subject any Fund or Robeco Institutional Asset Management B.V. to any registration or licensing requirement within such jurisdiction. Any decision to subscribe for interests in a Fund offered in a particular jurisdiction must be made solely on the basis of information contained in the prospectus, which information may be different from the information contained in this document. Prospective applicants for shares should inform themselves as to legal requirements also applying and any applicable exchange control regulations and applicable taxes in the countries of their respective citizenship, residence or domicile. The Fund information, if any, contained in this document is qualified in its entirety by reference to the prospectus, and this document should, at all times, be read in conjunction with the prospectus. Detailed information on the Fund and associated risks is contained in the prospectus. The prospectus and the Key Investor Information Document for the Robeco Funds can all be obtained free of charge at www.robeco.com.
Additional Information for US investors
Robeco is considered “participating affiliated” and some of their employees are “associated persons” of Robeco Institutional Asset Management US Inc. (“RIAM US”) as per relevant SEC no-action guidance. Employees identified as associated persons of RIAM US perform activities directly or indirectly related to the investment advisory services provided by RIAM US. In those situation these individuals are deemed to be acting on behalf of RIAM US, a US SEC registered investment adviser. SEC regulations are applicable only to clients, prospects and investors of RIAM US. RIAM US is wholly owned subsidiary of ORIX Corporation Europe N.V. and offers investment advisory services to institutional clients in the US.
Additional Information for investors with residence or seat in Australia and New Zealand
This document is distributed in Australia by Robeco Hong Kong Limited (ARBN 156 512 659) (“Robeco”), which is exempt from the requirement to hold an Australian financial services license under the Corporations Act 2001 (Cth) pursuant to ASIC Class Order 03/1103. Robeco is regulated by the Securities and Futures Commission under the laws of Hong Kong and those laws may differ from Australian laws. This document is distributed only to “wholesale clients” as that term is defined under the Corporations Act 2001 (Cth). This document is not for distribution or dissemination, directly or indirectly, to any other class of persons. In New Zealand, this document is only available to wholesale investors within the meaning of clause 3(2) of Schedule 1 of the Financial Markets Conduct Act 2013 (‘FMCA’). This document is not for public distribution in Australia and New Zealand.
Additional Information for investors with residence or seat in Austria
This information is solely intended for professional investors or eligible counterparties in the meaning of the Austrian Securities Oversight Act.
20
Important information

Additional Information for investors with residence or seat in Brazil
The Fund may not be offered or sold to the public in Brazil. Accordingly, the Fund has not been nor will be registered with the Brazilian Securities Commission – CVM, nor has it been submitted to the foregoing agency for approval. Documents relating to the Fund, as well as the information contained therein, may not be supplied to the public in Brazil, as the offering of the Fund is not a public offering of securities in Brazil, nor may they be used in connection with any offer for subscription or sale of securities to the public in Brazil.
Additional Information for investors with residence or seat in Canada
No securities commission or similar authority in Canada has reviewed or in any way passed upon this document or the merits of the securities described herein, and any representation to the contrary is an offence. Robeco Institutional Asset Management B.V. is relying on the international dealer and international adviser exemption in Quebec and has appointed McCarthy Tétrault LLP as its agent for service in Quebec.
Additional information for investors with residence or seat in the Republic of Chile
Neither the issuer nor the Funds have been registered with the Superintendencia de Valores y Seguros pursuant to law no. 18.045, the Ley de Mercado de Valores and regulations thereunder. This document does not constitute an offer of, or an invitation to subscribe for or purchase, shares of the Funds in the Republic of Chile, other than to the specific person who individually requested this information on his own initiative. This may therefore be treated as a “private offering” within the meaning of article 4 of the Ley de Mercado de Valores (an offer that is not addressed to the public at large or to a certain sector or specific group of the public).
Additional Information for investors with residence or seat in Colombia
This document does not constitute a public offer in the Republic of Colombia. The offer of the Fund is addressed to less than one hundred specifically identified investors. The Fund may not be promoted or marketed in Colombia or to Colombian residents, unless such promotion and marketing is made in compliance with Decree 2555 of 2010 and other applicable rules and regulations related to the promotion of foreign Funds in Colombia.
Additional Information for investors with residence or seat in the Dubai International Financial Centre (DIFC), United Arab Emirates
This material is being distributed by Robeco Institutional Asset Management B.V. (DIFC Branch) located at Office 209, Level 2, Gate Village Building 7, Dubai International Financial Centre, Dubai, PO Box 482060, UAE. Robeco Institutional Asset Management B.V. (DIFC Branch) is regulated by the Dubai Financial Services Authority (“DFSA”) and only deals with Professional Clients or Market Counterparties and does not deal with Retail Clients as defined by the DFSA.
Additional Information for investors with residence or seat in France
Robeco is at liberty to provide services in France. Robeco France (only authorized to offer investment advice service to professional investors) has been approved under registry number 10683 by the French prudential control and resolution authority (formerly ACP, now the ACPR) as an investment firm since 28 September 2012.
Additional Information for investors with residence or seat in Germany
This information is solely intended for professional investors or eligible counterparties in the meaning of the German Securities Trading Act.
Additional Information for investors with residence or seat in Hong Kong
The contents of this document have not been reviewed by the Securities and Futures Commission (“SFC”) in Hong Kong. If you are in any doubt about any of the contents of this document, you should obtain independent professional advice. This document has been distributed by Robeco Hong Kong Limited (“Robeco”). Robeco is regulated by the SFC in Hong Kong.
Additional Information for investors with residence or seat in Italy
This document is considered for use solely by qualified investors and private professional clients (as defined in Article 26 (1) (b) and (d) of Consob Regulation No. 16190 dated 29 October 2007). If made available to Distributors and individuals authorized by Distributors to conduct promotion and marketing activity, it may only be used for the purpose for which it was conceived. The data and information contained in this document may not be used for communications with Supervisory Authorities. This document does not include any information to determine, in concrete terms, the investment inclination and, therefore, this document cannot and should not be the basis for making any investment decisions.
Additional Information for investors with residence or seat in Japan
This documents are considered for use solely by qualified investors and are being distributed by Robeco Japan Company Limited, registered in Japan as a Financial Instruments Business Operator, [registered No. the Director of Kanto Local Financial Bureau (Financial Instruments Business Operator), No, 2780, Member of Japan Investment Advisors Association].
Additional Information for investors with residence or seat in Peru
The Fund has not been registered with the Superintendencia del Mercado de Valores (SMV) and is being placed by means of a private offer. SMV has not reviewed the information provided to the investor. This document is only for the exclusive use of institutional investors in Peru and is not for public distribution .
Additional Information for investors with residence or seat in Shanghai
This material is prepared by Robeco Overseas Investment Fund Management (Shanghai) Limited Company (“Robeco Shanghai”) and is only provided to the specific objects under the premise of confidentiality. Robeco Shanghai has not yet been registered as a private fund manager with the Asset Management Association of China. Robeco Shanghai is a wholly foreign-owned enterprise established in accordance with the PRC laws, which enjoys independent civil rights and civil obligations. The statements of the shareholders or affiliates in the material shall not be deemed to a promise or guarantee of the shareholders or affiliates of Robeco Shanghai, or be deemed to any obligations or liabilities imposed to the shareholders or affiliates of Robeco Shanghai.
21

Additional Information for investors with residence or seat in Singapore
This document has not been registered with the Monetary Authority of Singapore (“MAS”). Accordingly, this document may not be circulated or distributed directly or indirectly to persons in Singapore other than (i) to an institutional investor under Section 304 of the SFA, (ii) to a relevant person pursuant to Section 305(1), or any person pursuant to Section 305(2), and in accordance with the conditions specified in Section 305, of the SFA, or (iii) otherwise pursuant to, and in accordance with the conditions of, any other applicable provision of the SFA. The contents of this document have not been reviewed by the MAS. Any decision to participate in the Fund should be made only after reviewing the sections regarding investment considerations, conflicts of interest, risk factors and the relevant Singapore selling restrictions (as described in the section entitled “Important Information for Singapore Investors”) contained in the prospectus. You should consult your professional adviser if you are in doubt about the stringent restrictions applicable to the use of this document, regulatory status of the Fund, applicable regulatory protection, associated risks and suitability of the Fund to your objectives. Investors should note that only the sub-Funds listed in the appendix to the section entitled “Important Information for Singapore Investors” of the prospectus (“Sub-Funds”) are available to Singapore investors. The Sub-Funds are notified as restricted foreign schemes under the Securities and Futures Act, Chapter 289 of Singapore (“SFA”) and are invoking the exemptions from compliance with prospectus registration requirements pursuant to the exemptions under Section 304 and Section 305 of the SFA. The Sub-Funds are not authorized or recognized by the MAS and shares in the Sub-Funds are not allowed to be offered to the retail public in Singapore. The prospectus of the Fund is not a prospectus as defined in the SFA. Accordingly, statutory liability under the SFA in relation to the content of prospectuses would not apply. The Sub-Funds may only be promoted exclusively to persons who are sufficiently experienced and sophisticated to understand the risks involved in investing in such schemes, and who satisfy certain other criteria provided under Section 304, Section 305 or any other applicable provision of the SFA and the subsidiary legislation enacted thereunder. You should consider carefully whether the investment is suitable for you. Robeco Singapore Private Limited holds a capital markets services license for fund management issued by the MAS and is subject to certain clientele restrictions under such license.
Additional Information for investors with residence or seat in Spain
Robeco Institutional Asset Management BV, Branch in Spain is registered in Spain in the Commercial Registry of Madrid, in v.19.957, page 190, section 8, page M-351927 and in the Official Register of the National Securities Market Commission of branches of companies of services of investment of the European Economic Space, with the number 24. It has address in Street Serrano 47, Madrid and CIF W0032687F. The investment funds or SICAV mentioned in this document are regulated by the corresponding authorities of their country of origin and are registered in the Special Registry of the CNMV of Foreign Collective Investment Institutions marketed in Spain.
Additional Information for investors with residence or seat in South Africa
Robeco Institutional Asset Management B.V is registered and regulated by the Financial Sector Conduct Authority in South Africa.
Additional Information for investors with residence or seat in Switzerland
The Fund(s) are domiciled in Luxembourg. This document is exclusively distributed in Switzerland to qualified investors as defined in the Swiss Collective Investment Schemes Act (CISA). This material is distributed by Robeco Switzerland Ltd, postal address: Josefstrasse 218, 8005 Zurich. ACOLIN Fund Services AG, postal address: Affolternstrasse 56, 8050 Zürich, acts as the Swiss representative of the Fund(s). UBS Switzerland AG, Bahnhofstrasse 45, 8001 Zurich, postal address: Europastrasse 2, P.O. Box, CH -8152
Opfikon, acts as the Swiss paying agent. The prospectus, the Key Investor Information Documents (KIIDs), the articles of association, the annual and semi-annual reports of the Fund(s), as well as the list of the purchases and sales which the Fund(s) has undertaken during the financial year, may be obtained, on simple request and free of charge, at the office of the Swiss representative ACOLIN Fund Services AG. The prospectuses are also available via the website www.robeco.ch.
Additional Information relating to RobecoSAM-branded funds / services
Robeco Switzerland Ltd, postal address Josefstrasse 218, 8005 Zurich, Switzerland has a license as asset manager of collective assets from the Swiss Financial Market Supervisory Authority FINMA. RobecoSAM -branded financial instruments and investment strategies referring to such financial instruments are generally managed by Robeco Switzerland Ltd. The RobecoSAM brand is a registered trademark of Robeco Holding B.V. The brand RobecoSAM is used to market services and products which do entail Robeco’s expertise on Sustainable Investing (SI). The brand RobecoSAM is not to be considered as a separate legal entity.
Additional Information for investors with residence or seat in Liechtenstein
This document is exclusively distributed to Liechtenstein-based duly licensed financial intermediaries (such as e.g. banks, discretionary portfolio managers, insurance companies, fund of funds, etc.) which do not intend to invest on their own account into Fund(s) displayed in the document. This material is distributed by Robeco Switzerland Ltd, postal address: Josefstrasse 218, 8005 Zurich, Switzerland. LGT Bank Ltd., Herrengasse 12, FL-9490 Vaduz, Liechtenstein acts as the representative and paying agent in Liechtenstein. The prospectus, the Key Investor Information Documents (KIIDs), the articles of association, the annual and semi-annual reports of the Fund(s) may be obtained from the representative or via the website wwww.robeco.ch
Additional Information for investors with residence or seat in the United Arab Emirates
Some Funds referred to in this marketing material have been registered with the UAE Securities and Commodities Authority (the Authority). Details of all Registered Funds can be found on the Authority’s website. The Authority assumes no liability for the accuracy of the information set out in this material/document, nor for the failure of any persons engaged in the investment Fund in performing their duties and responsibilities.
Additional Information for investors with residence or seat in the United Kingdom
Robeco is subject to limited regulation in the UK by the Financial Conduct Authority. Details about the extent of our regulation by the Financial Conduct Authority are available from us on request.
Additional Information for investors with residence or seat in Uruguay
The sale of the Fund qualifies as a private placement pursuant to section 2 of Uruguayan law 18,627. The Fund must not be offered or sold to the public in Uruguay, except in circumstances which do not constitute a public offering or distribution under Uruguayan laws and regulations. The Fund is not and will not be registered with the Financial Services Superintendency of the Central Bank of Uruguay. The Fund corresponds to investment funds that are not investment funds regulated by Uruguayan law 16,774 dated September 27, 1996, as amended.
© 11.2020 Robeco22