fourth quarter 2017 market outlook & asset allocation
TRANSCRIPT

© 2017 Cliffwater LLC. All rights reserved. Page 1 For institutional/wholesale/professional clients and qualified investors only – not for retail use or distribution.
Fourth Quarter 2017 Market Outlook & Asset Allocation
Economy The Rest-of-the-World appeared to wake up in the third quarter to report modest but positive growth. Europe, in particular, saw virtually all its members report growth rates above 1%, a welcome surprise against its no growth trend of the last several years. Canada is also rebounding strongly from its recent energy-induced sluggishness, and reported a very good 3.8% growth rate over the last year. But Brexit seems to be having a significant negative impact on the U.K. One of the few countries to engineer a strong post-Crisis rebound, along with the U.S., the U.K. growth rate sunk to 1.7% over the last year, well below its earlier growth rate.
Global monetary policy remains accommodative across the major country markets. This can be seen in the negative inflation-adjusted short-term interest rates below. The U.K., concerned over the possibility of a Brexit recession, is among the most aggressive in stimulating its economy despite inflationary pressure from a depressed currency.
In the U.S., one of the best performing developed economies, growth remains modest.
Modest economic growth does not seem to have resulted in a slowdown of corporate earnings. As we report later, S&P 500 earnings grew 16% year-over-year in the second quarter, driven by a rebound in energy sector earnings. With a stronger Europe and consistent U.S. earnings growth, the rally in global stocks has some fundamental backing and could persist if growth and earnings trends continue. Public Markets Asset class returns for the first three-quarters of 2017 are reported below. Common stocks continue to outperform other asset classes, with non-U.S. markets leading the way.
The strong performance of the non-U.S. markets is consistent with our tactical models which have identified both EAFE and emerging markets as historically cheap relative to U.S. stocks.
90
95
100
105
110
115
120
125
130
Cum
ulative Real G
DP Growth
G‐7 Real GDP Growth(June 2008 to June 2017)
(1 year annualized growth shown in parentheses)
2.5% Growth
Canada (3.8%)
USA (2.2%)
UK (1.7%)
Germany (2.0%)
Japan (1.6%)
France (1.3%)
Italy (1.2%)
Source: Bloomberg
‐5.0%
‐4.0%
‐3.0%
‐2.0%
‐1.0%
0.0%
1.0%
2.0%
3.0%
Real Interest Rate
Three Month Inflation‐Adjusted Interest Rates(Dec 2009 to August 2017)
Japan
Canada
United States
France
Italy
Germany
United Kingdom
Source: Bloomberg
‐10.0%
‐8.0%
‐6.0%
‐4.0%
‐2.0%
0.0%
2.0%
4.0%
6.0%
8.0%
10.0%U.S. Real GDP
Quarterly, 1995 ‐Q2 2017
Real Quarterly GDP
Pre Crisis 1996‐2006 Average
Post Crisis 2010‐2016 Average
3.3% 2.1%
Q2 2017: 3.1%
27.8%
20.0%17.3%
13.9%
9.0%7.0% 6.0% 5.5% 4.5% 4.0% 3.1% 3.0% 2.7% 2.0%
‐3.8%‐5.6%
‐8.9%
Public Markets and Hedge Funds Returns Calendar Year‐to‐Date Through September 30, 2017
Sources: MSCI, FTSE/Russell, Bloomberg, Bloomberg Barclays, J.P. Morgan, S&P/LSTA, Alerian, FTSE/NAREIT, HFRI

Cliffwater Fourth Quarter 2017 Asset Allocation Outlook Page 2 of 12 For institutional/wholesale/professional clients and qualified investors only – not for retail use or distribution.
Credit related asset classes have also performed at or above expectations, driving spreads lower. Energy stocks (particularly MLPs) and oil remain with
negative returns for the year, and the dollar continues to decline.
Cliffwater Expected (10 year) Returns for Major Asset Classes1
1 The terms “expected return” and “return forecast” are used interchangeably throughout the report. There can be no assurance that any expected rates of return or risk will be achieved. Expected rates of return and risk may be based upon assumptions regarding future events and conditions that prove to be inaccurate. Expected rates of return and risk should not be relied upon as an indication of future performance and should not form the primary basis for an investment decision. The index returns are provided for information only. Reference to an index does not imply that a portfolio will achieve returns, volatility, or other results similar to the index. Please see additional disclosures at the end of the report.
Oct 1,
2017
July 1,
2017
QoQ
Change Benchmark Index
StocksU.S. Stock 6.60 6.60 0.00 4.6% Russell 3000Non-U.S. Developed 6.60 6.60 0.00 5.4% MSCI EAFEEmerging Markets 7.60 7.60 0.00 7.9% MSCI EMGlobal Equity 6.80 6.80 0.00 5.2% MSCI ACWI
RatesCore U.S. Bonds 2.55 2.55 0.00 0.9% Bloomberg Barclays U.S. Aggregate BondIG Corporate 3.15 3.20 -0.05 1.3% Bloomberg Barclays U.S. Corporate Bond10-yr Treasury 2.35 2.30 0.05 0.4% Bloomberg Barclays 10y U.S. Treasury10-yr TIPS 2.35 2.30 0.05 0.9% Bloomberg Barclays 5-10y U.S. TIPS
CreditHigh Yield Bonds 5.05 5.15 -0.10 2.0% Bloomberg Barclays U.S. High Yield BondBank Loans 5.05 5.05 0.00 1.0% S&P/LSTA U.S. Leveraged Loan Emerging Market Debt 5.40 5.40 0.00 2.6% J.P. Morgan EMBI Global DiversifiedPublic BDCs
℮7.00 6.90 0.10 -0.2% Cliffwater BDC
Real EstatePublic REITs 5.80 5.55 0.25 1.1% FTSE/NAREIT Equity REITsPrivate (Unlevered) 6.95 7.00 -0.05 1.7%
†NCREIF Property
Private Partnerships 8.95 9.00 -0.05 3.7%††
Cambridge Opportunistic RE
Private EquityDiversified 9.60 9.60 0.00 3.6%†† Cambridge Global PE & VC
Buyout 8.85 8.85 0.00 4.0%†† Cambridge U.S. BuyoutVenture Capital 10.35 10.35 0.00 3.2%†† Cambridge Global VentureEnergy 9.60 9.60 0.00 2.0%†† Cambridge Global Energy
Private DebtUnlevered 6.95 6.95 0.00 2.0%
†Cliffwater Direct Lending
Levered 9.45 9.45 0.00 2.9% Cliffwater Estimates
Hedge FundsDiversified 5.95 5.90 0.05 2.3% HFRI FOF Composite
Absolute Return 5.10 5.15 -0.05 1.2% HFRI FOF ConservativeDirectional 6.70 6.65 0.05 2.6% HFRI FOF Strategic
Other Real AssetsCommodity Futures 2.10 2.00 0.10 2.5% Bloomberg CommodityMLPs 8.00 7.40 0.60 -3.1% Alerian MLPFarmland (core) 6.00 6.00 0.00 1.6%
†NCREIF Farmland Property
Infrastructure 6.25 6.25 0.00 5.0%†† Cambridge InfrastructureCash
3M T-bill 1.85 1.75 0.10 0.3% BofA Merrill Lynch U.S. 0-3M T-Bill3M LIBOR 2.10 2.00 0.10 0.3% Bloomberg 3M Libor
Inflation 1.85 1.75 0.10 0.5%††† CPI-U
* Expected geometric annual return over the next 10 years.℮
† One quarter lagged†† Two quarters lagged
††† One month lagged
Expected % Return* at3rd Qtr
Return
Business Development Companies, a liquid investment in private middle market corporate debt
Cliffwater Fourth Quarter 2017 Asset Allocation Outlook Page 3 of 12 For institutional/wholesale/professional clients and qualified investors only – not for retail use or distribution.
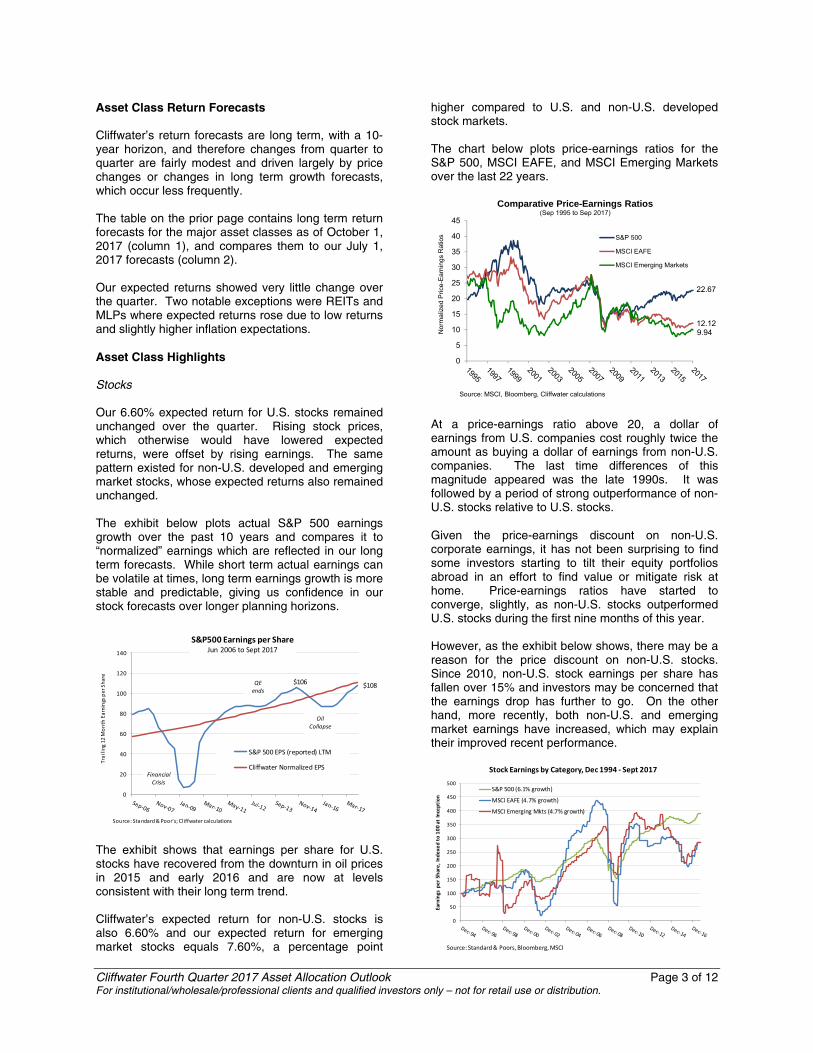
Asset Class Return Forecasts Cliffwater’s return forecasts are long term, with a 10-year horizon, and therefore changes from quarter to quarter are fairly modest and driven largely by price changes or changes in long term growth forecasts, which occur less frequently. The table on the prior page contains long term return forecasts for the major asset classes as of October 1, 2017 (column 1), and compares them to our July 1, 2017 forecasts (column 2). Our expected returns showed very little change over the quarter. Two notable exceptions were REITs and MLPs where expected returns rose due to low returns and slightly higher inflation expectations. Asset Class Highlights Stocks Our 6.60% expected return for U.S. stocks remained unchanged over the quarter. Rising stock prices, which otherwise would have lowered expected returns, were offset by rising earnings. The same pattern existed for non-U.S. developed and emerging market stocks, whose expected returns also remained unchanged. The exhibit below plots actual S&P 500 earnings growth over the past 10 years and compares it to “normalized” earnings which are reflected in our long term forecasts. While short term actual earnings can be volatile at times, long term earnings growth is more stable and predictable, giving us confidence in our stock forecasts over longer planning horizons.
The exhibit shows that earnings per share for U.S. stocks have recovered from the downturn in oil prices in 2015 and early 2016 and are now at levels consistent with their long term trend. Cliffwater’s expected return for non-U.S. stocks is also 6.60% and our expected return for emerging market stocks equals 7.60%, a percentage point
higher compared to U.S. and non-U.S. developed stock markets. The chart below plots price-earnings ratios for the S&P 500, MSCI EAFE, and MSCI Emerging Markets over the last 22 years.
At a price-earnings ratio above 20, a dollar of earnings from U.S. companies cost roughly twice the amount as buying a dollar of earnings from non-U.S. companies. The last time differences of this magnitude appeared was the late 1990s. It was followed by a period of strong outperformance of non-U.S. stocks relative to U.S. stocks. Given the price-earnings discount on non-U.S. corporate earnings, it has not been surprising to find some investors starting to tilt their equity portfolios abroad in an effort to find value or mitigate risk at home. Price-earnings ratios have started to converge, slightly, as non-U.S. stocks outperformed U.S. stocks during the first nine months of this year. However, as the exhibit below shows, there may be a reason for the price discount on non-U.S. stocks. Since 2010, non-U.S. stock earnings per share has fallen over 15% and investors may be concerned that the earnings drop has further to go. On the other hand, more recently, both non-U.S. and emerging market earnings have increased, which may explain their improved recent performance.
$106 $108
0
20
40
60
80
100
120
140
Trailing 12
Month Earnings per Share
S&P500 Earnings per Share Jun 2006 to Sept 2017
S&P 500 EPS (reported) LTM
Cliffwater Normalized EPS
QEends
FinancialCrisis
OilCollapse
Source: Standard & Poor's; Cl iffwater calculations
22.67
12.129.94
0
5
10
15
20
25
30
35
40
45
Nor
mal
ize
d P
rice
-Ea
rnin
gs
Rat
ios
Comparative Price-Earnings Ratios(Sep 1995 to Sep 2017)
S&P 500
MSCI EAFE
MSCI Emerging Markets
Source: MSCI, Bloomberg, Cliffwater calculations
0
50
100
150
200
250
300
350
400
450
500
Earnings per Share, Indexed to 100 at Inception
Stock Earnings by Category, Dec 1994 ‐ Sept 2017
S&P 500 (6.1% growth)
MSCI EAFE (4.7% growth)
MSCI Emerging Mkts (4.7% growth)
Source: Standard & Poors, Bloomberg, MSCI

Cliffwater Fourth Quarter 2017 Asset Allocation Outlook Page 4 of 12 For institutional/wholesale/professional clients and qualified investors only – not for retail use or distribution.
Despite seemingly attractive overseas stock valuations, timing the global stock markets has always been challenging and that is why institutional investors generally keep constant weightings across regional markets, or benchmark to one global market weighted index. Investors using fixed regional stock weights generally have a benchmark U.S. weight of at least 50%. Bonds and Rates Earlier in the year we noted the creep upward in inflation as unemployment levels fell below 5%. That trend reversed in the second quarter and inflation measures generally have averaged at their sub 2% recent average. All three measures of inflation were positive for the quarter. Core inflation (measured as trailing 12 months) was 1.7% at the end of August and headline CPI was slightly higher at 2.0%. Housing inflation remains higher than the overall average inflation rate, exceeding 3.0%.
A modest drop in inflation in the three months ending August 2017, combined with a flattening yield curve, saw real rates rise slightly at the short end of the curve and fall slightly at long tenors.
While 10-year Treasury real yields are now positive, equal to 0.34%, we continue to view Treasuries as unattractive from a valuation perspective despite their
significant diversification benefits in a low growth environment as a “risk-off” asset. Credit Credit spreads continue their narrowing trend that began in Q2 2016. In just the course of the last year, yield spreads on liquid credit instruments have gone from well above historical norms to well below. As a result, we remain very cautious on many forms of subordinated debt, such as high yield bonds, where spreads are justifiable only if default rates remain well below historical averages.
The exhibit above shows the spread widening in 2015 that was a byproduct of the oil price collapse, followed by a near complete reversal in 2016 and 2017.
One credit area that we still think is relatively attractive is private middle market direct lending, primarily in the U.S. We talk more about direct lending later but point out here that most loans are floating rate, mitigating interest rate risk, and senior to high yield bonds in credit quality. REITs REIT returns have been muted over the past year as earnings growth has slowed. The exhibit below shows real dividends per share for the NAREIT Index. REITs pay out nearly all their earnings in dividends and consequently organic earnings growth should be near zero over time except for inflation. The exhibit shows that real REIT earnings have indeed been flat for the past 25 years except for the severe 2008 real estate downturn. We predicted a recovery back to a $25 level and current
2.0%1.7%
3.3%
-2%
0%
2%
4%
6%
8%
Trailing 12 Month (CPI) Inflation(Dec 1989 to Aug 2017)
CPI-U Trailing 12 Months
Core CPI Trailing 12 Months
CPI-Imputed Rent (Housing)
Source: Bureau of Labor Statistics, Cliffwater calculations
3.472.46
1.010.380%
2%
4%
6%
8%
10%
12%
14%
16%
Op
tion
Ad
just
ed
Sp
rea
d to
Tre
asu
rie
s
Historical Credit Spreads(Dec 1996 to Sep 2017)
Bloomberg Barclays U.S. High Yield
Bloomberg Barclays EM USD Debt
Bloomberg Barclays U.S. Corporate Bond
Bloomberg Barclays U.S. Aggregate Bond
Note: Bloomberg Barclays EM USD Debt inception in August 2000
Bloomberg Barclays U.S.
High Yield Bond
Bloomberg Barclays EM
USD Debt
Bloomberg Barclays U.S.
Corporate Bond
Bloomberg Barclays U.S.
Aggregate Bond
Current Spread 3.47 2.46 1.01 0.38
Historical Median 4.58 3.43 1.23 0.50
Difference -1.11 -0.98 -0.22 -0.12
Source: Bloomberg Barclays
Comparison of Current and Historical Median Spreads

Cliffwater Fourth Quarter 2017 Asset Allocation Outlook Page 5 of 12 For institutional/wholesale/professional clients and qualified investors only – not for retail use or distribution.
dividend payout for the NAREIT Equity Index has reached that level for the past three quarters. With real earnings per share limited on the upside, in our opinion, we believe REIT total return going forward will come primarily through current yield and any inflation induced earnings growth.
The reported REIT dividend yield was 4.03% at September 30, 2017, as shown below.
Our tactical model views REITs as fairly valued. The yield spread between REITs and 10-year Treasuries equals 1.70%, compared to a 1.09% long term historical average over the past 25 years and 1.60% average over the last 10 years. MLPs MLPs are liquid, mid-stream energy or infrastructure investments with strong cash flow and inflation sensitivity. While not particularly oil price sensitive in the past, they have traded almost in lockstep with oil, both down and up over the past year. This has caught many investors, including us, by surprise, because their steady cash flow should imply that MLPs trade on their yield, as they had in the past. Part of the explanation has been the gradual inclusion of MLPs that engage in more upstream (exploration) operations.
MLP earnings have held up reasonably well over the past year compared to oil stocks, down 25% from their peak, as shown in the exhibit below. By contrast, MLP prices, measured by the Alerian MLP Index, are down 35% from their peak. This disparity between earning decline and price decline is why we still view MLPs as relatively attractive. MLP earnings behavior is far different from earnings losses from oil stocks, plotted in green below.
MLPs are down -5.6% in 2017 after rising over 20% during 2016. MLPs, like REITs, distribute virtually all their earnings to investors and, consequently, tend to trade more on yield relative to other asset classes and not growth opportunities. The exhibit below compares cash yields for MLPs and 10-year Treasuries.
MLP yields are well below their 12.01% high in February 2016. Still, their current 7.67% dividend yield offers a 5.34% excess yield over the yield on 10-year Treasuries. By comparison, the historical average yield spread between MLPs and 10-year Treasuries equals 3.47%. BDCs Publicly traded BDCs (Business Development Companies) are exchange traded vehicles that invest
25.9
$0
$5
$10
$15
$20
$25
$30
$35
$40
Re
al D
ivid
en
ds
pe
r S
ha
re
Real REIT Dividends Per ShareInflation Adjusted for the FTSE/NAREIT Equity REITs Index
Dec 1990 to Sep 2017
Source: FTSE/NAREIT, Cliffwater calculations
4.03
2.33
-2%
0%
2%
4%
6%
8%
10%
12%
Yie
ld
Yields and Spreads for REITs and 10-Yr Treasuries(Dec 1990 to Sep 2017)
REIT/Treasury Yield Spread
Equity REIT Dividend Yield
10 Yr Treasury Yield
Source: FTSE/NAREIT, Bloomberg
1.7
$0
$20
$40
$60
$80
$100
$120
$140
$160
‐$10
$0
$10
$20
$30
$40
$50
$60
$70
Real W
TI Oil Price per barrel
Real M
LP Dividends and Oil Stock Earnings
per Share
Real MLP, Energy Stock Earnings and Oil Prices(Dec 1996 to Sep 2017)
Real MLP Dividends/Share
Real Oil Stock Earnings
Real WTI Oil Price (right axis)
Source: Alerian, Bloomberg, Bureau of Labor Statistics, Cliffwater calculations
7.67%
2.33%
0%
2%
4%
6%
8%
10%
12%
14%
Yields and Spreads for MLPs and 10‐Yr Treasuries(Dec 1996 to Sep 2017)
MLP/Treasury Spread
Alerian MLP Dividend Yield
10‐Year Treasury Yield
Source: Alerian, Bloomberg
5.34%

Cliffwater Fourth Quarter 2017 Asset Allocation Outlook Page 6 of 12 For institutional/wholesale/professional clients and qualified investors only – not for retail use or distribution.
in private secured and unsecured middle market corporate debt, which are the types of investments generally found in private mezzanine, insurance, and commercial bank portfolios. BDCs provide their shareholders access to private corporate debt investments but with daily liquidity. BDCs are in many ways like REITs and MLPs in their cash generating, tax-preference investment characteristics that appeal to retail investors, but have recently found institutional interest. BDCs are also regulated under the Investment Company Act of 1940. We believe that BDCs can be an attractive alternative to high yield bonds. BDCs differ from high yield bonds in that the securities held are more senior in the capital structure, making them presumably less risky (i.e., lower default risk). On the other hand, BDCs generally incorporate modest leverage, averaging 40% of total assets. The exhibit below plots yields for BDCs and high yield bonds, and the difference, or spread. The Cliffwater BDC Index, comprised of 41 BDCs with a $32 billion market capitalization, currently yields 9.14%.2 Its yield spread to high yield bonds equals an attractive 3.16%.
We believe that BDC investors are getting rewarded for risk, particularly considering that our analysis shows that underlying BDC credit risk is comparable or better than high yield credit risk, including the modest leverage used within BDC structures. Our
2 The Cliffwater BDC Index (the “CWBDC”) is a capitalization-weighted index capturing the performance of all lending-oriented, exchange-listed Business Development Companies that satisfy certain eligibility requirements. For additional information on BDCs and the CWBDC, see www.BDCs.com. Any information presented prior to the Launch Date (January 1, 2015) of the CWBDC is back-tested. The performance of the CWBDC has been prepared for informational purposes only. Past performance is not indicative of future returns. Please see additional CWBDC disclosures at the end of the report.
positive outlook for BDCs extends to direct private lending, the assets underlying BDCs. Commodities We continue to expect no or little real return from spot commodities over long time periods. Historically, the real value of commodities is volatile but trends around the inflation rate. The exhibit below illustrates this point. Inflation-adjusted prices for three commodity groups are plotted: oil, gold, and the S&P GSCI Commodity Index, the last consisting of a diversified basket of 24 individual commodities.
Unlike traditional asset classes whose cumulative real returns plot upward, there is no upward commodity price trend. There is volatility and spiking in the case of oil and gold. A cyclical high in oil and gold prices occurred two to three years ago. More recently we witnessed a spectacular drop in oil prices to a low of under $30 per barrel and a bounce back to $51 at March 31, 2017, where it remains at the end of the third quarter.
Unlike spot commodities, commodity futures, represented by the S&P GSCI Total Return index, have shown positive real returns over time, but not in
5.98%
9.14%
‐5%
0%
5%
10%
15%
20%
25%
30%
Yield
Yields and Spreads for BDCs and High Yield Bonds(Dec 2004 to Sep 2017)
BDC/High Yield SpreadHigh Yield YTMBDC Dividend Yield
3.16%
Source: Bloomberg Barclays, Cliffwater BDC Index
$0.0
$1.0
$2.0
$3.0
$4.0
$5.0
$6.0
$7.0
Rea
l Pri
ces:
194
7 =
$1.
0
CPI Adjusted Real Commodity Prices(Dec 1947 to Sep 2017)
Crude Oil
Gold
S&P GSCI - Spot Price
Source: S&P GSCI, Bureau of Labor Statistics, BloombergNote: S&P GSCI inception date in 1969
$1
$10
$100
Gro
wth
of a
Dol
lar
(log
scal
e)
GSCI Spot versus Futures Commodity Returns(Dec 1969 to Sep 2017)
S&P GSCI - Total Return
S&P GSCI - Spot Price
S&P 500
CPI
Source: S&P Dow Jones, S&P GSCI, Bureau of Labor Statistics

Cliffwater Fourth Quarter 2017 Asset Allocation Outlook Page 7 of 12 For institutional/wholesale/professional clients and qualified investors only – not for retail use or distribution.
the last 10 years. The exhibit above plots cumulative returns for the S&P GSCI Commodity Futures Index, the S&P GSCI Spot Commodity Index, the S&P 500 Index, and CPI Inflation covering almost 50 years. Note that spot commodity returns have not even matched inflation over the entire time period, consistent with the earlier exhibit. Some advisors and managers point to this exhibit to show that commodity futures achieve equity-like returns at low correlation. That has been true in the past but the reason behind strong historical commodity futures returns has not been the commodities themselves (spot prices) but instead the term structure of commodity futures prices, known as “backwardation” (futures prices are below spot prices) or “contango” (futures prices are above spot prices). The very good returns produced by commodity futures up until 1995 were due to a general condition of backwardation in the commodity futures markets. Buying commodities cheap in the futures market and selling them at higher spot prices near contract maturity produced a significant “roll yield” for investors. Those willing to pay for the positive roll yield were commodity producers (hedgers) desirous of locking in their pricing. The exhibit below shows the cumulative returns from roll yield for commodity futures.
A significantly backwardated futures market for 30 years ending in 1995 produced an 11% annual roll yield for commodity futures and made the asset class competitive with stock returns. That changed in 1996 as the roll yield averaged 0% from 1996 to 2004. After 2004 commodity futures returns trailed spot returns due to a negative roll yield, which has averaged -8% per year for the past 13 years. For example, the roll yield for the first nine months of 2017 has been -4%, a healthy price to pay for gaining exposure to commodities. Our long term expected return for commodities is a modest 2.10%, equal to our expected Libor return plus no premium for roll yield, and no expected
change in spot prices except those that are directly inflation related. Hedge Funds Hedge funds, measured by the HFRI Fund-of-Funds Index, were up 2.3% for the third quarter and have generally rebounded from their lows in 2015 and early 2016. The graph below shows the rolling 12-month alpha return component (beta return excluded) from the Cliffwater Model Hedge Fund Portfolio, which is a model portfolio of all Cliffwater approved open-ended hedge funds that are weighted to the target strategy weights of the model determined by Cliffwater over time.3 The data is through August 31, 2017.
While the Cliffwater Model Hedge Fund Portfolio has an average annual alpha equal to 2.22% net of fees since the model was first constructed in August 2011, for the most recent three years the alpha has equaled just 0.74%. As shown in the exhibit above, although hedge fund alpha dipped in 2015, the trend since March 2016 has been positive. Despite weak recent returns, we have raised our hedge fund expected return to 5.95%, from 5.90% a quarter ago. The increase derives from a slightly higher risk-free (T-bill) expected return. The exhibit below shows individual hedge fund strategy expected returns and our 5.95% overall hedge fund portfolio expected return based upon the assumptions and strategy weights shown in the table. The individual hedge fund strategy weights contained in column 1 are set by Cliffwater (generally, annually) to represent optimal allocations for a diversified hedge fund portfolio.
3 The Cliffwater Model Hedge Fund Portfolio performance results reflect the hypothetical results of a model portfolio of all Cliffwater approved open-ended commingled hedge funds that are weighted to the target strategy weights of the model determined by Cliffwater over time. Past performance is not indicative of future returns, which may vary. Please see additional disclosures at the end of this report.
$1
$10
$100
Gro
wth
of a
Dol
lar
(log
scal
e)
GSCI Commodity Futures Roll Yield(Dec 1969 to Sep 2017)
Futures Roll Yield
+11%/yr
-8%/yr
0%/yr
Source: S&P GSCI, Cliffwater calculations
‐8%
‐6%
‐4%
‐2%
0%
2%
4%
6%
8%
10%
Rolling 12 M
onth Alpha Returns
Hedge Fund Alpha: Rolling 12 MonthsAugust 2012 to August 2017
CW Model Portfolio
HFRI FoF Index
Source: Hedge Fund Research Inc., Cliffwater LLC

Cliffwater Fourth Quarter 2017 Asset Allocation Outlook Page 8 of 12 For institutional/wholesale/professional clients and qualified investors only – not for retail use or distribution.
The exhibit also shows our expected returns and risk for the seven individual hedge fund strategies that comprise our composite expected return and risk for a diversified hedge fund portfolio.
Private Assets4 Private Equity Cliffwater’s long term practice has been to forecast private equity returns by adding a 3% return premium to its long term stock return forecast. We recently completed our annual study of state pension fund returns and, this year, the study also focused on the performance of state pension fund private equity returns, which are reported in annual publications called CAFRs (Comprehensive Annual Financial Reports). As part of our study, we reviewed the private equity performance of 46 of the largest state pension funds over a 15-year period. In the table below, we have provided some of our findings.
Cumulative 15 Year Annualized Return (FY 2002 to 2016)
State Pension Fund Private Equity 9.7% Cambridge Assoc. Global Pr. Equity 9.9% Global Public Equity (MSCI ACWI) 5.0% Russell 3000 6.1%
Over the past 15 years, state pension fund allocations to private equity returned a net 9.7%, annualized. This return is similar to the Cambridge Associates Global Private Equity benchmark return. While our calculation covers actual state pension fund performance and the Cambridge Associates number reflects manager reported performance, both should be similar returns, which they are. For our purposes, it is the difference in return between private and public equity that matters. The difference between state pension private equity
4 Private asset returns generally come with a one to two quarter lag due to delays in GP asset valuations and property appraisals.
returns and public equities equals 4.7% annualized, using global stocks to benchmark public equities, and 3.5% using the Russell 3000. The difference between private and public equity exceeds 3.0% (our
assumption) in both cases, which we believe validates our expected return practice. The current market is challenging to investors wanting to increase their private equity allocations. Managers (GPs) are selling assets more than investing due to perceived high market valuations. The dearth of buying has also created high levels of “dry powder” ready to take advantage of any market downturn. The exhibit below shows buyout multiples rising from a range of 8-9 times cash flow (EBITDA) to 10-11 times cash flow. At the same time, this climb in buyout multiple is proportional to the rise in public market price-earnings ratios, from roughly a 15-16 ratio five years ago to 18-21 more recently. As a result, we don’t believe private equity relative valuations are excessive.
GPs are reacting to higher pricing by selling assets and distributing proceeds to investors, shown below.
8.4x
9.7x9.1x
7.7x
8.5x 8.8x 8.7x 8.8x
9.7x10.3x 10.0x
10.7x
5.1x
6.1x
4.8x
3.7x
4.6x4.9x 5.1x 5.3x
5.7x 5.6x 5.5x 5.8x
0.0x
2.0x
4.0x
6.0x
8.0x
10.0x
12.0x
Pur
chas
e M
ultip
le
U.S. Buyout Equity and Debt Multiples
U.S. Enterprise Value/EBITDA
U.S. Debt/EBITDA
Source: S&P Global Market Intelligence
1 2 3 4 5 6 7 8 9 10 11
Model
Weights
Equity
Beta*
Credit
Beta**
Beta
Return
Beta
Risk
Alpha
Return
Alpha
Risk
Info
Ratio
Total
Return
Total
Risk
Market Neutral 12.5% 1.85% -0.05 0.00 -0.25% 0.90% 2.63% 4.70% 0.56 4.23% 4.78%Credit/Distressed 17.5% 1.85% 0.10 0.40 1.78% 4.96% 2.25% 4.15% 0.54 5.88% 6.47%Event Driven 15.0% 1.85% 0.25 0.15 1.72% 5.47% 3.55% 6.35% 0.56 7.12% 8.38%Equity Long/Short 25.0% 1.85% 0.35 0.00 1.73% 6.30% 3.50% 5.77% 0.61 7.08% 8.54%Macro-Discretionary 15.0% 1.85% 0.10 0.00 0.50% 1.80% 2.80% 5.99% 0.47 5.15% 6.26%Macro-Systematic 5.0% 1.85% 0.05 0.00 0.25% 0.90% 3.30% 11.00% 0.30 5.40% 11.04%Multistrategy 10.0% 1.85% 0.10 0.15 0.98% 2.87% 2.50% 4.61% 0.54 5.33% 5.43%
Hedge Fund Portfolio 100% 1.85% 0.16 0.11 1.15% 3.65% 2.96% 3.95% 0.75 5.97% 5.40%
* MSCI All Country World Index (MSCI ACWI) expected return equal to 6.80%** S&P/LSTA Leveraged Loan Index expected return equal to 5.05%
Expected Sources of Hedge Fund Return and Risk -- Oct 1, 2017
3M T-bill
return
Beta Alpha T-bill+Beta+Alpha
Hedge Fund Strategy

Cliffwater Fourth Quarter 2017 Asset Allocation Outlook Page 9 of 12 For institutional/wholesale/professional clients and qualified investors only – not for retail use or distribution.
Investors are witnessing sizable distributions from their private partnerships at a level that is approximately twice the drawdowns to make new investments. This GP behavior is hopefully a positive for investors who might be better served by postponing asset purchases until the market is more favorable. Private Real Estate Both core and opportunistic real estate have delivered above average returns in recent years. These returns have caused cap rates to decline and, in recent quarters, by more than we find in the public REIT market. The graph below compares historical private real estate cap rates with REIT dividend yields, the public equivalent to private cap rates. Also shown in the shaded area is the spread between the two. Values are through June 30, 2017, the last date private real estate data is available.
The March 31, 2017 cap rate spread fell during the third quarter to 2.07%, equal to the difference between the 6.09% private real estate cap rate and the 4.02% REIT dividend yield. The long term historical spread between private and public cap rates is 1.61%, so the current 2.07% value is above the historical average.
Private Debt Private debt returned 10.41% for the trailing four quarters ending June 30, 2017, as measured by the Cliffwater Direct Lending Index, capturing over $80 billion in direct middle market corporate loans.5 The exhibit below shows rolling one year returns for the CDLI.
We continue to view current yields, ranging from 7% for the most senior debt to 14% for second lien debt, to be attractive relative to other high yield public debt and attractive relative to realized loss rates that average about 1% over long time periods. Below we show the range of middle market loan yields by loan seniority.6
5 The Cliffwater Direct Lending Index (the “CDLI”) is an asset-weighted (by reported fair value) index comprised of all underlying assets held by public and private Business Development Companies that satisfy certain eligibility requirements. For additional information on private direct lending see www.CliffwaterDirectLendingIndex.com. Any information presented prior to the Launch Date (September 30, 2015) of the CDLI is back-tested. The CDLI performance has been prepared for informational purposes only. Past performance is not indicative of future returns. Please see additional CDLI disclosures at the end of the report. 6 The “CDLI” yield is the realized income return over trailing 4 quarters. The “Senior” and “Subordinated” yields are estimated based on calculating an average over trailing 4 quarters of a two-factor regression of the gross yields of BDCs selected by Cliffwater (generally, BDCs that were diversified by industry and derived substantially all of their returns from lending activities) against each BDC’s portfolio composition (senior vs. subordinated assets). “True Senior” yields are the average over trailing 4 quarters of the average gross yield (annualized) on direct lending assets of the BDCs that Cliffwater has determined have nearly all of their assets in senior secured assets.
‐$100
‐$50
$0
$50
$100
$150$ in billions
Quarterly Net Cash Flow: Global Private Equity(Sep 1996 ‐Mar 2017)
Quarterly Drawdowns
Quarterly Distributions
Net Cash Flow
Source: Cambridge Associates
2.07%
6.09%
4.02%
-2%
0%
2%
4%
6%
8%
10%
12%
Public/Private Real Estate Cap Rates, Spreads(Dec 1983 to Jun 2017)
Private/Public Cap Spread
NCREIF Transaction Cap Rates
FTSE/NAREIT Dividend Yield
Source: NCREIF, FTSE/NAREIT
Incept. = 9.76%10.41%
-10%
-5%
0%
5%
10%
15%
20%
CD
LI T
otal
Ret
urn
CDLI Total ReturnTrailing 4 Quarters Total Return
Annualized Total Return
Cliffwater Fourth Quarter 2017 Asset Allocation Outlook Page 10 of 12 For institutional/wholesale/professional clients and qualified investors only – not for retail use or distribution.
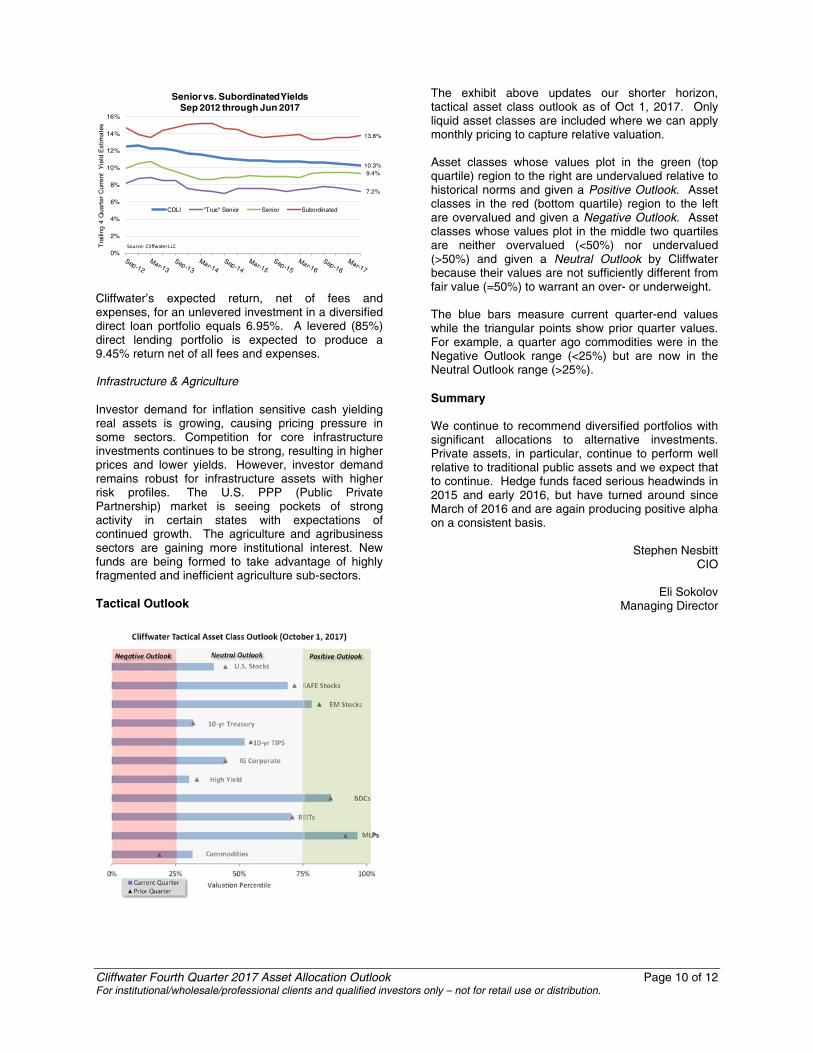
Cliffwater’s expected return, net of fees and expenses, for an unlevered investment in a diversified direct loan portfolio equals 6.95%. A levered (85%) direct lending portfolio is expected to produce a 9.45% return net of all fees and expenses. Infrastructure & Agriculture Investor demand for inflation sensitive cash yielding real assets is growing, causing pricing pressure in some sectors. Competition for core infrastructure investments continues to be strong, resulting in higher prices and lower yields. However, investor demand remains robust for infrastructure assets with higher risk profiles. The U.S. PPP (Public Private Partnership) market is seeing pockets of strong activity in certain states with expectations of continued growth. The agriculture and agribusiness sectors are gaining more institutional interest. New funds are being formed to take advantage of highly fragmented and inefficient agriculture sub-sectors. Tactical Outlook
The exhibit above updates our shorter horizon, tactical asset class outlook as of Oct 1, 2017. Only liquid asset classes are included where we can apply monthly pricing to capture relative valuation. Asset classes whose values plot in the green (top quartile) region to the right are undervalued relative to historical norms and given a Positive Outlook. Asset classes in the red (bottom quartile) region to the left are overvalued and given a Negative Outlook. Asset classes whose values plot in the middle two quartiles are neither overvalued (<50%) nor undervalued (>50%) and given a Neutral Outlook by Cliffwater because their values are not sufficiently different from fair value (=50%) to warrant an over- or underweight. The blue bars measure current quarter-end values while the triangular points show prior quarter values. For example, a quarter ago commodities were in the Negative Outlook range (<25%) but are now in the Neutral Outlook range (>25%). Summary We continue to recommend diversified portfolios with significant allocations to alternative investments. Private assets, in particular, continue to perform well relative to traditional public assets and we expect that to continue. Hedge funds faced serious headwinds in 2015 and early 2016, but have turned around since March of 2016 and are again producing positive alpha on a consistent basis.
Stephen Nesbitt CIO
Eli Sokolov
Managing Director
10.3%
7.2%
9.4%
13.8%
0%
2%
4%
6%
8%
10%
12%
14%
16%
Tra
iling
4 Q
uart
er C
urre
nt Y
ield
Est
imat
esSenior vs. Subordinated Yields
Sep 2012 through Jun 2017
CDLI "True" Senior Senior Subordinated
Source: Cliffwater LLC

Cliffwater Fourth Quarter 2017 Asset Allocation Outlook Page 11 of 12 For institutional/wholesale/professional clients and qualified investors only – not for retail use or distribution.
Disclosures
The views expressed herein are the views of Cliffwater LLC (“Cliffwater”) only through the date of this report and are subject to change based on market or other conditions. All information has been obtained from sources believed to be reliable but its accuracy is not guaranteed. Cliffwater has not conducted an independent verification of the information. The information herein may include inaccuracies or typographical errors. Due to various factors, including the inherent possibility of human or mechanical error, the accuracy, completeness, timeliness and correct sequencing of such information and the results obtained from its use are not guaranteed by Cliffwater. No representation, warranty, or undertaking, express or implied, is given as to the accuracy or completeness of the information or opinions contained in this report. This report is not an advertisement, is being distributed for informational and discussion purposes only, should not be considered investment advice, and should not be construed as an offer or solicitation of an offer for the purchase or sale of any security. The information herein does not take into account any investor’s particular investment objectives, strategies, tax status or investment horizon. Cliffwater shall not be responsible for investment decisions, damages, or other losses resulting from the use of the information. This report is not intended for public use or distribution. The information contained herein is confidential commercial or financial information, the disclosure of which would cause substantial competitive harm to you, Cliffwater, or the person or entity from whom the information was obtained, and may not be disclosed except as required by applicable law.
The information in this report is not intended as a recommendation to invest in any particular asset class or strategy or as a promise of future performance. Statements that are nonfactual in nature, including opinions, projections and estimates, assume certain economic conditions and industry developments and constitute only current opinions that are subject to change without notice. Further, all information, including opinions and facts expressed herein are current as of the date appearing in this report and is subject to change without notice. Unless otherwise indicated, dates indicated by the name of a month and a year are end of month.
There can be no assurance that any expected rate of return, risk, or yield will be achieved. Rate of return, risk, and yield expectations are subjective determinations by the Cliffwater based on a variety of factors, including, among other things, investment strategy, prior performance of similar strategies, and market conditions. Expected rate of return, risk, and yield may be based upon assumptions regarding future events and conditions that prove to be inaccurate. Expected rate of return, risk, and yield should not be relied upon as an indication of future performance and should not form the primary basis for an investment decision. No representation or assurance is made that the expected rate of return, risk, or yield will be achieved.
Cliffwater is a service mark of Cliffwater LLC.
Cliffwater Model Hedge Fund Portfolio
The Cliffwater Model Hedge Fund Portfolio performance results presented are unaudited and have been prepared for informational purposes only. The Cliffwater Model Hedge Fund Portfolio performance results reflect the hypothetical results of a model portfolio of all Cliffwater approved open-ended commingled hedge funds that are weighted to the target strategy weights of the model determined by Cliffwater over time. Closed-ended hedge funds are excluded since they are not available for investment on an ongoing basis. Approved funds are added to the model portfolios the month following the month in which they are approved, and funds are removed from the model portfolios on the month that they are no longer Cliffwater approved funds. However, the historical performance for funds removed from the model portfolios are kept in the historical performance of the model portfolios. For funds with multiple investment structures (e.g., an onshore fund and an offshore fund), the performance results of only one of the investment structures is selected for inclusion in the model portfolios. Generally, the master fund is selected, if available, and, if the master fund is not available, the onshore fund is selected, unless the offshore fund has a longer track record.
The model returns are based on the returns reported by the sponsor and/or administrator of the fund. The returns rely upon the accuracy and completeness of financial information provided to Cliffwater by such sponsors and/or administrators and, therefore, Cliffwater has not conducted an independent verification of this information. The returns are net of (i) all underlying fund or account expenses, management fees, and performance-based fees and (ii) Cliffwater’s actual fees, determined based on an allocation of Cliffwater’s compensation to assets under advisement by strategy.
The hypothetical, back-tested performance results of the model portfolios do not represent actual trading, and may not reflect the impact material economic and market factors might have had on Cliffwater’s decision-making if it were actually managing clients’ money. The actual performance of Cliffwater’s clients may have been materially different from the results portrayed in the model portfolio. The model portfolio includes hedge funds that Cliffwater no longer recommends to its clients. Past performance is not indicative of future returns, which may vary. Future returns are not guaranteed, and a loss of principal may occur.
“Beta” is derived from a regression of each return series (less the 3-month Libor return) against the return of the MSCI All Country World Index (MSCI ACWI) and “Alpha” is the annualized intercept of the regression.
Cliffwater Index Disclosures
The Cliffwater Direct Lending Index (the “CDLI”) is an index comprised of all underlying assets held by public and private Business Development Companies (“BDCs”) that satisfy certain eligibility requirements. The CDLI is asset-weighted by reported fair value. Cliffwater believes that the CDLI is representative of the direct lending asset class. The Cliffwater BDC Index (the “CWBDC” and, together with the CDLI, each an “Index”) is a capitalization-weighted index capturing the performance of all lending-oriented, exchange-listed BDCs that satisfy certain eligibility requirements. Cliffwater believes that the CWBDC is representative of the BDC asset class.
Each Index is owned exclusively by Cliffwater, and is protected by law including, but not limited to, United States copyright, trade secret, and trademark law, as well as other state, national, and international laws and regulations. Cliffwater provides this information on an “as is” and “as available” basis, without any warranty of any kind, whether express or implied.

Cliffwater Fourth Quarter 2017 Asset Allocation Outlook Page 12 of 12 For institutional/wholesale/professional clients and qualified investors only – not for retail use or distribution.
Past performance of an Index is not an indication of future results. It is not possible to invest directly in an Index. Any Index returns shown are not based on actual advisory client returns and do not reflect the actual trading of investible assets. The performance of an Index has not been reviewed by an independent accounting firm and has been prepared for informational purposes only.
Index returns do not reflect payment of any sales charges or fees a person may pay to purchase the securities underlying the Index or a product that is intended to track the performance of the Index. The imposition of these fees and charges would cause the actual and back-tested performance of these securities or products to be lower than the Index performance shown.
Any information presented prior to the Launch Date (September 30, 2015 with respect to the CDLI and January 1, 2015 with respect to the CWBDC) of an Index is back-tested. Back-tested performance is not actual performance, but is hypothetical. The back-tested calculations are based on the same methodology that was in effect when the Index was officially launched. Please refer to the methodology paper for the Index (available at www.CliffwaterDirectLendingIndex.com with respect to the CDLI and www.BDCs.com with respect to the CWBDC) for more details about the Index, including the Base Date/Value (September 30, 2004 at 1,000 with respect each Index) and the Launch Date of the Index and the manner in which the Index is rebalanced, the timing of such rebalancing and the eligibility criteria for the Index.
Prospective application of the methodology used to construct an Index may not result in performance commensurate with any back-tested returns shown. The back-test period does not necessarily correspond to the entire available history of an Index. Another limitation of back-tested hypothetical information is that generally the back-tested calculation is prepared with the benefit of hindsight. Back-tested data reflect the application of an Index methodology and selection of Index constituents in hindsight. No hypothetical record can completely account for the impact of financial risk in actual trading. For example, there are numerous factors related to the financial markets in general which cannot be, and have not been, accounted for in the preparation of any Index information set forth, all of which can affect actual performance.
When Cliffwater was unable to determine the nature of a BDC’s investments because of limited information included in historical SEC filings, Cliffwater did not apply the portfolio composition criteria (with respect to the CDLI, at least 75% of total investments represented by direct loans and, with respect to the CWBDC, a substantial majority (approximately 75%) of total investments represented by corporate debt) to the BDC. All other eligibility criteria were applied to determine whether to include the BDC in the historical Index composition and return. All CDLI returns and characteristics are reported with a 2.5 month lag to allow sufficient time for SEC filings.
An Index may include inaccuracies or typographical errors. Due to various factors, including the inherent possibility of human or mechanical error, the accuracy, completeness, timeliness and correct sequencing of such information and the results obtained from its use are not guaranteed by Cliffwater. Each Index is derived from sources that are considered reliable, but Cliffwater does not guarantee the veracity, currency, completeness or accuracy of the Index or other information furnished in connection with the Index. No representation, warranty or condition, express or implied, statutory or otherwise, as to condition, satisfactory quality, performance, or fitness for purpose are given or duty or liability assumed by Cliffwater in respect of an Index or any data included therein, omissions therefrom or the use of the Index in connection with any product, and all those representations, warranties and conditions are excluded save to the extent such exclusion is prohibited by applicable law.
Index Disclosures
References to market or composite indices (such as the S&P 500), benchmarks or other measures of relative market performance over a specified period of time (each, an “index”) are provided for information only. Reference to an index does not imply that a portfolio will achieve returns, volatility or other results similar to the index. The composition of an index may not reflect the manner in which a portfolio is constructed in relation to expected or achieved returns, portfolio guidelines, restrictions, sectors, correlations, concentrations, volatility or tracking error targets, all of which are subject to change over time.
• Hedge Fund Research, Inc. (“HFR”) is the source and owner of the HFR data contained or reflected in this report and all trademarks related thereto.
• Frank Russell Company (“FRC”) is the source and owner of the Russell Index data contained or reflected in this material and all trademarks and copyrights related thereto. The Russell Index data may contain confidential information and unauthorized use, disclosure, copying, dissemination or redistribution is strictly prohibited.
• Thomson Financial Inc. is the owner and/or licensor of the Cambridge Associates LLC data contained or reflected in this material.
• The MSCI information is the exclusive property of MSCI Inc. (“MSCI”) and may not be reproduced or re-disseminated in any form or used to create any financial products or indices without MSCI’s express prior written permission. This information is provided “as is” without any express or implied warranties. In no event shall MSCI or any of its affiliates or information providers have any liability of any kind to any person or entity arising from or related to this information.
For each asset class, Cliffwater has selected a benchmark index that it believes is representative of the asset class based on various considerations, including the return/risk characteristics. Cliffwater selected the NCREIF Farmland Property Index as representative of the Farmland asset class. The NCREIF Farmland Property Index is a quarterly time series composite return measure of investment performance of a large pool of individual farmland properties acquired in the private market for investment purposes only. All properties in the Farmland Index have been acquired, at least in part, on behalf of tax-exempt institutional investors. Unless otherwise described herein, please see Cliffwater’s 2017 Asset Allocation Report for a description of the indices referenced in this report.