msbc 5060 chapter 2 financial statements, taxes and cash flows 1
TRANSCRIPT

1
MSBC 5060Chapter 2
Financial Statements,Taxes and Cash Flows

2
Chapter Outline2.1 The Balance Sheet2.2 The Income Statement2.3 Taxes2.4 Net Working Capital 2.5 Cash Flows2.6 The Statement of Cash Flows2.7 Cash Flow Management
3
Key Concepts and Skills
• Know the difference between book value and market value
• Know the difference between accounting income and cash flow
• Know the difference between average and marginal tax rates
• Know how to determine a firm’s cash flow from its financial statements

4
Balance Sheet
• Assets are listed from Most Liquid to Least Liquid• “Net Fixed Assets” is Book Value (LOCOM) net of Accumulated
Depreciation• Assets = Liabilities + OE OE = Assets - Liabilities

5
• The balance sheet is a “snap-shot”– What does the company own today? – What does the company owe today?– How much is left for the owners?
• called the residual
• The LEFT SIDE shows what assets are employed by the firm to do what it does– Cash, Inventory, Factories, Machines, Trucks…
• The RIGHT SIDE shows how it paid for the assets– How much is borrowed and for how long– How much is left for the owners– Note: Owner’s Equity is not how much the owners
contributed. It is the current residual value.
6
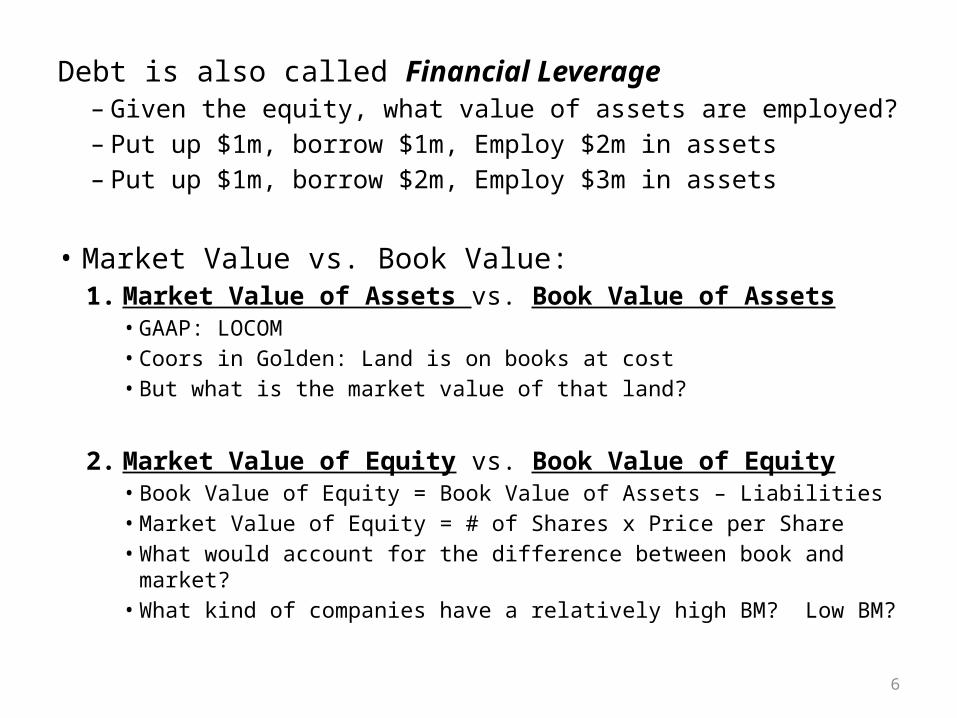
Debt is also called Financial Leverage– Given the equity, what value of assets are employed?– Put up $1m, borrow $1m, Employ $2m in assets– Put up $1m, borrow $2m, Employ $3m in assets
• Market Value vs. Book Value: 1. Market Value of Assets vs. Book Value of Assets
• GAAP: LOCOM• Coors in Golden: Land is on books at cost• But what is the market value of that land?
2. Market Value of Equity vs. Book Value of Equity• Book Value of Equity = Book Value of Assets – Liabilities• Market Value of Equity = # of Shares x Price per Share• What would account for the difference between book and market?• What kind of companies have a relatively high BM? Low BM?

7
Recap:• Market Value of Assets • Book Value of Assets• Market Value of Equity • Book Value of Equity

8
Income Statement
• Income Statement Includes:– Operating Expenses (COGS, SG&A, Lights…)– Per-Share numbers
• Addition to Retained Earnings on Income Statementis added to Accumulated Retained Earnings on the Balance Sheet

9
• Revenues and Expenses as they Accrue – If a sale is made, book the revenue– Not necessarily receive cash– Sale could be on account - A/R (a current asset)
• Non-Cash Expenses– Depreciation = $90– Was the $90 spent this period?– No! It is a portion of the amount spent (when the PPE
was purchased) that is allocated to this period– $90 is expensed against this period’s revenue– It lowers this periods taxable income
• And therefore lowers this period’s tax expense

10
Question:• A firm’s taxable income is $1,000• The firm owns a machine’s with $200 annual
depreciation this year.– It paid $2,000 for the machine and is depreciating it straight-
line over 10 years
• The firm’s tax rate is 35%• What is this year’s tax savings due to depreciation?
(Depreciation)(Tax Rate) = $200(0.35) = $70OrTax Exp without Depreciation = $1,000(0.35) = $350Tax Exp with Depreciation = ($1,000 - $200)(0.35) = $280 = ($800)(0.35) = $280Savings = $350 - $280 = $70

11
• Firms can engage in “Earnings Management”– Show higher or lower earnings– Used to achieve income smoothing– “Cookie Jar” accounts– LIFO or FIFO– Not necessarily illegal or unethical• See Wikipedia Page

12
Corporate Taxes• See Table 2.3 for corporate tax rates• Make sure you can calculate:– Tax Expense– Marginal Tax Rate– Average Tax Rate
• See Example 2.2 on page 27• If you are calculating the effect of additional
income from a new project, which tax rate should you use?
• Marginal. Why?

13
Net Working Capital (NWC)NWC = Current Assets – Current Liabilities

14
NWC = Current Assets – Current LiabilitiesNWC = $761 – $486 = $275• NWC is a measure of Short-Term Solvency• NWC also used to adjust Sales and Costs from
Income Statement to get Cash Flows:• Assume Sales last year was $100• But A/R increased from $20 to $50• How much actual cash was collected?• $100 – ($50 - $20) = $100 - $30 = $70• $70 in Cash Sales and $30 in A/R Sales

15
Cash Flows• Cash Flows are Everything!• We will deal with cash flows in a slightly different way than the
“Statement of Cash Flows”• In General, the value of a firm (or an individual project) is…
… the Present Value of its Cash Flows!• Net Cash Flows (in any period) = Money In - Money Out
Not Sales – Since some sales are in cash, some sales are on account
Not Net income (aka Earnings )– NI or Earnings is an “accounting profit” or “economic profit”– Not cash available to pay investors– Includes non-cash expenses– Includes accruals (sales, purchases…)
• A firm is defined by its assets so we will call this Cash Flows from Assets
We will start with NI and Adjust

16
CFs from AssetsSo back to the Income Statement:
OCF = NI + Int Exp + Dep + Deferred Tax = 86 + 90 + 49 + 13 = $238

CFs from Assets• So we have OCF = $238• But how much of that activity represents cash
transactions? • Sales was $2,262– But how much of those sales were on account?
• COGs was $1,655– But was that money actually spent on inventory
this year?– Only if it was replaced! (so no change in INV)– And Only if cash was spent (no change in A/P)
17

CFs from AssetsSo back to the Balance Sheet (just Current Asset for now):
• A/R from $270 to $294 – $294 – $270 = $24 of OCF was not cash received
• INV from $280 to $269 – $269 – $280 = -$11 of Inv was not replaced– COGS of $1,655, but only $1,655 - $11 = $1,644 was cash spent18

CFs from AssetsNow just Current Liabilities:
• Total Current Liabilities from $455 to $486– $486 – $455 = $31 of Cash assumed spent was not spent– It was “borrowed”
19

CFs from AssetsIncreases in Current Asset means OCF is too highIncreases in Current Liabilities means OCF is too lowSo next step (Still one more after this):• Total CFs = Operating CF – ΔCA + ΔCL• But it is usually written his way: • ΔCA = New CA – Old CA• ΔCL = New CL – Old CL• New NWC = New CA – New CL• Old NWC = Old CA – Old CL• ΔNWC = New NWC – Old NWC
CFs from Assets = Operating CF – ΔNWC 20

CFs from AssetsRecap: • OCF = EBIT + Dep – Taxes = $219 + $90 - $71 = $238• ΔNWC = New NWC – Old NWC• New NWC = $761 - $486 = $275 • Old NWC = $707 - $455 = $252• ΔNWC = $275 – $252 = $23So now CF = OCF - ΔNWC = $238 - $23 = $215
But still not done yet!• We have to consider Net Capital Spending
– Cash spent on capital is not available to investors
• Distinguish Capital (PPE) from Working Capital 21
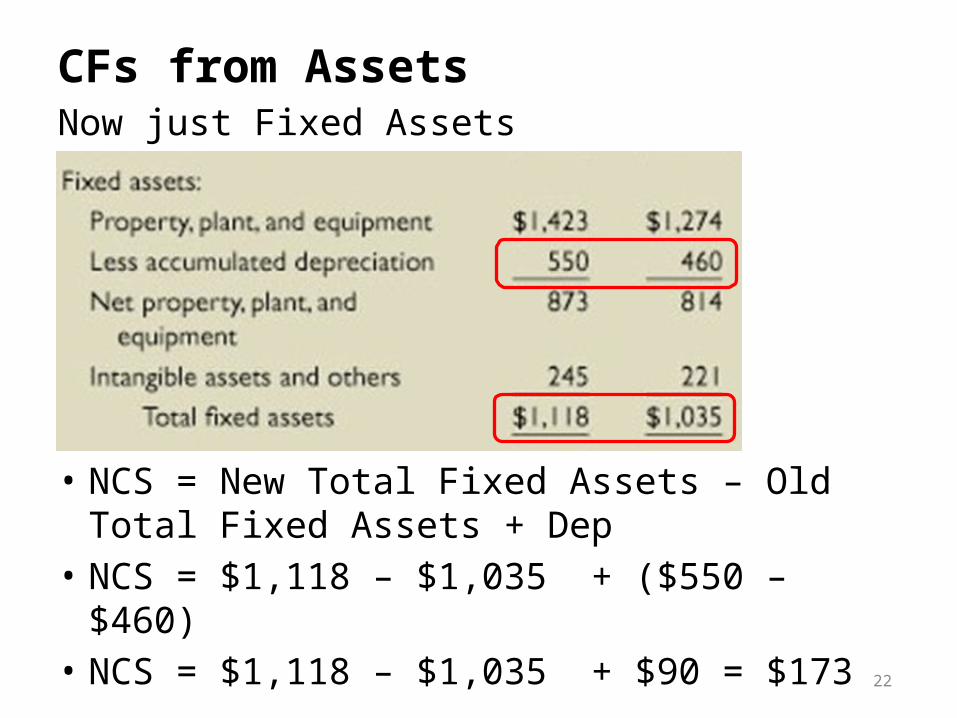
CFs from AssetsNow just Fixed Assets
• NCS = New Total Fixed Assets – Old Total Fixed Assets + Dep
• NCS = $1,118 – $1,035 + ($550 – $460)• NCS = $1,118 – $1,035 + $90 = $173
22

CFs from AssetsRecap:OCF = EBIT + Dep – Taxes = $219 + $90 - $71 = $238ΔNWC = New NWC – Old NWC = $275 – $252 = $23NCS = New TFA – Old TFA + Dep = $1,118 – $1,035 + $90 = $173• So firm generated “cash” of $238 from operations• But $23 of the $238 was either:– Not collected – Assumed revenue was too high– Or more was spent – Assumed costs were too low– Since NWC increased
• And $173 of the $238 was spent of PPE
CF = OCF – ΔNWC - NCS = $238 - $23 - $173 = $4223
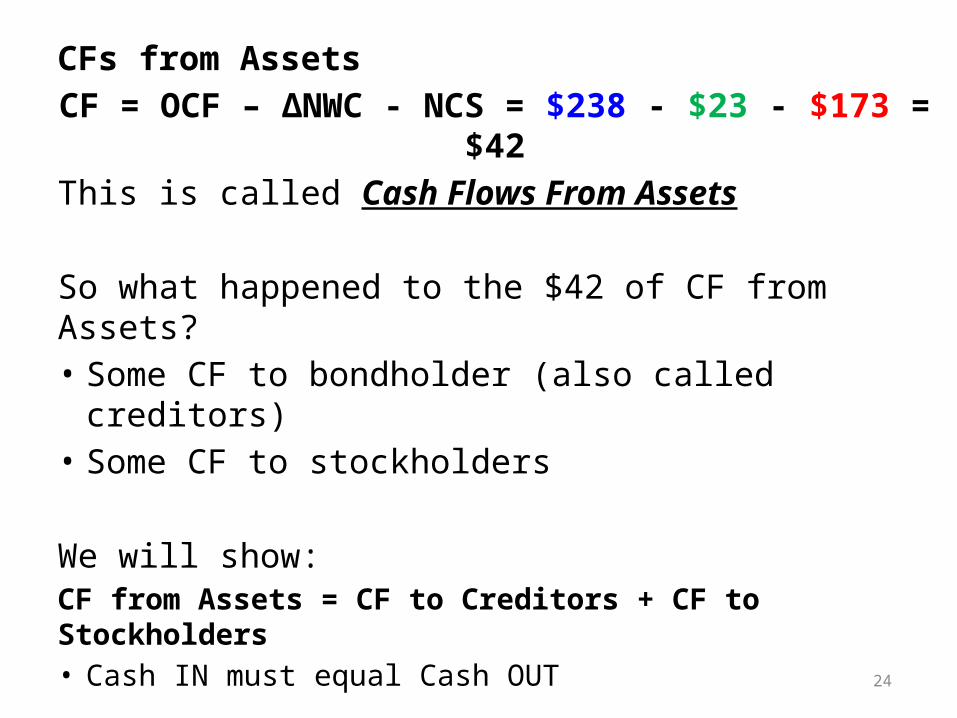
CFs from AssetsCF = OCF – ΔNWC - NCS = $238 - $23 - $173 = $42This is called Cash Flows From Assets
So what happened to the $42 of CF from Assets?• Some CF to bondholder (also called creditors)• Some CF to stockholders
We will show:CF from Assets = CF to Creditors + CF to Stockholders• Cash IN must equal Cash OUT
24
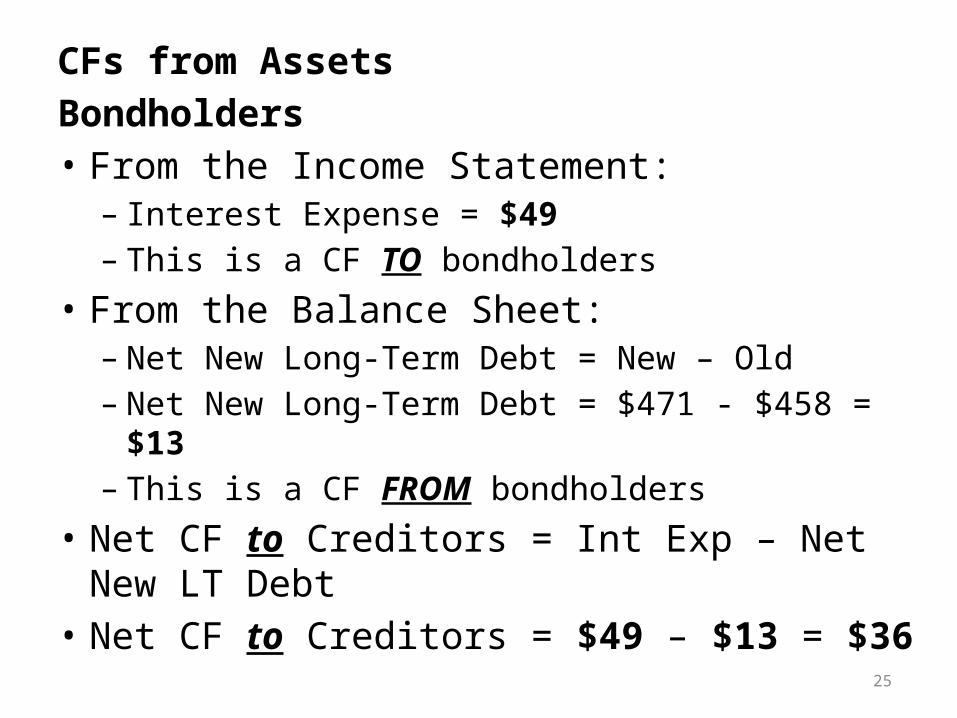
CFs from AssetsBondholders• From the Income Statement:– Interest Expense = $49– This is a CF TO bondholders
• From the Balance Sheet:– Net New Long-Term Debt = New – Old– Net New Long-Term Debt = $471 - $458 = $13– This is a CF FROM bondholders
• Net CF to Creditors = Int Exp – Net New LT Debt• Net CF to Creditors = $49 – $13 = $36
25

CFs from AssetsCF to Stockholders• From the Income Statement:– Dividends = $43– This is a CF TO stockholders
• From the Balance Sheet:– Net New Treasury Stock = $26 – $20 = $6– This is a CF TO stockholders
CF TO Stockholders = $43 + $6 = $49
26

CF from Stockholders• From the Balance Sheet:– Change in Common Stock = $55 – $32 = $23– Change in Capital Surplus = $347 - $327 = $20– Together these are value of new stock sold = $43
CF FROM stockholders = $43
Net CF to Stockholders = $49 – $43 = $6
27

CFs from AssetsConclusion:• CF to Creditors = $36• CF to Stockholders = $6• CF to Creditors + CF to Stockholders = $36 + $6 = $42
Recall:CF from Assets = OCF – ΔNWC – NCS = $42
Cash In must equal Cash Out
28

The Accounting Statement of CFs• Back to the Balance Sheet:
• Cash increased by $140 - $107 = $33• Why?• What were the firm’s sources and uses of cash?
29

The Accounting Statement of CFs
30
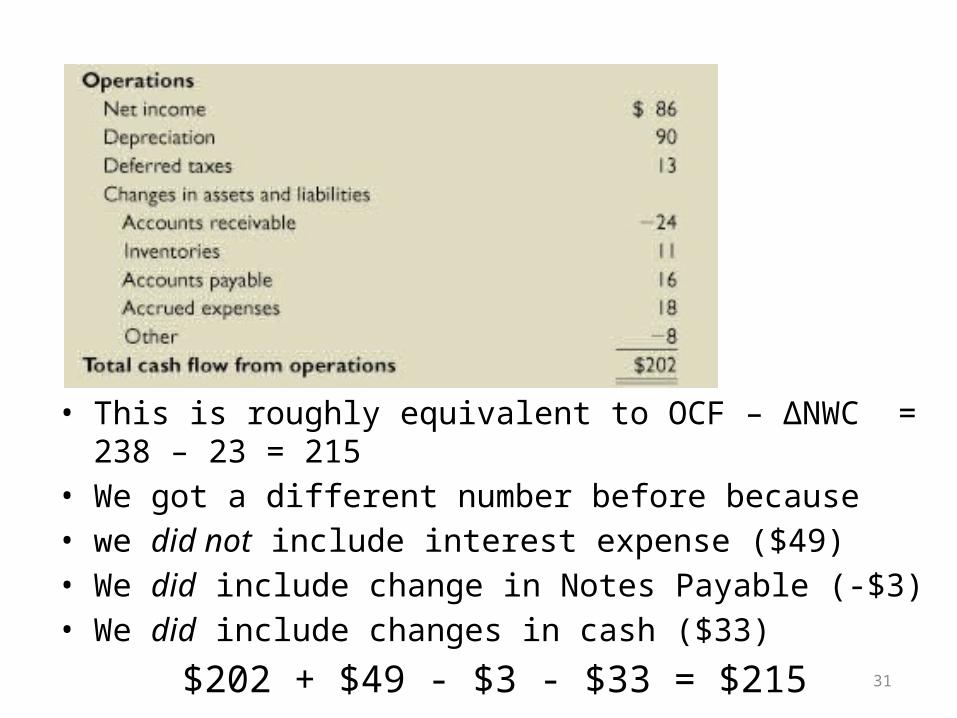
• This is roughly equivalent to OCF – ΔNWC = 238 – 23 = 215• We got a different number before because • we did not include interest expense ($49)• We did include change in Notes Payable (-$3) • We did include changes in cash ($33)
$202 + $49 - $3 - $33 = $21531

• Investing Activities = Net Capital Spending = $173• Financing Activities includes Changes to Notes Payable
32

The Accounting Statement of CFs• Net Changes to Cash = $202 – $173 + $4 = $33• This shows the breakdown of how Cash went from $107 to
$140
• We DO NOT care about the Statement of CFs• We DO care about financial CFs from Assets
• That the firm decided to increase the cash account (instead of buying inventory or paying off debt) does not concern us – from a valuation perspective
• What does concerns us is the Free CFs generated from the firm’s assets ($42) that are available to be paid to investors
• We also care about what happened to the $42 Free CF’s – $36 to creditors and $6 to stockholders
33

The Accounting Statement of CFsBe sure to appreciate the difference between:1. Accounting cash flows used to trace the source
of changes in the cash account2. Financial “free cash flows” available to
compensate investors– The amount, timing and allocation between
stockholders and bondholders of these “free cash flows” are relevant for analyzing the company and valuing its stocks and bonds, not the changes to the amount of cash on hand.
34

Earnings and Cash Flow “Management” vs Fraud• Enron• WorldCom
35

What’s Next?More on Financial Statements• Financial Statement Analysis• Ratios • Profitability Decomposition• Growth and Financing Growth
36