mpa vs. mpp: a distinction without a difference? · pdf filempa vs. mpp: a distinction without...
TRANSCRIPT

MPA vs. MPP: A Distinction Without a Difference?
Journal of Public Affairs EducationJPAE 15(4): 397–424 397
MPA vs. MPP:A Distinction Without a Difference?
Yongbeom HurAppalachian State University
Merl HackbartUniversity of Kentucky
ABSTRACT
Despite several scholarly inquiries, the question of whether there are criticaldifferences between Masters of Public Administration (MPA) and Masters ofPublic Policy (MPP) programs continues in the minds of prospective students,potential employers, and university officials. Building on previous inquiries intothis issue, we compare the core course content of selected MPA and MPPprograms, and expand the study by investigating whether there is a correlationbetween the academic backgrounds of program faculty and the emphases in corecurricula. We also surveyed departments or schools that have both MPA and MPPprograms in order to determine the reasons for offering both programs and relatedissues — it was assumed that schools and departments offering both programswould have vetted program goals and content issues. Our study suggests thatMPA and MPP program curricula differ. However, such differences seem morelikely to be associated with faculty discipline differences than with a focus onproviding graduates the core competencies required for job and careeroptions/opportunities in these fields.
RESEARCH BACKGROUND AND STUDY PURPOSES
Outwardly, public affairs education programs have had one of twoorientations — traditional public administration or public policy. Although thecurriculum differences of the two programs — Master of Public Administration(MPA) and Master of Public Policy (MPP) — may be less pronounced thanthey were two decades ago, it is assumed that these differences, among otherfactors, are what distinguish policy-focused programs from administration-oriented programs (Lowery & Whitaker, 1994, pp. 25-26). According toElmore (1986), “analysis and economic theory are still the hallmark of publicpolicy programs” (p. 70). To the founders of public policy schools, public
MPA vs. MPP: A Distinction Without a Difference?
398 Journal of Public Affairs Education
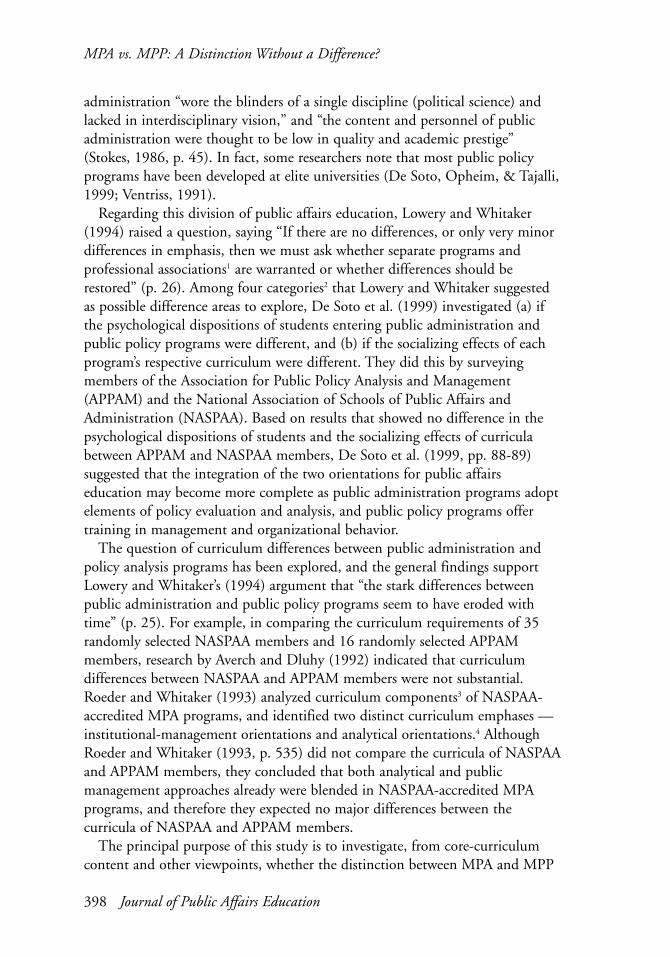
administration “wore the blinders of a single discipline (political science) andlacked in interdisciplinary vision,” and “the content and personnel of publicadministration were thought to be low in quality and academic prestige”(Stokes, 1986, p. 45). In fact, some researchers note that most public policyprograms have been developed at elite universities (De Soto, Opheim, & Tajalli,1999; Ventriss, 1991).
Regarding this division of public affairs education, Lowery and Whitaker(1994) raised a question, saying “If there are no differences, or only very minordifferences in emphasis, then we must ask whether separate programs andprofessional associations1 are warranted or whether differences should berestored” (p. 26). Among four categories2 that Lowery and Whitaker suggestedas possible difference areas to explore, De Soto et al. (1999) investigated (a) ifthe psychological dispositions of students entering public administration andpublic policy programs were different, and (b) if the socializing effects of eachprogram’s respective curriculum were different. They did this by surveyingmembers of the Association for Public Policy Analysis and Management(APPAM) and the National Association of Schools of Public Affairs andAdministration (NASPAA). Based on results that showed no difference in thepsychological dispositions of students and the socializing effects of curriculabetween APPAM and NASPAA members, De Soto et al. (1999, pp. 88-89)suggested that the integration of the two orientations for public affairseducation may become more complete as public administration programs adoptelements of policy evaluation and analysis, and public policy programs offertraining in management and organizational behavior.
The question of curriculum differences between public administration andpolicy analysis programs has been explored, and the general findings supportLowery and Whitaker’s (1994) argument that “the stark differences betweenpublic administration and public policy programs seem to have eroded withtime” (p. 25). For example, in comparing the curriculum requirements of 35randomly selected NASPAA members and 16 randomly selected APPAMmembers, research by Averch and Dluhy (1992) indicated that curriculumdifferences between NASPAA and APPAM members were not substantial.Roeder and Whitaker (1993) analyzed curriculum components3 of NASPAA-accredited MPA programs, and identified two distinct curriculum emphases —institutional-management orientations and analytical orientations.4 AlthoughRoeder and Whitaker (1993, p. 535) did not compare the curricula of NASPAAand APPAM members, they concluded that both analytical and publicmanagement approaches already were blended in NASPAA-accredited MPAprograms, and therefore they expected no major differences between thecurricula of NASPAA and APPAM members.
The principal purpose of this study is to investigate, from core-curriculumcontent and other viewpoints, whether the distinction between MPA and MPP

MPA vs. MPP: A Distinction Without a Difference?
Journal of Public Affairs Education 399
programs represents a fundamental difference, or whether these programs justhave different titles. To do this, a comprehensive investigation was conducted.That is, based on information collected through Web site visits and a survey, wecompared anticipated job areas and positions, the desired competencies ofgraduates, and so on, in addition to performing a curriculum comparison. Wethen extended our inquiry to examine the association between core courses ofMPA and MPP programs, and core faculty academic disciplines, in order todetermine whether the faculty’s academic disciplinary backgrounds werecorrelated with the curriculum content of various MPA and MPP programs.
This inquiry followed Denhardt’s (2001, p. 531) indication that thedistinction of theory and practice in public affairs education might largely bedetermined by the experiences and interests of individual faculty, rather thanby different students’ needs. In the same vein, Roeder and Whitaker (1993)explored the reasons why programs vary in their emphasis on curriculumcomponents, with an expectation that the key factor for differences inprogram curricula might be the program faculty’s disciplinary backgroundsand specializations.
However, due to data unavailability in their investigation, Roeder andWhitaker (1993) only examined MPA programs, and used surrogate variablessuch as minimum hours of degree requirements, percentage of full-time nucleusfaculty, and percentage of full-time students. In our study, we obtainedinformation from university Web sites in the U.S. about program faculty’sacademic disciplines, and the curriculum structure of their MPA and MPPprograms. This information was used to investigate program similarities anddifferences, as well as possible associations between faculty backgrounds andcurriculum emphasis. By providing a more comprehensive assessment of thepossible relationships between MPA and MPP curricula, faculty compositions,and other motivations for offering these programs, this study helps answerLowery and Whitaker’s (1994) questions of whether program distinctions arereal, and whether they should be sustained.
Therefore, this study contributes to the literature as follows. First, weinvestigated similarities and differences between policy-oriented schools andadministration-oriented schools, in a more direct and comprehensive mannerthan previous studies. Unlike extant studies that focus on only curriculumdifferences (Averch & Dluhy, 1992; Roeder & Whitaker, 1993), we comparedjob areas and positions expected to be filled by graduates, competencies desiredfor graduates, and curricula. We surveyed directors of schools or departmentsthat offer both MPA and MPP programs, and asked them how the programs aredifferent in terms of (a) curriculum content, (b) expected career areas and jobpositions, (c) the desired competencies that each program aims to achieve for itsgraduates, and (d) major reasons for offering MPP programs. Given that theyoffer both degrees, these institutions also might offer unique insights into the

MPA vs. MPP: A Distinction Without a Difference?
400 Journal of Public Affairs Education
similarities and differences in MPA and MPP programs. Second, we comparedcurricula of MPA programs with those of MPP programs in order to make adirect curriculum comparison between policy-oriented and administration-oriented schools. In previous studies that compared program curricula,researchers ignored a group of schools that offered different degrees5 or bothMPA and MPP degrees because they randomly selected NASPAA members andAPPAM members. Although APPAM and NASPAA members are public policy-and public administration-oriented, respectively, merely comparing randomlyselected curricula of their members can be arbitrary.6 Third, we investigated theassociation between curriculum contents and the faculty’s disciplinarybackgrounds in these programs.
This effort will help determine whether these programs have differentcurriculum emphases, which is believed to be a way of distinguishing policy-focused programs from administration-oriented programs (Lowery &Whitaker, 1994).
METHODOLOGY
In order comprehensively to investigate whether the MPA vs. MPPdistinction is fundamental or merely a difference in title, we conducted threeassessments:
• A comparison of MPA and MPP core curricula that were similar to thecomparisons of previous studies;
• An analysis of faculty academic-discipline backgrounds, in order todetermine whether the curriculum emphasis bears a relationship tofaculty backgrounds; and
• A survey of program directors at the schools and departments that offerboth degrees, in order to determine differential program goals, programstructural design themes, and desired competencies for programgraduates, as well as any possible recruitment and placement patterndistinctions.
We conducted an Analysis of Variance7 (ANOVA) when we investigatedcurriculum differences (i.e., the first assessment), and the relationships betweencurriculum composition and the faculty’s disciplinary backgrounds (i.e., thesecond assessment).
To acquire program curriculum and faculty background information, inNovember and December 2005, we researched the Web sites of all 60 schoolswith both NASPAA and APPAM memberships (dual-membership schools),8
and we also randomly selected 30 schools that only had NASPAA memberships,and that offered only NASPAA-accredited MPA programs. During this Web-siteresearch process, we collected data on the schools’ core curricula of MPA andMPP programs, and their core faculty members’ academic backgrounds. Tofollow up on earlier empirical studies (Averch & Dluhy, 1992; De Soto et al.,
MPA vs. MPP: A Distinction Without a Difference?
Journal of Public Affairs Education 401
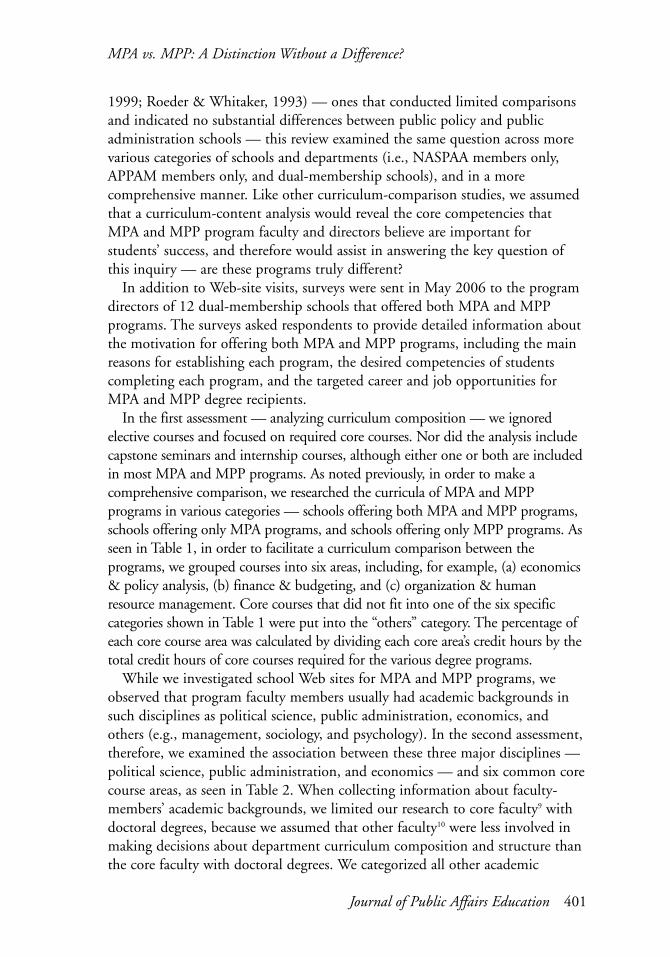
1999; Roeder & Whitaker, 1993) — ones that conducted limited comparisonsand indicated no substantial differences between public policy and publicadministration schools — this review examined the same question across morevarious categories of schools and departments (i.e., NASPAA members only,APPAM members only, and dual-membership schools), and in a morecomprehensive manner. Like other curriculum-comparison studies, we assumedthat a curriculum-content analysis would reveal the core competencies thatMPA and MPP program faculty and directors believe are important forstudents’ success, and therefore would assist in answering the key question ofthis inquiry — are these programs truly different?
In addition to Web-site visits, surveys were sent in May 2006 to the programdirectors of 12 dual-membership schools that offered both MPA and MPPprograms. The surveys asked respondents to provide detailed information aboutthe motivation for offering both MPA and MPP programs, including the mainreasons for establishing each program, the desired competencies of studentscompleting each program, and the targeted career and job opportunities forMPA and MPP degree recipients.
In the first assessment — analyzing curriculum composition — we ignoredelective courses and focused on required core courses. Nor did the analysis includecapstone seminars and internship courses, although either one or both are includedin most MPA and MPP programs. As noted previously, in order to make acomprehensive comparison, we researched the curricula of MPA and MPPprograms in various categories — schools offering both MPA and MPP programs,schools offering only MPA programs, and schools offering only MPP programs. Asseen in Table 1, in order to facilitate a curriculum comparison between theprograms, we grouped courses into six areas, including, for example, (a) economics& policy analysis, (b) finance & budgeting, and (c) organization & humanresource management. Core courses that did not fit into one of the six specificcategories shown in Table 1 were put into the “others” category. The percentage ofeach core course area was calculated by dividing each core area’s credit hours by thetotal credit hours of core courses required for the various degree programs.
While we investigated school Web sites for MPA and MPP programs, weobserved that program faculty members usually had academic backgrounds insuch disciplines as political science, public administration, economics, andothers (e.g., management, sociology, and psychology). In the second assessment,therefore, we examined the association between these three major disciplines —political science, public administration, and economics — and six common corecourse areas, as seen in Table 2. When collecting information about faculty-members’ academic backgrounds, we limited our research to core faculty9 withdoctoral degrees, because we assumed that other faculty10 were less involved inmaking decisions about department curriculum composition and structure thanthe core faculty with doctoral degrees. We categorized all other academic

MPA vs. MPP: A Distinction Without a Difference?
402 Journal of Public Affairs Education
disciplines — management, sociology, and psychology — as “other” (SeeAppendix D), and when academic backgrounds were not clear on the Web sites,we also included these faculty in the “other” discipline category. We identifiedcore faculty academic backgrounds based on Web-site information11 and did notrequest additional information from the schools when their faculty’s academicdisciplinary backgrounds were not available online.
School/department Web sites typically did not provide enough informationregarding such program design issues as the reasons for establishing eachprogram (MPA and/or MPP), desired competences to be achieved by programcompletion, and expected job opportunities upon graduation. Therefore, inMay 2006, we sent a questionnaire requesting insights and observations onthese issues to the directors of all 12 schools12 that offered both MPA and MPPprograms (See Appendix B for the list). We assumed that schools ordepartments with both MPA and MPP degree programs were the most capableof responding to survey questions that focused on obtaining insights aboutprogram design and goals, as well as the differences and similarities between thetwo programs. Seven schools responded to the survey.
RESULTS
Assessment 1: Curriculum ComparisonAs mentioned previously, although different curriculum emphasis has been
believed to distinguish policy-focused (MPP) programs from administration-oriented (MPA) programs (Elmore, 1986; Lowery & Whitaker, 1994), empiricalstudies (e.g., Averch & Dluhy, 1992; De Soto et al., 1999; Roeder & Whitaker,1993) have reported limited differences of curriculum, and suggested that anintegration of the two orientations for public affairs education may be emerging.In this study, we investigated the same question with the following hypothesis,based on the findings of previous studies:
Hypothesis 1: The curriculum composition of MPP programs is notdifferent from that of MPA programs.
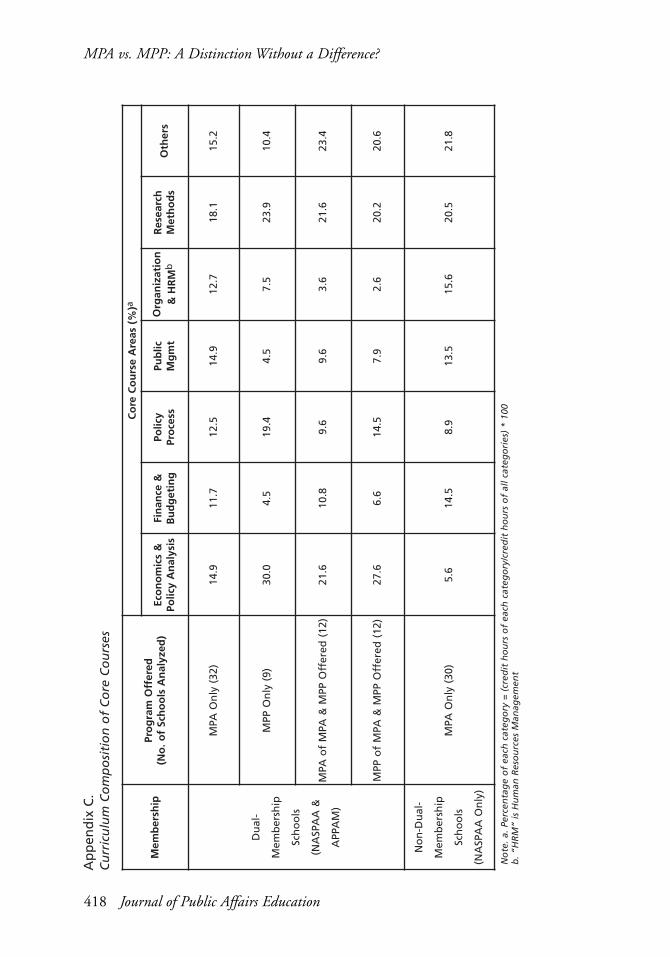
The table in Appendix C summarizes the percentages of each core course areafor different categories of schools. In the table, we observe that MPA programsin any school category have lower percentages of “economics & policy analysis”and higher percentages of “finance & budgeting” and “organization & humanresource management” in their curricula than MPP programs do. Researchmethod courses, however, seem to be similarly emphasized for both MPA andMPP programs. Although research course content (econometrics, basicregression, survey research, etc.) might differ, we assumed that research coursecontent was generally equivalent across programs. (See Appendix C.)
To test Hypothesis 1, we ran an ANOVA, using various school categories, inorder to determine if the mean proportion of each course among core curriculum

MPA vs. MPP: A Distinction Without a Difference?
Journal of Public Affairs Education 403
courses is different, depending on whether they are for MPA or MPP programs.As seen in Table 1, overall comparison shows that the curriculum emphasis ofMPP programs was significantly different from that of MPA programs, except inpolicy process and research method courses. Further analysis reveals that MPAprograms put more emphasis on “finance & budgeting,” public management,and “organization & human resource management,” while MPP programs placedmore stress on “economics & policy analysis.” However, no curriculumcomposition differences were found when we compared MPA and MPPprograms within schools that offer both MPA and MPP programs (N = 12). Insum, the results do not support Hypothesis 1, which was based on extantempirical results, but support theoretical arguments that curricula are differentbetween policy-focused and administration-oriented programs. (See Table 1.)
Assessment 2: The Impact of Faculty Academic DisciplinesAs seen in Appendix D, schools offering only MPA programs appear to have
more core faculty members with doctorates in public administration, and fewercore faculty members with doctorates in economics, than schools offering onlyMPP programs, or those offering both MPA and MPP programs. However, wedid not observe any obvious differences between MPA and MPP programs inthe share of the faculty that hold Ph.D.s in political science. (See Appendix D.)Following Roeder and Whitaker’s (1993, p. 524) and Denhardt’s (2001, p. 531)arguments about faculty’s influence on course structure in their programs, weposited a hypothesis about the association between core faculty’s academicbackgrounds, and course composition in their core curriculum:
Hypothesis 2: Core courses of MPA and MPP programs are associatedwith their core faculty members’ academic backgrounds.
To test this hypothesis in a comprehensive manner, we ran an ANOVA indifferent school categories — such as schools overall, schools offering MPAs,and schools offering MPPs. We also checked for any correlations between corecourses and core faculty disciplines, in order to understand how facultydisciplines could be associated with core course emphases (correlation results notshown). For example, positive correlations would indicate more emphasis on thecore courses when an ANOVA shows significant results. In the overallcomparison of Table 2, programs with more faculty members who havedoctorates in economics are likely to put more emphasis on “economics &policy analysis” and less emphasis on “organization & human resourcemanagement.” However, we found that, in the overall comparison, programswith more faculty members with doctorates in public administration are morelikely to stress “organization & human resource management.” When weexamined schools offering only the MPA compared to dual-membershipschools, we observe that programs with more doctorates in political science or

MPA vs. MPP: A Distinction Without a Difference?
404 Journal of Public Affairs Education
Co
mp
aris
on
Co
re C
ou
rse
Are
as (
F-St
atis
tics
)
Eco
no
mic
s &
Polic
y A
nal
ysis
Fin
ance
&B
ud
get
ing
Polic
yPr
oce
ssPu
blic
Mn
gt
Org
aniz
atio
n&
HR
Mb
Res
earc
hM
eth
od
s
Ove
rall
Co
mp
aris
on
MPA
(74
)avs
. MPP
(21
)30
.60*
**12
.02*
**2.
798.
02**
15.8
5***
0.06
Am
on
gD
ual
-Mem
ber
ship
Sch
oo
ls
MPA
-On
ly (
32)
vs. M
PP-O
nly
(9)
19.2
1***
5.24
*0.
2612
.79*
*3.
060.
96
MPA
of
Bo
th M
PA-
& M
PP-O
ffer
ed (
12)
vs. M
PP o
f B
oth
MPA
- &
MPP
-Off
ered
(12
)0.
330.
411.
640.
270.
000.
08
NA
SPA
A-O
nly
Mem
ber
s vs
. Du
al-
Mem
ber
ship
Sch
oo
ls
MPA
-On
ly o
f N
ASP
AA
-On
ly M
emb
ers
(30)
vs. M
PP o
f D
ual
Mem
ber
s (2
1)62
.63*
**13
.08*
**12
.32*
*6.
57*
34.0
3***
0.00
MPA
-On
ly o
f N
ASP
AA
-On
ly M
emb
ers
(30)
vs. M
PP o
f B
oth
MPA
- &
MPP
-Off
ered
of
Du
al M
emb
ers
(12)
41.3
6***
10.5
7**
9.40
**1.
9834
.59*
**0.
40
Tab
le 1
.A
NO
VA
Res
ult
s fo
r C
ore
Co
urs
es in
MPA
an
d M
PP P
rog
ram
s
No
te. *
p <
0.0
5 **
p <
0.0
1 **
*p <
0.0
01a.
Nu
mb
er o
f sc
ho
ols
an
alyz
edb
. “H
RM
” is
Hu
man
Res
ou
rces
Man
agem
ent

MPA vs. MPP: A Distinction Without a Difference?
Journal of Public Affairs Education 405
public administration are more likely to emphasize “finance & budgeting” and“organization & human resource management.” Although these associations areobserved, the basis of the association is not clear. That is, curriculumcomposition may influence hires or faculty composition may influencecurriculum content.
Our analysis revealed that programs with higher percentages of facultymembers with economics doctoral degrees are associated with more emphasis on“economic & policy analysis” and less emphasis on “organization & humanresource management.” In addition, “organization & human resourcemanagement” courses are stressed more when the programs have relatively morefaculty members with doctorates in public administration. When the programshave more faculty members with doctorates in political science, “finance &budgeting” is emphasized more. In sum, the core courses such as “economics &policy analysis,” “finance & budgeting,” and “organization & human resourcemanagement” are associated with faculty academic disciplines, while the othercore courses such as policy process, public management, and research methodsare not. Therefore, Hypothesis 2 is partially supported. It should be noted thatonly the core courses that are differently emphasized by MPA and MPPprograms have significant relationships with faculty academic disciplines. Thisanalysis suggests an association rather than causality between core curriculumcontent and faculty members’ academic disciplines. Given the association wefound, schools that have more faculty members with doctorates in a specificacademic discipline appear to be more likely to have core curricula that containmore courses associated with that discipline. At the same time, the association offaculty background and core curriculum content may suggest that programswith an emphasis in certain academic content may attract faculty with similaracademic backgrounds. Therefore, if there is any causal relationship between afaculty’s academic background and the core curriculum content, it remainsambiguous and indeterminate. (See Table 2.)
Since more emphasis is placed on “economics & policy analysis” in MPPprograms (contrary to Hypothesis 1) and core faculty academic disciplines havea partial impact on core courses (partially supporting Hypothesis 2), weexamined the impact of core faculty disciplines on offering MPP programs andbeing APPAM members. In fact, all MPP programs are offered by APPAM-member schools, regardless of whether they belong only to APPAM or are dual-membership schools. According to ANOVA results in Table 3, among threemajor core faculty disciplines, economics and public administration areassociated with offering MPP programs and being APPAM members. Furtheranalysis (not shown) revealed that, in these programs, more faculty withdoctorates in economics or fewer faculty with doctorates in publicadministration were significantly associated with offering MPP programs andbeing APPAM members. (See Table 3.)

MPA vs. MPP: A Distinction Without a Difference?
406 Journal of Public Affairs Education
Tab
le 2
.A
NO
VA
Res
ult
s fo
r C
ore
Co
urs
es a
nd
Fac
ult
y’s
Aca
dem
ic D
isci
plin
es
Co
reFa
cult
y’s
Dis
cip
lines
Co
re C
ou
rses
(F-
Stat
isti
cs)
Eco
no
mic
s &
Polic
y A
nal
ysis
Fin
ance
&B
ud
get
ing
Polic
yPr
oce
ssPu
blic
Mn
gt
Org
aniz
atio
n &
Hu
man
Res
ou
rce
Mn
gt
Res
earc
hM
eth
od
s
Ove
rall
a
(70)
b
Eco
no
mic
s2.
04*
( 2.
14*)
f1.
02 (
1.73
*)1.
43 (
1.70
)1.
38 (
1.07
)2.
63**
( 5
.73*
**)
1.06
(1.
39)
Polit
ical
Sci
ence
1.48
(1.
70)
1.08
(1.
69*)
0.93
(1.
68)
1.14
(1.
41)
0.84
(1.
40)
0.58
(1.
35)
Pub
lic A
dm
inis
trat
ion
1.29
(1.
04)
0.79
(0.
85)
0.75
(1.
42)
1.35
(1.
51)
2.86
***
(2.6
2**)
0.89
(1.
15)
MPA
-On
lyc
(19)
Eco
no
mic
s0.
63 (
.084
)1.
05 (
0.93
)1.
93 (
1.40
)0.
26 (
0.35
)1.
71 (
1.23
)0.
96 (
0.68
)
Polit
ical
Sci
ence
1.13
(0.
87)
7.32
**(2
.26)
1.27
(1.
33)
0.66
(0.
74)
0.22
(0.
41)
1.77
(1.
27)
Pub
lic A
dm
inis
trat
ion
1.08
(0.
47)
0.89
(26
.00*
*)1.
31 (
4.11
)0.
67 (
6.44
*)2.
54 (
10.1
6*)
1.00
(2.
74)
MPP
-On
lyd
&M
PA/M
PPd
(20)
Eco
no
mic
s1.
06 (
4.60
)1.
25 (
1.85
)0.
54 (
1.64
)0.
92 (
6.29
)0.
50 (
342.
47**
*)0.
44 (
1.48
)
Polit
ical
Sci
ence
.040
(0.
94)
1.43
(1.
24)
0.85
(2.
55)
1.05
(2.
72)
0.91
(0.
56)
1.29
(1.
52)
Pub
lic A
dm
inis
trat
ion
2.33
(0.
47)
0.65
(0.
77)
0.62
(1.
07)
1.73
(1.
00)
1.03
(0.
86)
0.70
(1.
11)
MPA
-On
lye
(24)
Eco
no
mic
s0.
66 (
0.66
)1.
21 (
1.21
)0.
49 (
0.49
)0.
21 (
0.21
)10
.64*
** (
10.6
4***
)2.
20 (
2.20
)
Polit
ical
Sci
ence
2.86
* (2
.86*
)1.
42 (
1.42
)1.
66 (
1.66
)1.
29 (
1.29
)2.
62 (
2.62
)0.
89 (
0.89
)
Pub
lic A
dm
inis
trat
ion
2.96
* (2
.96*
)0.
87 (
0.87
)1.
63 (
1.63
)1.
10 (
1.10
)1.
32 (
1.32
)1.
09 (
1.09
)
No
te. *
p <
0.0
5 **
p <
0.0
1 **
*p <
0.0
01Si
gn
ific
ant
AN
OV
A r
esu
lts
may
ind
icat
e p
osi
tive
or
neg
ativ
e re
lati
on
ship
s. F
urt
her
an
alys
es w
ere
con
du
cted
to
det
erm
ine
the
dir
ecti
on
of
the
rela
tio
nsh
ips,
by
add
ing
th
e B
on
ferr
on
i op
tio
n t
o A
NO
VA
(se
e St
atac
orp
200
3, p
p. 1
08-1
09)
a. A
ll sc
ho
ols
wit
h W
eb s
ites
th
at p
rovi
ded
info
rmat
ion
ab
ou
t th
eir
core
fac
ult
y’s
dis
cip
lines
b. N
um
ber
of
sch
oo
lsc.
MPA
-on
ly-o
ffer
ing
sch
oo
ls a
mo
ng
du
al-m
emb
ersh
ip s
cho
ols
(i.e
., N
ASP
AA
an
d A
PPA
M)
d. M
PP-o
nly
-off
erin
g s
cho
ols
an
d b
oth
MPA
/MPP
-off
erin
g s
cho
ols
am
on
g d
ual
-mem
ber
ship
sch
oo
lse.
MPA
-on
ly-o
ffer
ing
sch
oo
ls a
mo
ng
du
al-m
emb
ersh
ip s
cho
ols
, am
on
g N
ASP
AA
-on
ly m
emb
ers
f. W
hen
join
t-ap
po
intm
ent
facu
lty
wer
e in
clu
ded

MPA vs. MPP: A Distinction Without a Difference?
Journal of Public Affairs Education 407
Tab
le 3
.A
NO
VA
Res
ult
s fo
r th
e A
sso
ciat
ion
Bet
wee
n C
ore
Fac
ult
y A
cad
emic
Dis
cip
lines
and
MPP
Pro
gra
m O
ffer
ing
or
APP
AM
Mem
ber
ship
Co
mp
aris
on
Co
re F
acu
lty
Aca
dem
ic D
isci
plin
es
Eco
no
mic
sPo
litic
al S
cien
cePu
blic
Ad
min
istr
atio
n
MPP
-Off
erin
g
MPA
-On
ly-O
ffer
ing
Am
on
g D
ual
-Mem
ber
ship
Sch
oo
ls (
19)
vs. M
PP-O
ffer
ing
Am
on
g D
ual
-Mem
ber
ship
Sch
oo
ls (
20)a
3.62
(4.5
7*)b
0.00
(0.9
7)5.
16*
(7.0
6*)
Acc
red
ited
MPA
-On
ly-O
ffer
ing
Am
on
g N
ASP
AA
-On
ly M
emb
ers
(24)
vs. M
PP-O
ffer
ing
Am
on
g D
ual
-Mem
ber
ship
Sch
oo
ls (
20)
25.3
9***
(45.
70**
*)0.
53(0
.06)
12.2
5**
(22.
16**
*)
Bec
om
ing
APP
AM
Mem
ber
sN
ASP
AA
-On
y M
emb
ers
(24)
vs. A
PPA
M M
emb
ersc
(40)
14.1
0***
(26.
62**
*)1.
26(0
.07)
4.49
*(1
1.47
**)
No
te. *
p <
0.0
5 **
p <
0.0
1 **
*p <
0.0
01Si
gn
ific
ant
AN
OV
A r
esu
lts
may
ind
icat
e p
osi
tive
or
neg
ativ
e re
lati
on
ship
s. F
urt
her
an
alys
es w
ere
con
du
cted
to
det
erm
ine
the
dir
ecti
on
of
the
rela
tio
nsh
ips,
by
add
ing
Bo
nfe
rro
ni o
pti
on
to
AN
OV
A (
see
Stat
aco
rp 2
003,
pp
. 108
-109
)a.
MPP
-on
ly-o
ffer
ing
sch
oo
ls a
nd
bo
th M
PP/M
PA-o
ffer
ing
sch
oo
lsb
. Wh
en jo
int-
app
oin
tmen
t fa
cult
y w
ere
incl
ud
edc.
APP
AM
-on
ly m
emb
ers
wer
e ex
clu
ded
fro
m t
he
anal
ysis
MPA vs. MPP: A Distinction Without a Difference?
408 Journal of Public Affairs Education
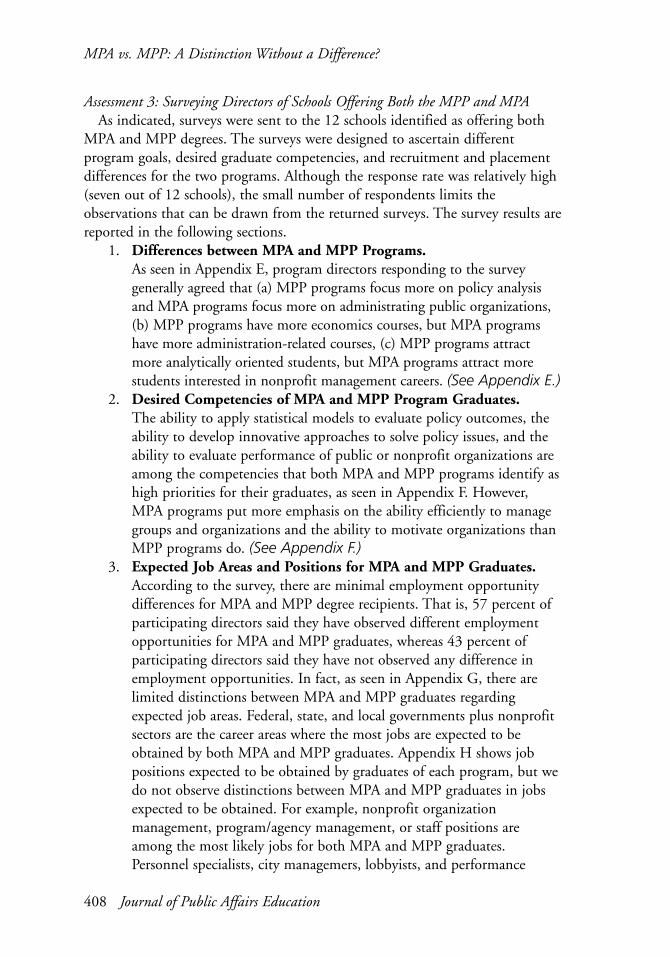
Assessment 3: Surveying Directors of Schools Offering Both the MPP and MPAAs indicated, surveys were sent to the 12 schools identified as offering both
MPA and MPP degrees. The surveys were designed to ascertain differentprogram goals, desired graduate competencies, and recruitment and placementdifferences for the two programs. Although the response rate was relatively high(seven out of 12 schools), the small number of respondents limits theobservations that can be drawn from the returned surveys. The survey results arereported in the following sections.
1. Differences between MPA and MPP Programs.As seen in Appendix E, program directors responding to the surveygenerally agreed that (a) MPP programs focus more on policy analysisand MPA programs focus more on administrating public organizations,(b) MPP programs have more economics courses, but MPA programshave more administration-related courses, (c) MPP programs attractmore analytically oriented students, but MPA programs attract morestudents interested in nonprofit management careers. (See Appendix E.)
2. Desired Competencies of MPA and MPP Program Graduates.The ability to apply statistical models to evaluate policy outcomes, theability to develop innovative approaches to solve policy issues, and theability to evaluate performance of public or nonprofit organizations areamong the competencies that both MPA and MPP programs identify ashigh priorities for their graduates, as seen in Appendix F. However,MPA programs put more emphasis on the ability efficiently to managegroups and organizations and the ability to motivate organizations thanMPP programs do. (See Appendix F.)
3. Expected Job Areas and Positions for MPA and MPP Graduates.According to the survey, there are minimal employment opportunitydifferences for MPA and MPP degree recipients. That is, 57 percent ofparticipating directors said they have observed different employmentopportunities for MPA and MPP graduates, whereas 43 percent ofparticipating directors said they have not observed any difference inemployment opportunities. In fact, as seen in Appendix G, there arelimited distinctions between MPA and MPP graduates regardingexpected job areas. Federal, state, and local governments plus nonprofitsectors are the career areas where the most jobs are expected to beobtained by both MPA and MPP graduates. Appendix H shows jobpositions expected to be obtained by graduates of each program, but wedo not observe distinctions between MPA and MPP graduates in jobsexpected to be obtained. For example, nonprofit organizationmanagement, program/agency management, or staff positions areamong the most likely jobs for both MPA and MPP graduates.Personnel specialists, city managemers, lobbyists, and performance

MPA vs. MPP: A Distinction Without a Difference?
Journal of Public Affairs Education 409
auditors are among the least likely jobs for both MPA and MPPgraduates to take. (See Appendix G and H.)
4. Major Reasons for Offering MPP Programs.Directors’ responses to the question of why they offer an MPP programare shown in Appendix I. Most directors indicated that they offer anMPP program to (a) be responsive to student career objectives, (b)attract students who are not interested in MPA programs, (c) respond tonational trends, and (d) be responsive to faculty interests. It isnoteworthy that they do not offer an MPP program to (a) attractspecific undergraduate majors, (b) create a more research-orienteddegree, (c) provide a steppingstone to a Ph.D., or (d) respond touniversity demands. (See Appendix I.)
SUMMARY AND CONCLUSION
In this study, we investigated in a comprehensive manner whether policy-oriented programs are different from administration-oriented programs; wefollowed up on previous studies — most of which argued that these twoorientations were becoming more integrated by adopting each other’s elementsinto their separate programs, and therefore creating an effect where there mightbe no difference between them (Lowery & Whitaker, 1994; De Soto et al.,1999). Previous empirical studies had compared NASPAA members withAPPAM members in terms of curricula or the psychological dispositions ofentering students, without considering dual-membership schools and that someschools have different master’s degrees. In this study, however, Assessments 1and 3 directly compared MPA programs with MPP programs from variousschool categories, in terms of (a) curricula, (b) desired competencies and jobsexpected to be obtained by program graduates, and (c) major reasons foroffering different programs. In Assessment 2, we examined the impact of corefaculty’s academic disciplinary backgrounds on (a) the programs’ corecurriculum emphases, (b) offering MPP programs, and (c) becoming APPAMmembers. Therefore, we could establish a more proper conclusion aboutwhether or not policy-oriented and administration-oriented programs are trulydifferent.
Above all, the findings of the curriculum comparison did not support thearguments of previous empirical studies, but instead confirmed theoreticalarguments (Elmore, 1986; Lowry & Whitaker, 1994) that policy-oriented andadministration-oriented schools are different in terms of their curricula.Although previous empirical studies indicated that differences between MPAand MPP programs were evaporating, this finding suggests that MPPs andMPAs are still different. Perhaps our analysis was conducted in a morecomprehensive and direct manner than those studies and, as a result, programdifferences might have become more apparent. Also, unlike previous studies —

MPA vs. MPP: A Distinction Without a Difference?
410 Journal of Public Affairs Education
which based their analyses on whether or not a certain course simply wasincluded in the curriculum — we compared curricula, based on the proportionof each disciplinary core. Therefore, we believe our approach to the question ofwhether MPA and MPP programs differ is more comprehensive than previousapproaches, and that it provides additional insights regarding the actualdifferences between these two programs.
Our study also suggests that the curriculum differences between MPA andMPP programs may not result from differences in the desired competencies andexpected placements of program graduates. Rather, the core faculty’s academicbackgrounds may play an important role in a university’s decision to offer anMPP program when it already has an MPA program, or to add an MPAprogram alongside an existing MPP program.
The findings of this study can be useful for universities, particularly when theyconsider whether or not to establish supplemental MPP or MPA programs. Itmight be appropriate for a university contemplating an additional programoffering to determine whether the motivation for the initiative is to (a) servedifferent students, (b) provide the educational background for additional careeropportunities or (c) simply is the result of the faculty’s desire to offer a programmore aligned with its dominant academic backgrounds and interests. If the latterconsideration seems to be the case, a name change or distinction adjustment tothe existing degree program may be more appropriate than adding a new one.
In conclusion, does the distinction between MPA and MPP programsrepresent a real difference? The answer is both yes and no. Overall curriculumcomparisons of MPA and MPP programs indicate modest differences inacademic content. However, the distinction between the two programs appearsto fade when both are offered by the same school or department. To insure ajustifiable distinction, it seems that the respective programs should possessdifferences in goals and desired student outcomes, rather than simply reflectdifferences that are associated with their core faculty’s academic disciplinarybackgrounds. Otherwise, there may be justification for the criticism that MPPprograms are not really distinct from MPA programs except in their names.13
REFERENCESAverch, H., & Dluhy, M. (1992). Teaching public administration, public management, and policy
analysis: Convergence or divergence in the master’s core? Journal of Policy Analysis andManagement, 11(3), 541-551.
Brewer, G..A., Facer, R.L., & O’Toole, L.J. (1999). What’s in a name? Comparing D.P.A. and Ph.D.programs. Journal of Public Affairs Education, 5(4), 309-317.
De Soto, W., Opheim, C., & Tajalli, H. (1999). Apples and oranges? Comparing the attitudes ofpublic policy versus public administration students. American Review of Public Administration,29(1), 77-91.
Denhardt, R. (2001). The big questions of public administration education. Public AdministrationReview, 61(5), 526-534.

MPA vs. MPP: A Distinction Without a Difference?
Journal of Public Affairs Education 411
Elmore, R.F. (1986). Graduate education in public management: Working the seams of government.Journal of Policy Analysis and Management, 6(1), 69-83.
Lowery, D., & Whitaker, G.P. (1994). Comparing public administration and policy analysisapproaches to public service education. American Review of Public Administration, 24(1), 25-41.
Roeder, P.W., & Whitaker, G. (1993). Education for the public service: Policy analysis andadministration in the MPA core curriculum. Administration and Society, 24(4), 512-540.
StataCorp. (2003). Stata Statistical Software: Release 8.0 (Vol. 3). College Station, TX: StataCorporation.
Stokes, D.E. (1986). Political and organizational analysis in the policy curriculum. Journal of PolicyAnalysis and Management, 6, 45-55.
Ventriss, C. (1991). Contemporary issues in American public administration education: The search foran educational focus. Public Administration Review, 51(1), 4-14.
FOOTNOTES1The Association for Public Policy and Management (APPAM) represents the policy analysis
movement. The National Association of Schools of Public Affairs and Administration (NASPAA)is broader-based, and includes many APPAM members, but it generally is more representative ofpublic administration (Lowery & Whitaker, 1994, p. 25).
2Two other areas of possible differences that De Soto et al. (1999) did not investigate were thedifferences in job placements for graduates of each program, and the differences in self-evaluationsby those in the workplace.
3The seven components were techniques of analysis, organization/management, political institutions,financial administration, economic institutions, legal institutions, and social institutions.
4Institutional-management programs allocate more time to political, social, and legal institutions andprocesses, as well as organization and management concepts. Analytical programs are characterizedby larger allocations of curriculum time to quantitative methods and statistics, financialadministration, and economic institutions and processes (Roeder & Whitaker, 1993, p. 535).
5It should be noted that, while NASPAA and APPAM member schools and departments principallyoffer MPA or MPP degrees, they may offer other master’s degrees, as in Master of Economic PolicyManagement, Master of Science in Urban Policy, or combination-type degrees, such as Master ofPublic Policy and Management.
6As seen in Appendix A, ANOVA results for programs offered by NASPAA members are either similaror different, depending on which sample is chosen. For example, only “economics and policyanalysis” core courses were significantly different in comparison B of Appendix A, which matchedMPA programs offered by NASPAA-only members to MPA programs offered by dual-membershipschools. In comparison C, which matched curricula of MPA programs offered by NASPAA-onlymembers to MPP programs offered by dual-membership schools, most courses were significantlydifferent.
7We used Stata statistical software to run an ANOVA. As the Stata manual (StataCorp, 2003)indicates, either a one-way ANOVA or t-test can be used to determine if the mean value of onevariable (e.g., the proportion of core courses in this study) is different, depending on anothervariable (e.g., MPA or MPP programs in this study).
8The number of dual-membership schools was 60, as of November 1, 2005. Among these, seven wereexcluded due to having different master’s degrees, such as a Master’s of Public Policy andManagement, or an MS in Urban Policy Analysis and Management, etc. (See Appendix B).Among the remaining 53 dual-membership schools, 32 offered MPA programs only, nine offeredMPP programs only, and 12 offered both MPA and MPP programs.

MPA vs. MPP: A Distinction Without a Difference?
412 Journal of Public Affairs Education
9They are faculty members who mainly are assigned to the department (or school). Roeder andWhitaker (1993) call them full-time nucleus faculty.
10They are research faculty, adjunct faculty, affiliated faculty, faculty of practice, visiting faculty,lecturers, and faculty emeriti.
11We could identify core faculty’s academic backgrounds for all nine dual-membership schools thatprovided only MPP programs, and all 12 dual-membership schools that provided both MPA andMPP programs. However, among 33 dual-membership schools that offered only MPA programs(See Appendix B), only 18 schools provided information on their Web sites about the core faculty’sacademic backgrounds. For 30 NASPAA-only members that offered only MPA programs, wechecked the core faculty’s academic backgrounds, as well as the composition of their curricula.These 30 schools were randomly selected from 147 MPA programs accredited by NASPAA (as ofSeptember 1, 2005).
12Questions in the survey mainly were focused on similarities and differences between MPA and MPPprograms, so we chose the schools that offered both programs, and that were most capable ofanswering the questions. For example, in the survey, we asked, “Which of the following describesthe distinguishing difference between your MPA and MPP programs?” Out of the 12 schools thatoffered both programs, the University of Delaware offered MPA and MA programs in urban affairsand public policy, and the University of Pittsburgh offered MPA and MA programs in publicpolicy and management.
13Brewer, Facer, and O’Toole (1999) argued that Ph.D. and Doctor of Public Administration (D.P.A.)programs are merely distinctions without a difference.
AUTHORS’ NOTE
We wish to acknowledge the earlier contributions of Gabriela Wolfson onrelated research.
Yongbeom Hur is an assistant professor of public administration in theDepartment of Government and Justice Studies at Appalachian State University.His teaching and research interests include human resource management,research methods, and a quantitative approach to public management.
Merl Hackbart is a professor of finance and public administration at theUniversity of Kentucky. His research focuses on public financial management,budgeting, and debt management.

MPA vs. MPP: A Distinction Without a Difference?
Journal of Public Affairs Education 413
Ap
pen
dix
A.
An
alys
is o
f V
aria
nce
(A
NO
VA
) R
esu
lts
for
Cu
rric
ulu
m C
om
par
iso
ns
Bet
wee
n M
PA a
nd
MPP
Pro
gra
ms
Off
ered
by
NA
SPA
A, A
PPA
M, o
r D
ual
-Mem
ber
ship
Sch
oo
lsa
VA
RIO
US
CO
MPA
RIS
ON
SEc
on
om
ics
&Fi
nan
ce &
Polic
yPu
blic
Org
aniz
atio
nR
esea
rch
Polic
y A
nal
ysis
Bu
dg
etin
gPr
oce
ssM
anag
emen
t&
HR
Mb
Met
ho
d
AM
PAPr
og
ram
Off
ered
by
NA
SPA
A-o
nly
Mem
ber
s vs
.36
.22*
**6.
26*
2.11
0.53
18.8
6***
0.16
Bo
th M
PA &
MPP
Pro
gra
ms
Off
ered
by
Du
al M
emb
ers
BM
PAPr
og
ram
Off
ered
by
NA
SPA
A-o
nly
Mem
ber
s vs
.18
.98*
**0.
750.
610.
433.
380.
59M
PA P
rog
ram
Off
ered
by
Du
al M
emb
ers
CM
PAPr
og
ram
Off
ered
by
NA
SPA
A-o
nly
Mem
ber
s vs
.62
.63*
**13
.08*
**5.
19*
6.57
*34
.03*
**0.
00M
PP P
rog
ram
Off
ered
by
Du
al M
emb
ers
No
te. *
p <
0.0
5 **
p <
0.0
1 **
*p <
0.0
01a.
Du
al-m
emb
ersh
ip s
cho
ols
bel
on
g t
o b
oth
NA
SPA
A a
nd
APP
AM
b. “
HR
M”
is H
um
an R
eso
urc
es M
anag
emen
t

MPA vs. MPP: A Distinction Without a Difference?
414 Journal of Public Affairs Education
Sch
oo
ls w
ith
Du
al M
emb
ersh
ipM
PA/M
PPM
PAM
PPO
ther
Pro
gra
mR
emar
ks(A
PPA
M &
NA
SPA
A)
Off
ered
On
lyO
nly
Off
ered
Am
eric
an U
niv
ersi
ty•
Ari
zon
a St
ate
Un
iver
sity
•
Bar
uch
Co
lleg
eC
ity
Un
iver
sity
of
NY
•
Bro
wn
Un
iver
sity
•
Car
neg
ie M
ello
n U
niv
ersi
tyM
aste
r o
f Pu
blic
Po
licy
& M
gm
t
Co
lleg
e o
f W
illia
m &
Mar
y•
Co
lum
bia
Un
iver
sity
•M
aste
r o
f Ec
on
om
ic P
olic
y M
anag
emen
t
Co
rnel
l Un
iver
sity
•
Du
ke U
niv
ersi
ty•
Flo
rid
a In
t’l U
niv
ersi
ty•
Geo
rge
Mas
on
Un
iver
sity
•
Geo
rge
Was
hin
gto
n U
niv
.•
Geo
rget
ow
n U
niv
ersi
ty•
Mas
ter
of
Polic
y M
anag
emen
t
Geo
rgia
Inst
itu
te o
f Te
chn
olo
gy
•M
S in
Pu
blic
Po
licy
Geo
rgia
Sta
te U
niv
ersi
ty•
Har
vard
Un
iver
sity
•
Ap
pen
dix
B.
Pro
gra
ms
Off
ered
by
Du
al-M
emb
ersh
ip S
cho
ols
a
No
te. a
= D
ual
-mem
ber
ship
sch
oo
ls b
elo
ng
to
bo
th N
ASP
AA
an
d A
PPA
MSo
urc
es: A
PPA
M, h
ttp
://w
ww
.ap
pam
.org
; NA
SPA
A, h
ttp
://w
ww
.nas
paa
.org
, an
d e
ach
sch
oo
l’s W
eb s
ite
as o
f O
ct. 1
5, 2
005.
“Rem
arks
” co
lum
n p
rovi
des
su
pp
lem
enta
l in
form
atio
n r
egar
din
g M
PA &
MPP
Pro
gra
ms
Co
nti
nu
ed

MPA vs. MPP: A Distinction Without a Difference?
Journal of Public Affairs Education 415
Sch
oo
ls w
ith
Du
al M
emb
ersh
ipM
PA/M
PPM
PAM
PPO
ther
Pro
gra
mR
emar
ks(A
PPA
M &
NA
SPA
A)
Off
ered
On
lyO
nly
Off
ered
Ind
ian
a U
niv
ersi
ty•
Mas
ter
of
Pub
lic A
ffai
rs
Ind
ian
a U
niv
ersi
ty-
Perd
ue
Un
iver
sity
, In
dia
nap
olis
•M
aste
r o
f Pu
blic
Aff
airs
Iow
a St
ate
Un
iver
sity
•
Joh
ns
Ho
pki
ns
Un
iver
sity
•M
A in
Pu
blic
Po
licy
Ken
t St
ate
Un
iver
sity
•
New
Sch
oo
l Un
iver
sity
MS
in U
rban
Po
licy
An
alys
is &
Man
agem
ent
New
Yo
rk U
niv
ersi
ty•
Oh
io S
tate
Un
iver
sity
•
Pen
nsy
lvan
ia S
tate
Un
iv.
•
Prin
ceto
n U
niv
ersi
ty•
Ru
tger
s, t
he
Stat
eU
niv
ersi
ty o
f N
ew J
erse
y•
Syra
cuse
Un
iver
sity
•
Texa
s A
&M
Un
iver
sity
•
Un
iv. a
t A
lban
y -
SUN
Y•
Un
iver
sity
of
Ark
ansa
s•
Ap
pen
dix
B.
Pro
gra
ms
Off
ered
by
Du
al-M
emb
ersh
ip S
cho
ols
a
No
te. a
= D
ual
-mem
ber
ship
sch
oo
ls b
elo
ng
to
bo
th N
ASP
AA
an
d A
PPA
MSo
urc
es: A
PPA
M, h
ttp
://w
ww
.ap
pam
.org
; NA
SPA
A, h
ttp
://w
ww
.nas
paa
.org
, an
d e
ach
sch
oo
l’s W
eb s
ite
as o
f O
ct. 1
5, 2
005
“Rem
arks
” co
lum
n p
rovi
des
su
pp
lem
enta
l in
form
atio
n r
egar
din
g M
PA &
MPP
Pro
gra
ms
Co
nti
nu
ed

MPA vs. MPP: A Distinction Without a Difference?
416 Journal of Public Affairs Education
Sch
oo
ls w
ith
Du
al M
emb
ersh
ipM
PA/M
PPM
PAM
PPO
ther
Pro
gra
mR
emar
ks(A
PPA
M &
NA
SPA
A)
Off
ered
On
lyO
nly
Off
ered
Un
iver
sity
of
Ari
zon
a•
Un
iver
sity
of
Cal
ifo
rnia
-LA
•D
ept.
of
Pub
lic P
olic
y
Un
iver
sity
of
Ch
icag
o•
Un
iver
sity
of
Cin
cin
nat
i•
MA
in P
olit
ical
Sci
ence
Un
iv. o
f C
olo
rad
o-D
enve
r•
MA
in P
olit
ical
Sci
ence
Un
iver
sity
of
Del
awar
e•
MA
in U
rban
Aff
airs
& P
ub
lic P
olic
y
Un
iver
sity
of
Geo
rgia
•
Un
iver
sity
of
Illin
ois
•
Un
iver
sity
of
Ken
tuck
y•
Un
iver
sity
of
Mar
ylan
d-
•B
alti
mo
re C
ou
nty
U. o
f M
d.-
Co
lleg
e Pa
rk•
Un
iver
sity
of
Mas
s.-A
mh
erst
Mas
ter
of
Pub
lic P
olic
y &
Ad
min
Un
iver
sity
of
Mas
s.-B
ost
on
MS
in P
ub
lic A
ffai
rs
Un
iver
sity
of
Mic
hig
an•
Un
iver
sity
of
Min
nes
ota
•
U. o
f M
isso
uri
-Co
lum
bia
•
Ap
pen
dix
B.
Pro
gra
ms
Off
ered
by
Du
al-M
emb
ersh
ip S
cho
ols
a
No
te. a
= D
ual
-mem
ber
ship
sch
oo
ls b
elo
ng
to
bo
th N
ASP
AA
an
d A
PPA
MSo
urc
es: A
PPA
M, h
ttp
://w
ww
.ap
pam
.org
; NA
SPA
A, h
ttp
://w
ww
.nas
paa
.org
, an
d e
ach
sch
oo
l’s W
eb s
ite
as o
f O
ct. 1
5, 2
005.
“Rem
arks
” co
lum
n p
rovi
des
su
pp
lem
enta
l in
form
atio
n r
egar
din
g M
PA &
MPP
Pro
gra
ms
Co
nti
nu
ed

MPA vs. MPP: A Distinction Without a Difference?
Journal of Public Affairs Education 417
Sch
oo
ls w
ith
Du
al M
emb
ersh
ipM
PA/M
PPM
PAM
PPO
ther
Pro
gra
mR
emar
ks(A
PPA
M &
NA
SPA
A)
Off
ered
On
lyO
nly
Off
ered
U. o
f M
isso
uri
-St.
Lo
uis
Mas
ter
of
Pub
lic P
olic
y &
Ad
min
Un
iv. o
f N
ebra
ska-
Om
aha
•
Un
iv. o
f N
C-C
hap
el H
ill•
Un
iv. o
f N
C-C
har
lott
e•
Un
iv. o
f Pe
nn
sylv
ania
•M
aste
r o
f G
ov’
t A
dm
inis
trat
ion
Un
iver
sity
of
Pitt
sbu
rgh
•M
aste
r o
f Pu
blic
Po
licy
& M
gm
t
Un
iv. o
f So
uth
ern
Cal
ifo
rnia
•
Un
iv. o
f So
uth
ern
Mai
ne
Mas
ter
of
Pub
lic P
olic
y &
Mg
mt
Un
iver
sity
of
Texa
s-A
ust
in•
Mas
ter
of
Pub
lic A
ffai
rs
Un
iver
sity
of
Texa
s-D
alla
s•
Mas
ter
of
Pub
lic A
ffai
rs
Un
iver
sity
of
Was
hin
gto
n•
U. o
f W
isco
nsi
n-M
adis
on
•M
aste
r o
f Pu
blic
Aff
airs
Vir
gin
ia C
om
mo
nw
ealt
hU
niv
ersi
ty•
Tota
l (60
Sch
oo
ls)
1233
96
Ap
pen
dix
B.
Pro
gra
ms
Off
ered
by
Du
al-M
emb
ersh
ip S
cho
ols
a
No
te. a
= D
ual
-mem
ber
ship
sch
oo
ls b
elo
ng
to
bo
th N
ASP
AA
an
d A
PPA
MSo
urc
es: A
PPA
M, h
ttp
://w
ww
.ap
pam
.org
; NA
SPA
A, h
ttp
://w
ww
.nas
paa
.org
, an
d e
ach
sch
oo
l’s W
eb s
ite
as o
f O
ct. 1
5, 2
005.
“Rem
arks
” co
lum
n p
rovi
des
su
pp
lem
enta
l in
form
atio
n r
egar
din
g M
PA &
MPP
Pro
gra
ms
MPA vs. MPP: A Distinction Without a Difference?
418 Journal of Public Affairs Education
Mem
ber
ship
Pro
gra
m O
ffer
ed(N
o. o
f Sc
ho
ols
An
alyz
ed)
Co
re C
ou
rse
Are
as (
%)a
Eco
no
mic
s &
Polic
y A
nal
ysis
Fin
ance
&B
ud
get
ing
Polic
yPr
oce
ssPu
blic
Mg
mt
Org
aniz
atio
n&
HR
Mb
Res
earc
hM
eth
od
sO
ther
s
Du
al-
Mem
ber
ship
Sch
oo
ls
(NA
SPA
A &
APP
AM
)
MPA
On
ly (
32)
14.9
11.7
12.5
14.9
12.7
18.1
15.2
MPP
On
ly (
9)30
.04.
519
.44.
57.
523
.910
.4
MPA
of
MPA
& M
PP O
ffer
ed (
12)
21.6
10.8
9.6
9.6
3.6
21.6
23.4
MPP
of
MPA
& M
PP O
ffer
ed (
12)
27.6
6.6
14.5
7.9
2.6
20.2
20.6
No
n-D
ual
-
Mem
ber
ship
Sch
oo
ls
(NA
SPA
A O
nly
)
MPA
On
ly (
30)
5.6
14.5
8.9
13.5
15.6
20.5
21.8
Ap
pen
dix
C.
Cu
rric
ulu
m C
om
po
siti
on
of
Co
re C
ou
rses
No
te. a
. Per
cen
tag
e o
f ea
ch c
ateg
ory
= (
cred
it h
ou
rs o
f ea
ch c
ateg
ory
/cre
dit
ho
urs
of
all c
ateg
ori
es)
* 10
0b
. “H
RM
” is
Hu
man
Res
ou
rces
Man
agem
ent

MPA vs. MPP: A Distinction Without a Difference?
Journal of Public Affairs Education 419
Ap
pen
dix
D.
Aca
dem
ic B
ackg
rou
nd
s o
f C
ore
Fac
ult
y
Mem
ber
ship
Pro
gra
m O
ffer
ed(N
o. o
f Sc
ho
ols
)
Facu
lty
Mem
ber
s’ D
oct
ora
l Deg
rees
(%
)a
Eco
no
mic
sbPo
litic
al S
cien
cePu
blic
Ad
min
istr
atio
nc
Oth
ers
Du
al-M
emb
ersh
ip S
cho
ols
(NA
SPA
A &
APP
AM
)
MPA
-On
ly(1
9)13
.5d
(18.
0)e
21.3
(22
.2)
36.7
(26
.8)
28.5
(34
.0)
MPP
-On
ly(9
)32
.2 (
26.8
)16
.7 (
21.2
)18
.9 (
7.2)
32.2
(44
.8)
MPA
& M
PP(1
2)23
.3 (
26.3
)20
.3 (
23.8
)10
.9 (
6.2)
45.5
(43
.7)
No
n-D
ual
Mem
ber
ship
Sch
oo
ls(N
ASP
AA
-Acc
red
ited
On
ly)
MPA
-On
ly(3
0)2.
7f15
.617
.264
.5
No
te. a
. Per
cen
tag
e =
(N
o. o
f ea
ch d
isci
plin
e/to
tal n
um
ber
of
all c
ore
fac
ult
y w
ith
a d
oct
ora
te)
* 10
0b
. Pu
blic
fin
ance
is in
clu
ded
c. P
ub
lic p
olic
y is
incl
ud
edd
. Per
cen
tag
e b
efo
re in
clu
din
g f
acu
lty
of
join
t ap
po
intm
ent
e. P
erce
nta
ge
afte
r in
clu
din
g f
acu
lty
of
join
t ap
po
intm
ent
f. P
erce
nta
ge
afte
r in
clu
din
g f
acu
lty
of
join
t ap
po
intm
ent

MPA vs. MPP: A Distinction Without a Difference?
420 Journal of Public Affairs Education
Ap
pen
dix
E.
Dif
fere
nce
s B
etw
een
MPA
an
d M
PP P
rog
ram
s
Wh
ich
of
the
follo
win
g d
escr
ibes
th
e d
isti
ng
uis
hin
g d
iffe
ren
ce b
etw
een
yo
ur
MPA
an
d M
PP p
rog
ram
s?St
ron
gly
Dis
agre
eD
isag
ree
I Am
No
t Su
reA
gre
eSt
ron
gly
Ag
ree
The
MPP
pro
gra
m f
ocu
ses
mo
re o
n p
olic
y an
alys
is t
han
th
e M
PA p
rog
ram
.14
% (
1)0%
(0)
0% (
0)57
% (
4)29
% (
2)
The
MPA
pro
gra
m f
ocu
ses
mo
re o
n t
he
adm
inis
trat
ion
of
pu
blic
org
aniz
atio
ns
than
th
e M
PP p
rog
ram
.29
% (
2)14
% (
1)0%
(0)
43%
(3)
14%
(1)
The
MPP
pro
gra
m h
as a
gre
ater
em
ph
asis
on
res
earc
h c
ou
rsew
ork
th
an t
he
MPA
pro
gra
m.
0% (
0)43
% (
3)0%
(0)
29%
(2)
29%
(2)
The
MPP
pro
gra
m h
as m
ore
eco
no
mic
s co
urs
ewo
rk t
han
th
e M
PA P
rog
ram
.29
% (
2)0%
(0)
0% (
0)29
% (
2)43
% (
3)
The
MPA
cu
rric
ulu
m in
clu
des
mo
re a
dm
inis
trat
ion
-rel
ated
co
urs
es (
per
son
nel
mg
mt,
fin
anci
al m
gm
t, e
tc.)
th
an t
he
MPP
pro
gra
m.
14%
(1)
14%
(1)
0% (
0)43
% (
3)29
% (
2)
The
MPP
deg
ree
has
few
er c
ou
rse
req
uir
emen
ts t
han
th
e M
PA p
rog
ram
.29
% (
2)29
% (
2)0%
(0)
29%
(2)
14%
(1)
The
MPP
pro
gra
m a
ttra
cts
mo
re a
nal
ytic
ally
ori
ente
d s
tud
ents
th
an t
he
MPA
pro
gra
m.
0% (
0)14
% (
1)29
% (
2)57
% (
4)0%
(0)
The
MPP
pro
gra
m a
ttra
cts
mo
re s
tud
ents
wh
o m
ajo
red
in e
con
om
ics
than
th
eM
PA p
rog
ram
.14
% (
1)14
% (
1)43
% (
3)14
% (
1)0%
(0)
The
MPP
pro
gra
m a
ttra
cts
mo
re s
tud
ents
wh
o m
ajo
red
in p
olit
ical
sci
ence
th
anth
e M
PA p
rog
ram
.14
% (
1)29
% (
2)57
% (
4)0%
(0)
0% (
0)
The
MPA
pro
gra
m a
ttra
cts
mo
re s
tud
ents
fro
m d
iver
se u
nd
erg
rad
uat
e m
ajo
rs(a
rts,
sci
ence
s, h
ealt
h, e
tc.)
th
an t
he
MPP
pro
gra
m.
43%
(3)
0% (
0)57
% (
4)0%
(0)
0% (
0)
The
MPA
pro
gra
m a
ttra
cts
mo
re s
tud
ents
inte
rest
ed in
no
np
rofi
t m
anag
emen
tca
reer
s th
an t
he
MPP
pro
gra
m.
14%
(1)
14%
(1)
29%
(2)
43%
(3)
0% (
0)
No
te. R
esp
on
den
t n
um
ber
s ar
e in
par
enth
eses
.Th
e h
igh
est
per
cen
tag
e o
f re
spo
nse
s fo
r ea
ch q
ues
tio
n is
mar
ked
in b
old
face
.

MPA vs. MPP: A Distinction Without a Difference?
Journal of Public Affairs Education 421
Ap
pen
dix
F.
Prio
rity
Co
mp
eten
cies
fo
r M
PA a
nd
MPP
Pro
gra
ms
Plea
se r
ate
the
follo
win
g c
om
pet
enci
es t
hat
yo
ur
MPA
/MPP
pro
gra
ms
are
likel
y to
aim
fo
r:Lo
wPr
iori
tyM
idd
lePr
iori
tyH
igh
Prio
rity
Ab
ility
to
eff
icie
ntl
y m
anag
e g
rou
ps
and
org
aniz
atio
ns
MPA
MPP
0% (
0)57
% (
4)14
% (
1)29
% (
2)86
% (
6)14
% (
1)
Ab
ility
to
mo
tiva
te o
rgan
izat
ion
sM
PAM
PP0%
(0)
43%
(3)
43%
(3)
43%
(3)
57%
(4)
14%
(1)
Ab
ility
to
ap
ply
sta
tist
ical
mo
del
s to
eva
luat
e p
olic
y o
utc
om
esM
PAM
PP14
% (
1)14
% (
1)43
% (
3)29
% (
2)43
% (
3)57
% (
4)
Ab
ility
to
an
alyz
e fi
nan
cial
sta
tem
ents
MPA
MPP
29%
(2)
29%
(2)
14%
(1)
57%
(4)
57%
(4)
14%
(1)
Ab
ility
to
dev
elo
p in
no
vati
ve a
pp
roac
hes
to
so
lve
po
licy
issu
esM
PAM
PP14
% (
1)0%
(0)
43%
(3)
14%
(1)
43%
(3)
86%
(6)
Ab
ility
to
eva
luat
e p
erfo
rman
ce o
f p
ub
lic o
r n
on
pro
fit
org
aniz
atio
ns
MPA
MPP
0% (
0)14
% (
1)43
% (
3)29
% (
2)57
% (
4)57
% (
4)
Ab
ility
to
co
mm
un
icat
e ef
fect
ivel
y w
ith
co
nst
itu
enci
es in
th
e g
ener
al p
ub
licM
PAM
PP0%
(0)
0% (
0)29
% (
2)71
% (
5)71
% (
5)29
% (
2)
Ab
ility
to
res
olv
e d
isp
ute
s am
on
g in
div
idu
als
MPA
MPP
14%
(1)
50%
(3)
71%
(5)
50%
(3)
14%
(1)
0% (
0)
No
te. R
esp
on
den
t n
um
ber
s ar
e in
par
enth
eses
.Th
e h
igh
est
per
cen
tag
e o
f re
spo
nse
s fo
r ea
ch q
ues
tio
n is
mar
ked
in b
old
face
.Se
ven
res
po
nd
ents
did
no
t an
swer
all
the
qu
esti
on
s.

MPA vs. MPP: A Distinction Without a Difference?
422 Journal of Public Affairs Education
Ap
pen
dix
G.
Exp
ecte
d E
mp
loym
ent
Are
as f
or
MPA
an
d M
PP G
rad
uat
es
Plea
se in
dic
ate
the
per
cen
t o
f yo
ur
MPA
/MPP
gra
du
ates
wh
o f
ind
em
plo
ymen
tin
th
e fo
llow
ing
are
as (
incl
ud
ing
fu
rth
er e
du
cati
on
):Le
ss t
han
10%
10–2
0%20
–30%
Mo
re t
han
30%
Fed
eral
Go
vern
men
tM
PAM
PP17
% (
1)20
% (
1)17
% (
1)0%
(0)
17%
(1)
40%
(2)
50%
(3)
40%
(2)
Stat
e G
ove
rnm
ent
MPA
MPP
0% (
0)0%
(0)
40%
(2)
40%
(2)
60%
(3)
60%
(3)
0% (
0)0%
(0)
Loca
l Go
vern
men
tM
PAM
PP17
% (
1)0%
(0)
33%
(2)
60%
(3)
50%
(3)
40%
(2)
0% (
0)0%
(0)
No
np
rofi
t Se
cto
rM
PAM
PP17
% (
1)0%
(0)
17%
(1)
20%
(1)
66%
(4)
60%
(3)
0% (
0)20
% (
1)
Priv
ate
Sect
or
MPA
MPP
67%
(4)
20%
(1)
33%
(2)
60%
(3)
0% (
0)20
% (
1)0%
(0)
0% (
0)
Furt
her
Gra
du
ate
Edu
cati
on
(Ph
.D.,
Ed.D
., et
c.)
MPA
MPP
80%
(4)
40%
(2)
20%
(1)
60%
(3)
0% (
0)0%
(0)
0% (
0)0%
(0)
Pro
fess
ion
al E
du
cati
on
(e.
g. L
aw)
MPA
MPP
100%
(5)
100%
(5)
0% (
0)0%
(0)
0% (
0)0%
(0)
0% (
0)0%
(0)
Oth
erM
PAM
PP50
% (
1)10
0% (
1)0%
(0)
0% (
0)50
% (
1)0%
(0)
0% (
0)0%
(0)
No
te. R
esp
on
den
t n
um
ber
s ar
e in
par
enth
eses
.Th
e h
igh
est
per
cen
tag
e o
f re
spo
nse
s fo
r ea
ch q
ues
tio
n is
mar
ked
in b
old
face
.Se
ven
res
po
nd
ents
did
no
t an
swer
all
the
qu
esti
on
s.

MPA vs. MPP: A Distinction Without a Difference?
Journal of Public Affairs Education 423
Ap
pen
dix
H.
Exp
ecte
d J
ob
Po
siti
on
s fo
r M
PA a
nd
MPP
Gra
du
ates
Plea
se in
dic
ate
(or
esti
mat
e) t
he
typ
es o
f jo
b p
osi
tio
n o
r fu
rth
er e
du
cati
on
al o
pp
ort
un
itie
sth
at y
ou
r M
PA/M
PP d
egre
e-re
cip
ien
ts a
re li
kely
to
tak
e g
iven
pla
cem
ents
in t
he
pas
t fi
ve y
ears
.Le
ss t
han
10%
10–2
0%20
–30%
Mo
re t
han
30%
Bu
dg
et A
nal
ysts
MPA
MPP
0% (
0)20
% (
1)40
% (
2)60
% (
3)60
% (
3)20
% (
1)0%
(0)
0% (
0)
Pers
on
nel
Sp
ecia
lists
MPA
MPP
40%
(2)
80%
(4)
40%
(2)
20%
(1)
20%
(1)
0% (
0)0%
(0)
0% (
0)
Cit
y M
anag
emen
tM
PAM
PP20
% (
1)75
% (
3)40
% (
2)25
% (
1)20
% (
1)0%
(0)
0% (
0)0%
(0)
No
np
rofi
t O
rgan
izat
ion
Man
agem
ent
MPA
MPP
20%
(1)
20%
(1)
20%
(1)
20%
(1)
60%
(3)
40%
(2)
0% (
0)20
% (
1)
Polic
y A
nal
ysts
MPA
MPP
20%
(1)
0% (
0)20
% (
1)20
% (
1)40
% (
2)40
% (
2)0%
(0)
40%
(2)
Lob
byi
sts
MPA
MPP
20%
(1)
60%
(3)
0% (
1)40
% (
2)20
% (
1)0%
(0)
0% (
0)0%
(0)
Res
earc
her
sM
PAM
PP20
% (
1)0%
(0)
40%
(2)
40%
(2)
20%
(1)
60%
(3)
0% (
0)0%
(0)
Perf
orm
ance
Au
dit
ors
(e.
g. G
AO
)M
PAM
PP20
% (
1)40
% (
2)40
% (
2)40
% (
2)20
% (
1)20
% (
1)0%
(0)
0% (
0)
Pro
gra
m/A
ng
ency
Man
agem
ent
MPA
MPP
17%
(1)
40%
(2)
33%
(2)
20%
(1)
50%
(3)
40%
(2)
0% (
0)0%
(0)
Pro
gra
m/A
ng
ency
Sta
ffM
PAM
PP17
% (
1)20
% (
1)33
% (
2)40
% (
2)50
% (
3)40
% (
2)0%
(0)
0% (
0)
Do
cto
ral S
tud
ents
MPA
MPP
100%
(1)
40%
(2)
0% (
0)60
% (
3)0%
(0)
0% (
0)0%
(0)
0% (
0)
Law
Sch
oo
lM
PAM
PP10
0% (
1)10
0% (
5)0%
(0)
0% (
0)0%
(0)
0% (
0)0%
(0)
0% (
0)
Oth
erM
PAM
PP10
0% (
1)10
0% (
1)0%
(0)
0% (
0)0%
(0)
0% (
0)0%
(0)
0% (
0)
No
te. R
esp
on
den
t n
um
ber
s ar
e in
par
enth
eses
.Th
e h
igh
est
per
cen
tag
e o
f re
spo
nse
s fo
r ea
ch q
ues
tio
n is
mar
ked
in b
old
face
.Se
ven
res
po
nd
ents
did
no
t an
swer
all
the
qu
esti
on
s.

MPA vs. MPP: A Distinction Without a Difference?
424 Journal of Public Affairs Education
Ap
pen
dix
I.M
ajo
r R
easo
ns
for
Esta
blis
hin
g a
n M
PP P
rog
ram
Wh
at a
re t
he
maj
or
reas
on
s fo
r es
tab
lish
ing
yo
ur
MPP
pro
gra
m?
Stro
ng
lyD
isag
ree
Dis
agre
eI A
mN
ot
Sure
Ag
ree
Stro
ng
lyA
gre
e
To b
e re
spo
nsi
ve t
o s
tud
ent
care
er o
bje
ctiv
es.
0% (
0)0%
(0)
17%
(1)
33%
(2)
50%
(3)
To a
ttra
ct s
tud
ents
no
t in
tere
sted
in M
PA.
14%
(1)
14%
(1)
14%
(1)
0% (
0)57
% (
4)
To c
reat
e a
mo
re r
esea
rch
-ori
ente
d p
ub
lic p
olic
y d
egre
e.0%
(0)
43%
(3)
0% (
0)29
% (
2)29
% (
2)
To p
rovi
de
a st
epp
ing
sto
ne
for
do
cto
ral s
tud
ies.
43%
(3)
29%
(2)
0% (
0)14
% (
1)14
% (
1)
To a
ttra
ct s
tud
ents
wit
h s
pec
ific
un
der
gra
du
ate
maj
ors
.86
% (
6)14
% (
1)0%
(0)
0% (
0)0%
(0)
To m
eet
un
iver
sity
dem
and
s.57
% (
4)14
% (
1)0%
(0)
14%
(1)
14%
(1)
To b
e re
spo
nsi
ve t
o a
lum
ni a
nd
em
plo
yer
sug
ges
tio
ns.
29%
(2)
29%
(2)
0% (
0)43
% (
3)0%
(0)
To r
esp
on
d t
o n
atio
nal
tre
nd
s re
gar
din
g d
egre
e o
ffer
ing
s.0%
(0)
14%
(1)
14%
(1)
43%
(3)
29%
(2)
To b
e re
spo
nsi
ve t
o f
acu
lty
inte
rest
s an
d c
apab
iliti
es.
0% (
0)0%
(0)
14%
(1)
57%
(4)
29%
(2)
No
te: R
esp
on
den
t n
um
ber
s ar
e in
par
enth
eses
.Th
e h
igh
est
per
cen
tag
e o
f re
spo
nse
s fo
r ea
ch q
ues
tio
n is
mar
ked
in b
old
face
.