moving beyond the automobile · moving beyond the automobile: ... (22%) complete • ... grade...
TRANSCRIPT

1
Public Works
Moving Beyond The Automobile: Bellingham’s Multimodal Transportation Concurrency Program
Olympia, WA - January 13, 2016
2
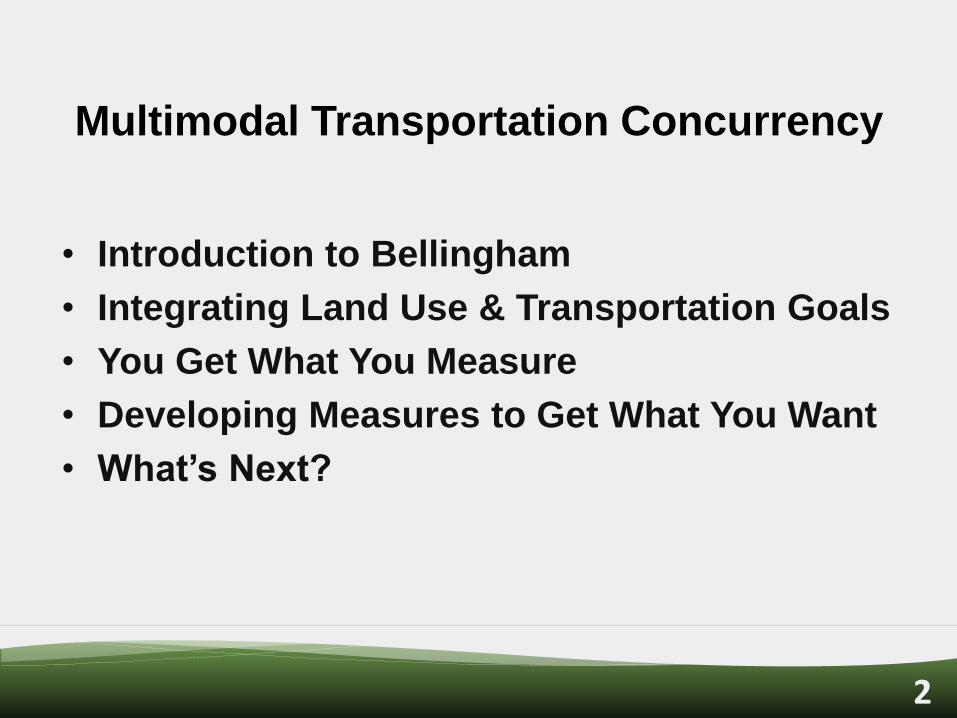
Multimodal Transportation Concurrency
• Introduction to Bellingham
• Integrating Land Use & Transportation Goals
• You Get What You Measure
• Developing Measures to Get What You Want
• What’s Next?
3 Slide 3
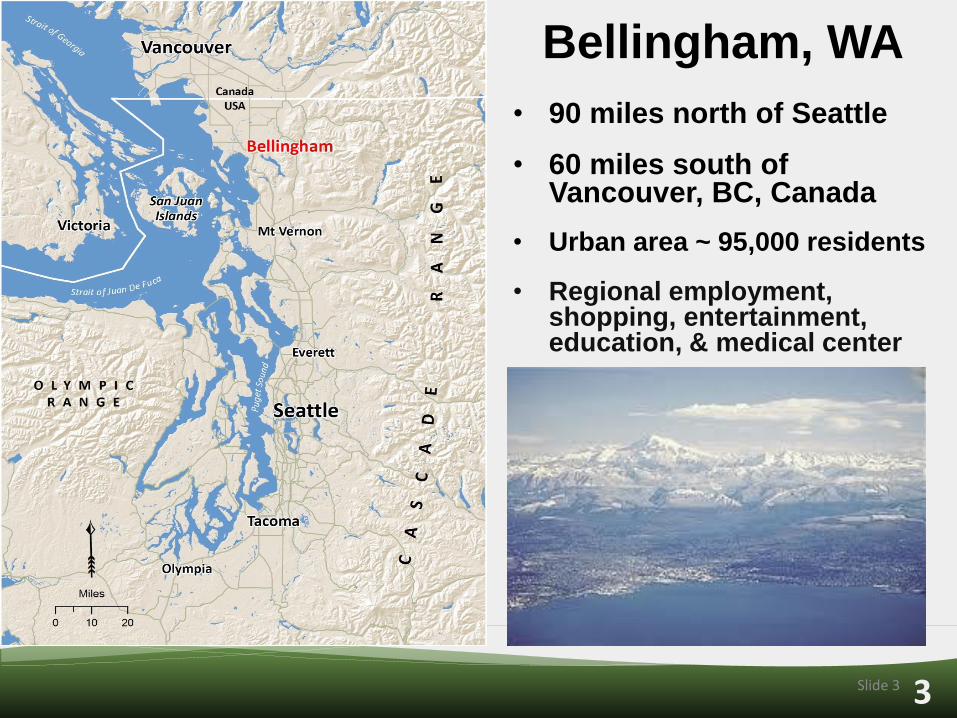
Bellingham, WA
• 90 miles north of Seattle
• 60 miles south of Vancouver, BC, Canada
• Urban area ~ 95,000 residents
• Regional employment, shopping, entertainment, education, & medical center
4
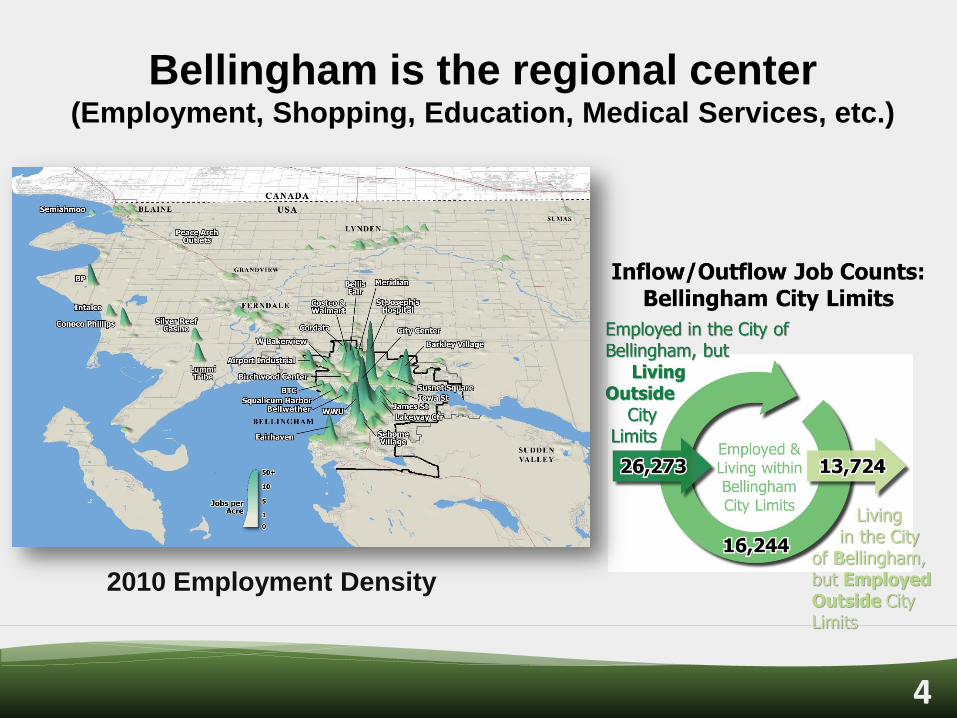
Bellingham is the regional center (Employment, Shopping, Education, Medical Services, etc.)
2010 Employment Density

5 Slide 5
Land Use Goals
• Prioritize Infill Over Sprawl
• Several master-planned mixed use “Urban Villages”
• All well-connected with
High-frequency (15 min) transit
ADA Pedestrian Sidewalks
Marked Arterial Bike Lanes
Multi-use “Greenways” Trails
Multimodal Arterial Streets
6
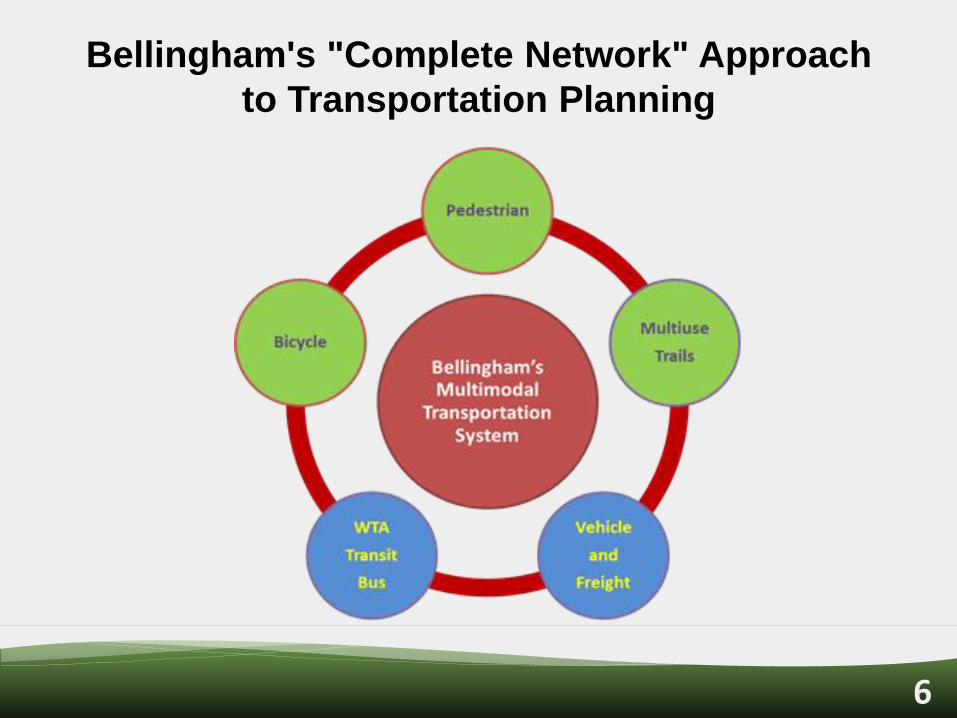
Bellingham's "Complete Network" Approach
to Transportation Planning
7
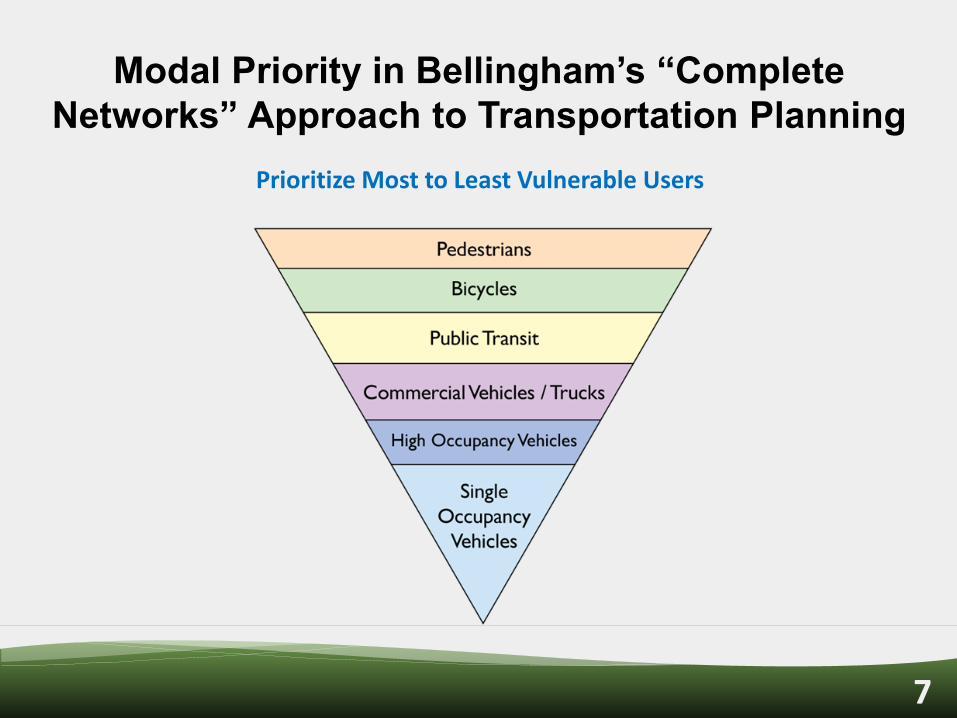
Modal Priority in Bellingham’s “Complete
Networks” Approach to Transportation Planning
Prioritize Most to Least Vulnerable Users

8
Non-Motorized Plans
Pedestrian Master Plan (2012)
• 266-mile pedestrian network
• ~ 170 miles (64%) complete
• Identifies sidewalk needs
• Prioritizes improvements
Bicycle Master Plan (2014)
• 160-mile bicycle network
• ~ 35 miles (22%) complete
• Identifies bicycle facility needs
• Prioritizes improvements
Multiuse Greenways Trails
• Extensive citywide trail system
• 65 existing trail miles
• 37 miles in multimodal T-Con
Slide 8
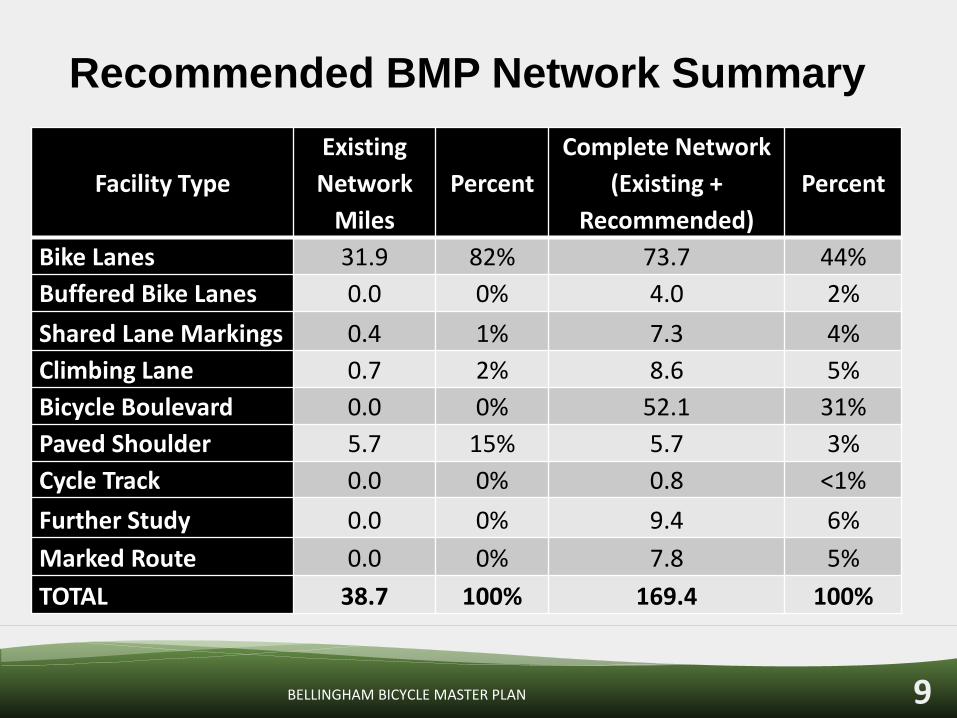
9
Recommended BMP Network Summary
Facility Type
Existing
Network
Miles
Percent
Complete Network
(Existing +
Recommended)
Percent
Bike Lanes 31.9 82% 73.7 44%
Buffered Bike Lanes 0.0 0% 4.0 2%
Shared Lane Markings 0.4 1% 7.3 4%
Climbing Lane 0.7 2% 8.6 5%
Bicycle Boulevard 0.0 0% 52.1 31%
Paved Shoulder 5.7 15% 5.7 3%
Cycle Track 0.0 0% 0.8 <1%
Further Study 0.0 0% 9.4 6%
Marked Route 0.0 0% 7.8 5%
TOTAL 38.7 100% 169.4 100%
BELLINGHAM BICYCLE MASTER PLAN
10
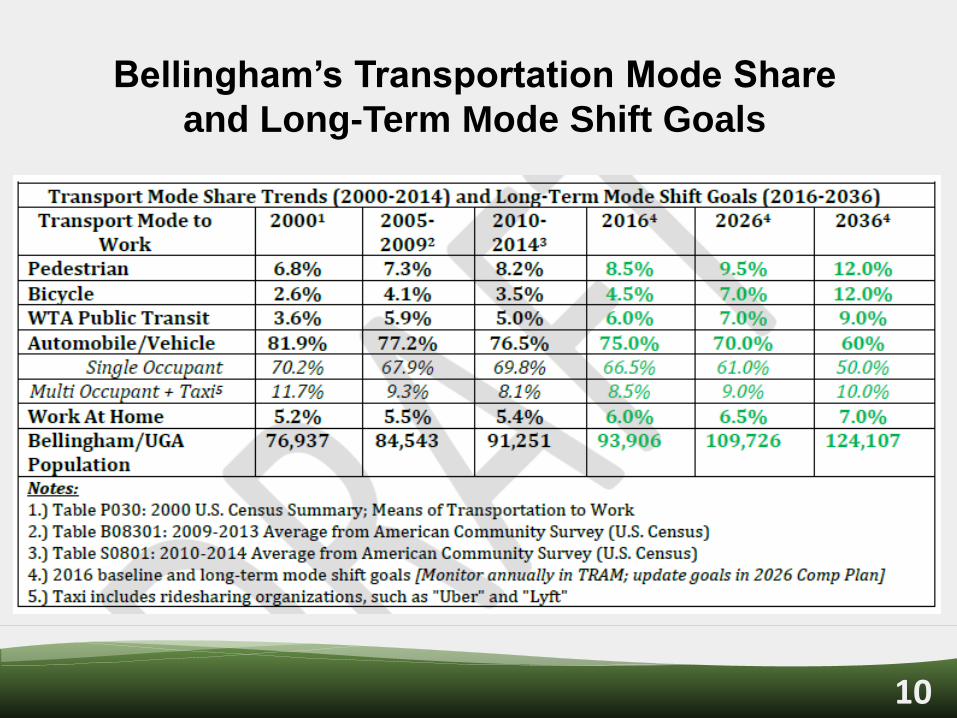
Bellingham’s Transportation Mode Share
and Long-Term Mode Shift Goals
11
You Get What You Measure (Inadequate Metrics = Inadequate Outcomes)
• Key Concepts Washington Comprehensive Plan and
Concurrency Requirements
Traditional LOS Standards & Perspectives
Common Outcomes Resulting from Inadequate
Tools & Metrics
Slide 11
12 Slide 12
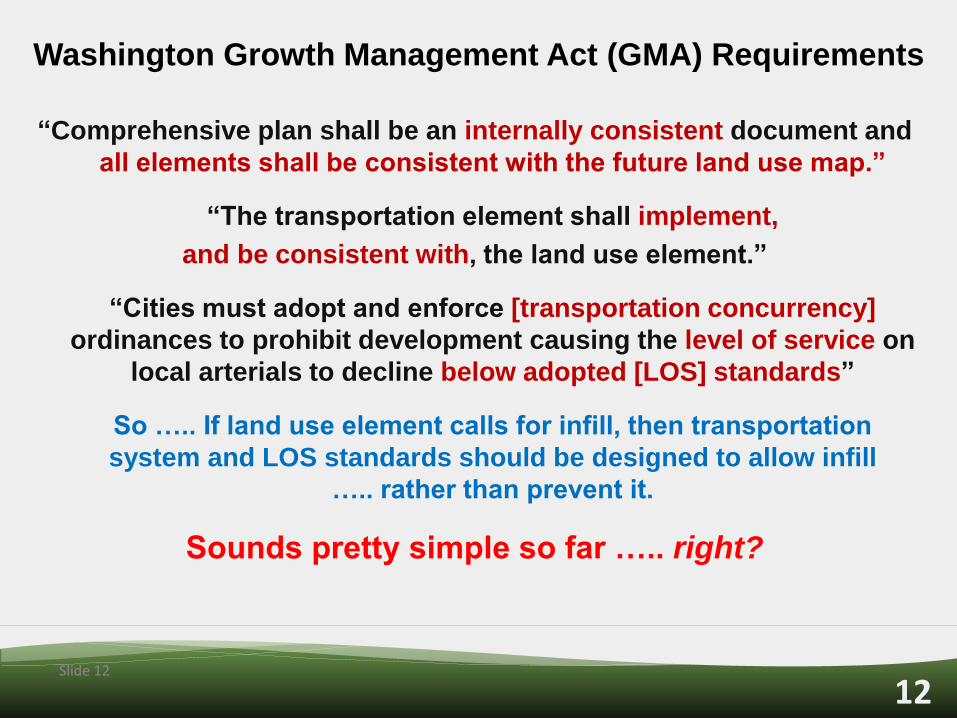
Washington Growth Management Act (GMA) Requirements
“Comprehensive plan shall be an internally consistent document and
all elements shall be consistent with the future land use map.”
“The transportation element shall implement,
and be consistent with, the land use element.”
“Cities must adopt and enforce [transportation concurrency]
ordinances to prohibit development causing the level of service on
local arterials to decline below adopted [LOS] standards”
So ….. If land use element calls for infill, then transportation
system and LOS standards should be designed to allow infill
….. rather than prevent it.
Sounds pretty simple so far ….. right?

13
What is “Transportation Concurrency?”
• Also known as “Adequate
Facilities Ordinances”
• Concept: Infrastructure must
keep up with and be adequate to
serve the level of planned growth
• Key: define “Adequate”
• Need to balance priorities
• Measuring “levels of service”
• Every community is different and
should have LOS measures that
reflect their own priorities
14
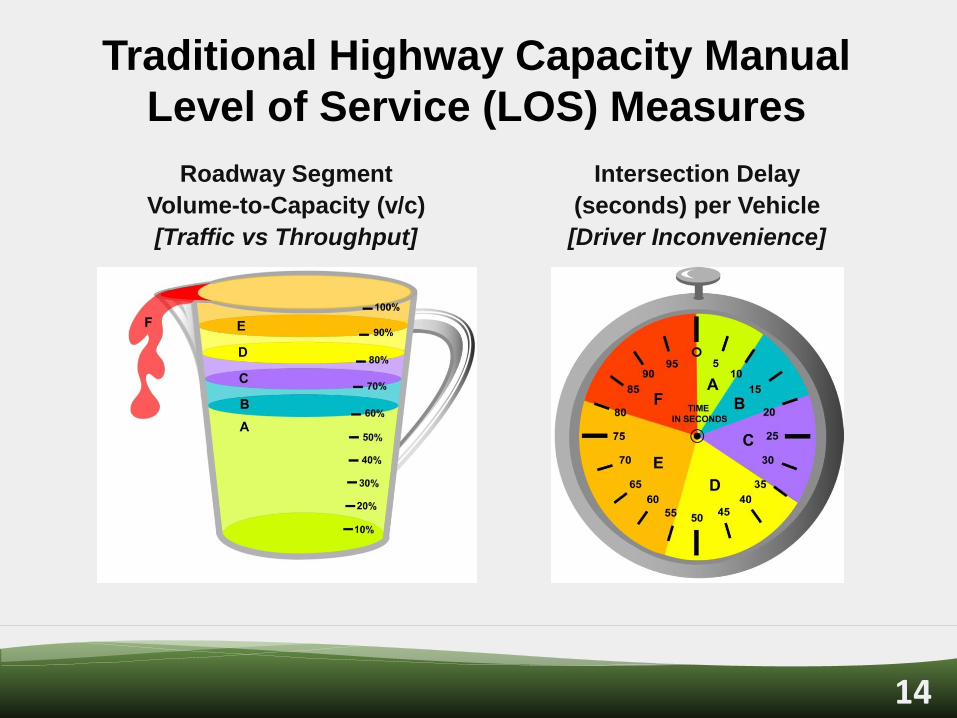
Traditional Highway Capacity Manual
Level of Service (LOS) Measures
Roadway Segment
Volume-to-Capacity (v/c)
[Traffic vs Throughput]
Intersection Delay
(seconds) per Vehicle
[Driver Inconvenience]

15 Slide 15
Traditional HCM LOS is Auto-centric and Temporal
16
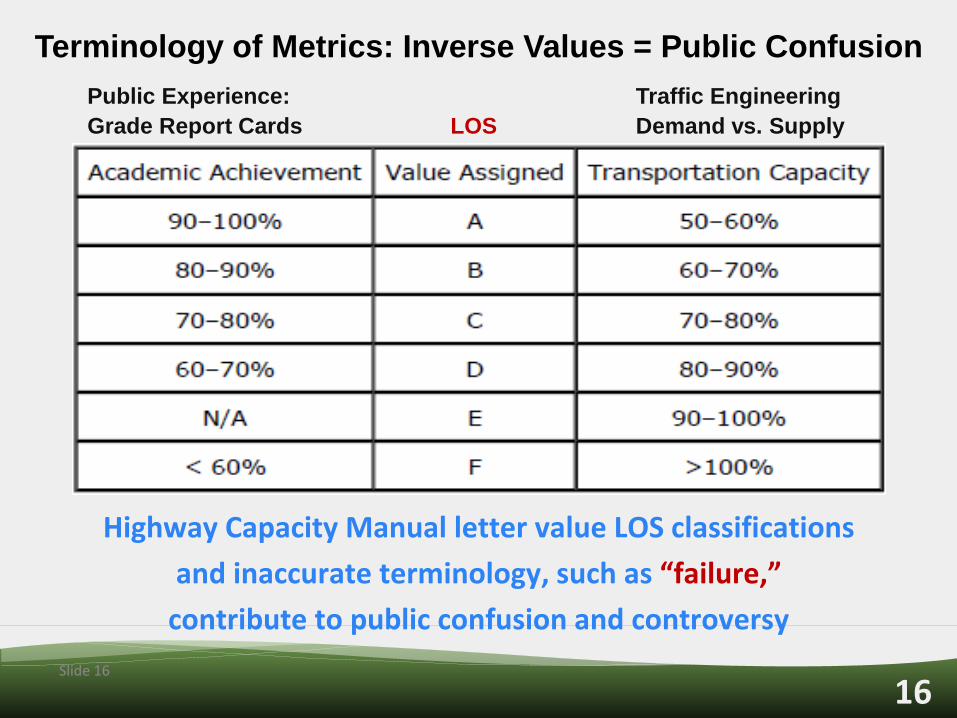
Terminology of Metrics: Inverse Values = Public Confusion
Public Experience: Traffic Engineering
Grade Report Cards LOS Demand vs. Supply
Slide 16
Highway Capacity Manual letter value LOS classifications
and inaccurate terminology, such as “failure,”
contribute to public confusion and controversy
17
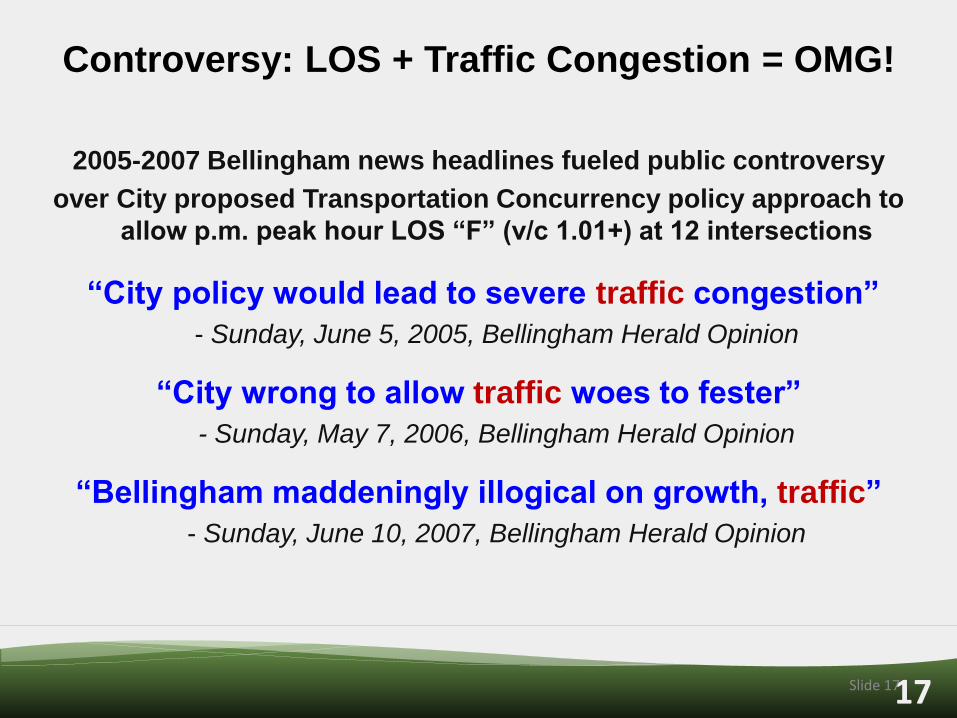
Controversy: LOS + Traffic Congestion = OMG!
2005-2007 Bellingham news headlines fueled public controversy
over City proposed Transportation Concurrency policy approach to
allow p.m. peak hour LOS “F” (v/c 1.01+) at 12 intersections
“City policy would lead to severe traffic congestion”
- Sunday, June 5, 2005, Bellingham Herald Opinion
“City wrong to allow traffic woes to fester”
- Sunday, May 7, 2006, Bellingham Herald Opinion
“Bellingham maddeningly illogical on growth, traffic”
- Sunday, June 10, 2007, Bellingham Herald Opinion
Slide 17
18
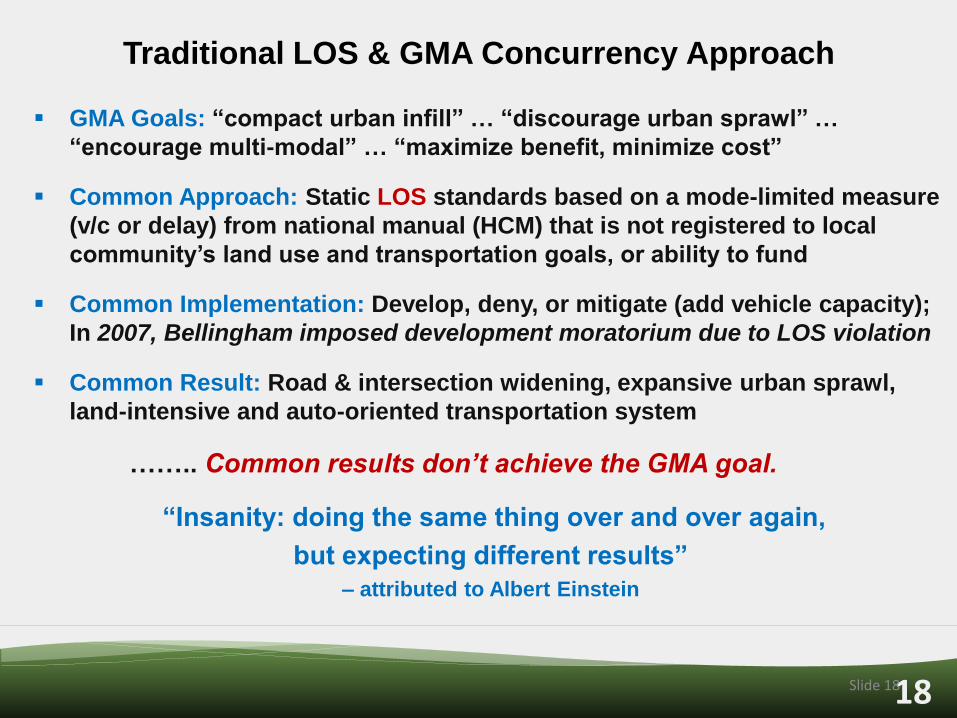
Traditional LOS & GMA Concurrency Approach
GMA Goals: “compact urban infill” … “discourage urban sprawl” …
“encourage multi-modal” … “maximize benefit, minimize cost”
Common Approach: Static LOS standards based on a mode-limited measure
(v/c or delay) from national manual (HCM) that is not registered to local
community’s land use and transportation goals, or ability to fund
Common Implementation: Develop, deny, or mitigate (add vehicle capacity);
In 2007, Bellingham imposed development moratorium due to LOS violation
Common Result: Road & intersection widening, expansive urban sprawl,
land-intensive and auto-oriented transportation system
…….. Common results don’t achieve the GMA goal.
“Insanity: doing the same thing over and over again,
but expecting different results”
– attributed to Albert Einstein
Slide 18

19
Perpetual Accommodation of Auto Convenience
at the Cost of Other Modes and Land Use Goals
20
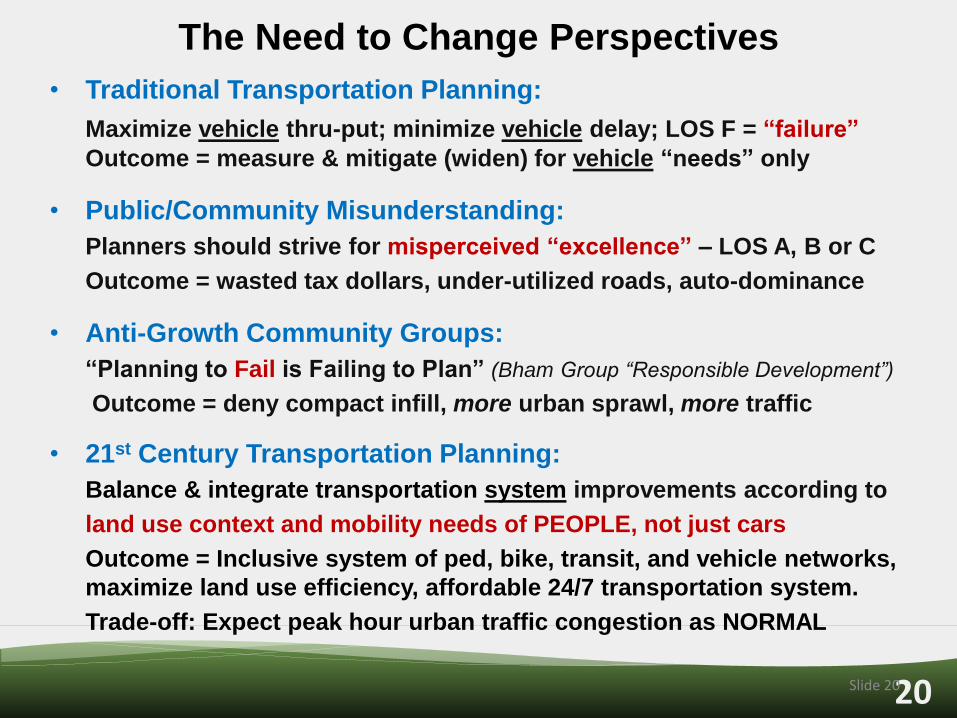
The Need to Change Perspectives
• Traditional Transportation Planning:
Maximize vehicle thru-put; minimize vehicle delay; LOS F = “failure”
Outcome = measure & mitigate (widen) for vehicle “needs” only
• Public/Community Misunderstanding:
Planners should strive for misperceived “excellence” – LOS A, B or C
Outcome = wasted tax dollars, under-utilized roads, auto-dominance
• Anti-Growth Community Groups:
“Planning to Fail is Failing to Plan” (Bham Group “Responsible Development”)
Outcome = deny compact infill, more urban sprawl, more traffic
• 21st Century Transportation Planning:
Balance & integrate transportation system improvements according to
land use context and mobility needs of PEOPLE, not just cars
Outcome = Inclusive system of ped, bike, transit, and vehicle networks,
maximize land use efficiency, affordable 24/7 transportation system.
Trade-off: Expect peak hour urban traffic congestion as NORMAL
Slide 20
21
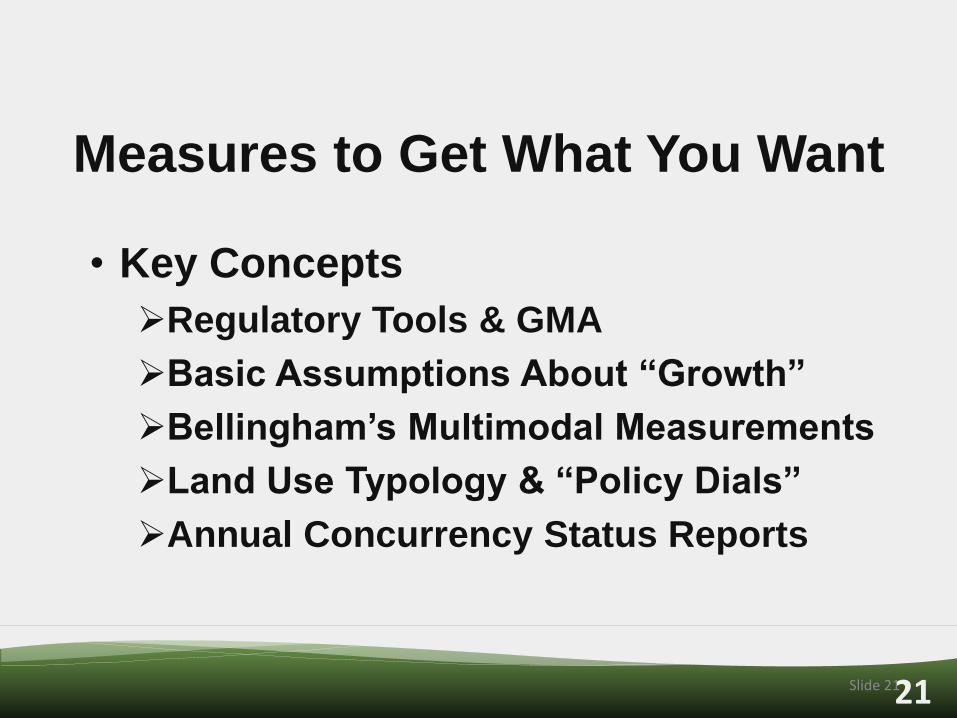
• Key Concepts
Regulatory Tools & GMA
Basic Assumptions About “Growth”
Bellingham’s Multimodal Measurements
Land Use Typology & “Policy Dials”
Annual Concurrency Status Reports
Slide 21
Measures to Get What You Want
22 Slide 22
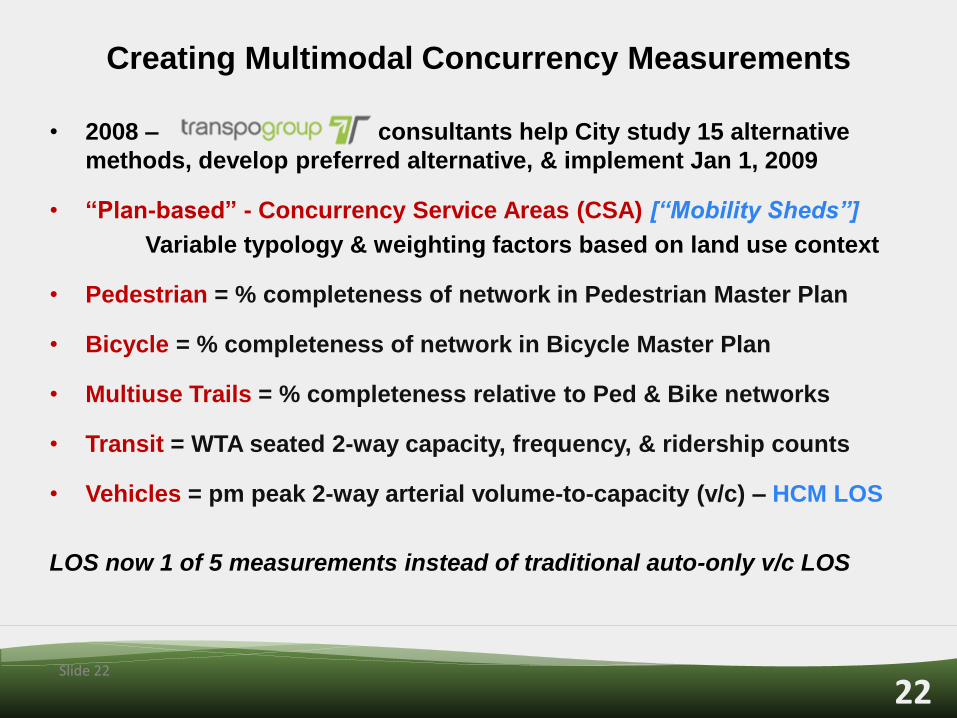
Creating Multimodal Concurrency Measurements
• 2008 – consultants help City study 15 alternative
methods, develop preferred alternative, & implement Jan 1, 2009
• “Plan-based” - Concurrency Service Areas (CSA) [“Mobility Sheds”]
Variable typology & weighting factors based on land use context
• Pedestrian = % completeness of network in Pedestrian Master Plan
• Bicycle = % completeness of network in Bicycle Master Plan
• Multiuse Trails = % completeness relative to Ped & Bike networks
• Transit = WTA seated 2-way capacity, frequency, & ridership counts
• Vehicles = pm peak 2-way arterial volume-to-capacity (v/c) – HCM LOS
LOS now 1 of 5 measurements instead of traditional auto-only v/c LOS
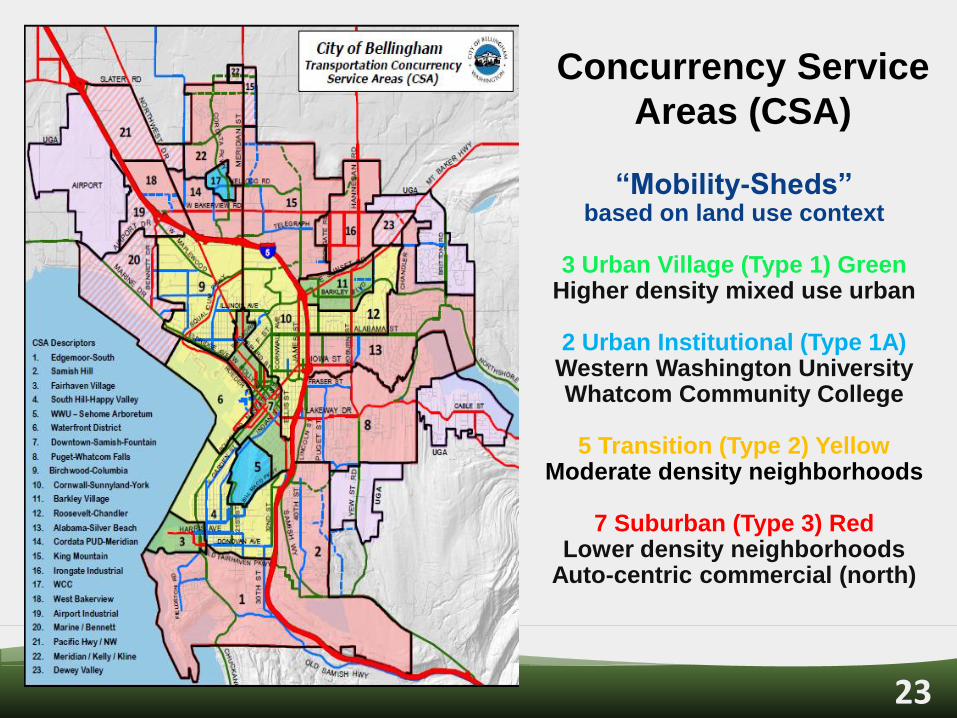
23 Slide 23
Concurrency Service
Areas (CSA)
“Mobility-Sheds” based on land use context
3 Urban Village (Type 1) Green
Higher density mixed use urban
2 Urban Institutional (Type 1A) Western Washington University Whatcom Community College
5 Transition (Type 2) Yellow
Moderate density neighborhoods
7 Suburban (Type 3) Red Lower density neighborhoods
Auto-centric commercial (north)
24 Slide 24
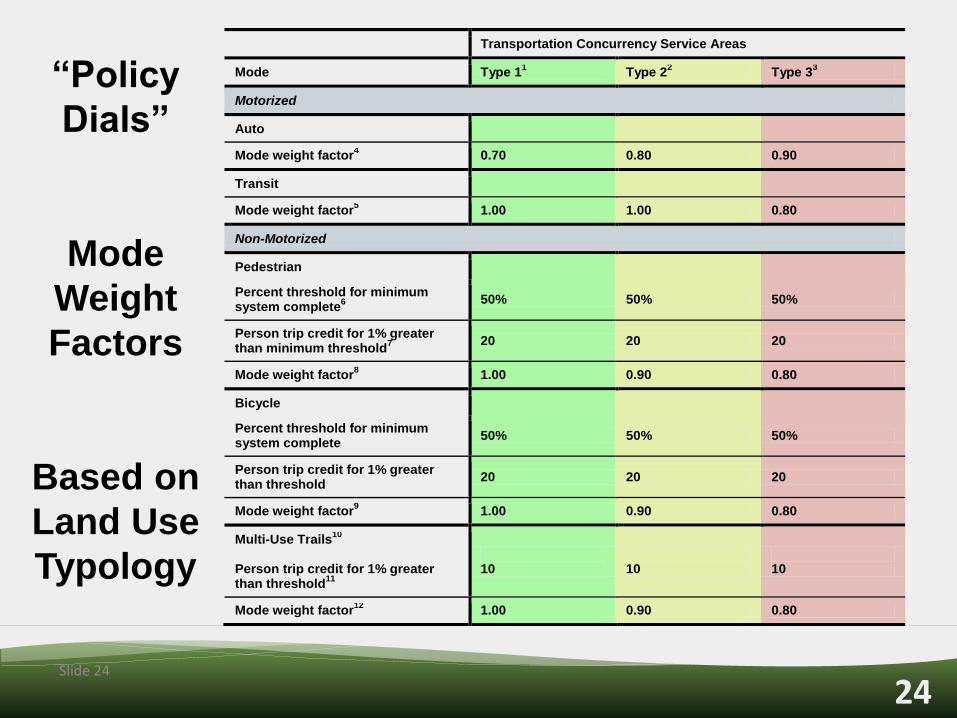
“Policy
Dials”
Mode
Weight
Factors
Based on
Land Use
Typology
Transportation Concurrency Service Areas
Mode Type 11
Type 22
Type 33
Motorized
Auto
Mode weight factor4
0.70 0.80 0.90
Transit
Mode weight factor5
1.00 1.00 0.80
Non-Motorized
Pedestrian
Percent threshold for minimum system complete
6 50% 50% 50%
Person trip credit for 1% greater than minimum threshold
7 20 20 20
Mode weight factor8
1.00 0.90 0.80
Bicycle
Percent threshold for minimum system complete
50% 50% 50%
Person trip credit for 1% greater than threshold
20 20 20
Mode weight factor9
1.00 0.90 0.80
Multi-Use Trails10
Person trip credit for 1% greater than threshold
11
10
10
10
Mode weight factor12
1.00 0.90 0.80
25
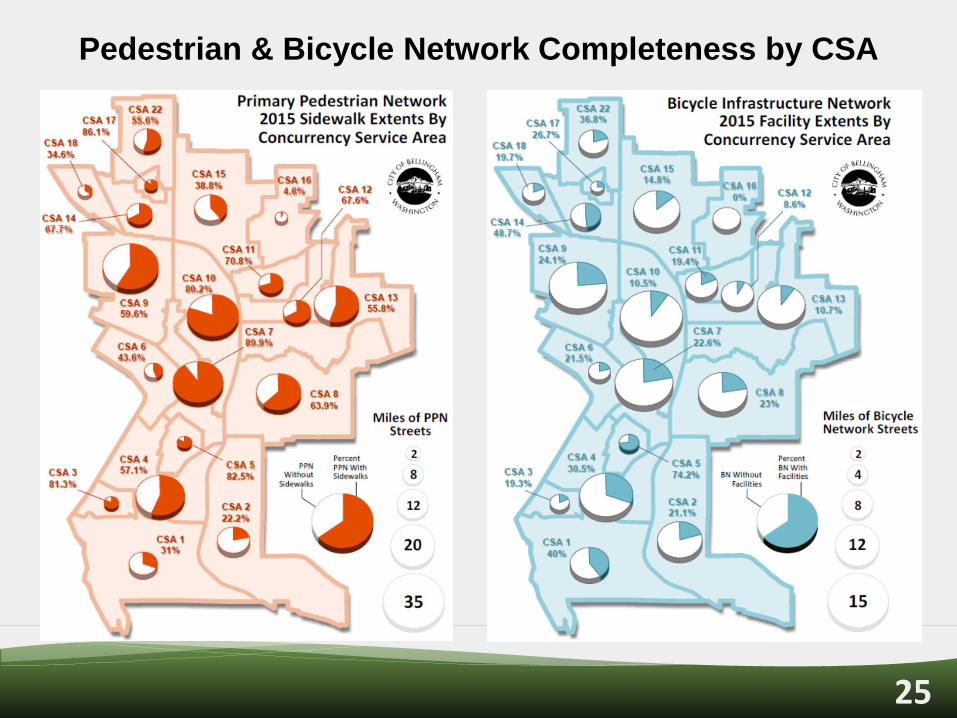
Pedestrian & Bicycle Network Completeness by CSA
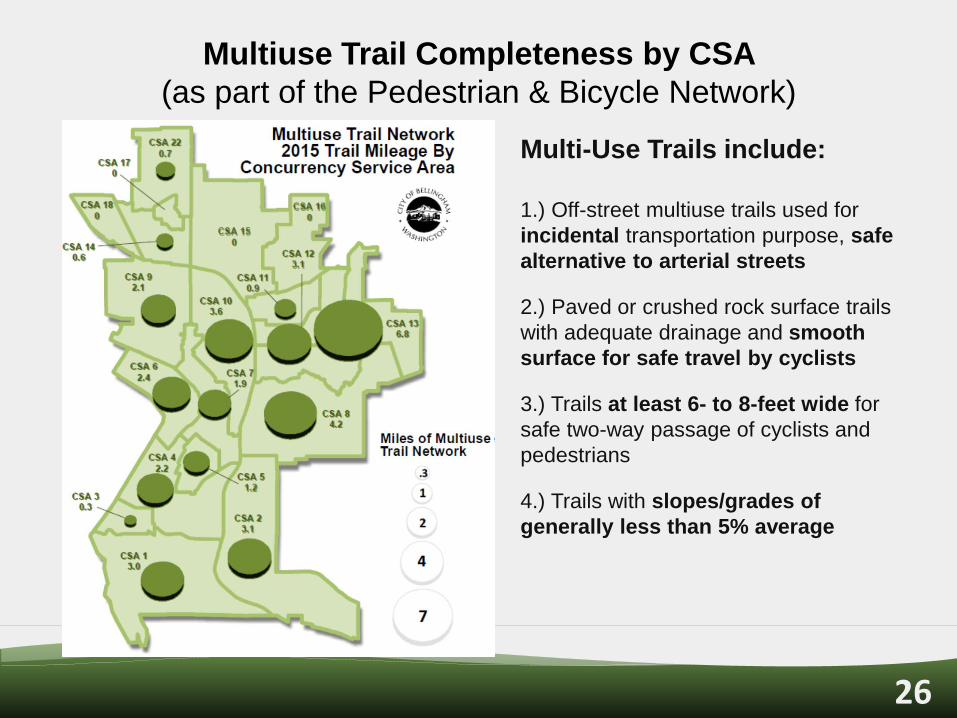
26
Multiuse Trail Completeness by CSA
(as part of the Pedestrian & Bicycle Network)
Multi-Use Trails include:
1.) Off-street multiuse trails used for
incidental transportation purpose, safe
alternative to arterial streets
2.) Paved or crushed rock surface trails
with adequate drainage and smooth
surface for safe travel by cyclists
3.) Trails at least 6- to 8-feet wide for
safe two-way passage of cyclists and
pedestrians
4.) Trails with slopes/grades of
generally less than 5% average

27 Slide 27
Annual
Calculation
Person Trips
Available
by
Concurrency
Service Area
(PTA/CSA)
Define Concurrency Service Areas, Corridors, & Measurement Points
Collect Demand & Supply Data of Motorized Modes
Calculate Concurrency Service Area Total Person Trips
Available
Calculate Available Person Trips for
Auto & Transit Modes
Collect Data of Existing & Planned Non-Motorized
Facilities
Calculate Credit Person Trips of Non-Motorized Facilities
Motorized Modes (Auto & Transit)
Non-Motorized Facilities (Bicycle, Sidewalk, Trail)
Draw Down Available Person Trips in each Impacted Concurrency Service Area for each
Concurrency Application
28
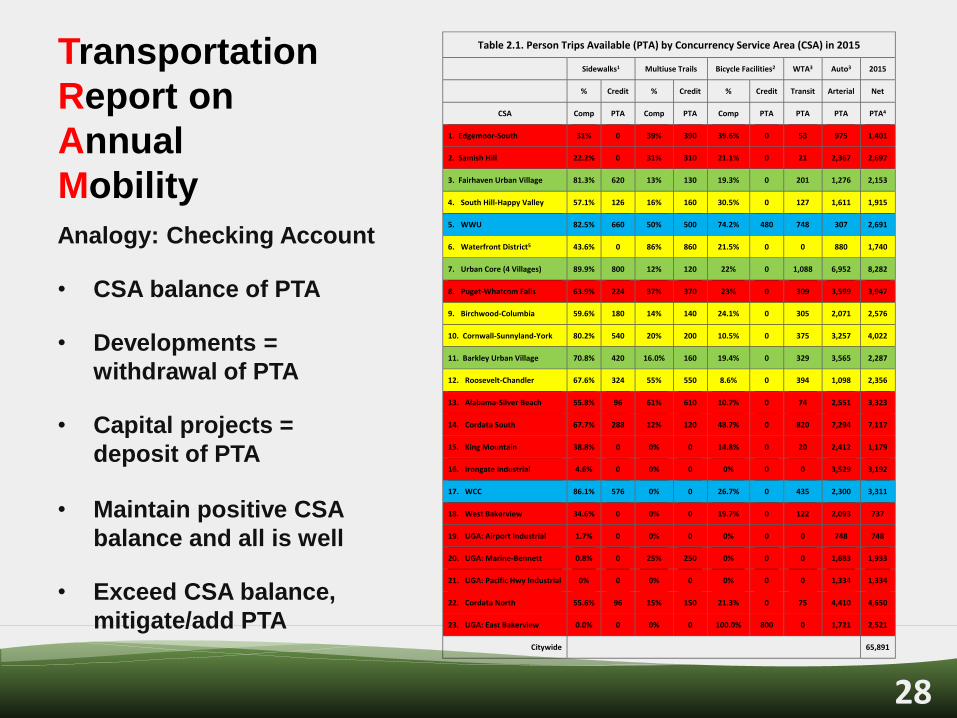
Analogy: Checking Account
• CSA balance of PTA
• Developments =
withdrawal of PTA
• Capital projects =
deposit of PTA
• Maintain positive CSA
balance and all is well
• Exceed CSA balance,
mitigate/add PTA
Transportation
Report on
Annual
Mobility
Table 2.1. Person Trips Available (PTA) by Concurrency Service Area (CSA) in 2015
Sidewalks1 Multiuse Trails Bicycle Facilities2 WTA3 Auto3 2015
% Credit % Credit % Credit Transit Arterial Net
CSA Comp PTA Comp PTA Comp PTA PTA PTA PTA4
1. Edgemoor-South 31% 0 39% 390 39.6% 0 53 975 1,401
2. Samish Hill 22.2% 0 31% 310 21.1% 0 21 2,367 2,697
3. Fairhaven Urban Village 81.3% 620 13% 130 19.3% 0 201 1,276 2,153
4. South Hill-Happy Valley 57.1% 126 16% 160 30.5% 0 127 1,611 1,915
5. WWU 82.5% 660 50% 500 74.2% 480 748 307 2,691
6. Waterfront District5 43.6% 0 86% 860 21.5% 0 0 880 1,740
7. Urban Core (4 Villages) 89.9% 800 12% 120 22% 0 1,088 6,952 8,282
8. Puget-Whatcom Falls 63.9% 224 37% 370 23% 0 309 3,599 3,947
9. Birchwood-Columbia 59.6% 180 14% 140 24.1% 0 305 2,071 2,576
10. Cornwall-Sunnyland-York 80.2% 540 20% 200 10.5% 0 375 3,257 4,022
11. Barkley Urban Village 70.8% 420 16.0% 160 19.4% 0 329 3,565 2,287
12. Roosevelt-Chandler 67.6% 324 55% 550 8.6% 0 394 1,098 2,356
13. Alabama-Silver Beach 55.8% 96 61% 610 10.7% 0 74 2,551 3,323
14. Cordata South 67.7% 288 12% 120 48.7% 0 820 7,294 7,117
15. King Mountain 38.8% 0 0% 0 14.8% 0 20 2,412 1,179
16. Irongate Industrial 4.6% 0 0% 0 0% 0 0 3,529 3,192
17. WCC 86.1% 576 0% 0 26.7% 0 435 2,300 3,311
18. West Bakerview 34.6% 0 0% 0 19.7% 0 122 2,093 737
19. UGA: Airport Industrial 1.7% 0 0% 0 0% 0 0 748 748
20. UGA: Marine-Bennett 0.8% 0 25% 250 0% 0 0 1,683 1,933
21. UGA: Pacific Hwy Industrial 0% 0 0% 0 0% 0 0 1,334 1,334
22. Cordata North 55.6% 96 15% 150 21.3% 0 75 4,410 4,650
23. UGA: East Bakerview 0.0% 0 0% 0 100.0% 800 0 1,721 2,521
Citywide 65,891
29
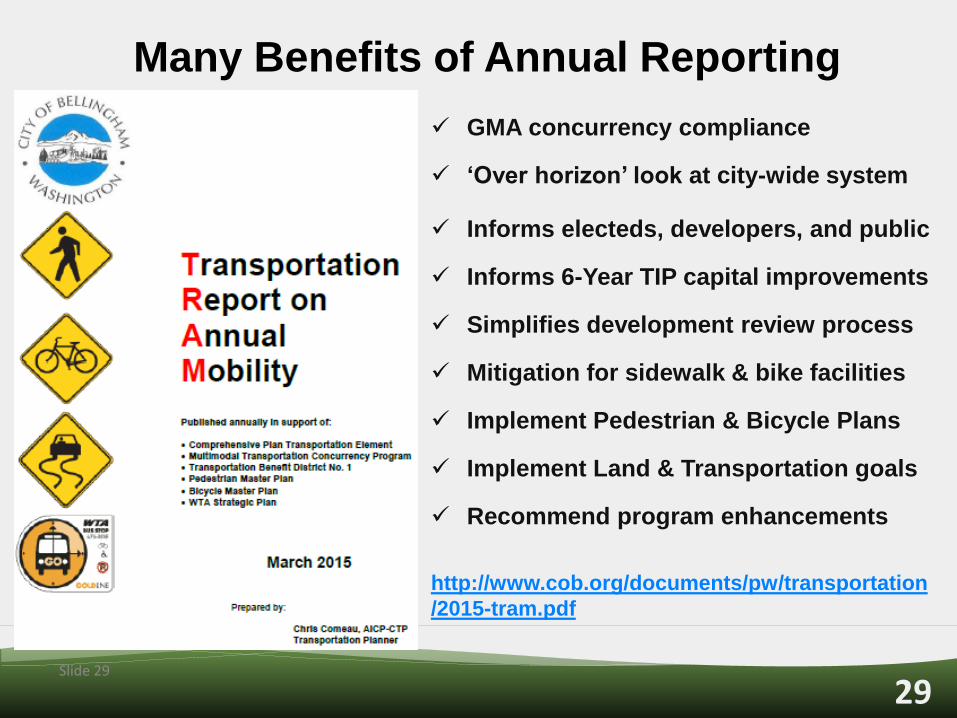
Many Benefits of Annual Reporting
GMA concurrency compliance
‘Over horizon’ look at city-wide system
Informs electeds, developers, and public
Informs 6-Year TIP capital improvements
Simplifies development review process
Mitigation for sidewalk & bike facilities
Implement Pedestrian & Bicycle Plans
Implement Land & Transportation goals
Recommend program enhancements
http://www.cob.org/documents/pw/transportation
/2015-tram.pdf
Slide 29
30
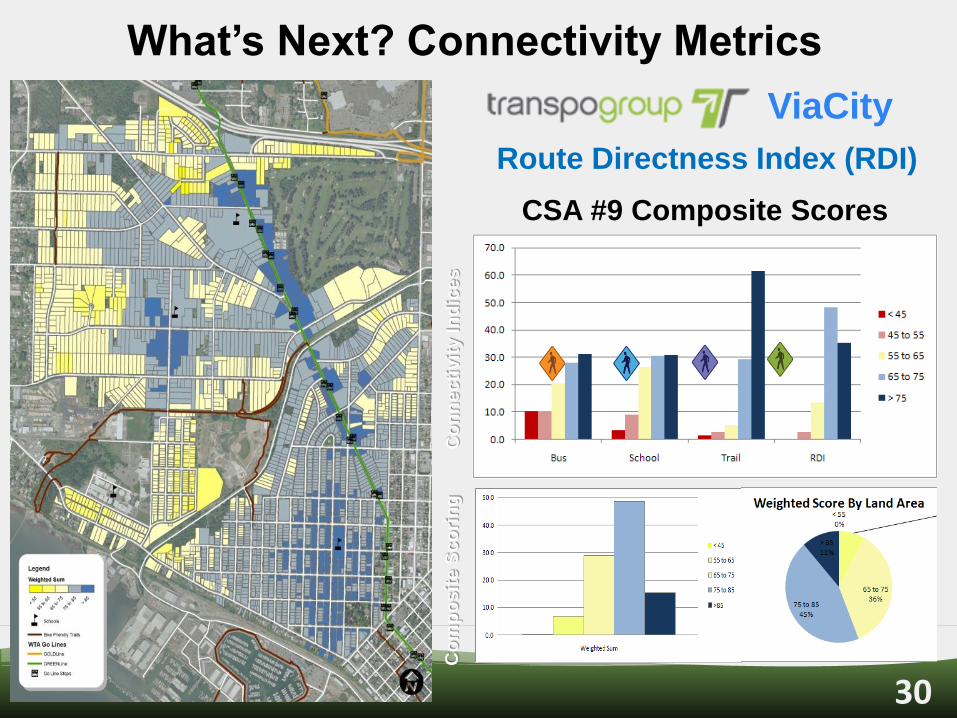
CSA #9 Composite Scores
Co
nn
ec
tivit
y I
nd
ice
s
Co
mp
os
ite
Sc
ori
ng
What’s Next? Connectivity Metrics
ViaCity
Route Directness Index (RDI)
31
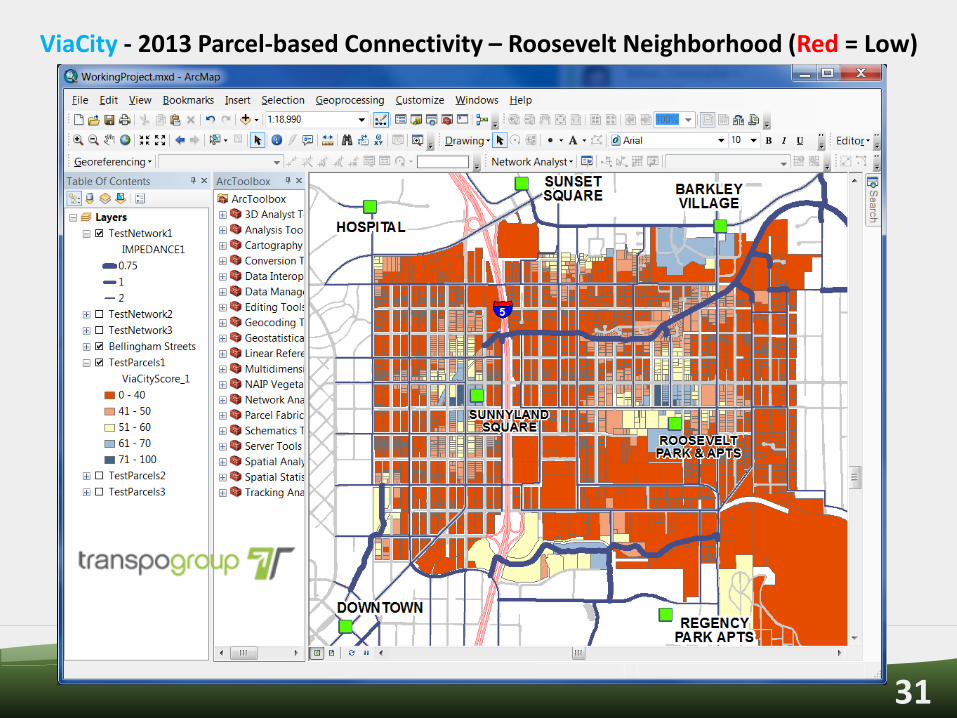
ViaCity - 2013 Parcel-based Connectivity – Roosevelt Neighborhood (Red = Low)

32
ViaCity Connectivity Benefit of the Kentucky-Texas Bike Boulevard (Blue = High)
33
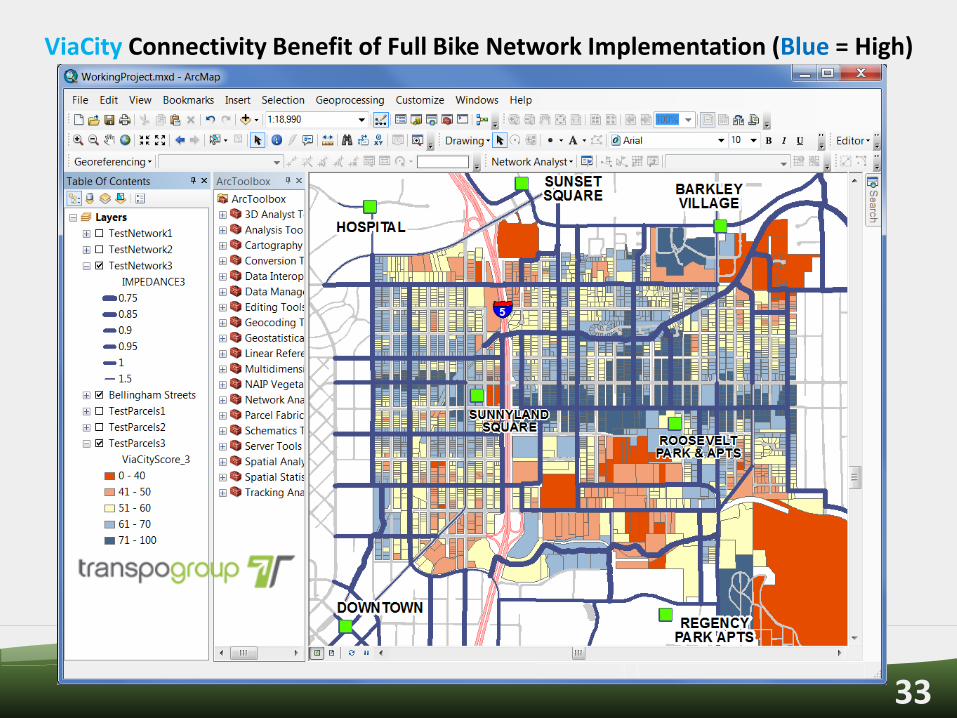
ViaCity Connectivity Benefit of Full Bike Network Implementation (Blue = High)

34 Slide 34
Multimodal Metrics Summary
• There is no universal land use-transportation performance metric
– Local urban “needs” are multimodal and far different than rural, State, or federal
• You get what you measure; design measures to get what you want
– Prioritize metrics to emphasize movement of people, not just cars
• Urban traffic congestion does not equal “failure” of facilities
– Peak hour congestion is inevitable, unavoidable, temporary driver inconvenience
• People want “Cool,” “Hip,” “Happening” places - “People Magnets”
– Measure how people get there: Connectivity, accessibility, demand
– Measure safety/comfort for most vulnerable users: Pedestrian, bicycle, transit
• There is much more work to be done!
– Integrating Ped/Bike/Transit Data into multimodal TIAs and impact mitigation
35
Public Works
For more information
www.cob.org/services/planning/transportation/multi-modal-trac.aspx
Chris Comeau, AICP CTP, Transportation Planner
(360) 778-7946; or [email protected]