move achieve succeed - stm. · pdf filemove achieve succeed ... sylvain joly assistant general...
TRANSCRIPT
MOVEACHIEVESUCCEED2012 Annual Financial Report

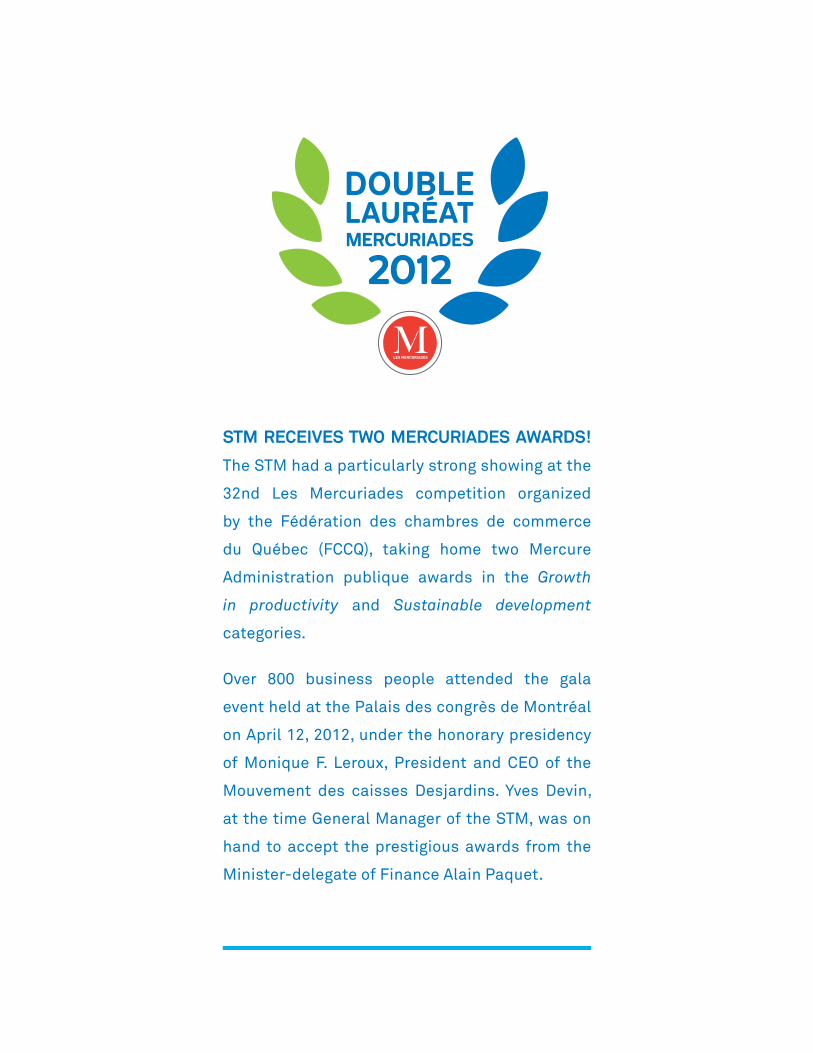
STM RECEIVES TWO MERCURIADES AWARDS! The STM had a particularly strong showing at the
32nd Les Mercuriades competition organized
by the Fédération des chambres de commerce
du Québec (FCCQ), taking home two Mercure
Administration publique awards in the Growth
in productivity and Sustainable development
categories.
Over 800 business people attended the gala
event held at the Palais des congrès de Montréal
on April 12, 2012, under the honorary presidency
of Monique F. Leroux, President and CEO of the
Mouvement des caisses Desjardins. Yves Devin,
at the time General Manager of the STM, was on
hand to accept the prestigious awards from the
Minister-delegate of Finance Alain Paquet.
2 STM2012 ANNUAL FINANCIAL REPORT
On behalf of the Executive Branch – Finance and Control, we want to thank everyone who contributed to the production of the 2012 Annual Financial Report. We wish also to give special thanks to the Financial Management and Control Branch.
Your cooperation, commitment and invaluable work have enabled us to present the 2012 Annual Financial Report.
Luc Tremblay, CPA, CATreasurer and Executive DirectorFinance and Control
3STM2012 ANNUAL FINANCIAL REPORT
TAB
LE O
F C
ON
TEN
TS INTRODUCTION
Governance
Board of Directors 5
Committees and their roles 6
Audit Committee 7
Organization of the STM 8
Message From Management 10
Analysis of the Consolidated Financial Statements 13
FINANCIAL INFORMATION
Management’s Responsibility for Financial Reporting 23
Independent Auditor’s Report of the Auditor General of Montréal 24
Independent Auditor’s Report 26
Consolidated Financial Statements
Consolidated Statement of Operations 29
Reconciliations for Tax Purposes
Consolidated Operating Surplus for Tax Purposes 30
Consolidated Investing Surplus (Deficit) for Tax Purposes 3 1
Consolidated Statement of Financial Position 32
Consolidated Statement of Change in Net Debt 33
Consolidated Statement of Cash Flows 34
Consolidated Expenses by Item 35
Notes to the Consolidated Financial Statements 36
Supplementary Tables
Table 1 - Consolidated Accumulated Surplus 58
Table 2 - Consolidated Total Net Long-Term Indebtedness 62
UNAUDITED SUPPLEMENTARY INFORMATION
Consolidated Results of Operations for Tax Purposes 64
Consolidated Revenues by Type 65
Consolidated Expenses by Function 68
Financing of Capital Assets 70
Long-Term Debt 7 1
Financial Ratios 74
4 STM2012 ANNUAL FINANCIAL REPORT
INTR
OD
UC
TIO
N
STM MISSION
The STM is at the core of economic development in the Montreal region, and it contributes to residents’ quality of life and to sustainable development. The STM operates and is continuing to develop an integrated metro and bus network and paratransit service for its customers. It offers fast, reliable transit that is safe and comfortable. The STM’s customers, employees and institutional and business partners are proud to work with the STM, which has been recognized for its high-quality, low-cost services.
5STM2012 ANNUAL FINANCIAL REPORT
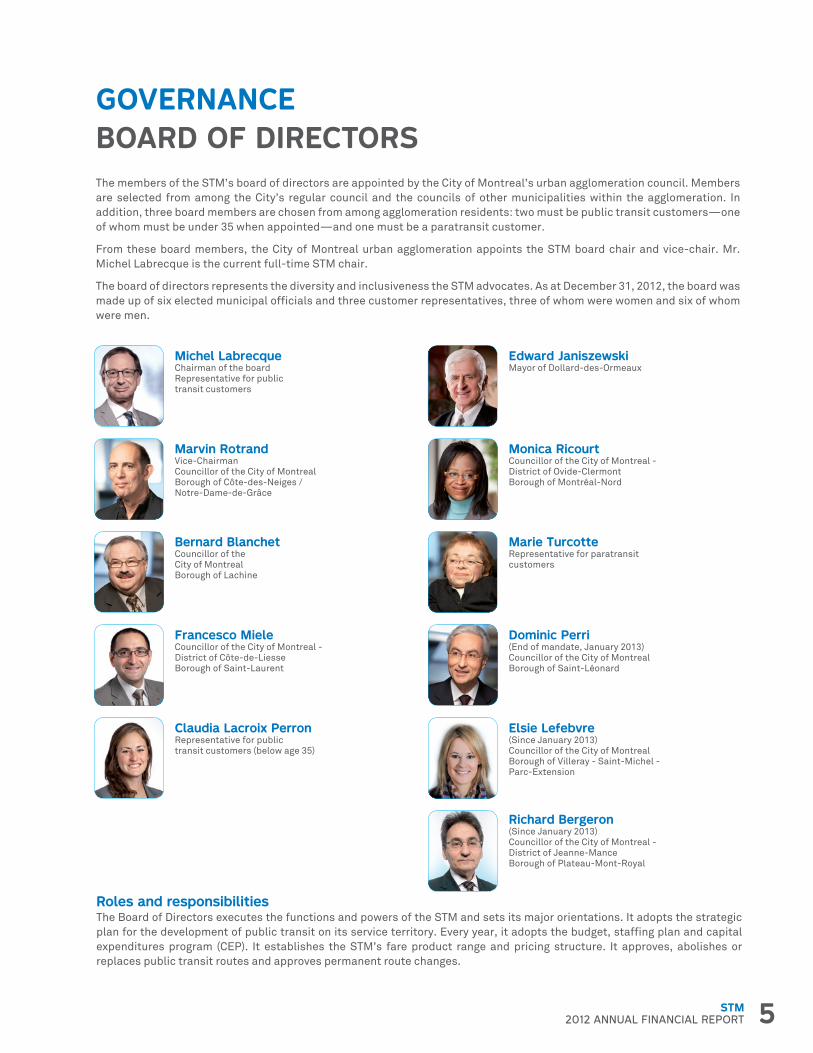
GOVERNANCEBOARD OF DIRECTORSThe members of the STM’s board of directors are appointed by the City of Montreal’s urban agglomeration council. Members are selected from among the City’s regular council and the councils of other municipalities within the agglomeration. In addition, three board members are chosen from among agglomeration residents: two must be public transit customers—one of whom must be under 35 when appointed—and one must be a paratransit customer.
From these board members, the City of Montreal urban agglomeration appoints the STM board chair and vice-chair. Mr. Michel Labrecque is the current full-time STM chair.
The board of directors represents the diversity and inclusiveness the STM advocates. As at December 31, 2012, the board was made up of six elected municipal officials and three customer representatives, three of whom were women and six of whom were men.
Michel LabrecqueChairman of the boardRepresentative for public transit customers
Marvin RotrandVice-ChairmanCouncillor of the City of MontrealBorough of Côte-des-Neiges / Notre-Dame-de-Grâce
Bernard BlanchetCouncillor of the City of MontrealBorough of Lachine
Francesco MieleCouncillor of the City of Montreal - District of Côte-de-LiesseBorough of Saint-Laurent
Claudia Lacroix PerronRepresentative for public transit customers (below age 35)
Edward JaniszewskiMayor of Dollard-des-Ormeaux
Monica RicourtCouncillor of the City of Montreal - District of Ovide-ClermontBorough of Montréal-Nord
Marie TurcotteRepresentative for paratransit customers
Dominic Perri (End of mandate, January 2013)Councillor of the City of MontrealBorough of Saint-Léonard
Elsie Lefebvre (Since January 2013)Councillor of the City of Montreal Borough of Villeray - Saint-Michel - Parc-Extension
Richard Bergeron (Since January 2013)Councillor of the City of Montreal - District of Jeanne-ManceBorough of Plateau-Mont-Royal
Roles and responsibilitiesThe Board of Directors executes the functions and powers of the STM and sets its major orientations. It adopts the strategic plan for the development of public transit on its service territory. Every year, it adopts the budget, staffing plan and capital expenditures program (CEP). It establishes the STM’s fare product range and pricing structure. It approves, abolishes or replaces public transit routes and approves permanent route changes.
6 STM2012 ANNUAL FINANCIAL REPORT
COMMITTEES AND THEIR ROLESTo help effectively govern the STM and execute its mandates, the Board of Directors formed technical committees, each of which is dedicated to a specific issue. These committees were formed, mostly between 2006 and 2008, as part of the governance rules review process aimed at helping the STM conduct its activities. The committees are made up of members of the Board of Directors and independent external experts.
The chairman of the board is an ex officio member of all committees. The secretary general attends the meetings and serves as the permanent secretary on all committees while not actually being a member.
CUSTOMER SERVICE COMMITTEEThis committee’s mandate is to study the needs, methods and best possible solutions with respect to the public transit services that the STM delivers to its users, and to make recommendations. To take the pulse of transit users, the committee organizes public consultations on a yearly basis.
HUMAN RESOURCES COMMITTEEThis committee’s mandate is to study the needs, methods and best possible solutions with respect to issues surrounding human resources management at the STM, and to submit its recommendations to the Board of Directors. Every year, the committee studies and assesses the Chief Executive Officer’s performance vis-à-vis his specific, pre-established personal and corporate objectives, and determines his annual salary, within the limits set by the Board of Directors. When required, the committee calls on outside experts to examine the salaries paid to STM executives and bring them into line with those earned by senior managers at Québec’s public corporations and at North American public transit authorities.
FINANCE COMMITTEEThis committee’s mandate is to study the needs, methods and best possible solutions with respect to the management of the STM’s financial activities, and to submit its recommendations to the Board of Directors.
AUDIT COMMITTEEThe Audit Committee’s mandate is to support the functions of the STM’s general audit (internal) and external audit and to follow-up on their recommendations. Ultimately, the mandate contributes to improving the methods and solutions used to assure the Board of Directors that the Société’s operational and administrative affairs are being managed in an effective, efficient and economical manner, and to enhancing the presentation and disclosure of information needed to accurately reflect the organization’s activities and results.
GOVERNANCE AND ETHICS COMMITTEEThis committee’s mandate is to study the needs, methods and best possible solutions with respect to issues surrounding governance and ethics in the management of the STM’s activities, and to submit its recommendations to the Board of Directors.
ASSET MAINTENANCE, MAJOR PROJECTS AND ENVIRONMENT COMMITTEEThis committee’s mandate is to study the needs, methods and best possible solutions with respect to the maintenance of STM assets (operating equipment and systems, infrastructures and computer equipment). It is also charged with studying all major projects supporting the implementation of the 2020 Strategic Plan and with overseeing the company’s environmental policy. It submits its recommendations to the Board of Directors.
OPERATIONS COMMITTEEThis committee’s mandate is to study the needs, methods and best possible solutions with respect to the management of STM operations, and to submit its recommendations to the Board of Directors.
ARTS AND ARTISTIC HERITAGE COMMITTEEThis committee’s mandate is to promote the integration of art into the STM’s network and to concern itself with the protection, conservation, proper use and development of the artistic heritage assets in the STM’s possession, as well as to submit appropriate recommendations to the STM’s Board of Directors.
7STM2012 ANNUAL FINANCIAL REPORT
AUDIT COMMITTEEYves Gauthier, FCPA, FCAChairmanVice-President, International ProgramsCCAF – FCVI inc.
Michel LabrecqueVice-ChairmanChairman of the Board of Directors
Francesco MieleMemberCouncillor of the City of Montreal - District of Côte-de-LiesseBorough of Saint-Laurent
Yves J. Beauchesne, CPA, CA, MBA, D. Fisc.External MemberSenior Vice-President - Finance and AdministrationDATSIT Studios inc.
8 STM2012 ANNUAL FINANCIAL REPORT
OR
GA
NIZ
ATIO
N O
F T
HE
STM
A
s at
Dec
emb
er 3
1, 2
012
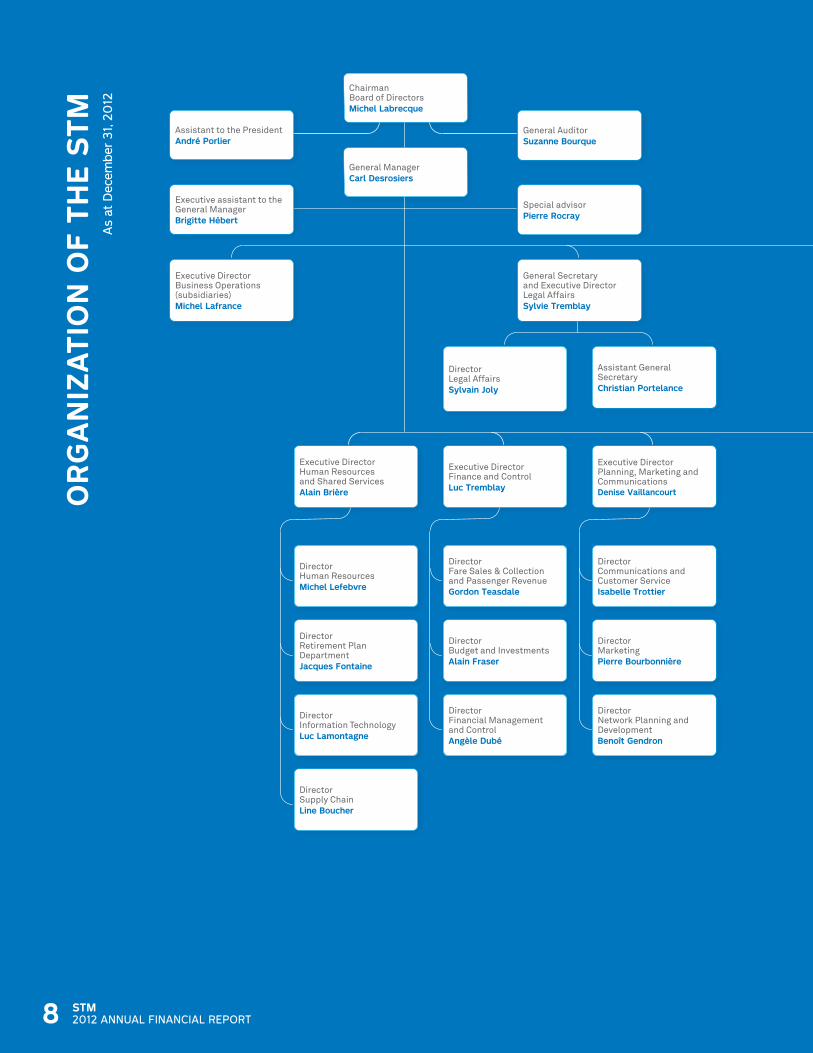
ChairmanBoard of DirectorsMichel Labrecque
Assistant to the PresidentAndré Porlier
General AuditorSuzanne Bourque
General ManagerCarl Desrosiers
Executive assistant to the General ManagerBrigitte Hébert
Special advisorPierre Rocray
Executive DirectorBusiness Operations (subsidiaries)Michel Lafrance
General Secretaryand Executive DirectorLegal AffairsSylvie Tremblay
DirectorLegal AffairsSylvain Joly
Assistant General SecretaryChristian Portelance
Executive Director Human Resources and Shared Services Alain Brière
Director Human ResourcesMichel Lefebvre
DirectorRetirement Plan DepartmentJacques Fontaine
DirectorInformation TechnologyLuc Lamontagne
DirectorSupply ChainLine Boucher
Executive DirectorFinance and ControlLuc Tremblay
DirectorFare Sales & Collection and Passenger RevenueGordon Teasdale
DirectorBudget and InvestmentsAlain Fraser
DirectorFinancial Management and ControlAngèle Dubé
Executive DirectorPlanning, Marketing and Communications Denise Vaillancourt
DirectorCommunications and Customer ServiceIsabelle Trottier
DirectorMarketingPierre Bourbonnière
DirectorNetwork Planning and DevelopmentBenoît Gendron
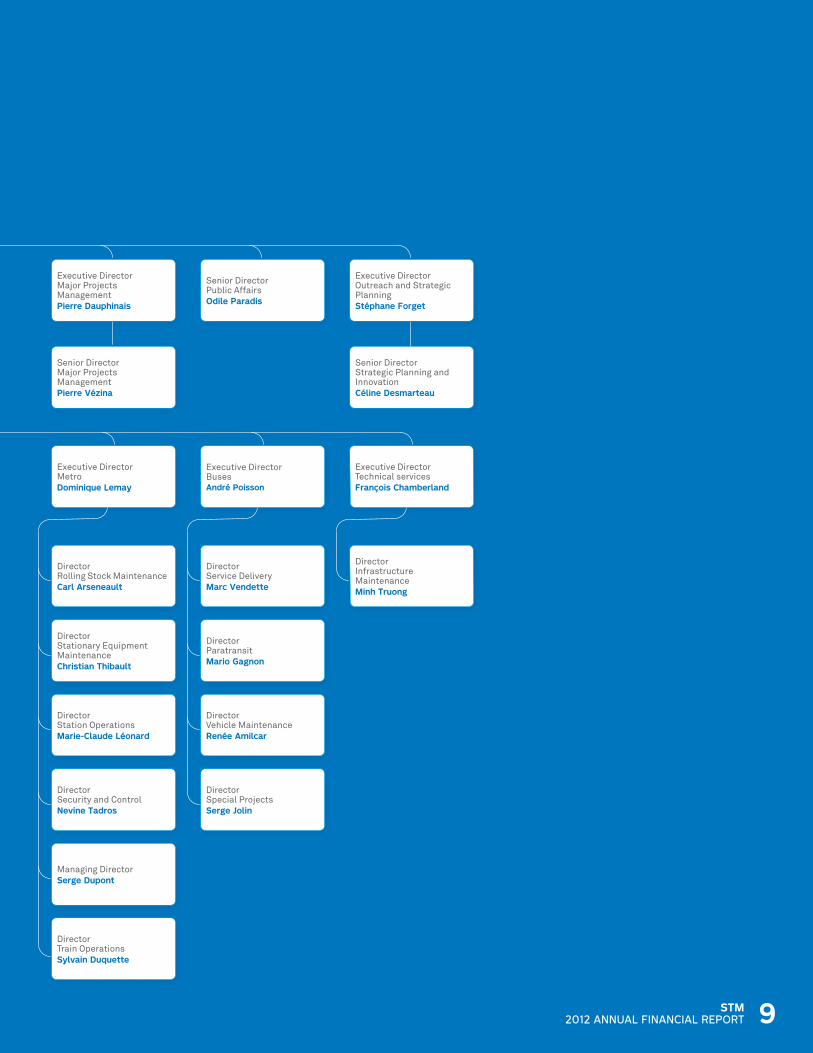
Executive DirectorMajor Projects ManagementPierre Dauphinais
Senior DirectorMajor Projects ManagementPierre Vézina
Senior DirectorPublic AffairsOdile Paradis
Executive DirectorOutreach and Strategic PlanningStéphane Forget
Senior DirectorStrategic Planning and InnovationCéline Desmarteau
Executive DirectorMetro Dominique Lemay
DirectorRolling Stock MaintenanceCarl Arseneault
DirectorStationary Equipment MaintenanceChristian Thibault
DirectorStation OperationsMarie-Claude Léonard
DirectorSecurity and ControlNevine Tadros
Managing DirectorSerge Dupont
DirectorTrain OperationsSylvain Duquette
Executive DirectorBusesAndré Poisson
DirectorService DeliveryMarc Vendette
DirectorParatransitMario Gagnon
DirectorVehicle MaintenanceRenée Amilcar
DirectorSpecial ProjectsSerge Jolin
Executive DirectorTechnical servicesFrançois Chamberland
DirectorInfrastructure MaintenanceMinh Truong
9STM2012 ANNUAL FINANCIAL REPORT
ChairmanBoard of DirectorsMichel Labrecque
Assistant to the PresidentAndré Porlier
General AuditorSuzanne Bourque
General ManagerCarl Desrosiers
Executive assistant to the General ManagerBrigitte Hébert
Special advisorPierre Rocray
Executive DirectorBusiness Operations (subsidiaries)Michel Lafrance
General Secretaryand Executive DirectorLegal AffairsSylvie Tremblay
DirectorLegal AffairsSylvain Joly
Assistant General SecretaryChristian Portelance
Executive Director Human Resources and Shared Services Alain Brière
Director Human ResourcesMichel Lefebvre
DirectorRetirement Plan DepartmentJacques Fontaine
DirectorInformation TechnologyLuc Lamontagne
DirectorSupply ChainLine Boucher
Executive DirectorFinance and ControlLuc Tremblay
DirectorFare Sales & Collection and Passenger RevenueGordon Teasdale
DirectorBudget and InvestmentsAlain Fraser
DirectorFinancial Management and ControlAngèle Dubé
Executive DirectorPlanning, Marketing and Communications Denise Vaillancourt
DirectorCommunications and Customer ServiceIsabelle Trottier
DirectorMarketingPierre Bourbonnière
DirectorNetwork Planning and DevelopmentBenoît Gendron
Executive DirectorMajor Projects ManagementPierre Dauphinais
Senior DirectorMajor Projects ManagementPierre Vézina
Senior DirectorPublic AffairsOdile Paradis
Executive DirectorOutreach and Strategic PlanningStéphane Forget
Senior DirectorStrategic Planning and InnovationCéline Desmarteau
Executive DirectorMetro Dominique Lemay
DirectorRolling Stock MaintenanceCarl Arseneault
DirectorStationary Equipment MaintenanceChristian Thibault
DirectorStation OperationsMarie-Claude Léonard
DirectorSecurity and ControlNevine Tadros
Managing DirectorSerge Dupont
DirectorTrain OperationsSylvain Duquette
Executive DirectorBusesAndré Poisson
DirectorService DeliveryMarc Vendette
DirectorParatransitMario Gagnon
DirectorVehicle MaintenanceRenée Amilcar
DirectorSpecial ProjectsSerge Jolin
Executive DirectorTechnical servicesFrançois Chamberland
DirectorInfrastructure MaintenanceMinh Truong
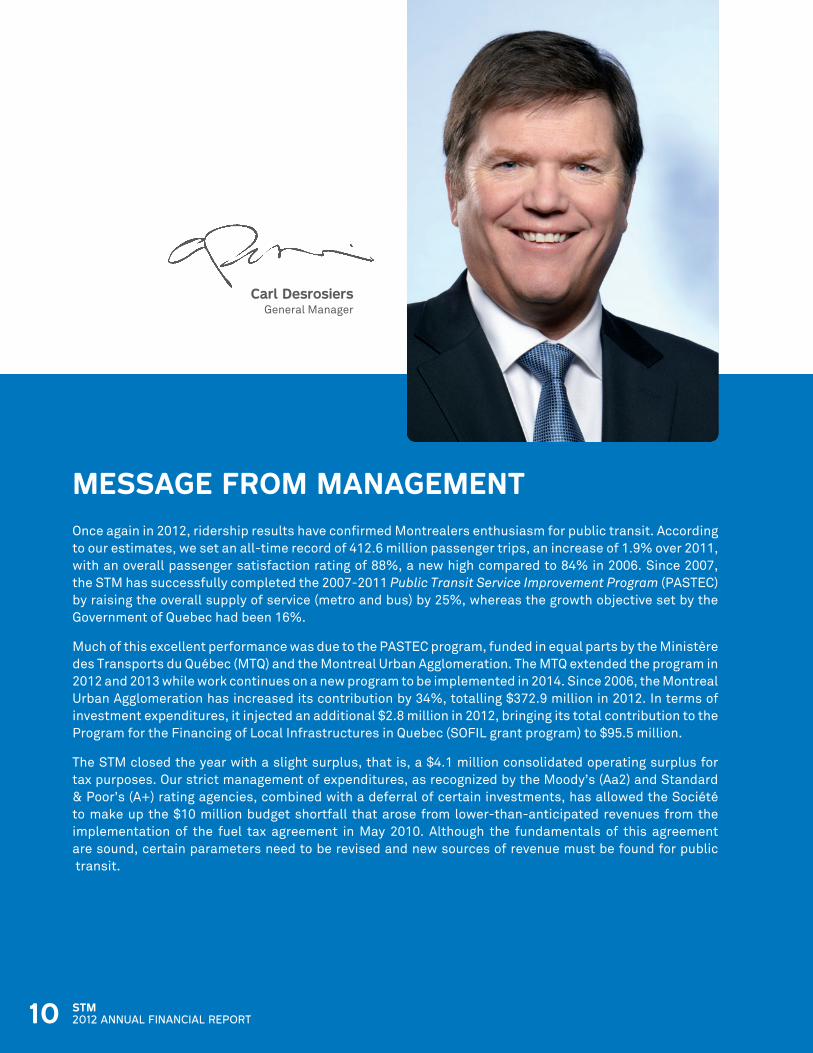
MESSAGE FROM MANAGEMENTOnce again in 2012, ridership results have confirmed Montrealers enthusiasm for public transit. According to our estimates, we set an all-time record of 412.6 million passenger trips, an increase of 1.9% over 2011, with an overall passenger satisfaction rating of 88%, a new high compared to 84% in 2006. Since 2007, the STM has successfully completed the 2007-2011 Public Transit Service Improvement Program (PASTEC) by raising the overall supply of service (metro and bus) by 25%, whereas the growth objective set by the Government of Quebec had been 16%.
Much of this excellent performance was due to the PASTEC program, funded in equal parts by the Ministère des Transports du Québec (MTQ) and the Montreal Urban Agglomeration. The MTQ extended the program in 2012 and 2013 while work continues on a new program to be implemented in 2014. Since 2006, the Montreal Urban Agglomeration has increased its contribution by 34%, totalling $372.9 million in 2012. In terms of investment expenditures, it injected an additional $2.8 million in 2012, bringing its total contribution to the Program for the Financing of Local Infrastructures in Quebec (SOFIL grant program) to $95.5 million.
The STM closed the year with a slight surplus, that is, a $4.1 million consolidated operating surplus for tax purposes. Our strict management of expenditures, as recognized by the Moody’s (Aa2) and Standard & Poor’s (A+) rating agencies, combined with a deferral of certain investments, has allowed the Société to make up the $10 million budget shortfall that arose from lower-than-anticipated revenues from the implementation of the fuel tax agreement in May 2010. Although the fundamentals of this agreement are sound, certain parameters need to be revised and new sources of revenue must be found for public transit.
Carl DesrosiersGeneral Manager
10 STM2012 ANNUAL FINANCIAL REPORT
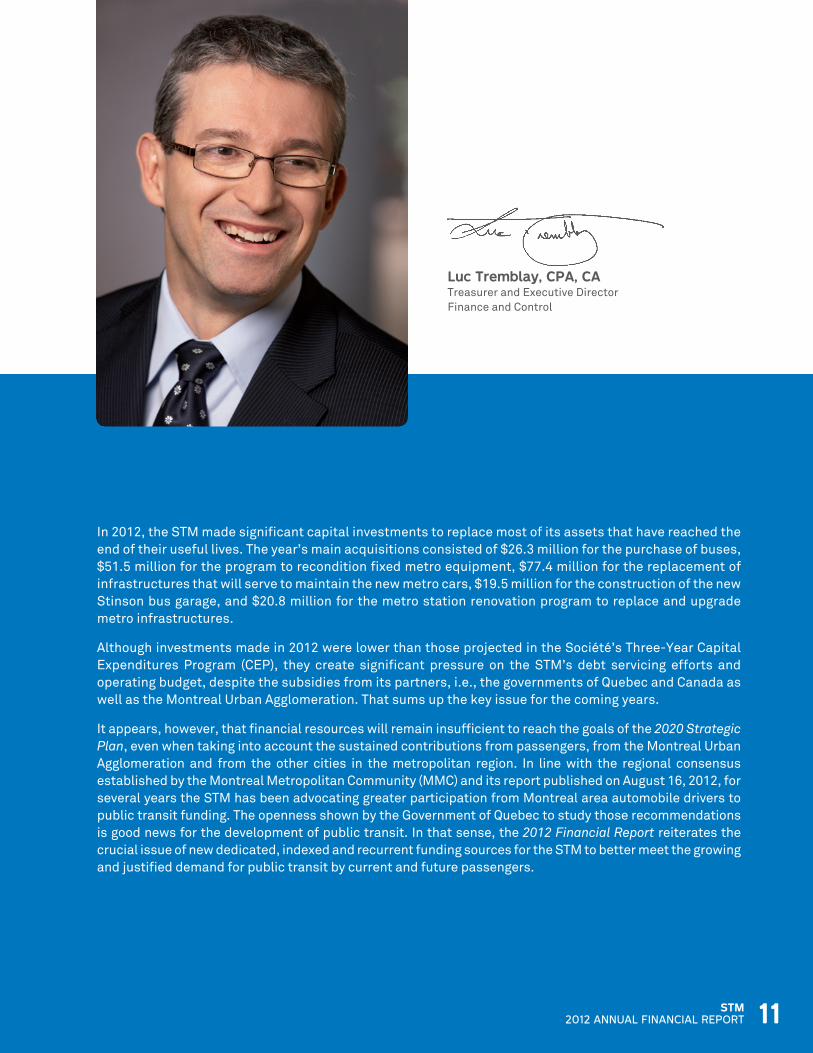
In 2012, the STM made significant capital investments to replace most of its assets that have reached the end of their useful lives. The year’s main acquisitions consisted of $26.3 million for the purchase of buses, $51.5 million for the program to recondition fixed metro equipment, $77.4 million for the replacement of infrastructures that will serve to maintain the new metro cars, $19.5 million for the construction of the new Stinson bus garage, and $20.8 million for the metro station renovation program to replace and upgrade metro infrastructures.
Although investments made in 2012 were lower than those projected in the Société’s Three-Year Capital Expenditures Program (CEP), they create significant pressure on the STM’s debt servicing efforts and operating budget, despite the subsidies from its partners, i.e., the governments of Quebec and Canada as well as the Montreal Urban Agglomeration. That sums up the key issue for the coming years.
It appears, however, that financial resources will remain insufficient to reach the goals of the 2020 Strategic Plan, even when taking into account the sustained contributions from passengers, from the Montreal Urban Agglomeration and from the other cities in the metropolitan region. In line with the regional consensus established by the Montreal Metropolitan Community (MMC) and its report published on August 16, 2012, for several years the STM has been advocating greater participation from Montreal area automobile drivers to public transit funding. The openness shown by the Government of Quebec to study those recommendations is good news for the development of public transit. In that sense, the 2012 Financial Report reiterates the crucial issue of new dedicated, indexed and recurrent funding sources for the STM to better meet the growing and justified demand for public transit by current and future passengers.
Luc Tremblay, CPA, CATreasurer and Executive DirectorFinance and Control
11STM2012 ANNUAL FINANCIAL REPORT

12 STM2012 ANNUAL FINANCIAL REPORT
13STM2012 ANNUAL FINANCIAL REPORT
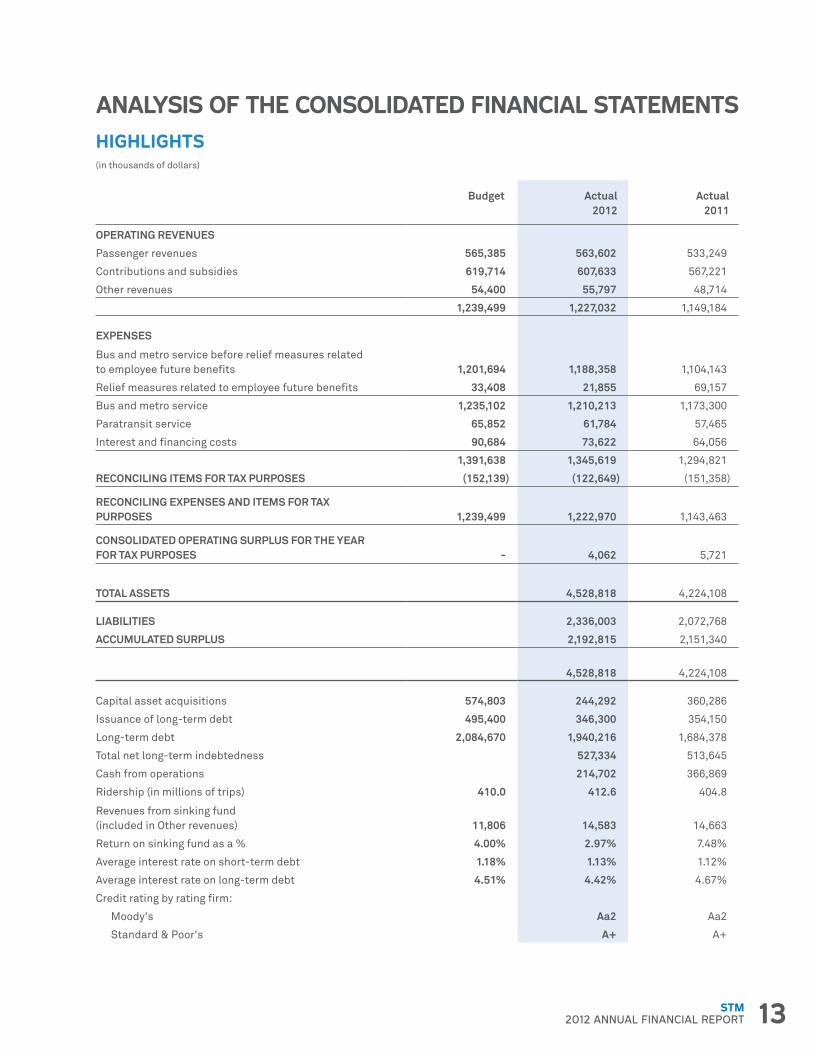
ANALYSIS OF THE CONSOLIDATED FINANCIAL STATEMENTSHIGHLIGHTS(in thousands of dollars)
- Budget Actual 2012
Actual 2011
OPERATING REVENUES - - -
Passenger revenues 565,385 563,602 533,249
Contributions and subsidies 619,714 607,633 567,221
Other revenues 54,400 55,797 48,714
- 1,239,499 1,227,032 1,149,184
EXPENSES - - -
Bus and metro service before relief measures related to employee future benefits 1,201,694 1,188,358 1,104,143
Relief measures related to employee future benefits 33,408 21,855 69,157
Bus and metro service 1,235,102 1,210,213 1,173,300
Paratransit service 65,852 61,784 57,465
Interest and financing costs 90,684 73,622 64,056
- 1,391,638 1,345,619 1,294,821
RECONCILING ITEMS FOR TAX PURPOSES (152,139) (122,649) (151,358)
RECONCILING EXPENSES AND ITEMS FOR TAX PURPOSES 1,239,499 1,222,970 1,143,463
CONSOLIDATED OPERATING SURPLUS FOR THE YEAR FOR TAX PURPOSES - 4,062 5,721
TOTAL ASSETS - 4,528,818 4,224,108
LIABILITIES - 2,336,003 2,072,768
ACCUMULATED SURPLUS - 2,192,815 2,151,340
- - 4,528,818 4,224,108
Capital asset acquisitions 574,803 244,292 360,286
Issuance of long-term debt 495,400 346,300 354,150
Long-term debt 2,084,670 1,940,216 1,684,378
Total net long-term indebtedness - 527,334 513,645
Cash from operations - 214,702 366,869
Ridership (in millions of trips) 410.0 412.6 404.8
Revenues from sinking fund (included in Other revenues) 11,806 14,583 14,663
Return on sinking fund as a % 4.00% 2.97% 7.48%
Average interest rate on short-term debt 1.18% 1.13% 1.12%
Average interest rate on long-term debt 4.51% 4.42% 4.67%
Credit rating by rating firm: - - -
Moody's - Aa2 Aa2
Standard & Poor's - A+ A+
14 STM2012 ANNUAL FINANCIAL REPORT
ACCOUNTING FRAMEWORK (NOTE 2)As an other government organization, the Société applies the Canadian public sector accounting standards issued by the Public Sector Accounting Board. Choosing this framework is consistent with the legal requirements of the Société’s incorporating act and meets the needs of its principal users.
As per the classification of the Ministère des Affaires Municipales, des Régions et de l’Occupation du Territoire (MAMROT), the Société’s consolidated financial statements provide information on the accounting particularities applicable to Quebec municipal governments in accordance with Canadian public sector accounting standards and reflect the legal requirements applicable to financial reporting. In addition, the Société presents certain financial information for tax purposes, i.e., consolidated operating surplus for tax purposes; consolidated investing surplus (deficit) for tax purposes; the breakdown of the consolidated accumulated surplus; and consolidated total net long-term indebtedness. The components of the consolidated accumulated surplus are not presented in the Consolidated Statement of Financial Position but rather in a supplementary table (table 1).
CONSOLIDATED OPERATING SURPLUS FOR TAX PURPOSES
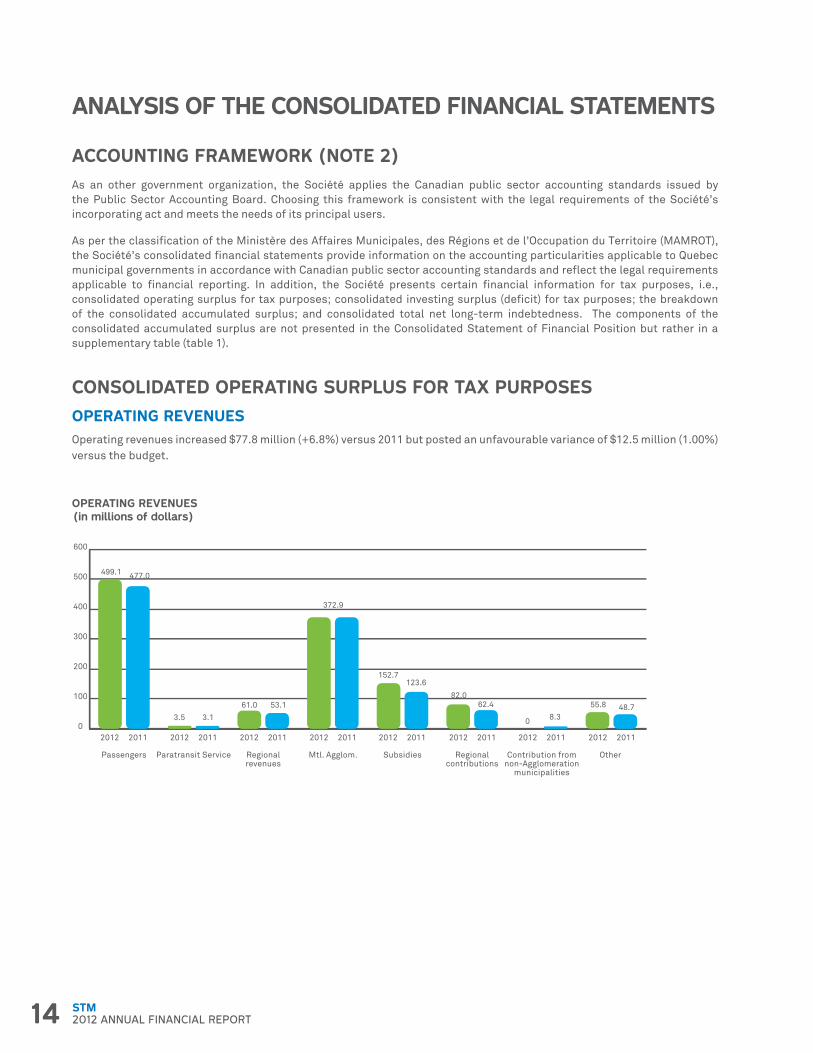
OPERATING REVENUES Operating revenues increased $77.8 million (+6.8%) versus 2011 but posted an unfavourable variance of $12.5 million (1.00%) versus the budget.
0
100
200
300
400
500
600
Other Contribution fromnon-Agglomeration
municipalities
Regionalcontributions
SubsidiesMtl. Agglom.Regionalrevenues
Paratransit ServicePassengers
2012 2011 2012 2011 2012 2011 2012 2011 2012 2011 2012 2011 2012 2011 2012 2011
499.1 477.0
3.5 3.1
61.0 53.1
372.9
152.7123.6
82.062.4
0 8.3
55.8 48.7
OPERATING REVENUES (in millions of dollars)
ANALYSIS OF THE CONSOLIDATED FINANCIAL STATEMENTS
15STM2012 ANNUAL FINANCIAL REPORT
ANALYSIS OF THE CONSOLIDATED FINANCIAL STATEMENTS
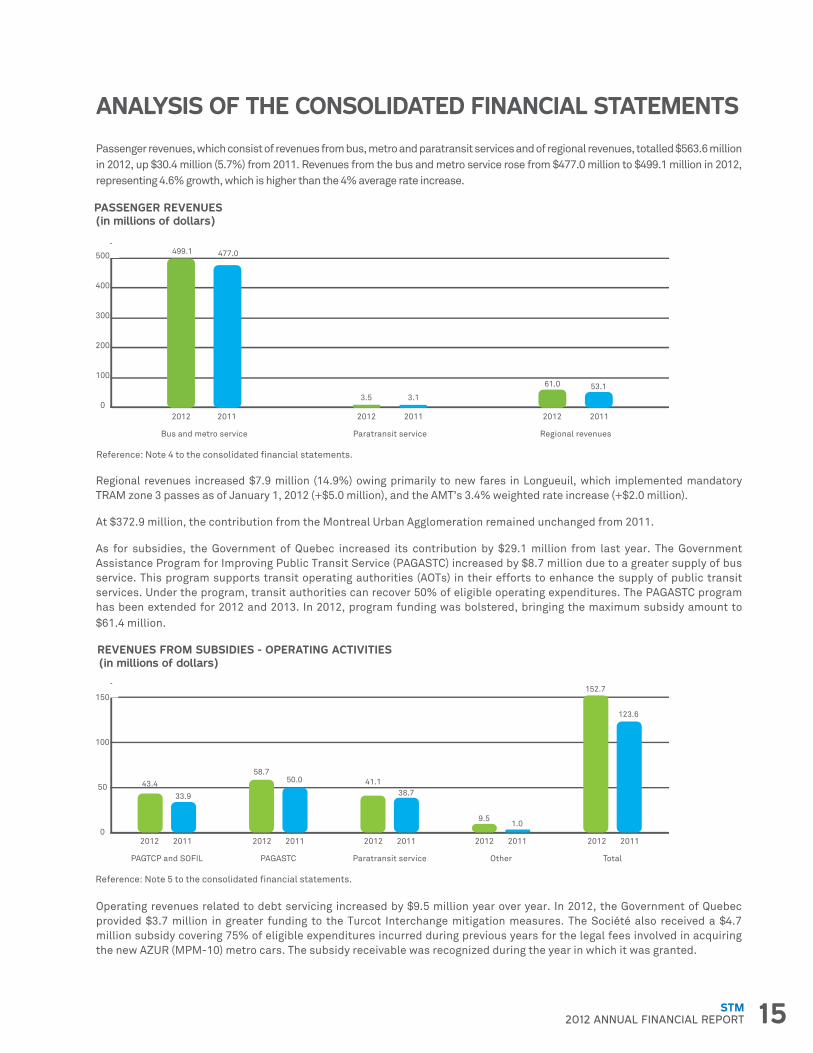
Passenger revenues, which consist of revenues from bus, metro and paratransit services and of regional revenues, totalled $563.6 million in 2012, up $30.4 million (5.7%) from 2011. Revenues from the bus and metro service rose from $477.0 million to $499.1 million in 2012, representing 4.6% growth, which is higher than the 4% average rate increase.
Reference: Note 4 to the consolidated financial statements.
PASSENGER REVENUES (in millions of dollars)
0
100
200
300
400
500
600
Regional revenuesParatransit serviceBus and metro service
2012 2011 2012 2011 2012 2011
499.1 477.0
3.5 3.1
61.0 53.1
Regional revenues increased $7.9 million (14.9%) owing primarily to new fares in Longueuil, which implemented mandatory TRAM zone 3 passes as of January 1, 2012 (+$5.0 million), and the AMT’s 3.4% weighted rate increase (+$2.0 million).
At $372.9 million, the contribution from the Montreal Urban Agglomeration remained unchanged from 2011.
As for subsidies, the Government of Quebec increased its contribution by $29.1 million from last year. The Government Assistance Program for Improving Public Transit Service (PAGASTC) increased by $8.7 million due to a greater supply of bus service. This program supports transit operating authorities (AOTs) in their efforts to enhance the supply of public transit services. Under the program, transit authorities can recover 50% of eligible operating expenditures. The PAGASTC program has been extended for 2012 and 2013. In 2012, program funding was bolstered, bringing the maximum subsidy amount to $61.4 million.
Reference: Note 5 to the consolidated financial statements.
REVENUES FROM SUBSIDIES - OPERATING ACTIVITIES (in millions of dollars)
0
50
100
150
200
TotalOtherParatransit servicePAGASTCPAGTCP and SOFIL
2012 2011 2012 2011 2012 2011 2012 2011 2012 2011
43.4
33.9
58.750.0 41.1
38.7
9.51.0
152.7
123.6
Operating revenues related to debt servicing increased by $9.5 million year over year. In 2012, the Government of Quebec provided $3.7 million in greater funding to the Turcot Interchange mitigation measures. The Société also received a $4.7 million subsidy covering 75% of eligible expenditures incurred during previous years for the legal fees involved in acquiring the new AZUR (MPM-10) metro cars. The subsidy receivable was recognized during the year in which it was granted.
16 STM2012 ANNUAL FINANCIAL REPORT
ANALYSIS OF THE CONSOLIDATED FINANCIAL STATEMENTS
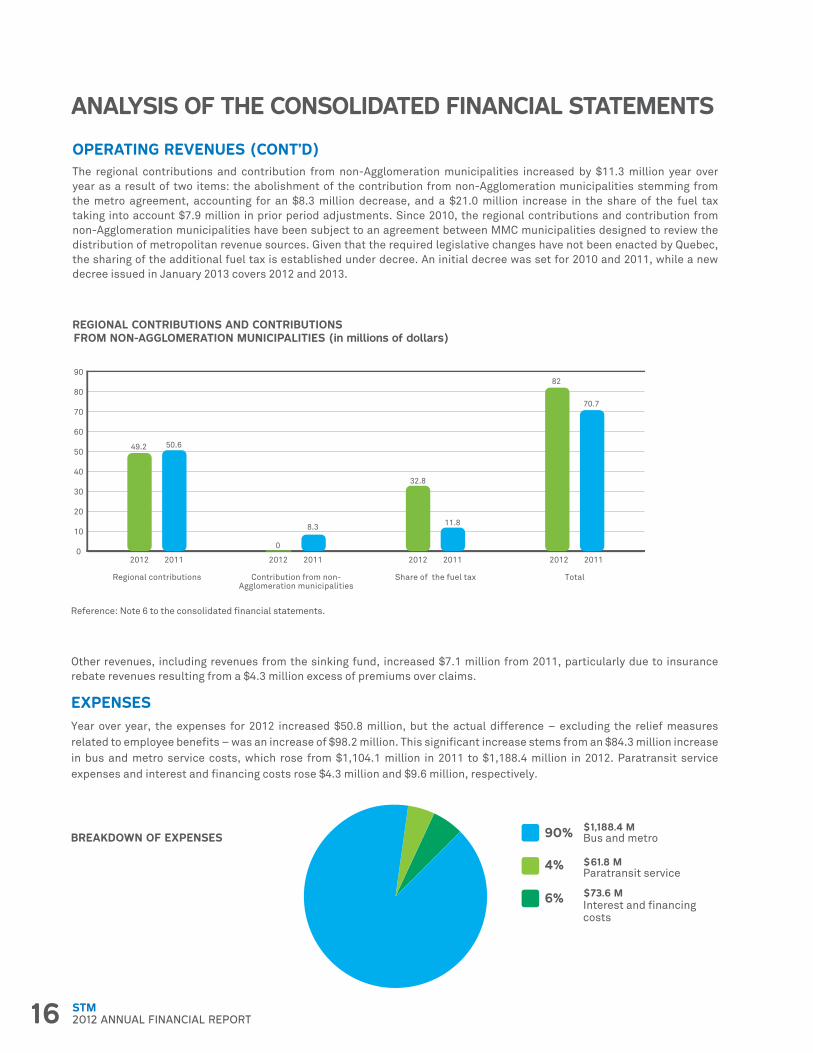
OPERATING REVENUES (CONT’D)The regional contributions and contribution from non-Agglomeration municipalities increased by $11.3 million year over year as a result of two items: the abolishment of the contribution from non-Agglomeration municipalities stemming from the metro agreement, accounting for an $8.3 million decrease, and a $21.0 million increase in the share of the fuel tax taking into account $7.9 million in prior period adjustments. Since 2010, the regional contributions and contribution from non-Agglomeration municipalities have been subject to an agreement between MMC municipalities designed to review the distribution of metropolitan revenue sources. Given that the required legislative changes have not been enacted by Quebec, the sharing of the additional fuel tax is established under decree. An initial decree was set for 2010 and 2011, while a new decree issued in January 2013 covers 2012 and 2013.
Reference: Note 6 to the consolidated financial statements.
0
10
20
30
40
50
60
70
80
90
TotalShare of the fuel taxContribution from non-Agglomeration municipalities
Regional contributions
2012 2011 2012 2011 2012 2011 2012 2011
49.2 50.6
0
8.3
32.8
11.8
82
70.7
REGIONAL CONTRIBUTIONS AND CONTRIBUTIONS FROM NON-AGGLOMERATION MUNICIPALITIES (in millions of dollars)
Other revenues, including revenues from the sinking fund, increased $7.1 million from 2011, particularly due to insurance rebate revenues resulting from a $4.3 million excess of premiums over claims.
EXPENSESYear over year, the expenses for 2012 increased $50.8 million, but the actual difference – excluding the relief measures related to employee benefits – was an increase of $98.2 million. This significant increase stems from an $84.3 million increase in bus and metro service costs, which rose from $1,104.1 million in 2011 to $1,188.4 million in 2012. Paratransit service expenses and interest and financing costs rose $4.3 million and $9.6 million, respectively.
90% $1,188.4 MBus and metro
6% $73.6 MInterest and financingcosts
4% $61.8 MParatransit service
BREAKDOWN OF EXPENSES
17STM2012 ANNUAL FINANCIAL REPORT
ANALYSIS OF THE CONSOLIDATED FINANCIAL STATEMENTS
The year-over-year increase in bus and metro service costs was partly due to the greater supply of public transit services, which resulted in an approximate 6.2% increase in bus kilometrage and additional costs of approximately $31.2 million in bus service (50% of which is assumed by the Government of Quebec). Moreover, a $2.6 million increase in costs was due to several factors, including the transitional measures to prepare for the new AZUR metro cars. In terms of expenses by item, compensation and benefits totalled $793.9 million in 2012 and $744.4 million in 2011 excluding the relief measures related to employee future benefits of $21.9 million in 2012 and $69.2 million in 2011. The $49.5 million increase (+6.6%) was due to the hiring of 433 full-time employees (+$39.2 million) and the salary escalation (+10.3 million) set out in the collective agreements.
The year-over-year increase in paratransit service expenses comes from an overall 6.9% increase in trips.
Interest on long-term debt increased by $9.5 million. This increase resulted from the increase in loans used to finance new investments. Interest on short-term debt remained unchanged from the previous year as the average interest rate for the year and amounts borrowed remained stable.
Financing costs were $17.1 million below budget, as the Société had anticipated greater investment and therefore greater borrowing in 2012. Moreover, the budget did not provide for the interest on long-term debt to be capitalized to capital assets. This interest amounted to $12.9 million in 2012 ($16.1 million in 2011).
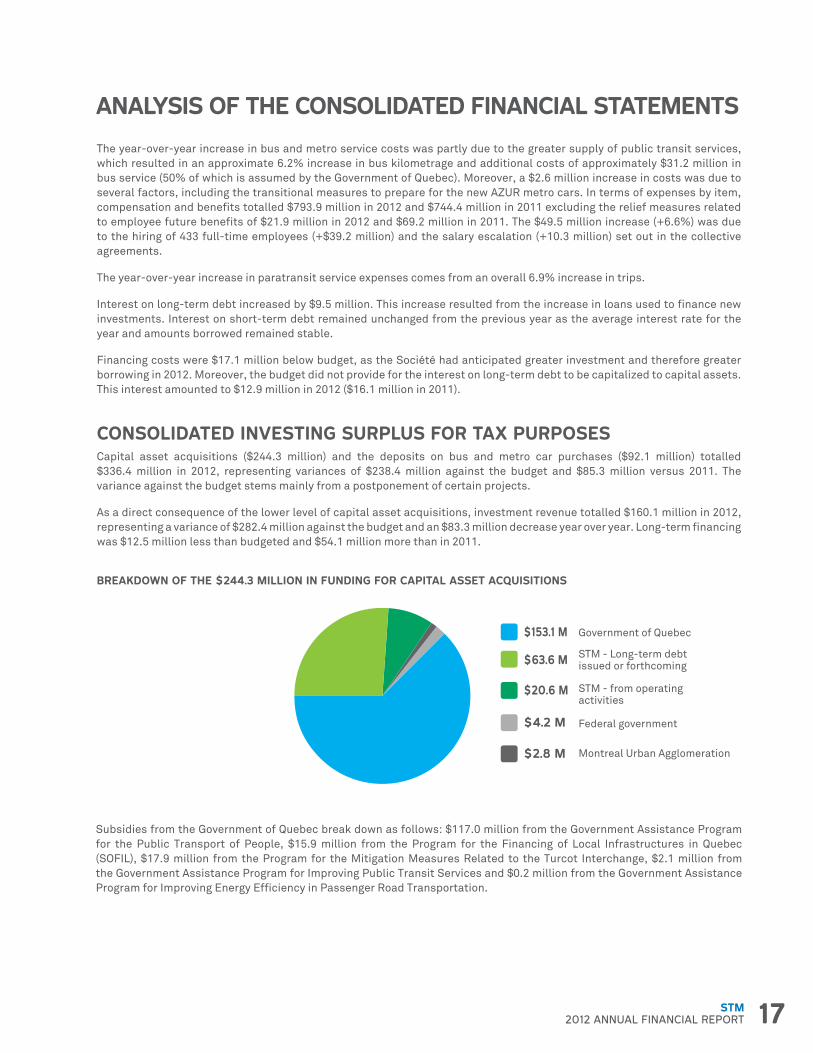
CONSOLIDATED INVESTING SURPLUS FOR TAX PURPOSESCapital asset acquisitions ($244.3 million) and the deposits on bus and metro car purchases ($92.1 million) totalled $336.4 million in 2012, representing variances of $238.4 million against the budget and $85.3 million versus 2011. The variance against the budget stems mainly from a postponement of certain projects.
As a direct consequence of the lower level of capital asset acquisitions, investment revenue totalled $160.1 million in 2012, representing a variance of $282.4 million against the budget and an $83.3 million decrease year over year. Long-term financing was $12.5 million less than budgeted and $54.1 million more than in 2011.
$153.1 M Government of Quebec
$20.6 M STM - from operatingactivities
$63.6 M STM - Long-term debtissued or forthcoming
$4.2 M Federal government
$2.8 M Montreal Urban Agglomeration
BREAKDOWN OF THE $244.3 MILLION IN FUNDING FOR CAPITAL ASSET ACQUISITIONS
Subsidies from the Government of Quebec break down as follows: $117.0 million from the Government Assistance Program for the Public Transport of People, $15.9 million from the Program for the Financing of Local Infrastructures in Quebec (SOFIL), $17.9 million from the Program for the Mitigation Measures Related to the Turcot Interchange, $2.1 million from the Government Assistance Program for Improving Public Transit Services and $0.2 million from the Government Assistance Program for Improving Energy Efficiency in Passenger Road Transportation.
18 STM2012 ANNUAL FINANCIAL REPORT
ANALYSIS OF THE CONSOLIDATED FINANCIAL STATEMENTS
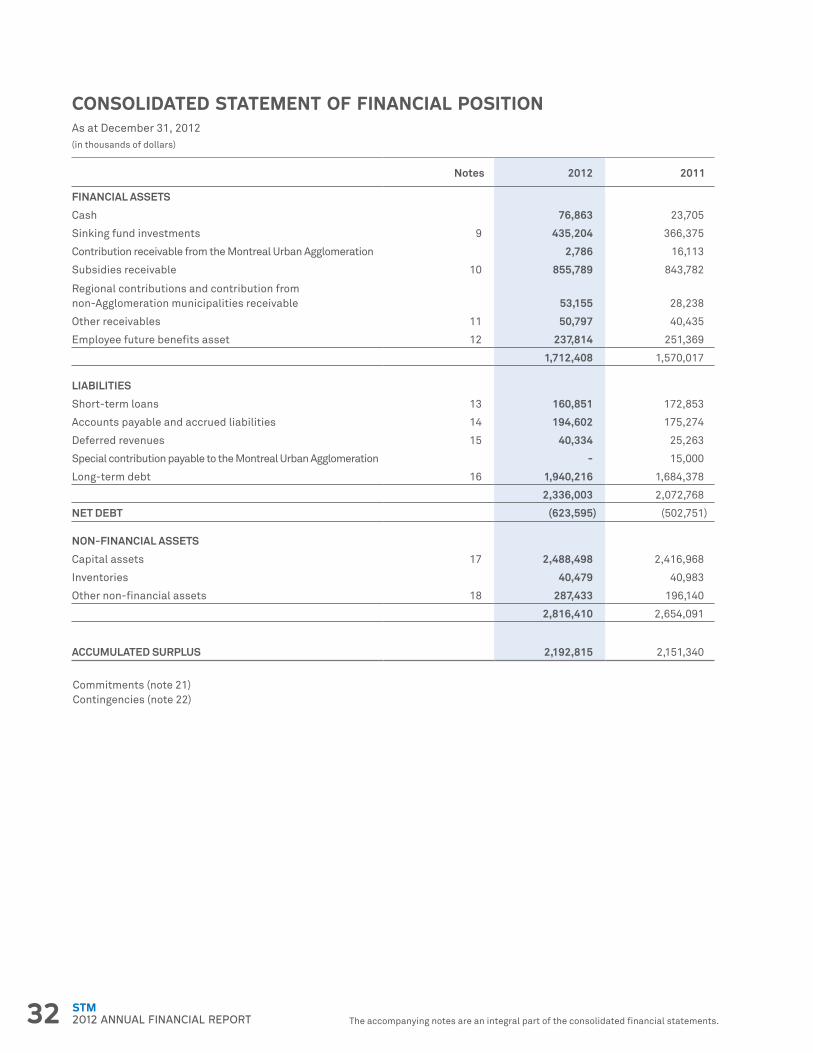
CONSOLIDATED STATEMENT OF FINANCIAL POSITION
FINANCIAL ASSETS
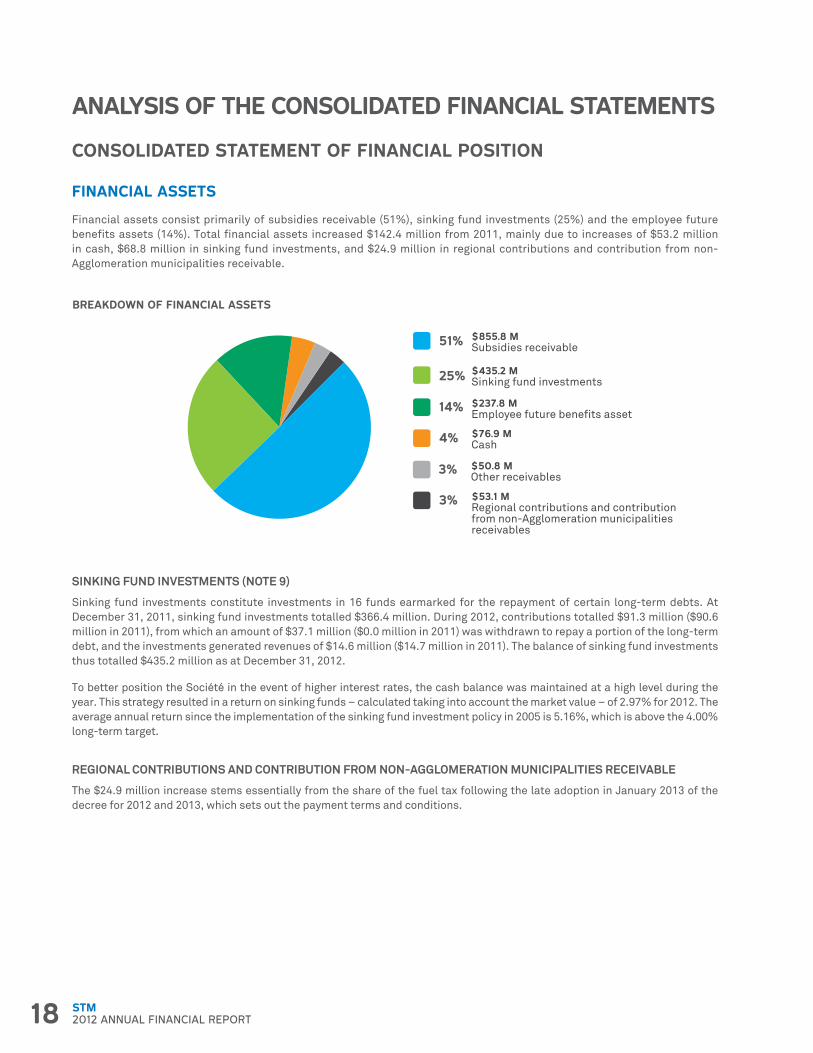
Financial assets consist primarily of subsidies receivable (51%), sinking fund investments (25%) and the employee future benefits assets (14%). Total financial assets increased $142.4 million from 2011, mainly due to increases of $53.2 million in cash, $68.8 million in sinking fund investments, and $24.9 million in regional contributions and contribution from non-Agglomeration municipalities receivable.
51% $855.8 MSubsidies receivable
14% $237.8 MEmployee future benefits asset
25% $435.2 MSinking fund investments
3% $50.8 MOther receivables
3% $53.1 MRegional contributions and contributionfrom non-Agglomeration municipalitiesreceivables
4% $76.9 MCash
BREAKDOWN OF FINANCIAL ASSETS
SINKING FUND INVESTMENTS (NOTE 9)
Sinking fund investments constitute investments in 16 funds earmarked for the repayment of certain long-term debts. At December 31, 2011, sinking fund investments totalled $366.4 million. During 2012, contributions totalled $91.3 million ($90.6 million in 2011), from which an amount of $37.1 million ($0.0 million in 2011) was withdrawn to repay a portion of the long-term debt, and the investments generated revenues of $14.6 million ($14.7 million in 2011). The balance of sinking fund investments thus totalled $435.2 million as at December 31, 2012.
To better position the Société in the event of higher interest rates, the cash balance was maintained at a high level during the year. This strategy resulted in a return on sinking funds – calculated taking into account the market value – of 2.97% for 2012. The average annual return since the implementation of the sinking fund investment policy in 2005 is 5.16%, which is above the 4.00% long-term target.
REGIONAL CONTRIBUTIONS AND CONTRIBUTION FROM NON-AGGLOMERATION MUNICIPALITIES RECEIVABLE
The $24.9 million increase stems essentially from the share of the fuel tax following the late adoption in January 2013 of the decree for 2012 and 2013, which sets out the payment terms and conditions.
19STM2012 ANNUAL FINANCIAL REPORT
ANALYSIS OF THE CONSOLIDATED FINANCIAL STATEMENTS
EMPLOYEE FUTURE BENEFITS ASSET (NOTE 12)
This item consists of amounts in the Statement of Financial Position that were recognized with respect to pension plans as well as other supplementary retirement benefits and post-employment benefits. As at December 31, 2012, the employee future benefits asset stood at $237.8 million ($251.4 million in 2011). The $237.8 million amount is comprised of the following: a $351.2 million asset for the pension plans and a $113.4 million liability for supplementary retirement benefits and post-employment benefits.
The $351.2 million asset for the pension plans stems essentially from $364.9 million in unamortized actuarial losses that will be amortized in subsequent years over the expected average remaining service life. These losses constitute the limit on the accrued benefit asset, as required under the employee future benefits accounting standards. The $364.9 million decrease in this asset ($380.6 million in 2011) results in a higher employee future benefits expense in the Statement of Operations. As per the tax relief permitted by MAMROT following the financial crisis that was prevailing in 2008, this change in expense was allocated to the provision for future amounts in the Consolidated Operating Surplus for Tax Purposes.
With respect to the other types of employee future benefit plans (supplementary retirement benefits and post-employment benefits), the liability increased by $2.9 million, representing the difference between the $4.8 million in contributions paid and the $7.7 million expense, bringing the liability to $113.4 million.
LIABILITIES
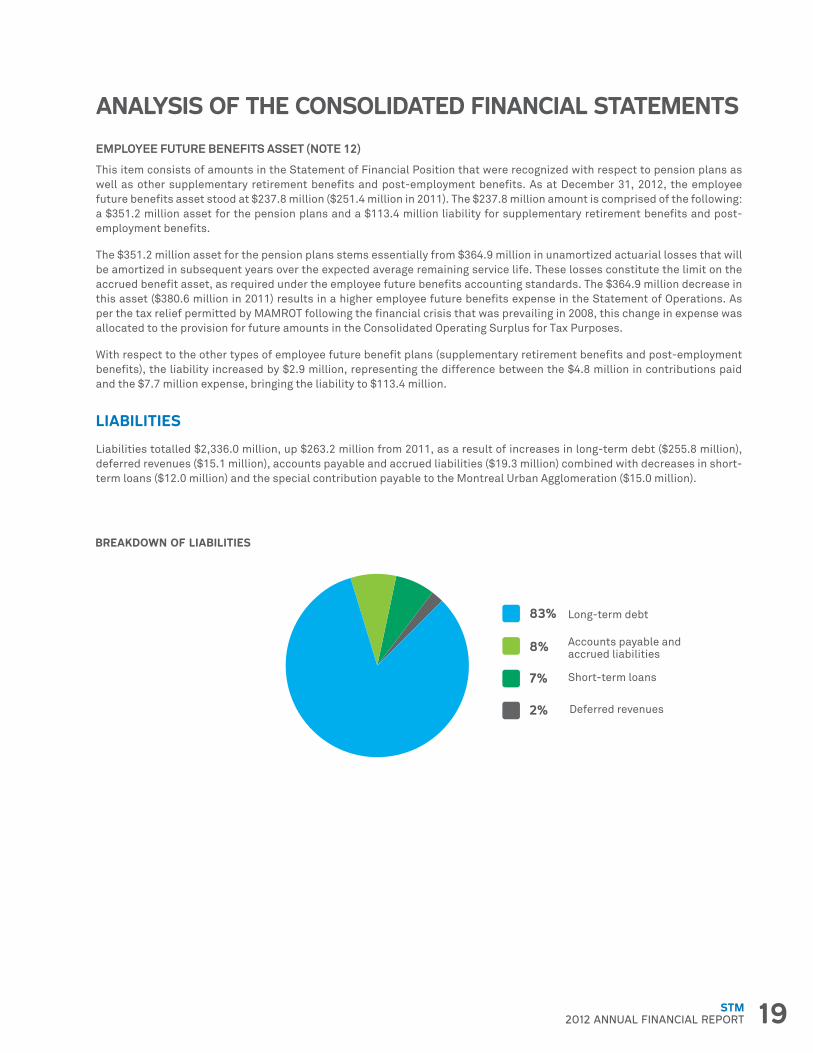
Liabilities totalled $2,336.0 million, up $263.2 million from 2011, as a result of increases in long-term debt ($255.8 million), deferred revenues ($15.1 million), accounts payable and accrued liabilities ($19.3 million) combined with decreases in short-term loans ($12.0 million) and the special contribution payable to the Montreal Urban Agglomeration ($15.0 million).
83% Long-term debt
7% Short-term loans
8% Accounts payable andaccrued liabilities
2% Deferred revenues
BREAKDOWN OF LIABILITIES
20 STM2012 ANNUAL FINANCIAL REPORT
ANALYSIS OF THE CONSOLIDATED FINANCIAL STATEMENTS
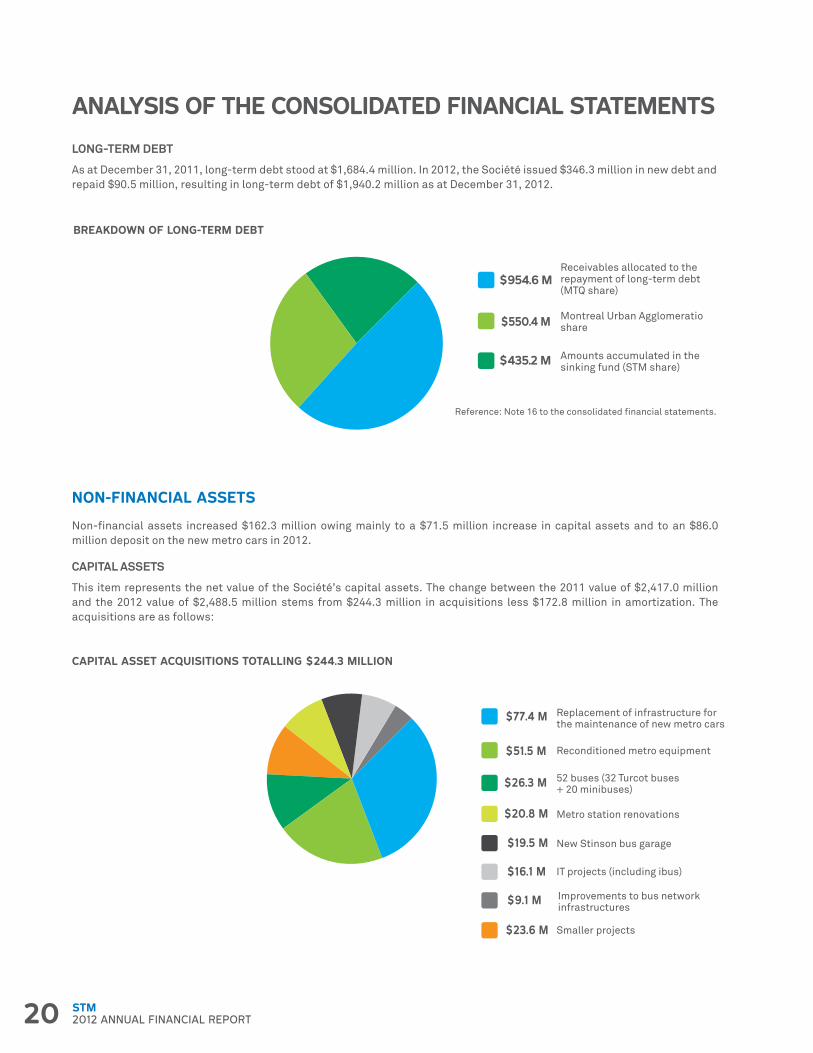
LONG-TERM DEBT
As at December 31, 2011, long-term debt stood at $1,684.4 million. In 2012, the Société issued $346.3 million in new debt and repaid $90.5 million, resulting in long-term debt of $1,940.2 million as at December 31, 2012.
Reference: Note 16 to the consolidated financial statements.
$954.6 MReceivables allocated to the repayment of long-term debt(MTQ share)
$435.2 M Amounts accumulated in thesinking fund (STM share)
$550.4 M Montreal Urban Agglomerationshare
BREAKDOWN OF LONG-TERM DEBT
NON-FINANCIAL ASSETS
Non-financial assets increased $162.3 million owing mainly to a $71.5 million increase in capital assets and to an $86.0 million deposit on the new metro cars in 2012.
CAPITAL ASSETS
This item represents the net value of the Société’s capital assets. The change between the 2011 value of $2,417.0 million and the 2012 value of $2,488.5 million stems from $244.3 million in acquisitions less $172.8 million in amortization. The acquisitions are as follows:
$77.4 M Replacement of infrastructure for the maintenance of new metro cars
$26.3 M
Smaller projects
$51.5 M Reconditioned metro equipment
$23.6 M
52 buses (32 Turcot buses + 20 minibuses)
$20.8 M Metro station renovations
$19.5 M New Stinson bus garage
$16.1 M IT projects (including ibus)
$9.1 M Improvements to bus networkinfrastructures
CAPITAL ASSET ACQUISITIONS TOTALLING $244.3 MILLION

21STM2012 ANNUAL FINANCIAL REPORT
ANALYSIS OF THE CONSOLIDATED FINANCIAL STATEMENTS
PURCHASE OF METRO CARS
In October 2010, the Société launched its project to purchase 468 metro cars for an estimated price of $2,424.0 million. This amount had included costs of $2,156.0 million for the purchase of rolling stock (including the signing of a $1,811.6 million contract with a consortium) and of $268.0 million to make the necessary modifications to repair centres and metro equipment to accommodate the new cars.
As at December 31, 2012, under the contract that was signed, the Société paid $258.5 million in deposits to the consortium for the metro car purchases, as presented in «Other non-financial assets» of the Consolidated Statement of Financial Position.
The contract was revised downward in 2012 by an amount of $3.1 million following the Société’s decision to exercise only one of the contract’s initial options. During 2012, $77.4 million was allocated to repair centres and metro equipment modifications prior to the scheduled 2014 delivery of the metro cars, as specified in the contract.
FIN
AN
CIA
LIN
FOR
MA
TIO
N
23STM2012 ANNUAL FINANCIAL REPORT
MANAGEMENT’S RESPONSIBILITY FOR FINANCIAL REPORTINGPursuant to sections 136 and 138 of An act respecting public transit authorities (R.S.Q. chapter S-30.01), the consolidated financial statements for the year ended December 31, 2012 included in the Annual Financial Report of the Société de transport de Montréal were certified and submitted by the treasurer at a meeting of the Board of Directors on April 3, 2013.
The consolidated financial statements and all other information in this financial report are the responsibility of the Société’s management. Management has also ensured that there is consistency between the consolidated financial statements and all other information disclosed in the financial report.
The consolidated financial statements contain certain amounts that are based on the use of professional judgment and estimates, the presentation of which gives due consideration to their materiality. Management has established these amounts in a reasonable manner so as to ensure that the consolidated financial statements present fairly, in all material respects, the financial position of the Société.
The Société’s management maintains internal accounting and administrative control systems to ensure the integrity and objectivity of the financial information. Management considers that these internal control systems, the purpose of which is to provide a reasonable degree of certainty that the financial information is pertinent, reliable and exact; that the policies of the organization are followed; that operations are carried out in accordance with the appropriate authorizations; and that the Société’s assets are properly recorded and safeguarded, provide reasonable assurance that the accounting records are reliable and form an appropriate foundation for the preparation of the consolidated financial statements.
The Board of Directors exercises its responsibility with regard to the consolidated financial statements contained in the financial report primarily through its audit committee, which is composed of members of the Board of Directors and external members. The Audit Committee examines the consolidated financial statements prepared by the treasurer and recommends their approval by the Board of Directors.
The consolidated financial statements have been audited jointly by the Auditor General of the Ville de Montréal and by Deloitte s.e.n.c.r.l., whose services were retained by the Board of Directors on the recommendation of the Audit Committee.
Luc Tremblay, CPA, CATreasurer and Executive Director Finance and Control
Angèle Dubé, CPA, CADirector and Assistant Treasurer Financial Management and Control
24 STM2012 ANNUAL FINANCIAL REPORT
INDEPENDENT AUDITOR’S REPORT
To the members of the Board of Directors of Société de transport de Montréal
I have audited the accompanying consolidated financial statements of the Société de transport de Montréal (the Société), which comprise the consolidated statement of financial position as at December 31, 2012 and the consolidated statements of operations, change in net debt and cash flows for the year then ended, and a summary of significant accounting policies and other explanatory information.
MANAGEMENT’S RESPONSIBILITY FOR THE CONSOLIDATED FINANCIAL STATEMENTS
Management is responsible for the preparation and fair presentation of these consolidated financial statements in accordance with Canadian public sector accounting standards, and for such internal control as management determines is necessary to enable the preparation of consolidated financial statements that are free from material misstatement, whether due to fraud or error.
AUDITOR’S RESPONSIBILITY
My responsibility is to express an opinion on these consolidated financial statements based on my audit. I conducted my audit in accordance with Canadian generally accepted auditing standards. Those standards require that I comply with ethical requirements and plan and perform the audit to obtain reasonable assurance about whether the consolidated financial statements are free from material misstatement.
An audit involves performing procedures to obtain audit evidence about the amounts and disclosures in the consolidated financial statements. The procedures selected depend on the auditor’s judgment, including the assessment of the risks of material misstatement of the consolidated financial statements, whether due to fraud or error. In making those risk assessments, the auditor considers internal control relevant to the entity’s preparation and fair presentation of the consolidated financial statements in order to design audit procedures that are appropriate in the circumstances, but not for the purpose of expressing an opinion on the effectiveness of the entity’s internal control. An audit also includes evaluating the appropriateness of accounting policies used and the reasonableness of accounting estimates made by management, as well as evaluating the overall presentation of the consolidated financial statements.
I believe that the audit evidence I have obtained is sufficient and appropriate to provide a basis for my audit opinion.
25STM2012 ANNUAL FINANCIAL REPORT
OPINION
In my opinion, the consolidated financial statements present fairly, in all material respects, the financial position of the Société de transport de Montréal as at December 31, 2012, and of the results of its operations, change in its net debt, and its cash flows for the year then ended, in accordance with Canadian public sector accounting standards.
OBSERVATIONS
Without modifying my opinion, I draw attention to “Table 1 – Consolidated Accumulated Surplus” of the consolidated financial statements, which states that the Société includes in its consolidated financial statements certain financial information prepared for tax purposes. Management has decided to present this information, which is not required under Canadian public sector accounting standards, as it deems such information necessary in order to provide a more appropriate and comprehensive analysis of the results of operations.
Auditor General of Montréal,
Jacques Bergeron, CPA auditor, CA
Montreal, April 3, 2013
26 STM2012 ANNUAL FINANCIAL REPORT
INDEPENDENT AUDITOR’S REPORT
To the members of the Board of Directors of Société de transport de Montréal
We have audited the accompanying consolidated financial statements of the Société de transport de Montréal (the Société), which comprise the consolidated statement of financial position as at December 31, 2012 and the consolidated statements of operations, change in net debt and cash flows for the year then ended, and a summary of significant accounting policies and other explanatory information.
MANAGEMENT’S RESPONSIBILITY FOR THE CONSOLIDATED FINANCIAL STATEMENTS
Management is responsible for the preparation and fair presentation of these consolidated financial statements in accordance with Canadian public sector accounting standards, and for such internal control as management determines is necessary to enable the preparation of consolidated financial statements that are free from material misstatement, whether due to fraud or error.
AUDITOR’S RESPONSIBILITY
Our responsibility is to express an opinion on these consolidated financial statements based on our audit. We conducted our audit in accordance with Canadian generally accepted auditing standards. Those standards require that we comply with ethical requirements and plan and perform the audit to obtain reasonable assurance about whether the consolidated financial statements are free from material misstatement.
An audit involves performing procedures to obtain audit evidence about the amounts and disclosures in the consolidated financial statements. The procedures selected depend on the auditor’s judgment, including the assessment of the risks of material misstatement of the consolidated financial statements, whether due to fraud or error. In making those risk assessments, the auditor considers internal control relevant to the entity’s preparation and fair presentation of the consolidated financial statements in order to design audit procedures that are appropriate in the circumstances, but not for the purpose of expressing an opinion on the effectiveness of the entity’s internal control. An audit also includes evaluating the appropriateness of accounting policies used and the reasonableness of accounting estimates made by management, as well as evaluating the overall presentation of the consolidated financial statements.
We believe that the audit evidence we have obtained is sufficient and appropriate to provide a basis for our audit opinion.
27STM2012 ANNUAL FINANCIAL REPORT
OPINION
In our opinion, the consolidated financial statements present fairly, in all material respects, the financial position of the Société de transport de Montréal as at December 31, 2012, and of the results of its operations, change in net debt, and cash flows for the year then ended, in accordance with Canadian public sector accounting standards.
OBSERVATIONS
Without modifying our opinion, we draw attention to “Table 1 – Consolidated Accumulated Surplus” of the consolidated financial statements, which states that the Société includes, in its consolidated financial statements, certain financial information prepared for tax purposes. Management has decided to present this information, which is not required under Canadian public sector accounting standards, as it deems such information necessary in order to provide a more appropriate and comprehensive analysis of the results of operations.
Deloitte s.e.n.c.r.l.1CPA auditor, CA, public accountancy permit No. A105976
Montréal, April 3, 2013
Nous estimons que les éléments probants que nous avons obtenus sont suffisants et appropriés pour fonder notre opinion d’audit.
Opinion
À notre avis, les états financiers consolidés donnent, dans tous leurs aspects significatifs, une image fidèle de la situation financière de la Société de Transport de Montréal, au 31 décembre 2012, ainsi que des résultats de ses activités, de la variation de sa dette nette et de ses flux de trésorerie pour l’exercice terminé à cette date, conformément aux Normes comptables canadiennes pour le secteur public.
Observations
Sans pour autant modifier notre opinion, nous attirons l’attention sur le tableau 1 – Excédent accumulé consolidés des états financiers consolidés qui indique que la Société inclut dans ses états financiers consolidés certaines informations financières établies à des fins fiscales. La direction a choisi de présenter ces données, qui ne sont pas exigées selon les Normes comptables canadiennes pour le secteur public, car elle juge qu’elles sont nécessaires en vue d’une analyse pertinente et plus approfondie des résultats des activités réalisées.
Le 3 avril 2013
____________________ 1 CPA auditeur, CA, permis de comptabilité publique no A105976

29STM2012 ANNUAL FINANCIAL REPORTThe accompanying notes are an integral part of the consolidated financial statements.
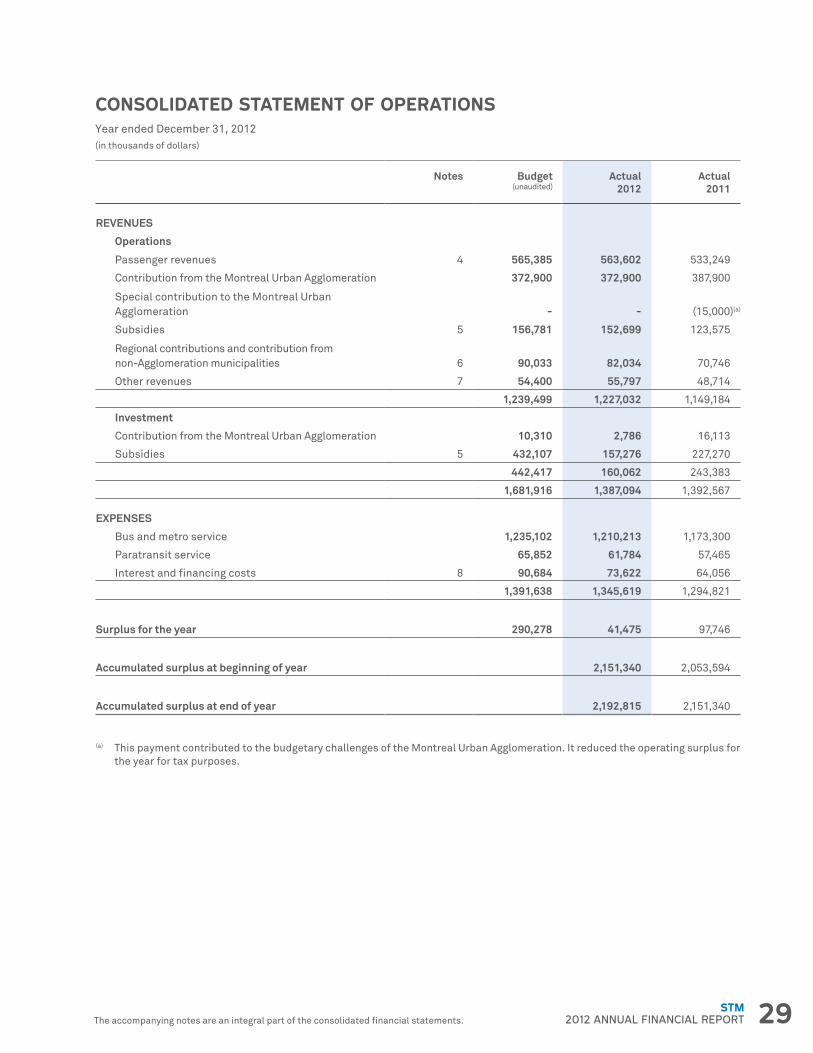
CONSOLIDATED STATEMENT OF OPERATIONSYear ended December 31, 2012 (in thousands of dollars)
- Notes Budget (unaudited)
Actual 2012
Actual 2011
REVENUES - - - -
Operations - - - -
Passenger revenues 4 565,385 563,602 533,249
Contribution from the Montreal Urban Agglomeration - 372,900 372,900 387,900
Special contribution to the Montreal Urban Agglomeration - - - (15,000)(a)
Subsidies 5 156,781 152,699 123,575
Regional contributions and contribution from non-Agglomeration municipalities 6 90,033 82,034 70,746
Other revenues 7 54,400 55,797 48,714
- - 1,239,499 1,227,032 1,149,184
Investment - - - -
Contribution from the Montreal Urban Agglomeration - 10,310 2,786 16,113
Subsidies 5 432,107 157,276 227,270
- - 442,417 160,062 243,383
- - 1,681,916 1,387,094 1,392,567
EXPENSES - - - -
Bus and metro service - 1,235,102 1,210,213 1,173,300
Paratransit service - 65,852 61,784 57,465
Interest and financing costs 8 90,684 73,622 64,056
- - 1,391,638 1,345,619 1,294,821
Surplus for the year - 290,278 41,475 97,746
Accumulated surplus at beginning of year - - 2,151,340 2,053,594
Accumulated surplus at end of year - - 2,192,815 2,151,340
(a) This payment contributed to the budgetary challenges of the Montreal Urban Agglomeration. It reduced the operating surplus for the year for tax purposes.

30 STM2012 ANNUAL FINANCIAL REPORT
CONSOLIDATED OPERATING SURPLUS FOR TAX PURPOSESYear ended December 31, 2012 (in thousands of dollars)
- Budget (unaudited)
Actual 2012
Actual 2011
SURPLUS FOR THE YEAR 290,278 41,475 97,746
Less: investment revenues (442,417) (160,062) (243,383)
Operating deficit for the year before reconciliation for tax purposes (152,139) (118,587) (145,637)
RECONCILIATION FOR TAX PURPOSES - - -
Capital assets - - -
Proceeds from disposal - 78 4,296
Amortization 174,043 172,757 159,873
Gain on disposal - (73) (289)
- 174,043 172,762 163,880
Financing - - -
Repayment of long-term debt, net of refinancing (79,708) (90,462) (44,228)
Subsidy on the repayment of long-term debt - - -
and on the contribution to the sinking fund 95,146 109,360 88,219
- 15,438 18,898 43,991
Allocations - - -
Investing activities (4,250) (20,610) (21,130)
Sinking fund (69,816) (68,829) (105,321)
Working capital fund (984) (984) (1,326)
Unrestricted operating surplus 4,300 5,721 2,996
Provision for future amounts 33,408 15,691 68,268
- (37,342) (69,011) (56,513)
- 152,139 122,649 151,358
Operating surplus for the year for tax purposes - 4,062 5,721
The accompanying notes are an integral part of the consolidated financial statements.
31STM2012 ANNUAL FINANCIAL REPORTThe accompanying notes are an integral part of the consolidated financial statements.
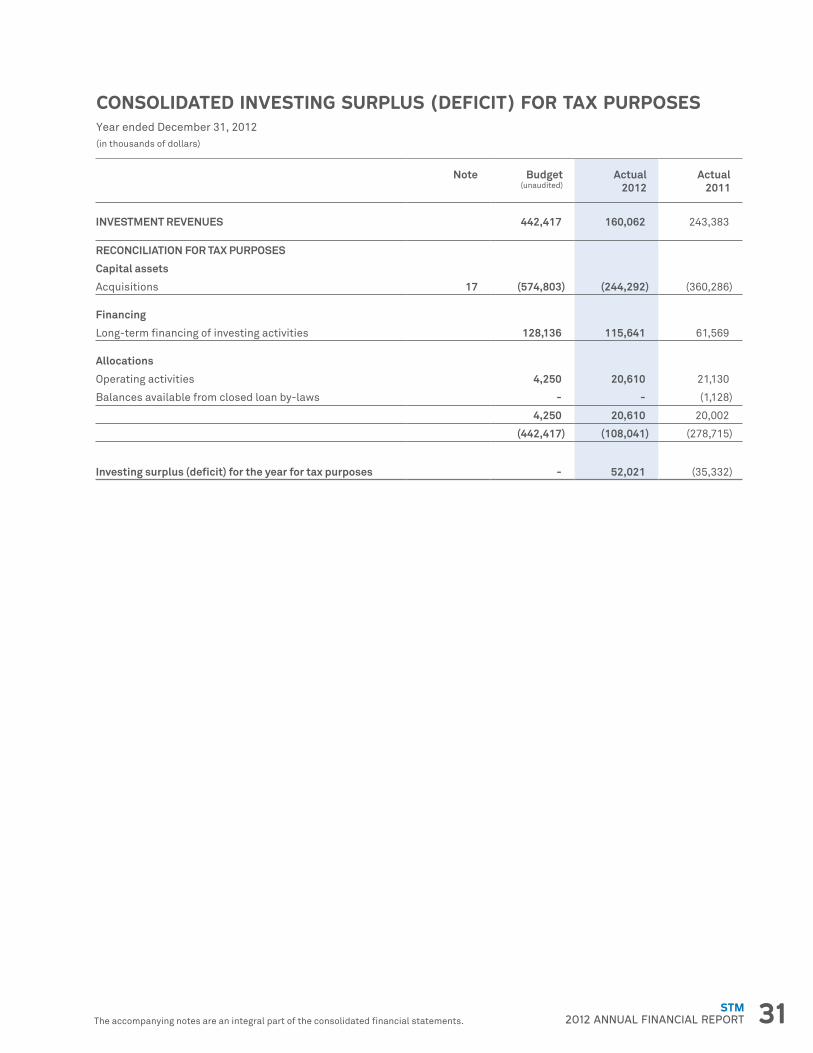
CONSOLIDATED INVESTING SURPLUS (DEFICIT) FOR TAX PURPOSESYear ended December 31, 2012 (in thousands of dollars)
- Note Budget (unaudited)
Actual 2012
Actual 2011
INVESTMENT REVENUES - 442,417 160,062 243,383
RECONCILIATION FOR TAX PURPOSES - - - -
Capital assets - - - -
Acquisitions 17 (574,803) (244,292) (360,286)
Financing - - - -
Long-term financing of investing activities - 128,136 115,641 61,569
Allocations - - - -
Operating activities - 4,250 20,610 21,130
Balances available from closed loan by-laws - - - (1,128)
- - 4,250 20,610 20,002
- - (442,417) (108,041) (278,715)
Investing surplus (deficit) for the year for tax purposes - - 52,021 (35,332)
32 STM2012 ANNUAL FINANCIAL REPORT The accompanying notes are an integral part of the consolidated financial statements.
CONSOLIDATED STATEMENT OF FINANCIAL POSITIONAs at December 31, 2012 (in thousands of dollars)
- Notes 2012 2011
FINANCIAL ASSETS - - -
Cash - 76,863 23,705
Sinking fund investments 9 435,204 366,375
Contribution receivable from the Montreal Urban Agglomeration - 2,786 16,113
Subsidies receivable 10 855,789 843,782
Regional contributions and contribution from non-Agglomeration municipalities receivable - 53,155 28,238
Other receivables 11 50,797 40,435
Employee future benefits asset 12 237,814 251,369
- - 1,712,408 1,570,017
LIABILITIES - - -
Short-term loans 13 160,851 172,853
Accounts payable and accrued liabilities 14 194,602 175,274
Deferred revenues 15 40,334 25,263
Special contribution payable to the Montreal Urban Agglomeration - - 15,000
Long-term debt 16 1,940,216 1,684,378
- - 2,336,003 2,072,768
NET DEBT - (623,595) (502,751)
NON-FINANCIAL ASSETS - - -
Capital assets 17 2,488,498 2,416,968
Inventories - 40,479 40,983
Other non-financial assets 18 287,433 196,140
- - 2,816,410 2,654,091
ACCUMULATED SURPLUS - 2,192,815 2,151,340
Commitments (note 21)Contingencies (note 22)
33STM2012 ANNUAL FINANCIAL REPORTThe accompanying notes are an integral part of the consolidated financial statements.
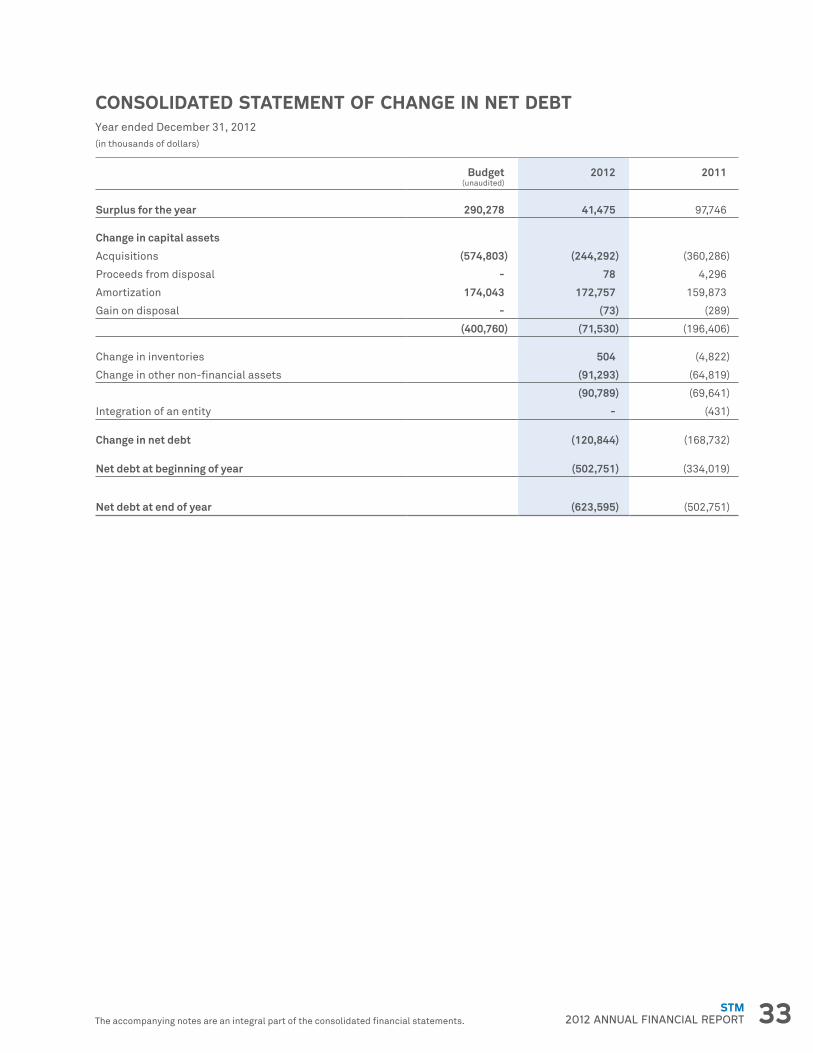
CONSOLIDATED STATEMENT OF CHANGE IN NET DEBTYear ended December 31, 2012 (in thousands of dollars)
-Budget
(unaudited)2012 2011
Surplus for the year 290,278 41,475 97,746
Change in capital assets - - -
Acquisitions (574,803) (244,292) (360,286)
Proceeds from disposal - 78 4,296
Amortization 174,043 172,757 159,873
Gain on disposal - (73) (289)
- (400,760) (71,530) (196,406)
Change in inventories - 504 (4,822)
Change in other non-financial assets - (91,293) (64,819)
- - (90,789) (69,641)
Integration of an entity - - (431)
Change in net debt - (120,844) (168,732)
Net debt at beginning of year - (502,751) (334,019)
Net debt at end of year - (623,595) (502,751)
34 STM2012 ANNUAL FINANCIAL REPORT The accompanying notes are an integral part of the consolidated financial statements.
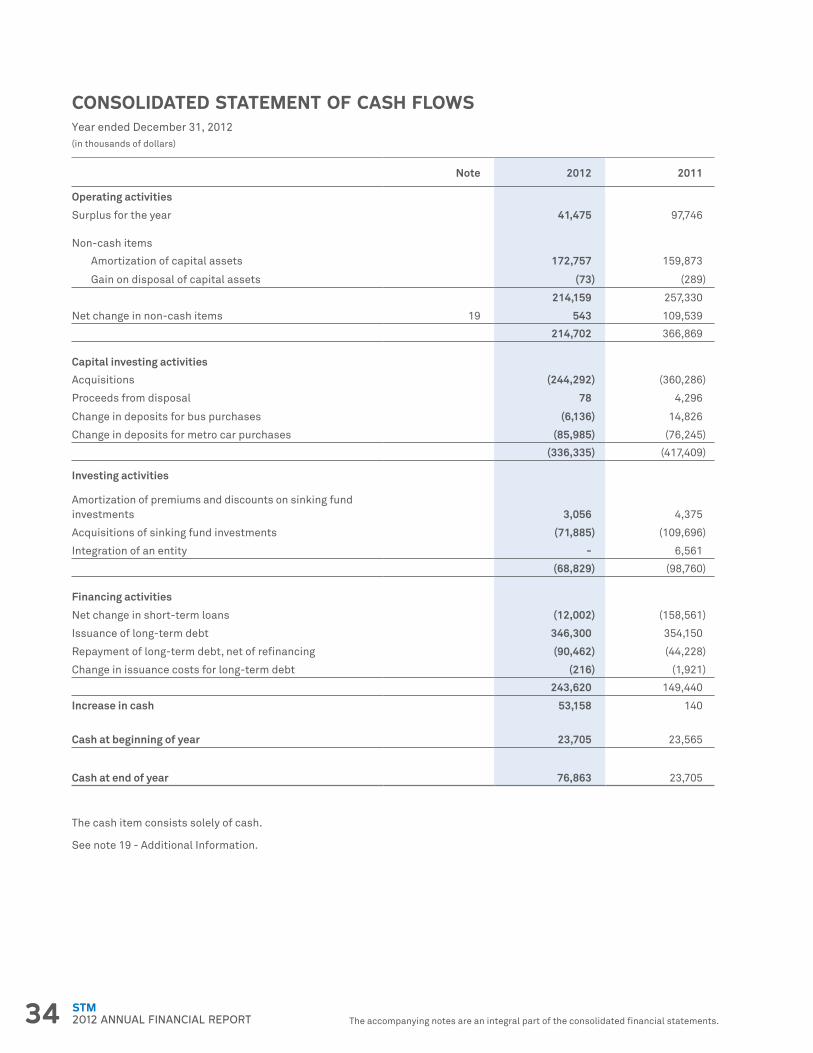
CONSOLIDATED STATEMENT OF CASH FLOWSYear ended December 31, 2012 (in thousands of dollars)
- Note 2012 2011
Operating activities - - -
Surplus for the year - 41,475 97,746
Non-cash items - - -
Amortization of capital assets - 172,757 159,873
Gain on disposal of capital assets - (73) (289)
- - 214,159 257,330
Net change in non-cash items 19 543 109,539
- - 214,702 366,869
Capital investing activities - - -
Acquisitions - (244,292) (360,286)
Proceeds from disposal - 78 4,296
Change in deposits for bus purchases - (6,136) 14,826
Change in deposits for metro car purchases - (85,985) (76,245)
- - (336,335) (417,409)
Investing activities - - -
Amortization of premiums and discounts on sinking fund investments - 3,056 4,375
Acquisitions of sinking fund investments - (71,885) (109,696)
Integration of an entity - - 6,561
- - (68,829) (98,760)
Financing activities - - -
Net change in short-term loans - (12,002) (158,561)
Issuance of long-term debt - 346,300 354,150
Repayment of long-term debt, net of refinancing - (90,462) (44,228)
Change in issuance costs for long-term debt - (216) (1,921)
- - 243,620 149,440
Increase in cash - 53,158 140
Cash at beginning of year - 23,705 23,565
Cash at end of year - 76,863 23,705
The cash item consists solely of cash.
See note 19 - Additional Information.
35STM2012 ANNUAL FINANCIAL REPORTThe accompanying notes are an integral part of the consolidated financial statements.
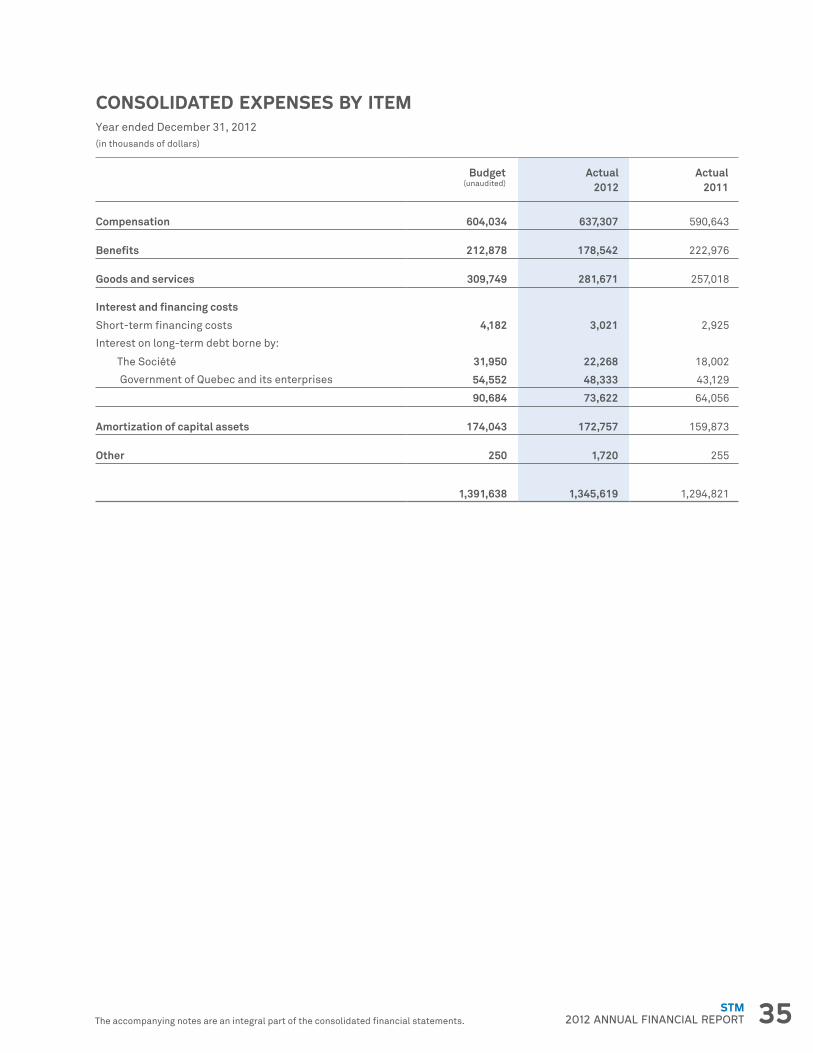
CONSOLIDATED EXPENSES BY ITEMYear ended December 31, 2012 (in thousands of dollars)
- Budget (unaudited)
Actual 2012
Actual 2011
Compensation 604,034 637,307 590,643
Benefits 212,878 178,542 222,976
Goods and services 309,749 281,671 257,018
Interest and financing costs - - -
Short-term financing costs 4,182 3,021 2,925
Interest on long-term debt borne by: - - -
The Société 31,950 22,268 18,002
Government of Quebec and its enterprises 54,552 48,333 43,129
- 90,684 73,622 64,056
Amortization of capital assets 174,043 172,757 159,873
Other 250 1,720 255
- 1,391,638 1,345,619 1,294,821
36 STM2012 ANNUAL FINANCIAL REPORT
NOTES TO THE CONSOLIDATED FINANCIAL STATEMENTSAs at December 31, 2012(in thousands of dollars)
1. GOVERNING STATUTES AND NATURE OF ACTIVITIES
The Société de transport de Montréal (hereafter the Société) is incorporated under An act respecting public transit authorities (R.S.Q. chapter S-30.01) and is responsible for organizing and providing public transit services, primarily on the Island of Montreal.
The Société is exempt from corporate income tax under paragraph 149(1)(c) of the Income Tax Act and under Section 984 of the Taxation Act (Quebec).
2. SIGNIFICANT ACCOUNTING POLICIES
As an other government organization, the Société’s consolidated financial statements have been prepared in accordance with Canadian public sector accounting standards.
The significant accounting policies used are as follows:
a) Principles of consolidation
The consolidated financial statements include the accounts of the Société and the organizations it controls, i.e., 9130-8593 Québec inc. (wholly owned) and Transgesco Limited Partnership (99.9%-owned). All inter-organizational transactions and balances are eliminated.
b) Accounting method
Transactions are recorded in the Société’s accounts using the accrual basis of accounting. Under this method, assets, liabilities, revenues and expenses are recorded in the period in which the events and transactions occur.
c) Use of estimates
Preparation of the consolidated financial statements in accordance with Canadian public sector accounting standards requires management to make estimates and assumptions that affect the reported amounts of assets and liabilities, the presentation of contingent assets and liabilities at the date of the consolidated financial statements and the revenue and expense amounts recorded during the period covered by the consolidated financial statements. Actual results could differ from these estimates.
The main items for which management must make estimates are regional revenues, regional contributions, subsidies, the useful lives of capital assets for amortization purposes, the receivables to be allocated to the repayment of long-term debt, the accounting of non-monetary transactions, assumptions relative to the employee future benefits asset and expenses, and provisions for liabilities and legal claims.
d) Foreign currency translation
The Société uses the temporal method to translate its accounts expressed in foreign currencies. Monetary assets and liabilities denominated in foreign currencies are translated at the exchange rate in effect on the date of the Statement of Financial Position.
Revenues and expenses related to foreign currency transactions are translated into Canadian dollars at the exchange rate in effect on the transaction date. Exchange gains and losses are included in surplus for the year.
37STM2012 ANNUAL FINANCIAL REPORT
NOTES TO THE CONSOLIDATED FINANCIAL STATEMENTSAs at December 31, 2012(in thousands of dollars)
2. SIGNIFICANT ACCOUNTING POLICIES (CONT’D)
e) Revenue recognition
Revenues from passenger transportation are recognized in the Consolidated Statement of Operations when the passes are used by passengers. For weekly and monthly passes, revenues are recognized in the period for which the passes are valid.
Contributions and subsidies are recognized in the Consolidated Statement of Operations when the eligibility conditions for this government or municipal assistance are met.
Other revenues consist essentially of advertising income, recoveries, rights to reduced fares and smart cards, insurance rebates, as well as revenues from sinking fund investments that will be used to repay long-term debt. They are recognized when the operation underlying their recognition is carried out.
During the year, the subsidiary entered into an agreement with an external partner for advertising management of bus shelters. The main terms and conditions of the agreement include the following:
- the minimum royalty is recognized on a straight-line basis over the term of the agreement;
- bus shelter maintenance and installation services are recognized at their fair value as the services are rendered.
f) Cash
Cash consists of bank balances and bank overdrafts.
g) Sinking fund investments
Sinking fund investments consist mainly of bonds and bond coupons that are recorded at amortized cost and written down when there has been an other-than-temporary decline in their value. Discounts or premiums on acquired investments are amortized on a straight-line basis until the maturity of the investment to which that item is related.
h) Contributions and subsidies receivable
Receivables to be allocated to the repayment of long-term debt are created at the time of a current or future long-term debt issuance based on the subsidy rates of the capital assets being financed. These rates are established using the terms of the Government of Quebec’s Assistance Program for the Public Transport of People and other agreements.
i) Employee future benefits expense and asset
All of the Société’s employee future benefit plans are defined benefit plans.
The asset related to these plans reflects the year-end difference between the value of the accrued benefit obligation and the value of the plan assets, net of unamortized actuarial gains and losses and the valuation allowance. The actuarial valuation of this asset is determined using the projected benefit method prorated on years of service with salary projection. It is also based on actuarial assumptions that include management’s best estimates on, among other factors, discount rates, the expected rate of return on plan assets and the growth rates of salaries and healthcare costs.
Plan assets are valued using a market-related value, determined over a period not exceeding five years.
Past service costs related to plan amendments are recognized in the year in which the amendments are made.
Actuarial gains or losses resulting from the difference between the actual and anticipated returns on the plan assets or resulting from changes in actuarial assumptions are deferred and amortized over the average remaining service life of active employees or over the remaining life expectancy of inactive employees. As at December 31, 2012, the average remaining service life varied from 3 to 13 years while the remaining life expectancy varied from 17 to 25 years.
38 STM2012 ANNUAL FINANCIAL REPORT
NOTES TO THE CONSOLIDATED FINANCIAL STATEMENTSAs at December 31, 2012(in thousands of dollars)
2. SIGNIFICANT ACCOUNTING POLICIES (CONT’D)
j) Non-financial assets
The Société recognizes capital assets and certain other assets as non-financial assets since they can be used to provide services in future years. These assets do not normally provide resources to discharge its liabilities unless they are sold.
k) Capital assets
Capital assets are recorded at cost and amortized over their estimated useful lives using the straight-line method over the following periods:
Buildings 20 and 40 years
Metro infrastructures 20 à 100 years
Local and regional infrastructures 10 to 40 years
Rolling stock - metro cars 40 years
Rolling stock - buses 5 and 16 years
Rolling stock - service vehicles 5 to 25 years
Leasehold improvements remaining term of the lease
Office equipment and software 5 and 10 years
Machinery, tools and equipment 15 and 20 years
Capital assets are amortized starting from the date they are put into service. Capital assets in progress (projects being carried out) and temporarily withdrawn capital assets are not amortized.
Capital assets received without consideration are recorded at the cost incurred by the government authority responsible for building or developing them.
Interest on the amounts used to finance capital asset purchases is capitalized until the assets are put into service.
l) Inventories
Inventories of supplies and replacement parts consist mainly of the parts used to maintain the Société’s rolling stock and infrastructures. They are measured at the lower of average cost and net realizable value, the latter corresponding to the replacement cost.
m) Issuance costs for long-term debt
Issuance costs for long-term debt are amortized on a straight-line basis over the term of the loans.
n) Environmental obligations
The Société recognizes an environmental liability when it is likely that corrective measures will be taken and the costs of these measures can be reasonably estimated.
o) Derivative financial instruments
The Société periodically enters into currency and interest rate swaps as well as commodity swaps with major financial institutions to partially protect itself against fluctuations in exchange rates, interest rates, and the prices of certain purchases (e.g., fuel). The Société does not use financial instruments for speculative purposes.
To manage the currency and interest rate risk on long-term debt, the Société formally documents the risk management objective and strategy upon which its hedging activities are based as well the relationship between the hedging instruments and the hedged items. This process consists of linking these derivative financial instruments to specific assets and liabilities, to firm commitments, or to specific forecasted transactions.
39STM2012 ANNUAL FINANCIAL REPORT
NOTES TO THE CONSOLIDATED FINANCIAL STATEMENTSAs at December 31, 2012(in thousands of dollars)
2. SIGNIFICANT ACCOUNTING POLICIES (CONT’D)
The Société uses various derivative instruments to translate the cash flow from debt denominated in a foreign currency and having a variable interest rate into cash flow from debt at a fixed rate denominated in Canadian dollars, thereby creating a synthetic instrument. Synthetic instrument accounting is used to account for the assets and liabilities that make up the synthetic instrument. As a result, the Société records these to emulate the debt.
The Société periodically uses commodity swaps as a hedge against fuel price fluctuations. Related gains and losses are recorded in the Statement of Operations in the period in which they are realized and are presented with the expense related to the hedged item.
p) Budgetary data (unaudited)
The Consolidated Statement of Operations, the Consolidated Statement of Operating Surplus for Tax Purposes, the Consolidated Statement of Investing Surplus (Deficit) for Tax Purposes, the Consolidated Statement of Change in Net Debt, and the Consolidated Expenses by Item provide a comparison against budget figures, adjusted in accordance with Canadian public sector accounting standards.
3. FUTURE ACCOUNTING POLICY CHANGES
The CICA issued new accounting standards that the Société will adopt beginning on January 1, 2013:
In June 2011, the CICA issued Section PS 3450 of the CICA Handbook for the public sector – Financial Instruments, as well as Section PS 1201 – Financial Statement Presentation and Section PS 2601 – Foreign Currency Translation, which replaced the earlier PS 1200 and PS 2600 of the same names. These sections will apply to financial statements of other government organizations for years beginning on or after April 1, 2012. Consequently, the Société will adopt the new standards during its fiscal year beginning on January 1, 2013.
The new Section PS 3450 establishes recognition, measurement, presentation and disclosure standards relating to financial instruments, which are grouped into two categories: financial instruments measured at cost or amortized cost and financial instruments measured at fair value.
Section PS 2601 eliminates hedge accounting and the accounting of items as synthetic instruments. It requires that gains and losses on the translation of foreign denominated balances be reported as remeasurement gains and losses.
Lastly, Section PS 1201 is identical to the earlier PS 1200, except for changes made to define the requirements of the new statement for reporting remeasurement gains and losses of financial instruments measured at fair value and remeasurement gains and losses upon the translation of foreign denominated balances.
40 STM2012 ANNUAL FINANCIAL REPORT
NOTES TO THE CONSOLIDATED FINANCIAL STATEMENTSAs at December 31, 2012(in thousands of dollars)
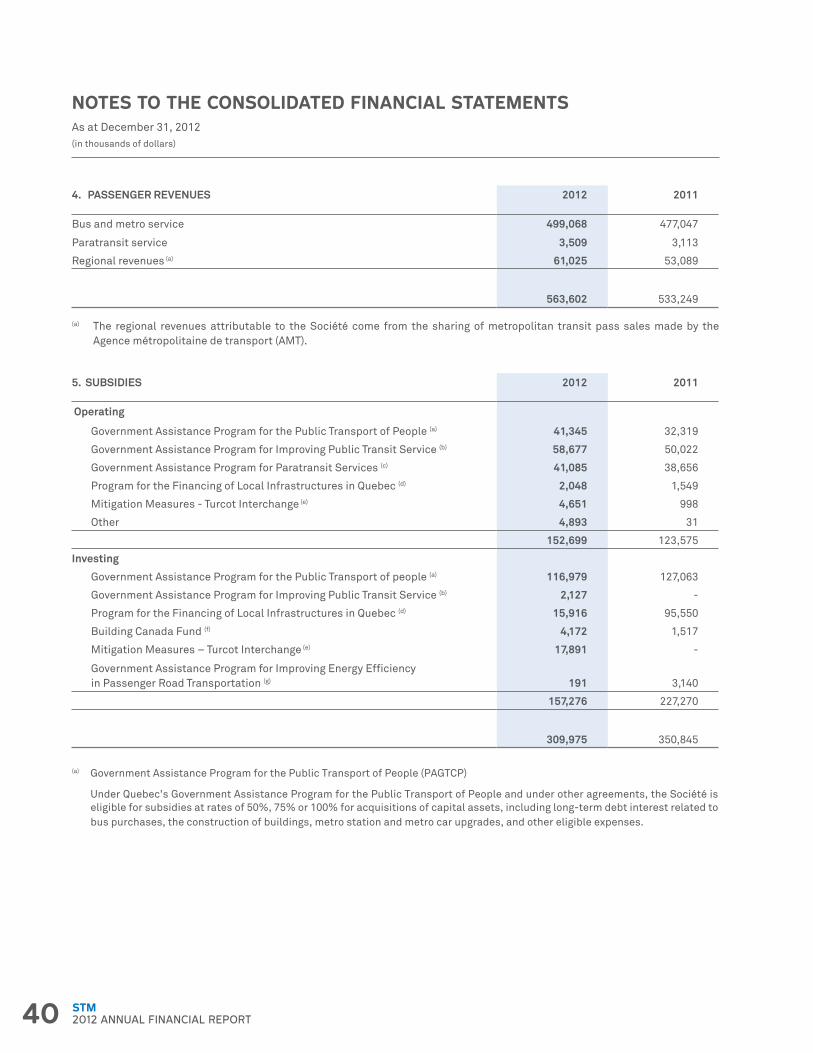
4. PASSENGER REVENUES 2012 2011
Bus and metro service 499,068 477,047
Paratransit service 3,509 3,113
Regional revenues (a) 61,025 53,089
- 563,602 533,249
(a) The regional revenues attributable to the Société come from the sharing of metropolitan transit pass sales made by the Agence métropolitaine de transport (AMT).
5. SUBSIDIES 2012 2011
Operating - -
Government Assistance Program for the Public Transport of People (a) 41,345 32,319
Government Assistance Program for Improving Public Transit Service (b) 58,677 50,022
Government Assistance Program for Paratransit Services (c) 41,085 38,656
Program for the Financing of Local Infrastructures in Quebec (d) 2,048 1,549
Mitigation Measures - Turcot Interchange (e) 4,651 998
Other 4,893 31
- 152,699 123,575
Investing - -
Government Assistance Program for the Public Transport of people (a) 116,979 127,063
Government Assistance Program for Improving Public Transit Service (b) 2,127 -
Program for the Financing of Local Infrastructures in Quebec (d) 15,916 95,550
Building Canada Fund (f) 4,172 1,517
Mitigation Measures – Turcot Interchange (e) 17,891 -
Government Assistance Program for Improving Energy Efficiency in Passenger Road Transportation (g) 191 3,140
- 157,276 227,270
- 309,975 350,845
(a) Government Assistance Program for the Public Transport of People (PAGTCP)
Under Quebec’s Government Assistance Program for the Public Transport of People and under other agreements, the Société is eligible for subsidies at rates of 50%, 75% or 100% for acquisitions of capital assets, including long-term debt interest related to bus purchases, the construction of buildings, metro station and metro car upgrades, and other eligible expenses.
41STM2012 ANNUAL FINANCIAL REPORT
NOTES TO THE CONSOLIDATED FINANCIAL STATEMENTSAs at December 31, 2012(in thousands of dollars)
(b) Government Assistance Program for Improving Public Transit Service (PAGASTC)
The purpose of this program is to support transit operating authorities (AOTs) in their efforts to increase the supply of public transit services. It allows transit authorities to recover 50% of eligible operating costs and, for certain years, bus acquisition costs. The initial program covered the period of 2007 to 2011 and its goals were to raise the supply of public transit services by 16% and achieve 8% growth in ridership. The program has been extended for 2012 and 2013.
(c) Government Assistance Program for Paratransit Services (PAGTAPH)
Under the Government of Quebec’s assistance program for paratransit services, the Société is eligible for a subsidy that includes an annually indexed amount as well as an amount based on increases in the number of trips.
(d) Program for the Financing of Local Infrastructures in Quebec (SOFIL)
Under the powers granted to SOFIL, the Société is eligible for a subsidy on capital asset acquisitions deemed admissible by the Ministère des Transports in addition to a contribution from the Montreal Urban Agglomeration, bringing the total subsidy for eligible acquisitions to 100%. Acquisitions for which subsidy applications involved amounts already available or reserved as at March 31, 2010 are subject to a cash subsidy of 84.5% from the Ministère des Transports and 15.5% from the Montreal Urban Agglomeration (SOFIL-1). Acquisitions related to projects approved after April 1, 2010 are eligible for an 85% cash or debt servicing subsidy from the Ministère des Transports and 15% cash subsidy from the Montreal Urban Agglomeration (SOFIL-2). This program is slated to remain in effect until 2014.
(e) Mitigation Measures – Turcot Interchange
Under an agreement with the Ministère des Transports du Québec with respect to the payment of costs related to road traffic mitigation measures in the Greater Montreal Area, the Ministère des Transports subsidizes the Société’s costs, net of passenger revenues, incurred as a result of the greater supply of services on bus routes near the Turcot Interchange. In terms of investing activities, the Ministère des Transports provided a 100% cash subsidy for the cost of purchasing 32 buses.
(f) Building Canada Fund (BCF)
This federal government program supports investments in public infrastructures. The contribution can reach one-third of the Société’s total eligible costs.
(g) Government Assistance Program for Improving Energy Efficiency in Passenger Road Transportation (PAGAAEE)
Under this provincial government program, the Société may apply for a 50% subsidy of capital expenditures. The program’s mission is to promote the use of new technologies and improve energy efficiency in passenger road transportation.
42 STM2012 ANNUAL FINANCIAL REPORT
NOTES TO THE CONSOLIDATED FINANCIAL STATEMENTSAs at December 31, 2012(in thousands of dollars)
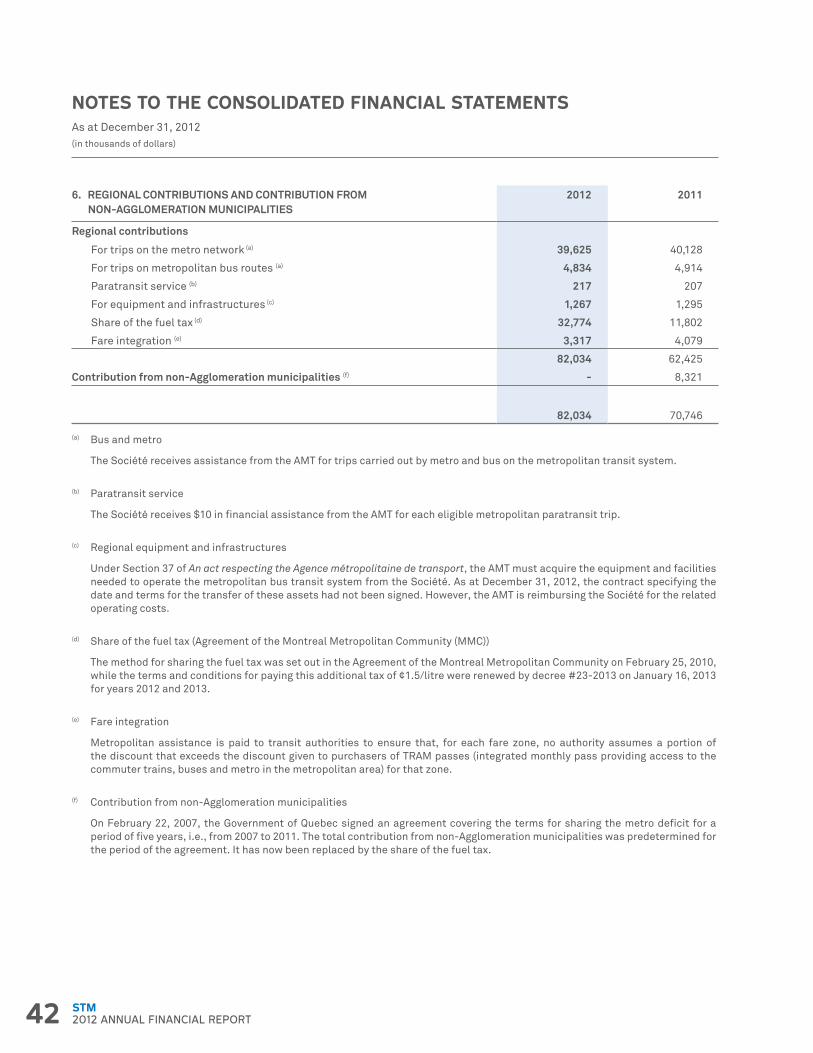
6. REGIONAL CONTRIBUTIONS AND CONTRIBUTION FROM NON-AGGLOMERATION MUNICIPALITIES
2012 2011
Regional contributions - -
For trips on the metro network (a) 39,625 40,128
For trips on metropolitan bus routes (a) 4,834 4,914
Paratransit service (b) 217 207
For equipment and infrastructures (c) 1,267 1,295
Share of the fuel tax (d) 32,774 11,802
Fare integration (e) 3,317 4,079
- 82,034 62,425
Contribution from non-Agglomeration municipalities (f) - 8,321
- 82,034 70,746
(a) Bus and metro
The Société receives assistance from the AMT for trips carried out by metro and bus on the metropolitan transit system.
(b) Paratransit service
The Société receives $10 in financial assistance from the AMT for each eligible metropolitan paratransit trip.
(c) Regional equipment and infrastructures
Under Section 37 of An act respecting the Agence métropolitaine de transport, the AMT must acquire the equipment and facilities needed to operate the metropolitan bus transit system from the Société. As at December 31, 2012, the contract specifying the date and terms for the transfer of these assets had not been signed. However, the AMT is reimbursing the Société for the related operating costs.
(d) Share of the fuel tax (Agreement of the Montreal Metropolitan Community (MMC))
The method for sharing the fuel tax was set out in the Agreement of the Montreal Metropolitan Community on February 25, 2010, while the terms and conditions for paying this additional tax of ¢1.5/litre were renewed by decree #23-2013 on January 16, 2013 for years 2012 and 2013.
(e) Fare integration
Metropolitan assistance is paid to transit authorities to ensure that, for each fare zone, no authority assumes a portion of the discount that exceeds the discount given to purchasers of TRAM passes (integrated monthly pass providing access to the commuter trains, buses and metro in the metropolitan area) for that zone.
(f) Contribution from non-Agglomeration municipalities
On February 22, 2007, the Government of Quebec signed an agreement covering the terms for sharing the metro deficit for a period of five years, i.e., from 2007 to 2011. The total contribution from non-Agglomeration municipalities was predetermined for the period of the agreement. It has now been replaced by the share of the fuel tax.
43STM2012 ANNUAL FINANCIAL REPORT
NOTES TO THE CONSOLIDATED FINANCIAL STATEMENTSAs at December 31, 2012(in thousands of dollars)
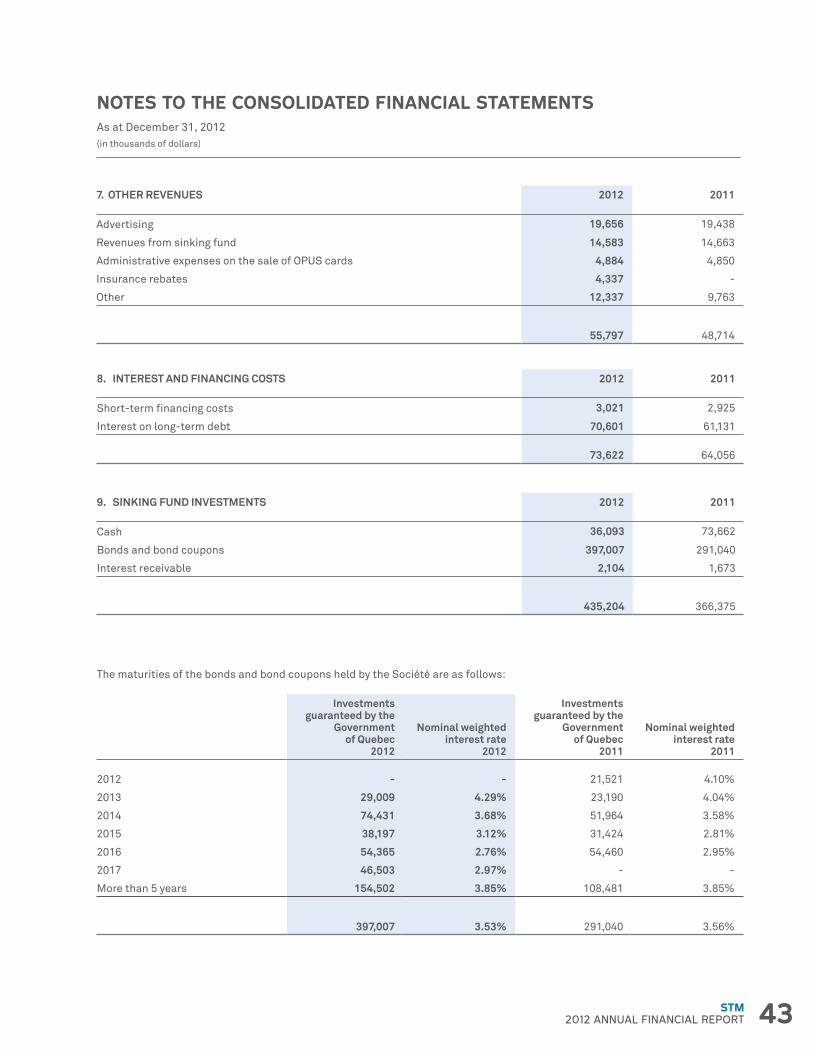
7. OTHER REVENUES 2012 2011
Advertising 19,656 19,438
Revenues from sinking fund 14,583 14,663
Administrative expenses on the sale of OPUS cards 4,884 4,850
Insurance rebates 4,337 -
Other 12,337 9,763
- 55,797 48,714
8. INTEREST AND FINANCING COSTS 2012 2011
Short-term financing costs 3,021 2,925
Interest on long-term debt 70,601 61,131
- 73,622 64,056
9. SINKING FUND INVESTMENTS 2012 2011
Cash 36,093 73,662
Bonds and bond coupons 397,007 291,040
Interest receivable 2,104 1,673
- 435,204 366,375
The maturities of the bonds and bond coupons held by the Société are as follows:
-
Investments guaranteed by the
Government of Quebec
2012
Nominal weighted interest rate
2012
Investments guaranteed by the
Government of Quebec
2011
Nominal weighted interest rate
2011
2012 - - 21,521 4.10%
2013 29,009 4.29% 23,190 4.04%
2014 74,431 3.68% 51,964 3.58%
2015 38,197 3.12% 31,424 2.81%
2016 54,365 2.76% 54,460 2.95%
2017 46,503 2.97% - -
More than 5 years 154,502 3.85% 108,481 3.85%
- 397,007 3.53% 291,040 3.56%

44 STM2012 ANNUAL FINANCIAL REPORT
NOTES TO THE CONSOLIDATED FINANCIAL STATEMENTSAs at December 31, 2012(in thousands of dollars)
10. SUBSIDIES RECEIVABLE 2012 2011
Government of Quebec - - Receivables to be allocated to the repayment of long-term debt (a) 954,637 833,338
Receivables to be allocated to the repayment of long-term debt not yet issued (b) 26,675 72,110
Receivables related to the long-term debt issued for future capital assets (c) (225,954) (151,292)
Program for the Financing of Local Infrastructures in Quebec 5,179 58,089
Government Assistance Program for the Public Transport of People 7,295 7,748
Government Assistance Program for Paratransit Services 20,321 17,144
Mitigation Measures - Turcot Interchange 22,542 998
Government Assistance Program for Improving Public Transit Service 39,405 4,130
- 850,100 842,265
Government of Canada - -
Building Canada Fund 5,689 1,517
- 855,789 843,782
(a) An amount of $70.4 million related to the SOFIL-2 program ($39.6 million in 2011).
(b) An amount of $1.8 million related to the SOFIL-2 program ($39.4 million in 2011).
(c) An amount of $185.5 million related to the deposit for the purchase of metro cars, as indicated in note 18 ($138.7 million in 2011).
Receipts of receivables to be allocated to the repayment of long-term debt, the terms and conditions of which have been estab-lished as at December 31, 2012, are as follows:
- Receipts 2012
Nominal weighted interest rate
2012
Receipts 2011
Nominal weighted interest rate
2011
2012 - - 52,659 4.76%
2013 17,119 4.42% 29,881 4.32%
2014 113,770 4.83% 113,819 4.77%
2015 9,434 3.99% 21,410 4.04%
2016 37,486 4.52% 45,163 4.42%
2017 159,660 4.78% - -
1 to 5 years 337,469 4.73% 262,932 4.60%
6 to 10 years 584,393 4.17% 570,406 4.57%
11 to 20 years 32,775 3.97% - -
- 954,637 4.36% 833,338 4.58%
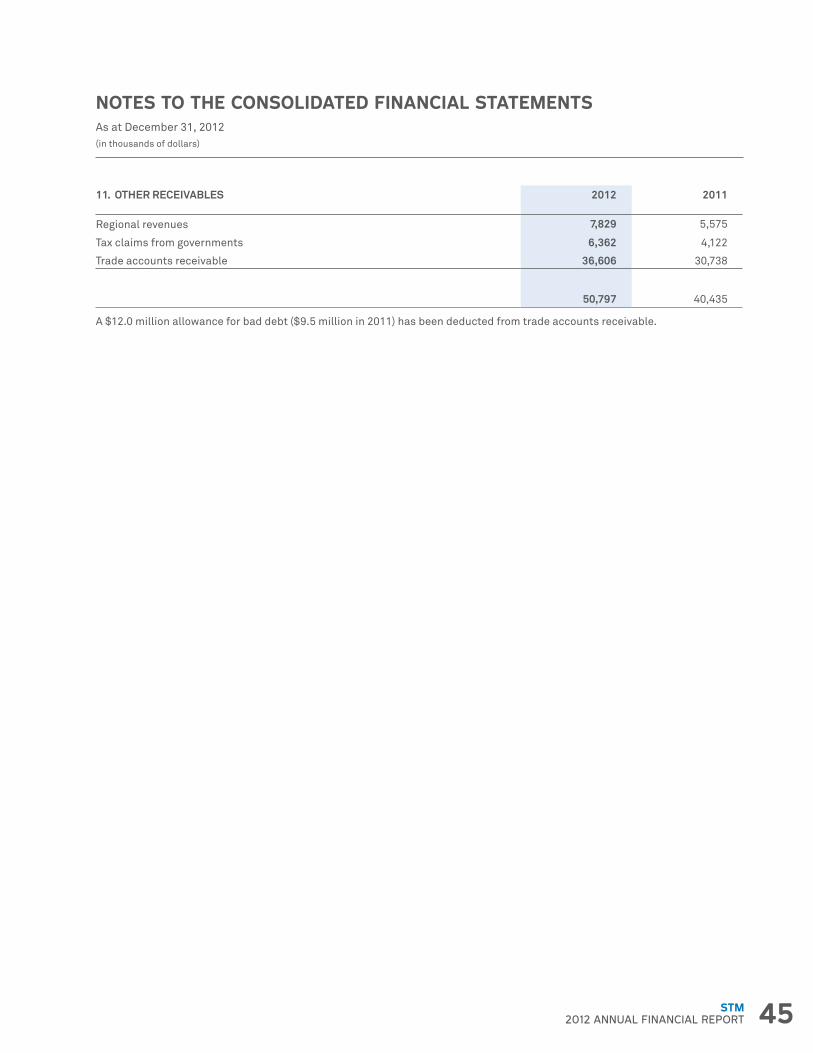
45STM2012 ANNUAL FINANCIAL REPORT
NOTES TO THE CONSOLIDATED FINANCIAL STATEMENTSAs at December 31, 2012(in thousands of dollars)
11. OTHER RECEIVABLES 2012 2011
Regional revenues 7,829 5,575
Tax claims from governments 6,362 4,122
Trade accounts receivable 36,606 30,738
- 50,797 40,435
A $12.0 million allowance for bad debt ($9.5 million in 2011) has been deducted from trade accounts receivable.
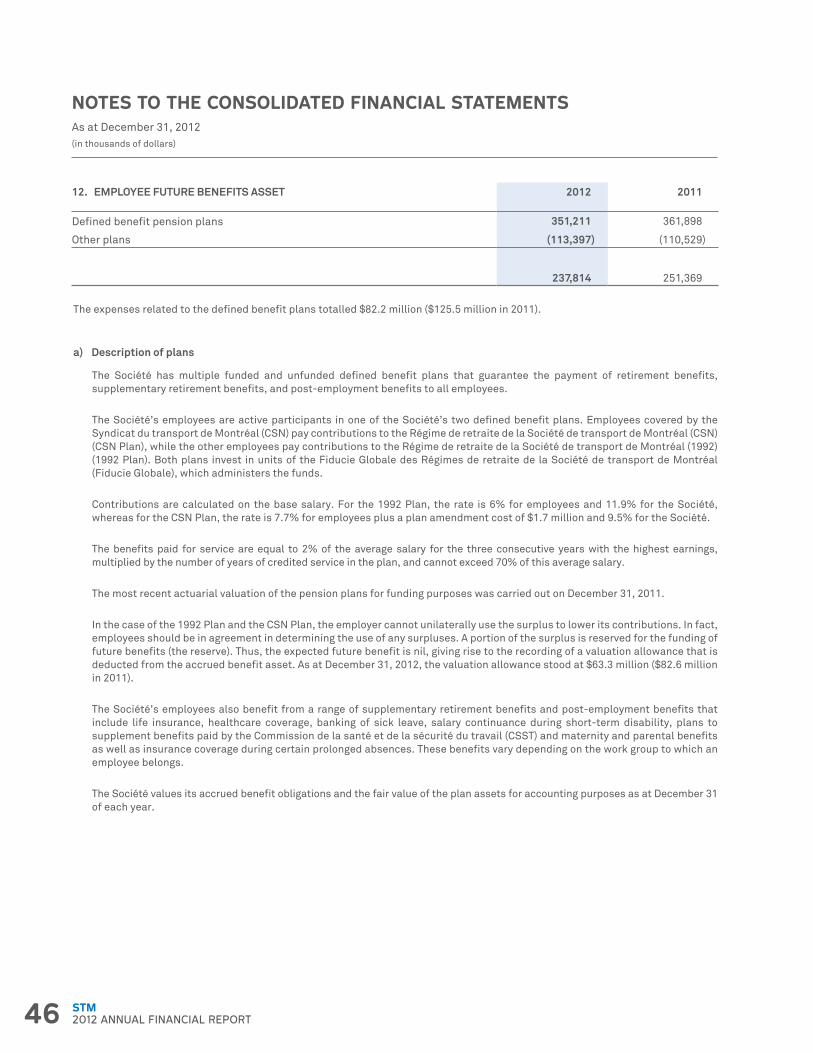
46 STM2012 ANNUAL FINANCIAL REPORT
NOTES TO THE CONSOLIDATED FINANCIAL STATEMENTSAs at December 31, 2012(in thousands of dollars)
12. EMPLOYEE FUTURE BENEFITS ASSET 2012 2011
Defined benefit pension plans 351,211 361,898
Other plans (113,397) (110,529)
- 237,814 251,369
The expenses related to the defined benefit plans totalled $82.2 million ($125.5 million in 2011).
a) Description of plans
The Société has multiple funded and unfunded defined benefit plans that guarantee the payment of retirement benefits, supplementary retirement benefits, and post-employment benefits to all employees.
The Société’s employees are active participants in one of the Société’s two defined benefit plans. Employees covered by the Syndicat du transport de Montréal (CSN) pay contributions to the Régime de retraite de la Société de transport de Montréal (CSN) (CSN Plan), while the other employees pay contributions to the Régime de retraite de la Société de transport de Montréal (1992) (1992 Plan). Both plans invest in units of the Fiducie Globale des Régimes de retraite de la Société de transport de Montréal (Fiducie Globale), which administers the funds.
Contributions are calculated on the base salary. For the 1992 Plan, the rate is 6% for employees and 11.9% for the Société, whereas for the CSN Plan, the rate is 7.7% for employees plus a plan amendment cost of $1.7 million and 9.5% for the Société.
The benefits paid for service are equal to 2% of the average salary for the three consecutive years with the highest earnings, multiplied by the number of years of credited service in the plan, and cannot exceed 70% of this average salary.
The most recent actuarial valuation of the pension plans for funding purposes was carried out on December 31, 2011.
In the case of the 1992 Plan and the CSN Plan, the employer cannot unilaterally use the surplus to lower its contributions. In fact, employees should be in agreement in determining the use of any surpluses. A portion of the surplus is reserved for the funding of future benefits (the reserve). Thus, the expected future benefit is nil, giving rise to the recording of a valuation allowance that is deducted from the accrued benefit asset. As at December 31, 2012, the valuation allowance stood at $63.3 million ($82.6 million in 2011).
The Société’s employees also benefit from a range of supplementary retirement benefits and post-employment benefits that include life insurance, healthcare coverage, banking of sick leave, salary continuance during short-term disability, plans to supplement benefits paid by the Commission de la santé et de la sécurité du travail (CSST) and maternity and parental benefits as well as insurance coverage during certain prolonged absences. These benefits vary depending on the work group to which an employee belongs.
The Société values its accrued benefit obligations and the fair value of the plan assets for accounting purposes as at December 31 of each year.
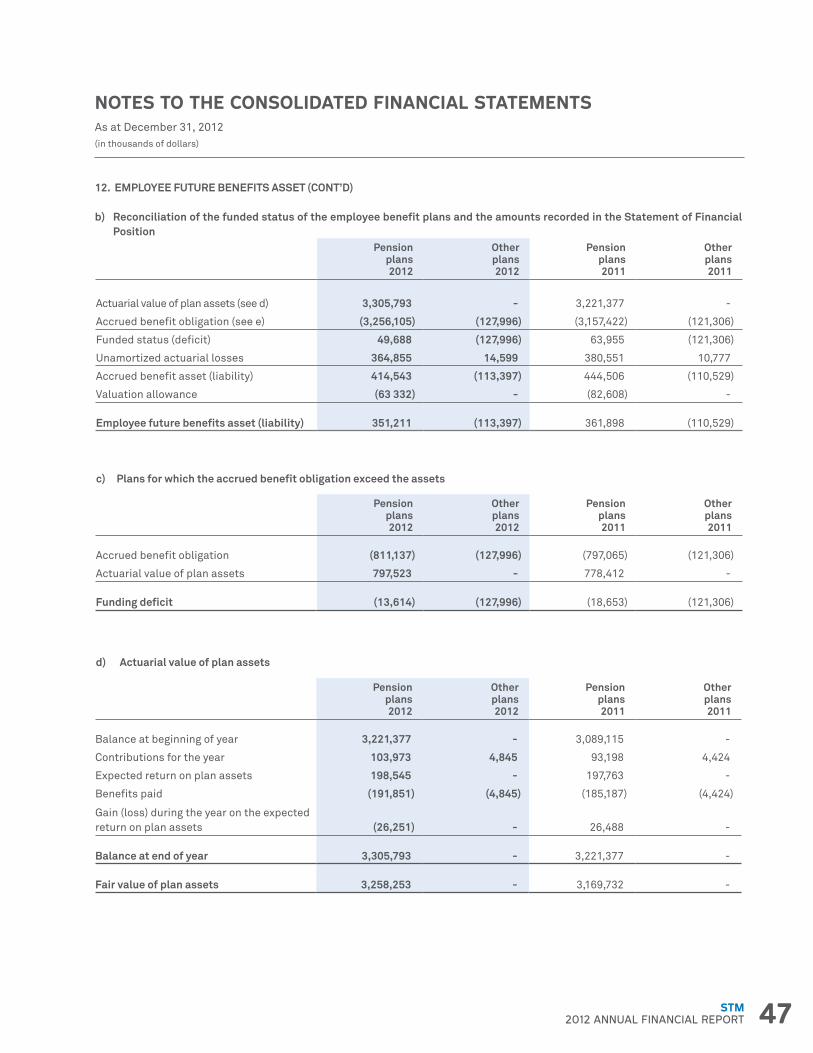
47STM2012 ANNUAL FINANCIAL REPORT
NOTES TO THE CONSOLIDATED FINANCIAL STATEMENTSAs at December 31, 2012(in thousands of dollars)
12. EMPLOYEE FUTURE BENEFITS ASSET (CONT’D)
b) Reconciliation of the funded status of the employee benefit plans and the amounts recorded in the Statement of Financial Position
- Pension plans 2012
Other plans 2012
Pension plans 2011
Other plans 2011
Actuarial value of plan assets (see d) 3,305,793 - 3,221,377 -
Accrued benefit obligation (see e) (3,256,105) (127,996) (3,157,422) (121,306)
Funded status (deficit) 49,688 (127,996) 63,955 (121,306)
Unamortized actuarial losses 364,855 14,599 380,551 10,777
Accrued benefit asset (liability) 414,543 (113,397) 444,506 (110,529)
Valuation allowance (63 332) - (82,608) -
Employee future benefits asset (liability) 351,211 (113,397) 361,898 (110,529)
c) Plans for which the accrued benefit obligation exceed the assets
- Pension plans 2012
Other plans 2012
Pension plans 2011
Other plans 2011
Accrued benefit obligation (811,137) (127,996) (797,065) (121,306)
Actuarial value of plan assets 797,523 - 778,412 -
Funding deficit (13,614) (127,996) (18,653) (121,306)
d) Actuarial value of plan assets
- Pension plans 2012
Other plans 2012
Pension plans 2011
Other plans 2011
Balance at beginning of year 3,221,377 - 3,089,115 -
Contributions for the year 103,973 4,845 93,198 4,424
Expected return on plan assets 198,545 - 197,763 -
Benefits paid (191,851) (4,845) (185,187) (4,424)
Gain (loss) during the year on the expected return on plan assets (26,251) - 26,488 -
Balance at end of year 3,305,793 - 3,221,377 -
Fair value of plan assets 3,258,253 - 3,169,732 -
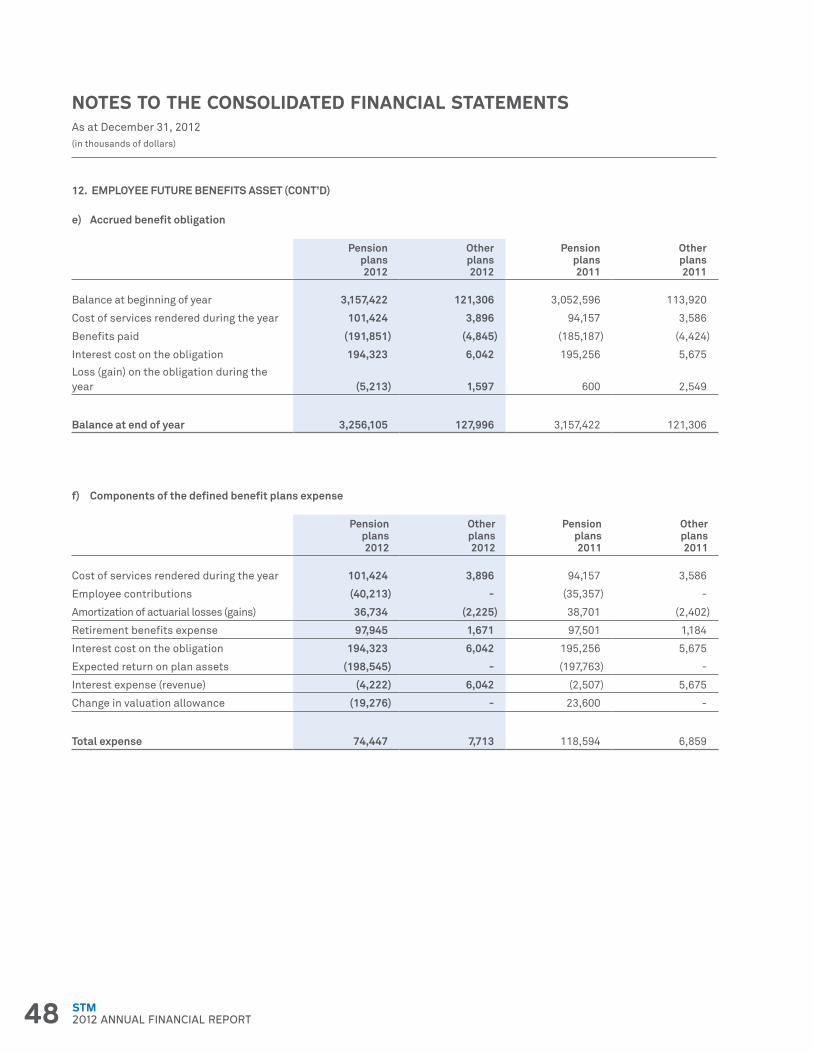
48 STM2012 ANNUAL FINANCIAL REPORT
NOTES TO THE CONSOLIDATED FINANCIAL STATEMENTSAs at December 31, 2012(in thousands of dollars)
12. EMPLOYEE FUTURE BENEFITS ASSET (CONT’D)
e) Accrued benefit obligation
- Pension plans 2012
Other plans 2012
Pension plans 2011
Other plans 2011
Balance at beginning of year 3,157,422 121,306 3,052,596 113,920
Cost of services rendered during the year 101,424 3,896 94,157 3,586
Benefits paid (191,851) (4,845) (185,187) (4,424)
Interest cost on the obligation 194,323 6,042 195,256 5,675
Loss (gain) on the obligation during the year (5,213) 1,597 600 2,549
Balance at end of year 3,256,105 127,996 3,157,422 121,306
f) Components of the defined benefit plans expense
- Pension plans 2012
Other plans 2012
Pension plans 2011
Other plans 2011
Cost of services rendered during the year 101,424 3,896 94,157 3,586
Employee contributions (40,213) - (35,357) -
Amortization of actuarial losses (gains) 36,734 (2,225) 38,701 (2,402)
Retirement benefits expense 97,945 1,671 97,501 1,184
Interest cost on the obligation 194,323 6,042 195,256 5,675
Expected return on plan assets (198,545) - (197,763) -
Interest expense (revenue) (4,222) 6,042 (2,507) 5,675
Change in valuation allowance (19,276) - 23,600 -
Total expense 74,447 7,713 118,594 6,859
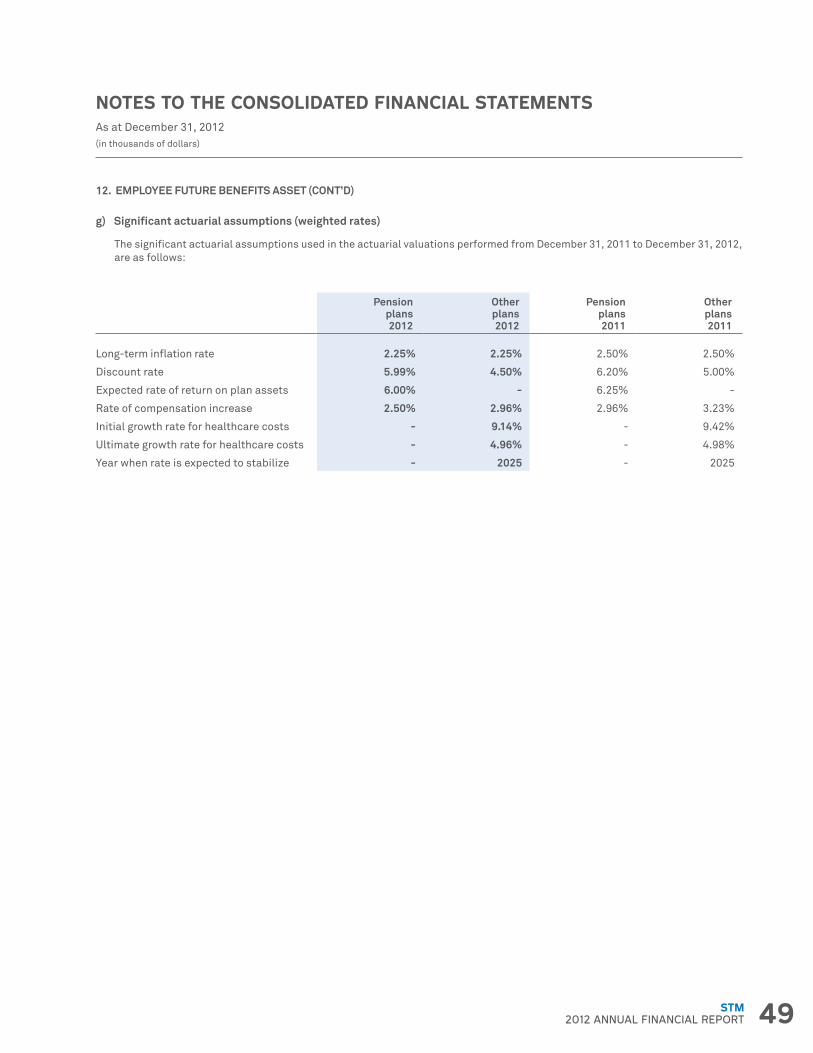
49STM2012 ANNUAL FINANCIAL REPORT
NOTES TO THE CONSOLIDATED FINANCIAL STATEMENTSAs at December 31, 2012(in thousands of dollars)
12. EMPLOYEE FUTURE BENEFITS ASSET (CONT’D)
g) Significant actuarial assumptions (weighted rates)
The significant actuarial assumptions used in the actuarial valuations performed from December 31, 2011 to December 31, 2012, are as follows:
- Pension plans 2012
Other plans 2012
Pension plans 2011
Other plans 2011
Long-term inflation rate 2.25% 2.25% 2.50% 2.50%
Discount rate 5.99% 4.50% 6.20% 5.00%
Expected rate of return on plan assets 6.00% - 6.25% -
Rate of compensation increase 2.50% 2.96% 2.96% 3.23%
Initial growth rate for healthcare costs - 9.14% - 9.42%
Ultimate growth rate for healthcare costs - 4.96% - 4.98%
Year when rate is expected to stabilize - 2025 - 2025
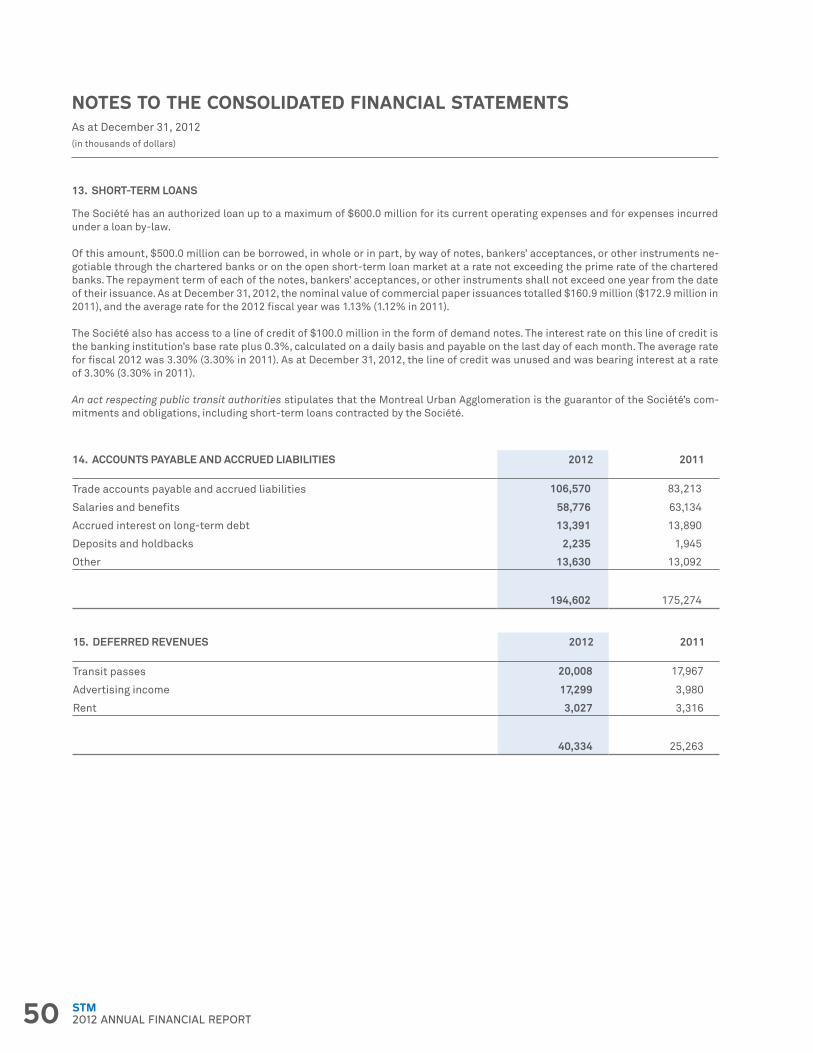
50 STM2012 ANNUAL FINANCIAL REPORT
NOTES TO THE CONSOLIDATED FINANCIAL STATEMENTSAs at December 31, 2012(in thousands of dollars)
13. SHORT-TERM LOANS
The Société has an authorized loan up to a maximum of $600.0 million for its current operating expenses and for expenses incurred under a loan by-law.
Of this amount, $500.0 million can be borrowed, in whole or in part, by way of notes, bankers’ acceptances, or other instruments ne-gotiable through the chartered banks or on the open short-term loan market at a rate not exceeding the prime rate of the chartered banks. The repayment term of each of the notes, bankers’ acceptances, or other instruments shall not exceed one year from the date of their issuance. As at December 31, 2012, the nominal value of commercial paper issuances totalled $160.9 million ($172.9 million in 2011), and the average rate for the 2012 fiscal year was 1.13% (1.12% in 2011).
The Société also has access to a line of credit of $100.0 million in the form of demand notes. The interest rate on this line of credit is the banking institution’s base rate plus 0.3%, calculated on a daily basis and payable on the last day of each month. The average rate for fiscal 2012 was 3.30% (3.30% in 2011). As at December 31, 2012, the line of credit was unused and was bearing interest at a rate of 3.30% (3.30% in 2011).
An act respecting public transit authorities stipulates that the Montreal Urban Agglomeration is the guarantor of the Société’s com-mitments and obligations, including short-term loans contracted by the Société.
14. ACCOUNTS PAYABLE AND ACCRUED LIABILITIES 2012 2011
Trade accounts payable and accrued liabilities 106,570 83,213
Salaries and benefits 58,776 63,134
Accrued interest on long-term debt 13,391 13,890
Deposits and holdbacks 2,235 1,945
Other 13,630 13,092
- 194,602 175,274
15. DEFERRED REVENUES 2012 2011
Transit passes 20,008 17,967
Advertising income 17,299 3,980
Rent 3,027 3,316
- 40,334 25,263
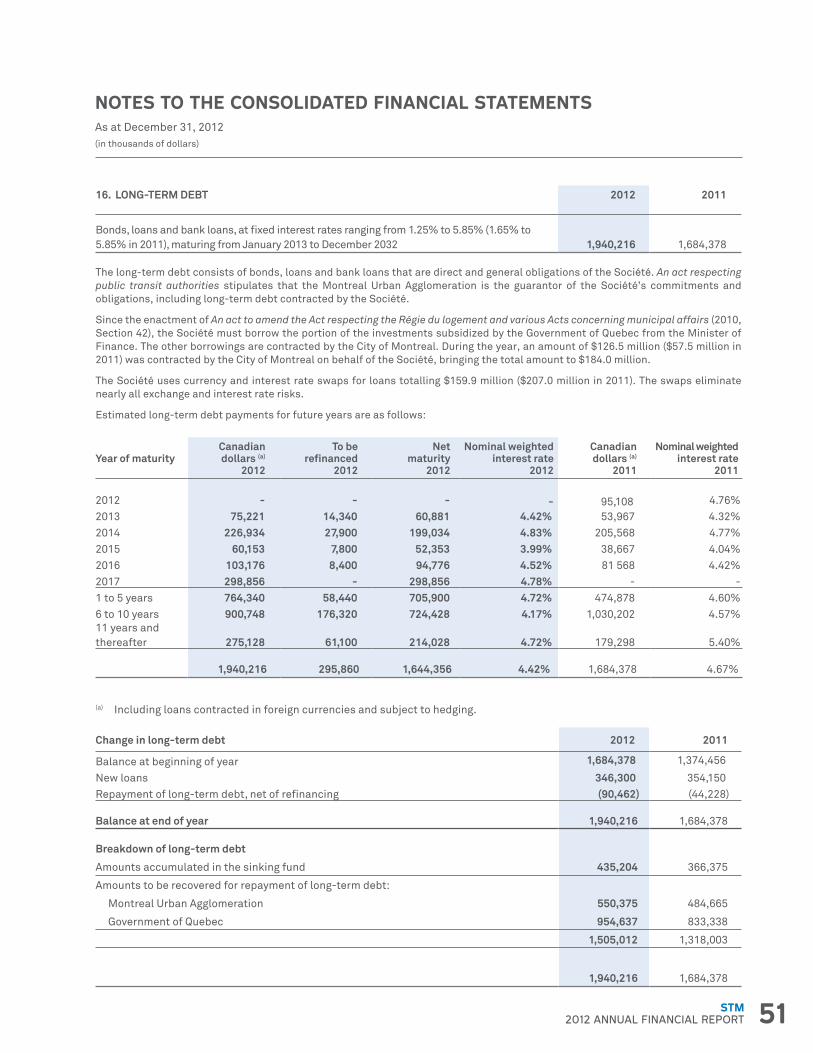
51STM2012 ANNUAL FINANCIAL REPORT
NOTES TO THE CONSOLIDATED FINANCIAL STATEMENTSAs at December 31, 2012(in thousands of dollars)
16. LONG-TERM DEBT 2012 2011
Bonds, loans and bank loans, at fixed interest rates ranging from 1.25% to 5.85% (1.65% to 5.85% in 2011), maturing from January 2013 to December 2032 1,940,216 1,684,378
The long-term debt consists of bonds, loans and bank loans that are direct and general obligations of the Société. An act respecting public transit authorities stipulates that the Montreal Urban Agglomeration is the guarantor of the Société’s commitments and obligations, including long-term debt contracted by the Société.
Since the enactment of An act to amend the Act respecting the Régie du logement and various Acts concerning municipal affairs (2010, Section 42), the Société must borrow the portion of the investments subsidized by the Government of Quebec from the Minister of Finance. The other borrowings are contracted by the City of Montreal. During the year, an amount of $126.5 million ($57.5 million in 2011) was contracted by the City of Montreal on behalf of the Société, bringing the total amount to $184.0 million.
The Société uses currency and interest rate swaps for loans totalling $159.9 million ($207.0 million in 2011). The swaps eliminate nearly all exchange and interest rate risks.
Estimated long-term debt payments for future years are as follows:
Year of maturityCanadian dollars (a)
2012
To be refinanced
2012
Net maturity
2012
Nominal weighted interest rate
2012
Canadian dollars (a)
2011
Nominal weighted interest rate
2011
2012 - - - - 95,108 4.76%2013 75,221 14,340 60,881 4.42% 53,967 4.32%2014 226,934 27,900 199,034 4.83% 205,568 4.77%2015 60,153 7,800 52,353 3.99% 38,667 4.04%2016 103,176 8,400 94,776 4.52% 81 568 4.42%2017 298,856 - 298,856 4.78% - - 1 to 5 years 764,340 58,440 705,900 4.72% 474,878 4.60%6 to 10 years 900,748 176,320 724,428 4.17% 1,030,202 4.57%11 years andthereafter 275,128 61,100 214,028 4.72% 179,298 5.40%
- 1,940,216 295,860 1,644,356 4.42% 1,684,378 4.67%
(a) Including loans contracted in foreign currencies and subject to hedging.
Change in long-term debt 2012 2011
Balance at beginning of year 1,684,378 1,374,456
New loans 346,300 354,150 Repayment of long-term debt, net of refinancing (90,462) (44,228)
Balance at end of year 1,940,216 1,684,378
Breakdown of long-term debt - -
Amounts accumulated in the sinking fund 435,204 366,375
Amounts to be recovered for repayment of long-term debt: - -
Montreal Urban Agglomeration 550,375 484,665
Government of Quebec 954,637 833,338
- 1,505,012 1,318,003
- 1,940,216 1,684,378
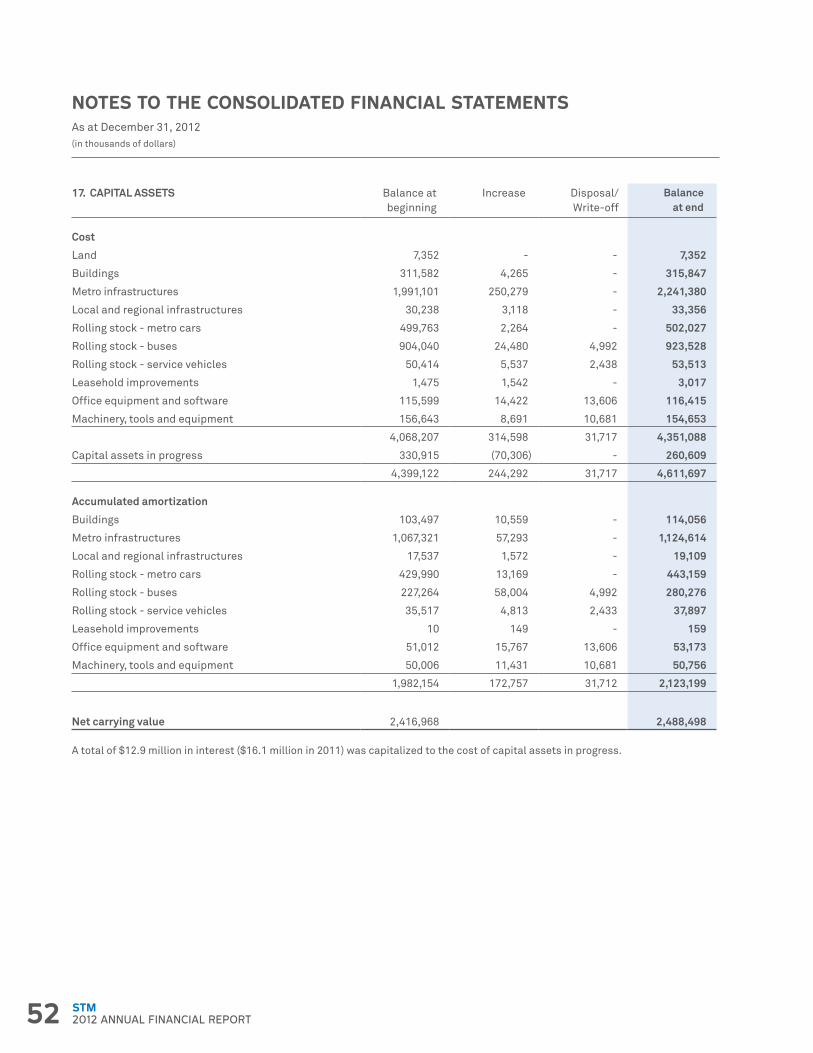
52 STM2012 ANNUAL FINANCIAL REPORT
NOTES TO THE CONSOLIDATED FINANCIAL STATEMENTSAs at December 31, 2012(in thousands of dollars)
17. CAPITAL ASSETS Balance at beginning
Increase Disposal/ Write-off
Balanceat end
Cost - - - -
Land 7,352 - - 7,352
Buildings 311,582 4,265 - 315,847
Metro infrastructures 1,991,101 250,279 - 2,241,380
Local and regional infrastructures 30,238 3,118 - 33,356
Rolling stock - metro cars 499,763 2,264 - 502,027
Rolling stock - buses 904,040 24,480 4,992 923,528
Rolling stock - service vehicles 50,414 5,537 2,438 53,513
Leasehold improvements 1,475 1,542 - 3,017
Office equipment and software 115,599 14,422 13,606 116,415
Machinery, tools and equipment 156,643 8,691 10,681 154,653
- 4,068,207 314,598 31,717 4,351,088
Capital assets in progress 330,915 (70,306) - 260,609
- 4,399,122 244,292 31,717 4,611,697
Accumulated amortization - - - -
Buildings 103,497 10,559 - 114,056
Metro infrastructures 1,067,321 57,293 - 1,124,614
Local and regional infrastructures 17,537 1,572 - 19,109
Rolling stock - metro cars 429,990 13,169 - 443,159
Rolling stock - buses 227,264 58,004 4,992 280,276
Rolling stock - service vehicles 35,517 4,813 2,433 37,897
Leasehold improvements 10 149 - 159
Office equipment and software 51,012 15,767 13,606 53,173
Machinery, tools and equipment 50,006 11,431 10,681 50,756
- 1,982,154 172,757 31,712 2,123,199
Net carrying value 2,416,968 - - 2,488,498
A total of $12.9 million in interest ($16.1 million in 2011) was capitalized to the cost of capital assets in progress.
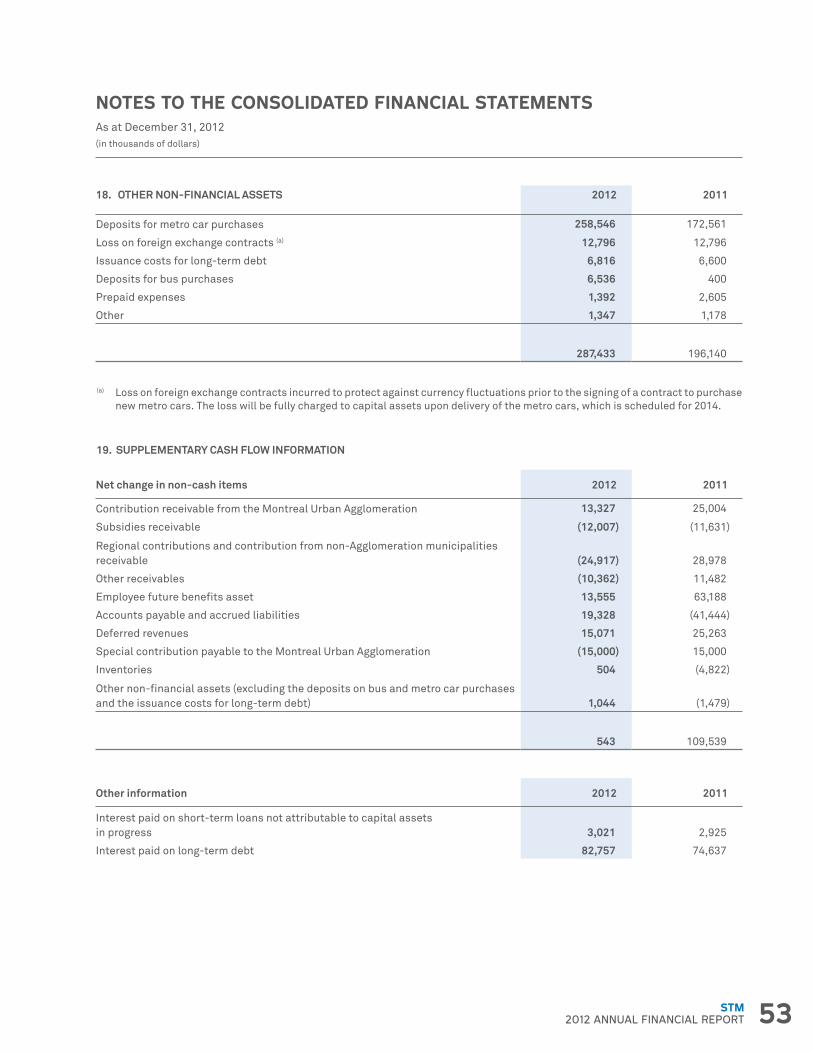
53STM2012 ANNUAL FINANCIAL REPORT
19. SUPPLEMENTARY CASH FLOW INFORMATION
NOTES TO THE CONSOLIDATED FINANCIAL STATEMENTSAs at December 31, 2012(in thousands of dollars)
18. OTHER NON-FINANCIAL ASSETS 2012 2011
Deposits for metro car purchases 258,546 172,561
Loss on foreign exchange contracts (a) 12,796 12,796
Issuance costs for long-term debt 6,816 6,600
Deposits for bus purchases 6,536 400
Prepaid expenses 1,392 2,605
Other 1,347 1,178
- 287,433 196,140
(a) Loss on foreign exchange contracts incurred to protect against currency fluctuations prior to the signing of a contract to purchase new metro cars. The loss will be fully charged to capital assets upon delivery of the metro cars, which is scheduled for 2014.
Net change in non-cash items 2012 2011
Contribution receivable from the Montreal Urban Agglomeration 13,327 25,004
Subsidies receivable (12,007) (11,631)
Regional contributions and contribution from non-Agglomeration municipalities receivable (24,917) 28,978
Other receivables (10,362) 11,482
Employee future benefits asset 13,555 63,188
Accounts payable and accrued liabilities 19,328 (41,444)
Deferred revenues 15,071 25,263
Special contribution payable to the Montreal Urban Agglomeration (15,000) 15,000
Inventories 504 (4,822)
Other non-financial assets (excluding the deposits on bus and metro car purchases and the issuance costs for long-term debt) 1,044 (1,479)
- 543 109,539
Other information 2012 2011
Interest paid on short-term loans not attributable to capital assets in progress 3,021 2,925
Interest paid on long-term debt 82,757 74,637

54 STM2012 ANNUAL FINANCIAL REPORT
NOTES TO THE CONSOLIDATED FINANCIAL STATEMENTSAs at December 31, 2012(in thousands of dollars)
20. FINANCIAL INSTRUMENTS
Use of derivative instruments
The Société uses derivative financial instruments to reduce the exchange and interest rate risks of its long-term debt and the commodity risk on the price of fuel. It does not use financial instruments for speculative purposes.
Exchange and interest positions
As at December 31, 2012, given the use of currency and interest rate swaps, substantially all of the Société’s loans are denominated in Canadian dollars and bear interest at fixed rates..
Credit risk
In using derivative financial instruments, the Société is exposed to credit losses arising from third-party defaults on payment. The Société believes that these parties will be able to meet their obligations, as it deals only with recognized financial institutions whose credit ratings are higher than its own.
Liquidity risk
The Société believes that its credit facilities are sufficient to meet its current and long-term financial needs at a reasonable cost.
Fair value
The fair value of cash, the contribution receivable from (payable to) the Montreal Urban Agglomeration, subsidies receivable other than receivables to be allocated to the repayment of long-term debt, regional contributions and the contribution receivable from non-Agglomeration municipalities, other receivables, short-term loans and accounts payable and accrued liabilities approximate their carrying values due to the short maturities of these financial instruments.
The following table shows the fair values and carrying values of other financial instruments:
- Fair
value 2012
Carrying value 2012
Fair value 2011
Carrying value 2011
Sinking fund investments 446,068 435,204 380,993 366,375
Receivables to be allocated to the repayment of long-term debt (note 10) 1,025,483 954,637 909,249 833,338
Long-term debt 2,096,203 1,940,216 1,852,224 1,684,378
The fair value of sinking fund investments is the amount at which they could be exchanged on the market between parties at arm’s length. The fair value of receivables to be allocated to the repayment of long-term debt as well as the fair value of long-term debt are essentially based on a discounted cash flow calculation that uses rates of return or the year-end market price of similar instruments with the same maturity. The fair value of the currency and interest rate swaps is the amount the Société would receive or pay if these contracts had closed at that date. As at December 31, 2012, the fair value and carrying value of the financial liabilities associated with currency and interest rate swaps stood at $51.6 million and $18.0 million ($65.7 million and $48.6 million in 2011). They are included in the long-term debt amounts.
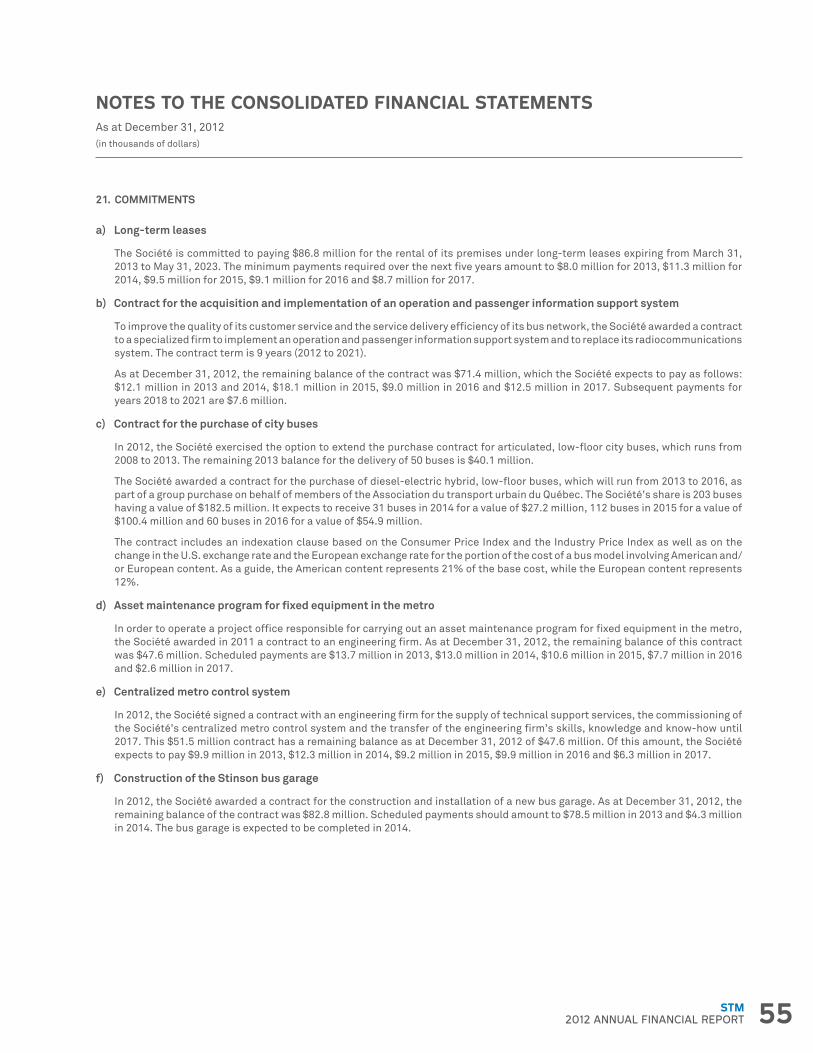
55STM2012 ANNUAL FINANCIAL REPORT
NOTES TO THE CONSOLIDATED FINANCIAL STATEMENTSAs at December 31, 2012(in thousands of dollars)
21. COMMITMENTS
a) Long-term leases
The Société is committed to paying $86.8 million for the rental of its premises under long-term leases expiring from March 31, 2013 to May 31, 2023. The minimum payments required over the next five years amount to $8.0 million for 2013, $11.3 million for 2014, $9.5 million for 2015, $9.1 million for 2016 and $8.7 million for 2017.
b) Contract for the acquisition and implementation of an operation and passenger information support system
To improve the quality of its customer service and the service delivery efficiency of its bus network, the Société awarded a contract to a specialized firm to implement an operation and passenger information support system and to replace its radiocommunications system. The contract term is 9 years (2012 to 2021).
As at December 31, 2012, the remaining balance of the contract was $71.4 million, which the Société expects to pay as follows: $12.1 million in 2013 and 2014, $18.1 million in 2015, $9.0 million in 2016 and $12.5 million in 2017. Subsequent payments for years 2018 to 2021 are $7.6 million.
c) Contract for the purchase of city buses
In 2012, the Société exercised the option to extend the purchase contract for articulated, low-floor city buses, which runs from 2008 to 2013. The remaining 2013 balance for the delivery of 50 buses is $40.1 million.
The Société awarded a contract for the purchase of diesel-electric hybrid, low-floor buses, which will run from 2013 to 2016, as part of a group purchase on behalf of members of the Association du transport urbain du Québec. The Société’s share is 203 buses having a value of $182.5 million. It expects to receive 31 buses in 2014 for a value of $27.2 million, 112 buses in 2015 for a value of $100.4 million and 60 buses in 2016 for a value of $54.9 million.
The contract includes an indexation clause based on the Consumer Price Index and the Industry Price Index as well as on the change in the U.S. exchange rate and the European exchange rate for the portion of the cost of a bus model involving American and/or European content. As a guide, the American content represents 21% of the base cost, while the European content represents 12%.
d) Asset maintenance program for fixed equipment in the metro
In order to operate a project office responsible for carrying out an asset maintenance program for fixed equipment in the metro, the Société awarded in 2011 a contract to an engineering firm. As at December 31, 2012, the remaining balance of this contract was $47.6 million. Scheduled payments are $13.7 million in 2013, $13.0 million in 2014, $10.6 million in 2015, $7.7 million in 2016 and $2.6 million in 2017.
e) Centralized metro control system
In 2012, the Société signed a contract with an engineering firm for the supply of technical support services, the commissioning of the Société’s centralized metro control system and the transfer of the engineering firm’s skills, knowledge and know-how until 2017. This $51.5 million contract has a remaining balance as at December 31, 2012 of $47.6 million. Of this amount, the Société expects to pay $9.9 million in 2013, $12.3 million in 2014, $9.2 million in 2015, $9.9 million in 2016 and $6.3 million in 2017.
f) Construction of the Stinson bus garage
In 2012, the Société awarded a contract for the construction and installation of a new bus garage. As at December 31, 2012, the remaining balance of the contract was $82.8 million. Scheduled payments should amount to $78.5 million in 2013 and $4.3 million in 2014. The bus garage is expected to be completed in 2014.

56 STM2012 ANNUAL FINANCIAL REPORT
NOTES TO THE CONSOLIDATED FINANCIAL STATEMENTSAs at December 31, 2012(in thousands of dollars)
21. COMMITMENTS (CONT’D)
g) Contract for the supply of fuel
The Société has negotiated a fuel supply contract with a supplier for a predetermined period. To protect itself from fuel price fluctuations, the Société negotiated swap agreements with financial institutions. For the duration of these agreements, i.e., from January 2013 to December 2015, the Société is committed to purchasing 246.0 million litres at a fixed price, representing an amount of approximately $165.7 million.
As at December 31, 2012, the balance of the Société’s commitment was 90.9 million litres (42.1 million litres at $0.5765/litre and 48.8 million litres at $0.5749/litre, representing an amount of $52.3 million).
h) Contract for the purchase of rubber-tired metro cars
During 2010, the Société awarded a contract for the purchase of metro cars to a consortium. Under this contract, the Société is committed to purchasing 468 rubber-tired metro cars valued at $1,811.6 million. In 2012, the contract was revised downwards by an amount of $3.1 million because the Société decided to exercise only one of the contract’s initial options. The purchase contract contains a price adjustment clause for the metro cars based on the change in certain indexes, mainly the Consumer Price Index and the Industrial Product Price Index. It also provides for a deposit of 7.5%, which was paid during 2010, as well as an additional monthly deposit of 0.5% to be paid over the next 28 months. As at December 31, 2012, the remaining balance was $1,549.3 million. The amounts for future deliveries will be paid as follows: $63.9 million in 2013, $263.7 million in 2014, $320.0 million in 2015, $321.4 million in 2016, $328.5 million in 2017, and $251.8 million from 2018 to 2020.
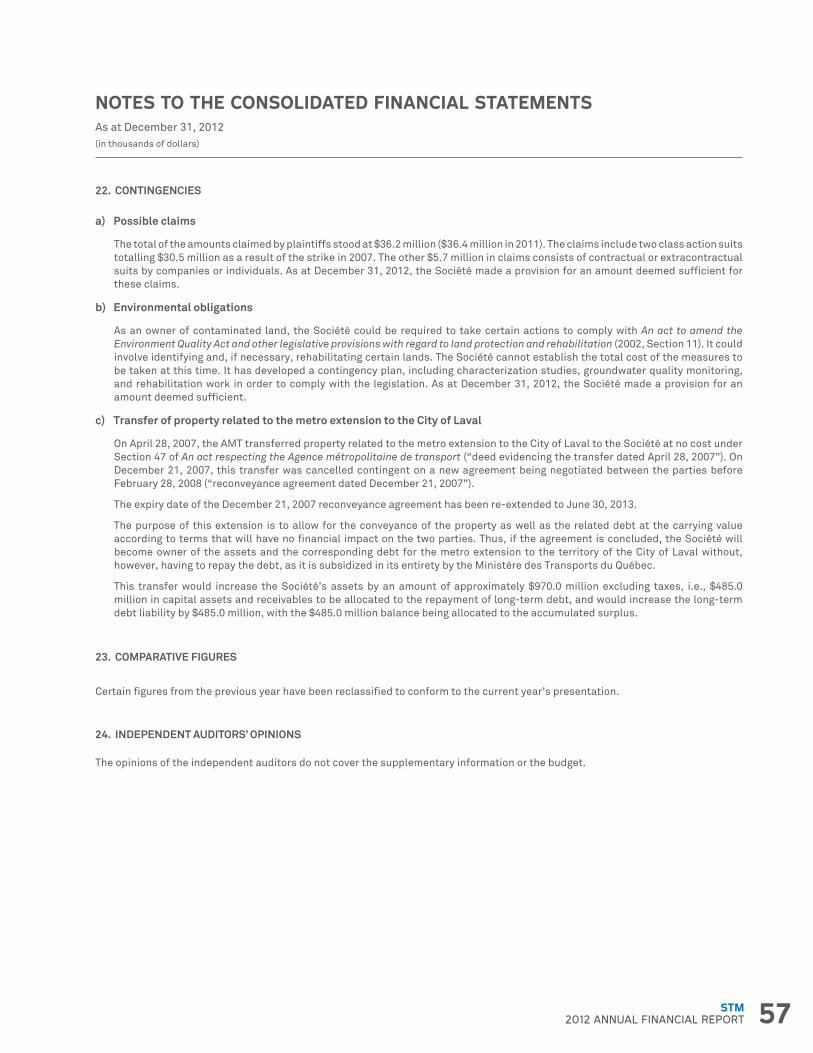
57STM2012 ANNUAL FINANCIAL REPORT
NOTES TO THE CONSOLIDATED FINANCIAL STATEMENTSAs at December 31, 2012(in thousands of dollars)
22. CONTINGENCIES
a) Possible claims
The total of the amounts claimed by plaintiffs stood at $36.2 million ($36.4 million in 2011). The claims include two class action suits totalling $30.5 million as a result of the strike in 2007. The other $5.7 million in claims consists of contractual or extracontractual suits by companies or individuals. As at December 31, 2012, the Société made a provision for an amount deemed sufficient for these claims.
b) Environmental obligations
As an owner of contaminated land, the Société could be required to take certain actions to comply with An act to amend the Environment Quality Act and other legislative provisions with regard to land protection and rehabilitation (2002, Section 11). It could involve identifying and, if necessary, rehabilitating certain lands. The Société cannot establish the total cost of the measures to be taken at this time. It has developed a contingency plan, including characterization studies, groundwater quality monitoring, and rehabilitation work in order to comply with the legislation. As at December 31, 2012, the Société made a provision for an amount deemed sufficient.
c) Transfer of property related to the metro extension to the City of Laval
On April 28, 2007, the AMT transferred property related to the metro extension to the City of Laval to the Société at no cost under Section 47 of An act respecting the Agence métropolitaine de transport (“deed evidencing the transfer dated April 28, 2007”). On December 21, 2007, this transfer was cancelled contingent on a new agreement being negotiated between the parties before February 28, 2008 (“reconveyance agreement dated December 21, 2007”).
The expiry date of the December 21, 2007 reconveyance agreement has been re-extended to June 30, 2013.
The purpose of this extension is to allow for the conveyance of the property as well as the related debt at the carrying value according to terms that will have no financial impact on the two parties. Thus, if the agreement is concluded, the Société will become owner of the assets and the corresponding debt for the metro extension to the territory of the City of Laval without, however, having to repay the debt, as it is subsidized in its entirety by the Ministère des Transports du Québec.
This transfer would increase the Société’s assets by an amount of approximately $970.0 million excluding taxes, i.e., $485.0 million in capital assets and receivables to be allocated to the repayment of long-term debt, and would increase the long-term debt liability by $485.0 million, with the $485.0 million balance being allocated to the accumulated surplus.
23. COMPARATIVE FIGURES
Certain figures from the previous year have been reclassified to conform to the current year’s presentation.
24. INDEPENDENT AUDITORS’ OPINIONS
The opinions of the independent auditors do not cover the supplementary information or the budget.
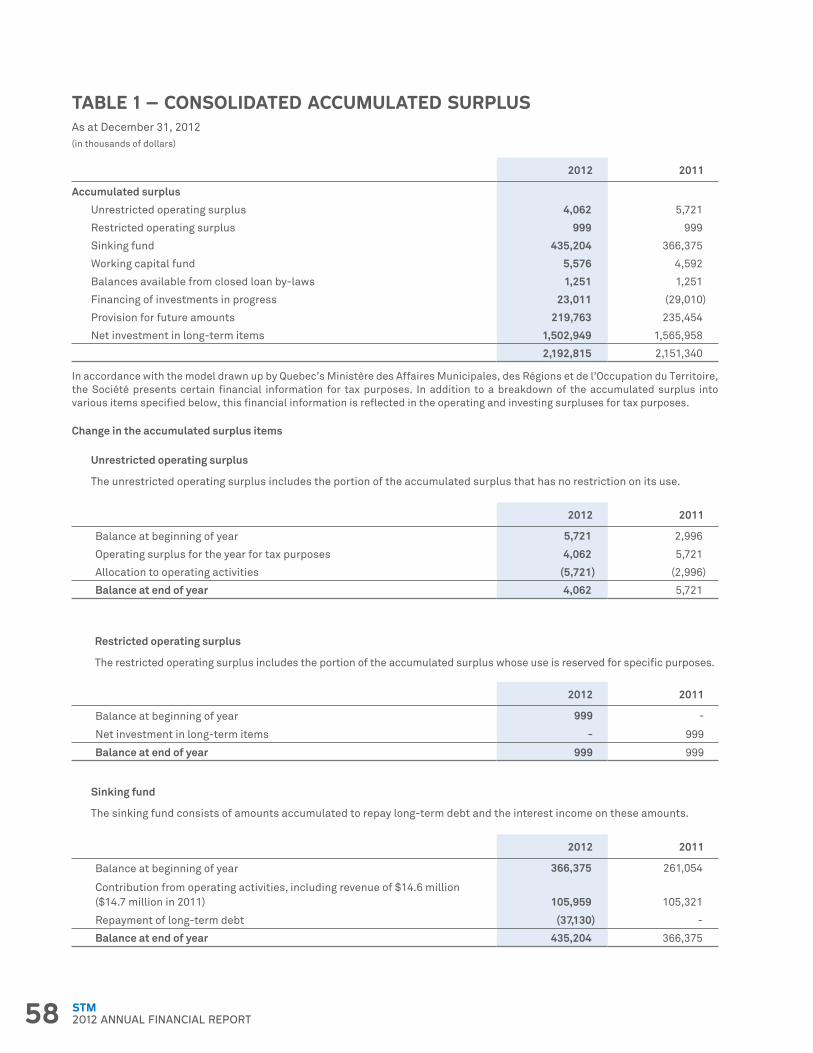
58 STM2012 ANNUAL FINANCIAL REPORT
TABLE 1 – CONSOLIDATED ACCUMULATED SURPLUSAs at December 31, 2012(in thousands of dollars)
- 2012 2011
Accumulated surplus - -
Unrestricted operating surplus 4,062 5,721
Restricted operating surplus 999 999
Sinking fund 435,204 366,375
Working capital fund 5,576 4,592
Balances available from closed loan by-laws 1,251 1,251
Financing of investments in progress 23,011 (29,010)
Provision for future amounts 219,763 235,454
Net investment in long-term items 1,502,949 1,565,958
- 2,192,815 2,151,340
In accordance with the model drawn up by Quebec’s Ministère des Affaires Municipales, des Régions et de l’Occupation du Territoire, the Société presents certain financial information for tax purposes. In addition to a breakdown of the accumulated surplus into various items specified below, this financial information is reflected in the operating and investing surpluses for tax purposes.
Change in the accumulated surplus items
Unrestricted operating surplus
The unrestricted operating surplus includes the portion of the accumulated surplus that has no restriction on its use.
- 2012 2011
Balance at beginning of year 5,721 2,996
Operating surplus for the year for tax purposes 4,062 5,721
Allocation to operating activities (5,721) (2,996)
Balance at end of year 4,062 5,721
Restricted operating surplus
The restricted operating surplus includes the portion of the accumulated surplus whose use is reserved for specific purposes.
- 2012 2011
Balance at beginning of year 999 -
Net investment in long-term items - 999
Balance at end of year 999 999
Sinking fund
The sinking fund consists of amounts accumulated to repay long-term debt and the interest income on these amounts.
- 2012 2011
Balance at beginning of year 366,375 261,054
Contribution from operating activities, including revenue of $14.6 million ($14.7 million in 2011) 105,959 105,321
Repayment of long-term debt (37,130) -
Balance at end of year 435,204 366,375
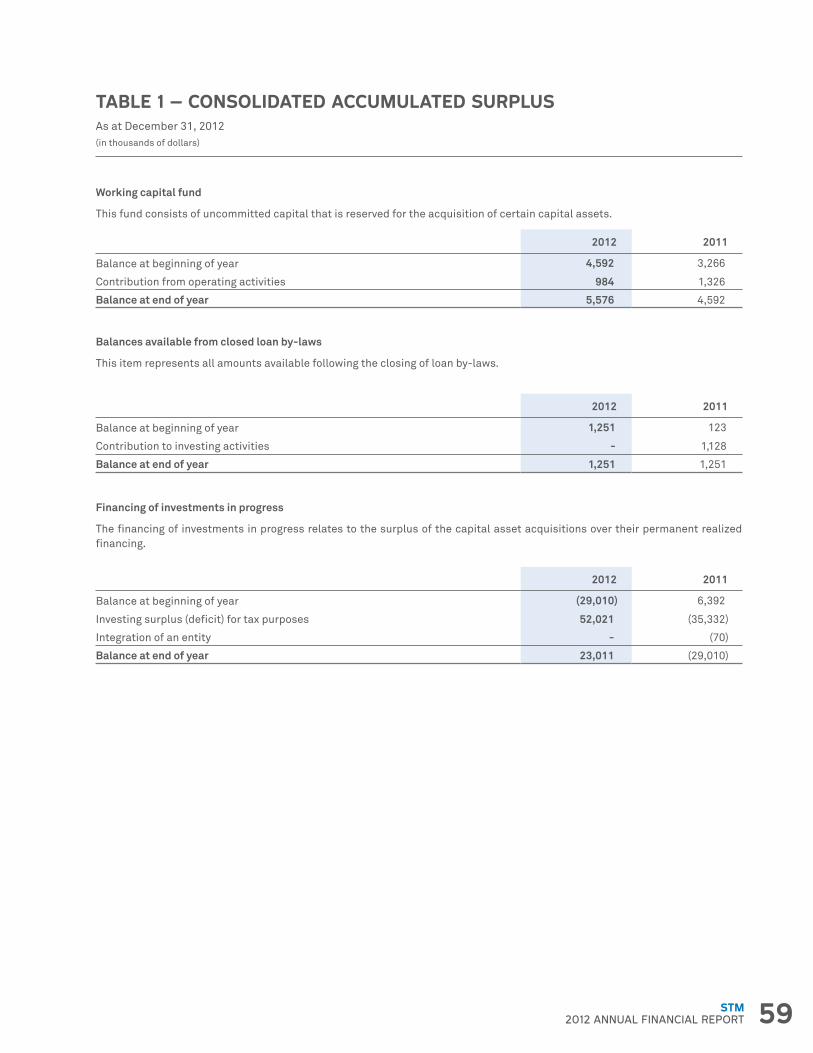
59STM2012 ANNUAL FINANCIAL REPORT
TABLE 1 – CONSOLIDATED ACCUMULATED SURPLUSAs at December 31, 2012(in thousands of dollars)
Working capital fund
This fund consists of uncommitted capital that is reserved for the acquisition of certain capital assets.
- 2012 2011
Balance at beginning of year 4,592 3,266
Contribution from operating activities 984 1,326
Balance at end of year 5,576 4,592
Balances available from closed loan by-laws
This item represents all amounts available following the closing of loan by-laws.
- 2012 2011
Balance at beginning of year 1,251 123
Contribution to investing activities - 1,128
Balance at end of year 1,251 1,251
Financing of investments in progress
The financing of investments in progress relates to the surplus of the capital asset acquisitions over their permanent realized financing.
- 2012 2011
Balance at beginning of year (29,010) 6,392
Investing surplus (deficit) for tax purposes 52,021 (35,332)
Integration of an entity - (70)
Balance at end of year 23,011 (29,010)
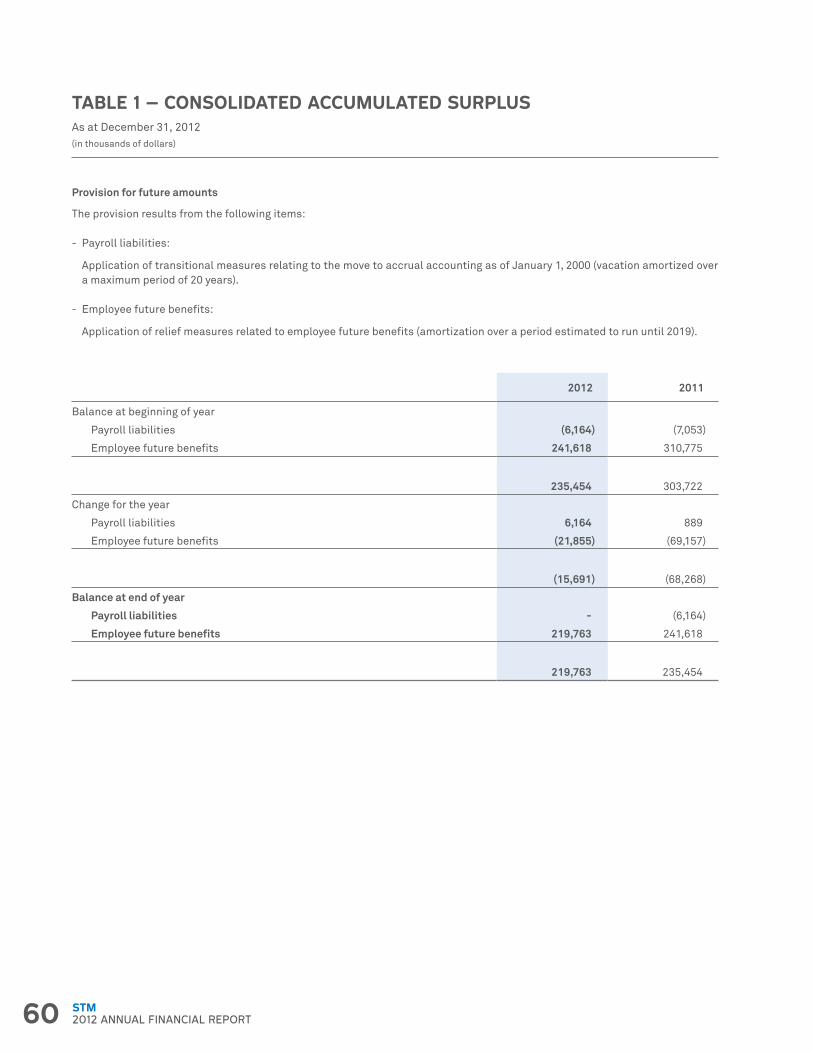
60 STM2012 ANNUAL FINANCIAL REPORT
TABLE 1 – CONSOLIDATED ACCUMULATED SURPLUSAs at December 31, 2012(in thousands of dollars)
Provision for future amounts
The provision results from the following items:
- Payroll liabilities:
Application of transitional measures relating to the move to accrual accounting as of January 1, 2000 (vacation amortized over a maximum period of 20 years).
- Employee future benefits:
Application of relief measures related to employee future benefits (amortization over a period estimated to run until 2019).
- 2012 2011
Balance at beginning of year - -
Payroll liabilities (6,164) (7,053)
Employee future benefits 241,618 310,775
- 235,454 303,722
Change for the year - -
Payroll liabilities 6,164 889
Employee future benefits (21,855) (69,157)
- (15,691) (68,268)
Balance at end of year - -
Payroll liabilities - (6,164)
Employee future benefits 219,763 241,618
- 219,763 235,454
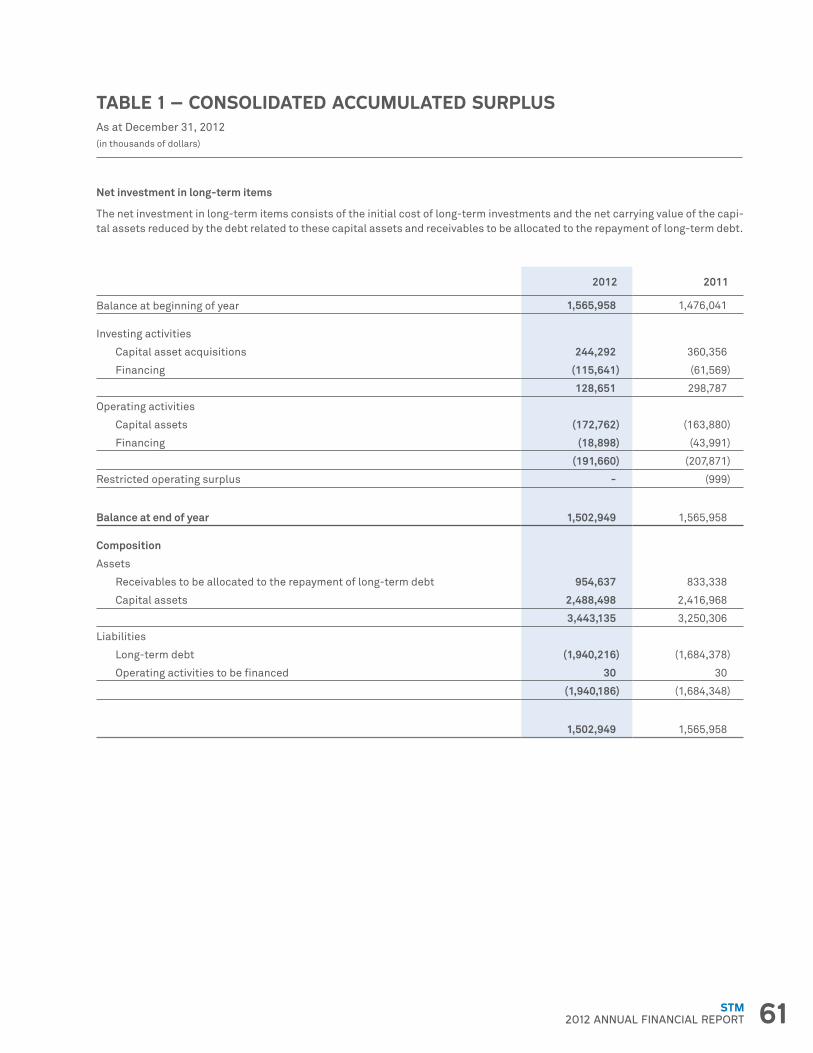
61STM2012 ANNUAL FINANCIAL REPORT
TABLE 1 – CONSOLIDATED ACCUMULATED SURPLUSAs at December 31, 2012(in thousands of dollars)
Net investment in long-term items
The net investment in long-term items consists of the initial cost of long-term investments and the net carrying value of the capi-tal assets reduced by the debt related to these capital assets and receivables to be allocated to the repayment of long-term debt.
- 2012 2011
Balance at beginning of year 1,565,958 1,476,041
Investing activities - -
Capital asset acquisitions 244,292 360,356
Financing (115,641) (61,569)
- 128,651 298,787
Operating activities - -
Capital assets (172,762) (163,880)
Financing (18,898) (43,991)
- (191,660) (207,871)
Restricted operating surplus - (999)
Balance at end of year 1,502,949 1,565,958
Composition - -
Assets - -
Receivables to be allocated to the repayment of long-term debt 954,637 833,338
Capital assets 2,488,498 2,416,968
- 3,443,135 3,250,306
Liabilities - -
Long-term debt (1,940,216) (1,684,378)
Operating activities to be financed 30 30
- (1,940,186) (1,684,348)
- 1,502,949 1,565,958
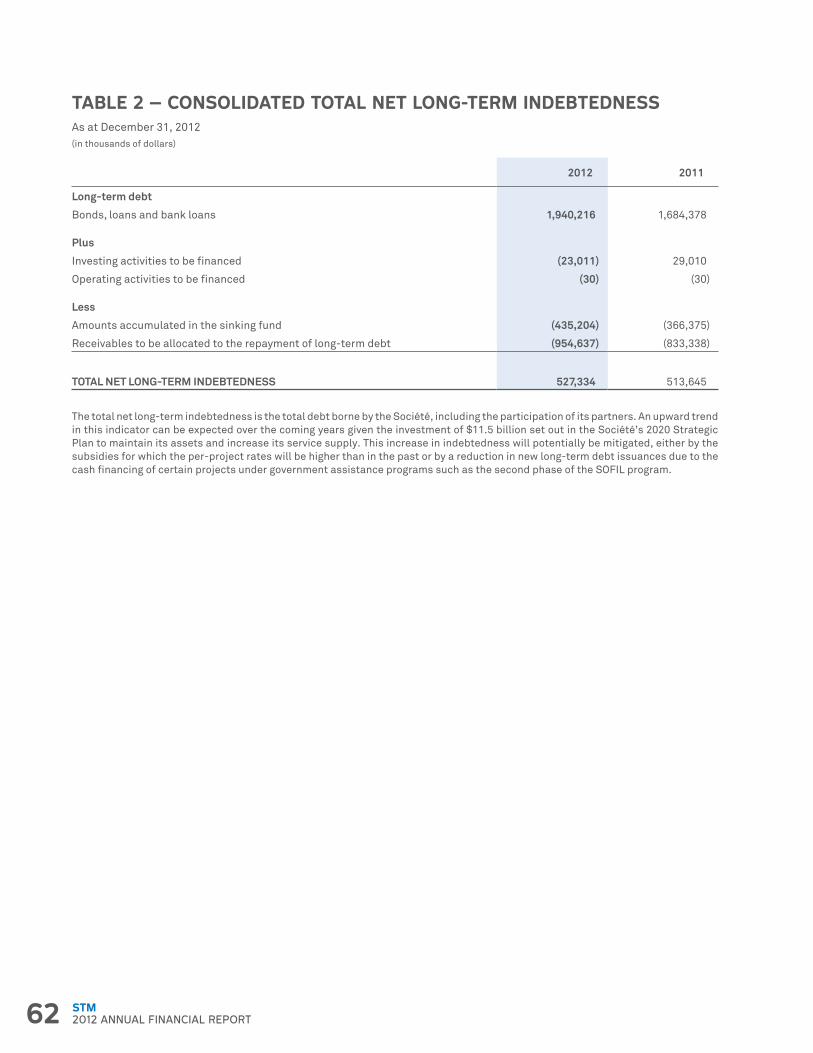
62 STM2012 ANNUAL FINANCIAL REPORT
TABLE 2 – CONSOLIDATED TOTAL NET LONG-TERM INDEBTEDNESSAs at December 31, 2012(in thousands of dollars)
- 2012 2011
Long-term debt - -
Bonds, loans and bank loans 1,940,216 1,684,378
Plus - -
Investing activities to be financed (23,011) 29,010
Operating activities to be financed (30) (30)
Less - -
Amounts accumulated in the sinking fund (435,204) (366,375)
Receivables to be allocated to the repayment of long-term debt (954,637) (833,338)
TOTAL NET LONG-TERM INDEBTEDNESS 527,334 513,645
The total net long-term indebtedness is the total debt borne by the Société, including the participation of its partners. An upward trend in this indicator can be expected over the coming years given the investment of $11.5 billion set out in the Société’s 2020 Strategic Plan to maintain its assets and increase its service supply. This increase in indebtedness will potentially be mitigated, either by the subsidies for which the per-project rates will be higher than in the past or by a reduction in new long-term debt issuances due to the cash financing of certain projects under government assistance programs such as the second phase of the SOFIL program.
63STM2012 ANNUAL FINANCIAL REPORT
UN
AU
DIT
ED
S
UP
PLE
ME
NTA
RY
INFO
RM
ATIO
N
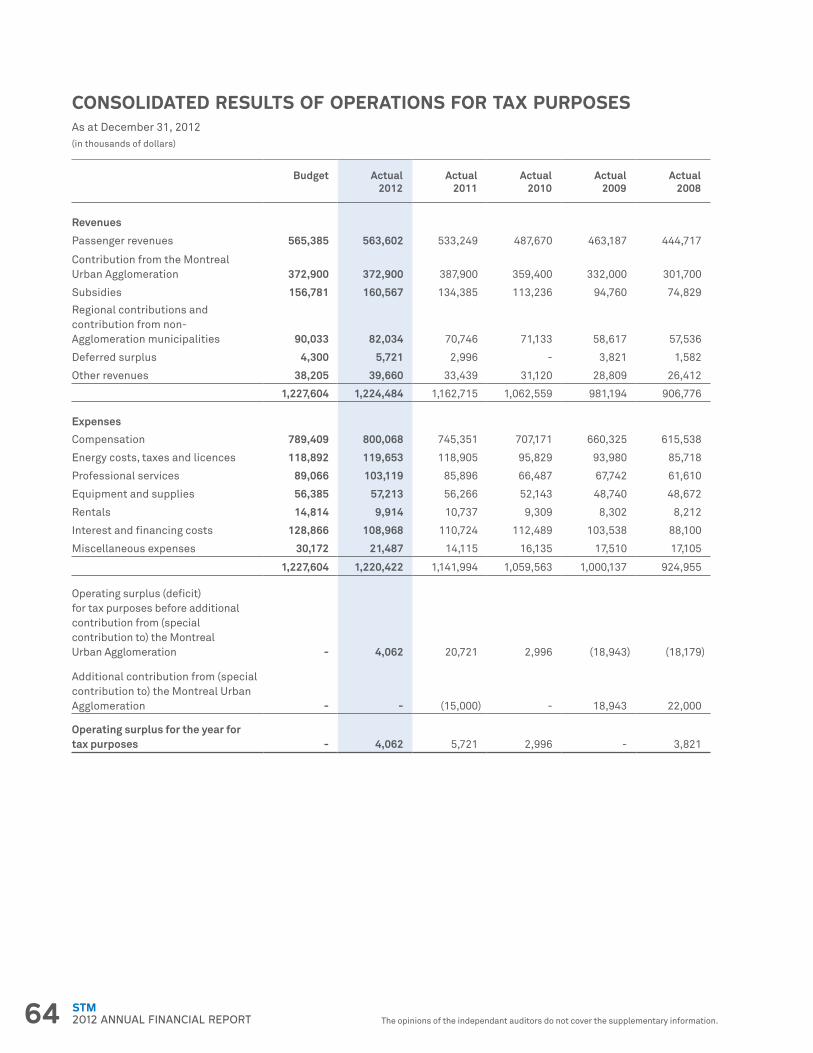
64 STM2012 ANNUAL FINANCIAL REPORT The opinions of the independant auditors do not cover the supplementary information.
CONSOLIDATED RESULTS OF OPERATIONS FOR TAX PURPOSESAs at December 31, 2012(in thousands of dollars)
- Budget Actual 2012
Actual 2011
Actual 2010
Actual 2009
Actual 2008
Revenues - - - - - -
Passenger revenues 565,385 563,602 533,249 487,670 463,187 444,717
Contribution from the Montreal Urban Agglomeration 372,900 372,900 387,900 359,400 332,000 301,700
Subsidies 156,781 160,567 134,385 113,236 94,760 74,829
Regional contributions and contribution from non- Agglomeration municipalities 90,033 82,034 70,746 71,133 58,617 57,536
Deferred surplus 4,300 5,721 2,996 - 3,821 1,582
Other revenues 38,205 39,660 33,439 31,120 28,809 26,412
- 1,227,604 1,224,484 1,162,715 1,062,559 981,194 906,776
Expenses - - - - - -
Compensation 789,409 800,068 745,351 707,171 660,325 615,538
Energy costs, taxes and licences 118,892 119,653 118,905 95,829 93,980 85,718
Professional services 89,066 103,119 85,896 66,487 67,742 61,610
Equipment and supplies 56,385 57,213 56,266 52,143 48,740 48,672
Rentals 14,814 9,914 10,737 9,309 8,302 8,212
Interest and financing costs 128,866 108,968 110,724 112,489 103,538 88,100
Miscellaneous expenses 30,172 21,487 14,115 16,135 17,510 17,105
- 1,227,604 1,220,422 1,141,994 1,059,563 1,000,137 924,955
Operating surplus (deficit) for tax purposes before additional contribution from (special contribution to) the Montreal Urban Agglomeration - 4,062 20,721 2,996 (18,943) (18,179)
Additional contribution from (special contribution to) the Montreal Urban Agglomeration - - (15,000) - 18,943 22,000
Operating surplus for the year for tax purposes - 4,062 5,721 2,996 - 3,821
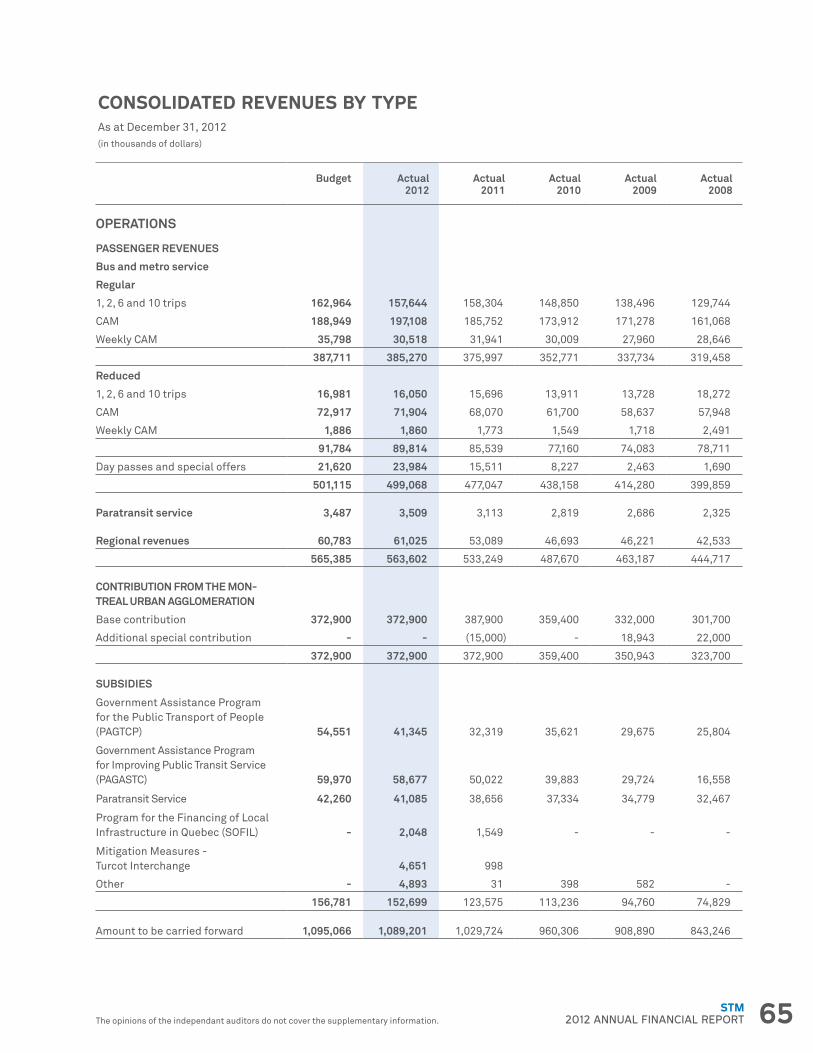
65STM2012 ANNUAL FINANCIAL REPORTThe opinions of the independant auditors do not cover the supplementary information.
CONSOLIDATED REVENUES BY TYPEAs at December 31, 2012(in thousands of dollars)
- Budget Actual 2012
Actual 2011
Actual 2010
Actual 2009
Actual 2008
OPERATIONS - - - - - -
PASSENGER REVENUES - - - - - -
Bus and metro service - - - - - -
Regular - - - - - -
1, 2, 6 and 10 trips 162,964 157,644 158,304 148,850 138,496 129,744
CAM 188,949 197,108 185,752 173,912 171,278 161,068
Weekly CAM 35,798 30,518 31,941 30,009 27,960 28,646
- 387,711 385,270 375,997 352,771 337,734 319,458
Reduced - - - - - -
1, 2, 6 and 10 trips 16,981 16,050 15,696 13,911 13,728 18,272
CAM 72,917 71,904 68,070 61,700 58,637 57,948
Weekly CAM 1,886 1,860 1,773 1,549 1,718 2,491
- 91,784 89,814 85,539 77,160 74,083 78,711
Day passes and special offers 21,620 23,984 15,511 8,227 2,463 1,690
- 501,115 499,068 477,047 438,158 414,280 399,859
Paratransit service 3,487 3,509 3,113 2,819 2,686 2,325
Regional revenues 60,783 61,025 53,089 46,693 46,221 42,533
- 565,385 563,602 533,249 487,670 463,187 444,717
CONTRIBUTION FROM THE MON-TREAL URBAN AGGLOMERATION
- - - - - -
Base contribution 372,900 372,900 387,900 359,400 332,000 301,700
Additional special contribution - - (15,000) - 18,943 22,000
- 372,900 372,900 372,900 359,400 350,943 323,700
SUBSIDIES - - - - - -
Government Assistance Program for the Public Transport of People (PAGTCP) 54,551 41,345 32,319 35,621 29,675 25,804
Government Assistance Program for Improving Public Transit Service (PAGASTC) 59,970 58,677 50,022 39,883 29,724 16,558
Paratransit Service 42,260 41,085 38,656 37,334 34,779 32,467
Program for the Financing of Local Infrastructure in Quebec (SOFIL) - 2,048 1,549 - - -
Mitigation Measures - Turcot Interchange - 4,651 998 - - -
Other - 4,893 31 398 582 -
- 156,781 152,699 123,575 113,236 94,760 74,829
Amount to be carried forward 1,095,066 1,089,201 1,029,724 960,306 908,890 843,246
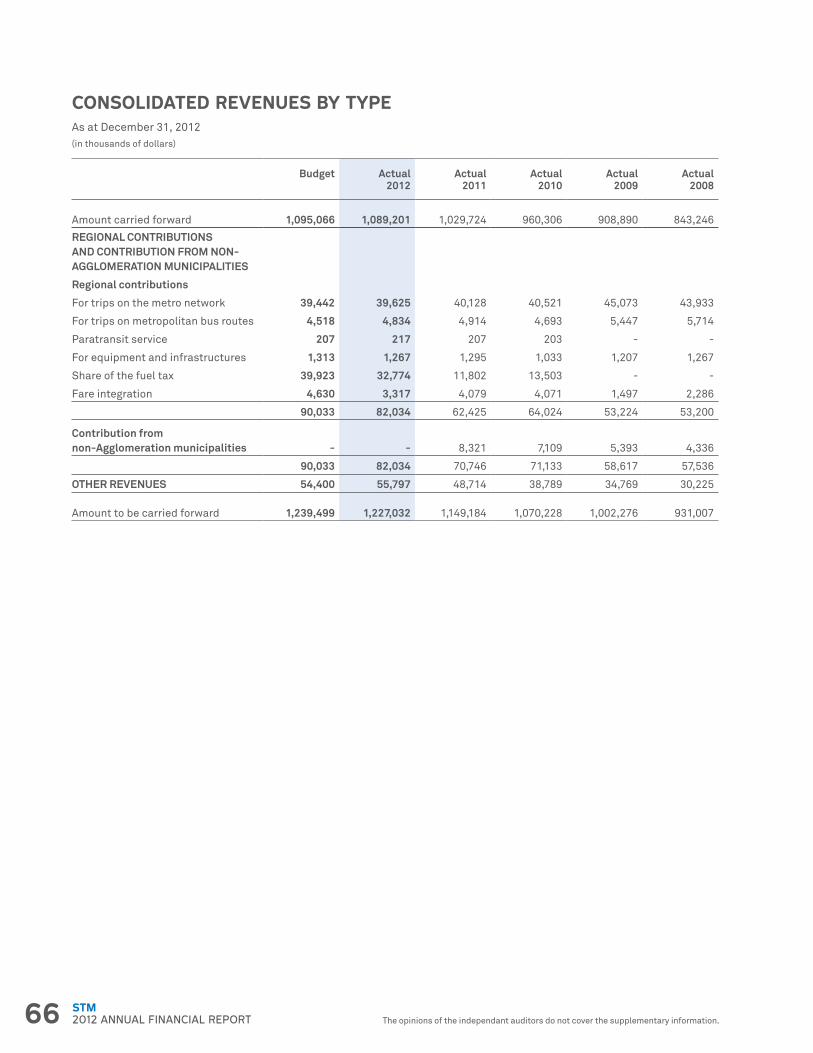
66 STM2012 ANNUAL FINANCIAL REPORT The opinions of the independant auditors do not cover the supplementary information.
CONSOLIDATED REVENUES BY TYPEAs at December 31, 2012(in thousands of dollars)
- Budget Actual 2012
Actual 2011
Actual 2010
Actual 2009
Actual 2008
Amount carried forward 1,095,066 1,089,201 1,029,724 960,306 908,890 843,246
REGIONAL CONTRIBUTIONS AND CONTRIBUTION FROM NON- AGGLOMERATION MUNICIPALITIES
- - - - - -
Regional contributions - - - - - -
For trips on the metro network 39,442 39,625 40,128 40,521 45,073 43,933
For trips on metropolitan bus routes 4,518 4,834 4,914 4,693 5,447 5,714
Paratransit service 207 217 207 203 - -
For equipment and infrastructures 1,313 1,267 1,295 1,033 1,207 1,267
Share of the fuel tax 39,923 32,774 11,802 13,503 - -
Fare integration 4,630 3,317 4,079 4,071 1,497 2,286
- 90,033 82,034 62,425 64,024 53,224 53,200
Contribution from non-Agglomeration municipalities - - 8,321 7,109 5,393 4,336
- 90,033 82,034 70,746 71,133 58,617 57,536
OTHER REVENUES 54,400 55,797 48,714 38,789 34,769 30,225
Amount to be carried forward 1,239,499 1,227,032 1,149,184 1,070,228 1,002,276 931,007
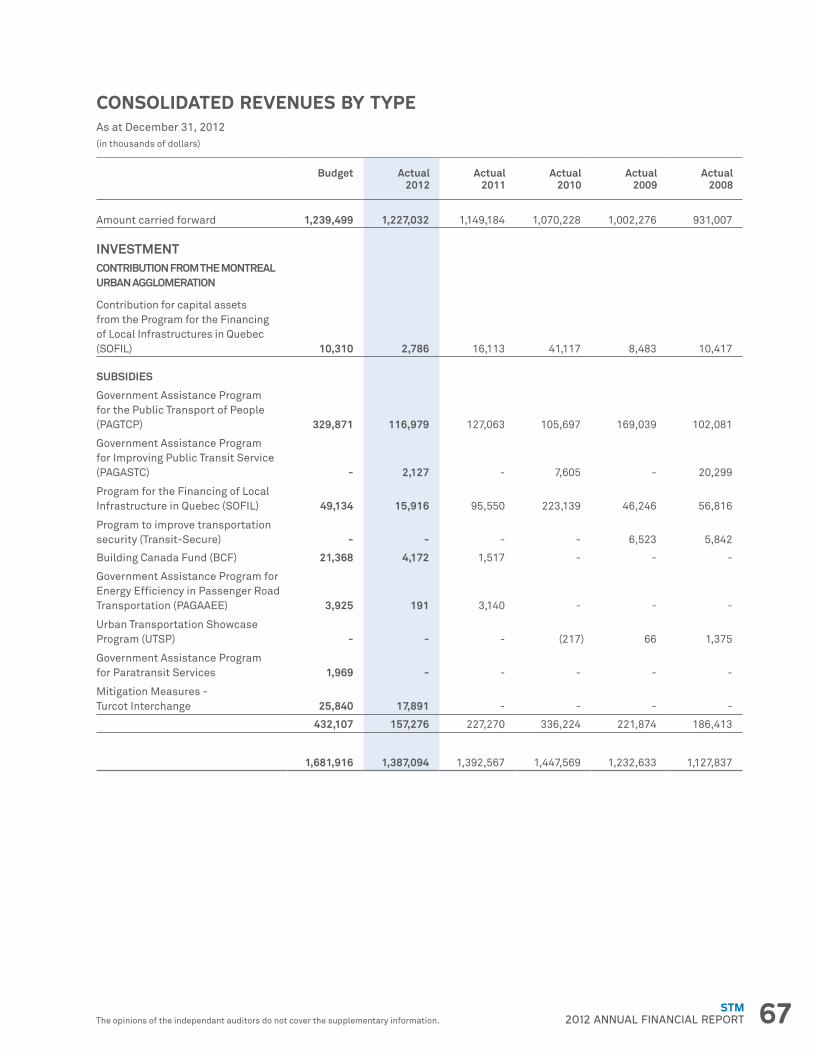
67STM2012 ANNUAL FINANCIAL REPORTThe opinions of the independant auditors do not cover the supplementary information.
CONSOLIDATED REVENUES BY TYPEAs at December 31, 2012(in thousands of dollars)
- Budget Actual 2012
Actual 2011
Actual 2010
Actual 2009
Actual 2008
Amount carried forward 1,239,499 1,227,032 1,149,184 1,070,228 1,002,276 931,007
INVESTMENT - - - - - -
CONTRIBUTION FROM THE MONTREAL URBAN AGGLOMERATION
- - - - - -
Contribution for capital assets from the Program for the Financing of Local Infrastructures in Quebec (SOFIL) 10,310 2,786 16,113 41,117 8,483 10,417
SUBSIDIES - - - - - -
Government Assistance Program for the Public Transport of People (PAGTCP) 329,871 116,979 127,063 105,697 169,039 102,081
Government Assistance Program for Improving Public Transit Service (PAGASTC) - 2,127 - 7,605 - 20,299
Program for the Financing of Local Infrastructure in Quebec (SOFIL) 49,134 15,916 95,550 223,139 46,246 56,816
Program to improve transportation security (Transit-Secure) - - - - 6,523 5,842
Building Canada Fund (BCF) 21,368 4,172 1,517 - - -
Government Assistance Program for Energy Efficiency in Passenger Road Transportation (PAGAAEE) 3,925 191 3,140 - - -
Urban Transportation Showcase Program (UTSP) - - - (217) 66 1,375
Government Assistance Program for Paratransit Services 1,969 - - - - -
Mitigation Measures - Turcot Interchange 25,840 17,891 - - - -
- 432,107 157,276 227,270 336,224 221,874 186,413
- 1,681,916 1,387,094 1,392,567 1,447,569 1,232,633 1,127,837
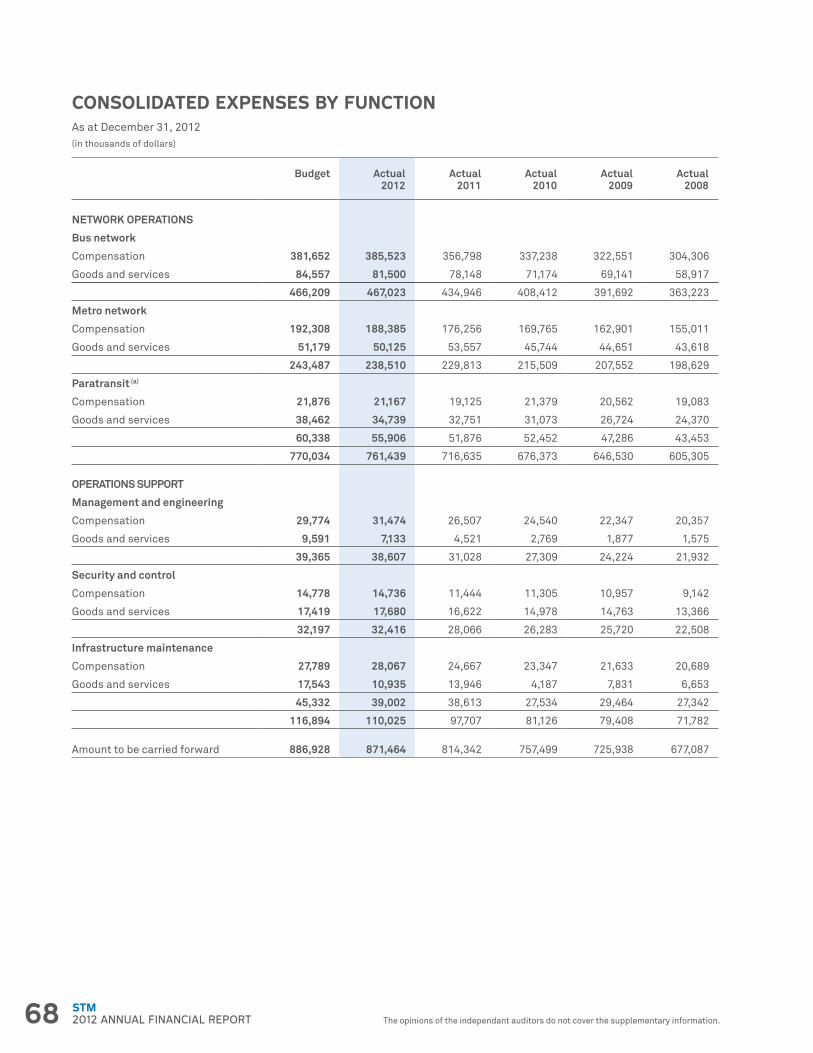
68 STM2012 ANNUAL FINANCIAL REPORT The opinions of the independant auditors do not cover the supplementary information.
CONSOLIDATED EXPENSES BY FUNCTIONAs at December 31, 2012(in thousands of dollars)
- Budget Actual 2012
Actual 2011
Actual 2010
Actual 2009
Actual 2008
NETWORK OPERATIONS - - - - - -
Bus network - - - - - -
Compensation 381,652 385,523 356,798 337,238 322,551 304,306
Goods and services 84,557 81,500 78,148 71,174 69,141 58,917
- 466,209 467,023 434,946 408,412 391,692 363,223
Metro network - - - - - -
Compensation 192,308 188,385 176,256 169,765 162,901 155,011
Goods and services 51,179 50,125 53,557 45,744 44,651 43,618
- 243,487 238,510 229,813 215,509 207,552 198,629
Paratransit (a) - - - - - -
Compensation 21,876 21,167 19,125 21,379 20,562 19,083
Goods and services 38,462 34,739 32,751 31,073 26,724 24,370
- 60,338 55,906 51,876 52,452 47,286 43,453
- 770,034 761,439 716,635 676,373 646,530 605,305
OPERATIONS SUPPORT - - - - - -
Management and engineering - - - - - -
Compensation 29,774 31,474 26,507 24,540 22,347 20,357
Goods and services 9,591 7,133 4,521 2,769 1,877 1,575
- 39,365 38,607 31,028 27,309 24,224 21,932
Security and control - - - - - -
Compensation 14,778 14,736 11,444 11,305 10,957 9,142
Goods and services 17,419 17,680 16,622 14,978 14,763 13,366
32,197 32,416 28,066 26,283 25,720 22,508
Infrastructure maintenance - - - - - -
Compensation 27,789 28,067 24,667 23,347 21,633 20,689
Goods and services 17,543 10,935 13,946 4,187 7,831 6,653
- 45,332 39,002 38,613 27,534 29,464 27,342
- 116,894 110,025 97,707 81,126 79,408 71,782
Amount to be carried forward 886,928 871,464 814,342 757,499 725,938 677,087

69STM2012 ANNUAL FINANCIAL REPORTThe opinions of the independant auditors do not cover the supplementary information.
CONSOLIDATED EXPENSES BY FUNCTIONAs at December 31, 2012(in thousands of dollars)
- Budget Actual 2012
Actual 2011
Actual 2010
Actual 2009
Actual 2008
Amount carried forward 886,928 871,464 814,342 757,499 725,938 677,087 ADMINISTRATIVE SERVICES - - - - - -Finance and Control - - - - - -Compensation 17,973 18,439 17,805 16,210 15,066 13,943 Goods and services 7,055 6,960 6,267 4,749 7,264 7,534 - 25,028 25,399 24,072 20,959 22,330 21,477
Planning, Marketing and Communications - - - - - -Compensation 18,255 19,916 18,187 16,772 13,762 10,969 Goods and services 16,116 15,673 14,298 9,718 8,678 8,045 - 34,371 35,589 32,485 26,490 22,440 19,014 Human Resources and Shared Services - - - - - -Compensation 47,241 48,582 45,203 42,315 38,829 35,683 Goods and services 21,576 21,280 19,751 17,068 14,545 12,636 - 68,817 69,862 64,954 59,383 53,374 48,319 Corporate Services - - - - - -Compensation 13,352 12,698 12,203 9,708 8,527 7,600 Goods and services 8,177 6,009 3,915 3,396 2,412 2,098 - 21,529 18,707 16,118 13,104 10,939 9,698 - 149,745 149,557 137,629 119,936 109,083 98,508
SPECIAL PROJECTS AND OTHER EXPENSES - - - - - -Compensation 19,890 25,008 36,267 30,789 21,472 21,746Goods and services 30,987 31,356 13,497 26,561 29,305 39,170- 50,877 56,364 49,764 57,350 50,777 60,916 ALLOCATION - PROVISION FOR FUTURE AMOUNTS (employee future benefits)
- - - - - -
Compensation 33,408 21,855 69,157 (313,379) (96,419) - FINANCING COSTS - - - - - -Goods and services 90,684 73,622 64,056 65,030 61,058 47,747 AMORTIZATION - - - - - -Goods and services 174,043 172,757 159,873 158,852 119,650 100,400 UNFORESEEN EXPENSES - - - - - -Goods and services 5,953 - - - - -
- 1,391,638 1,345,619 1,294,821 845,288 970,087 984,658
(a) Paratransit - - - - - -
Paratransit service in the Statement of Operations 65,852 61,784 57,465 53,423 48,475 44,696 Expenses included in other functions (5,514) (5,878) (5,589) (971) (1,189) (1,243)
60,338 55,906 51,876 52,452 47,286 43,453
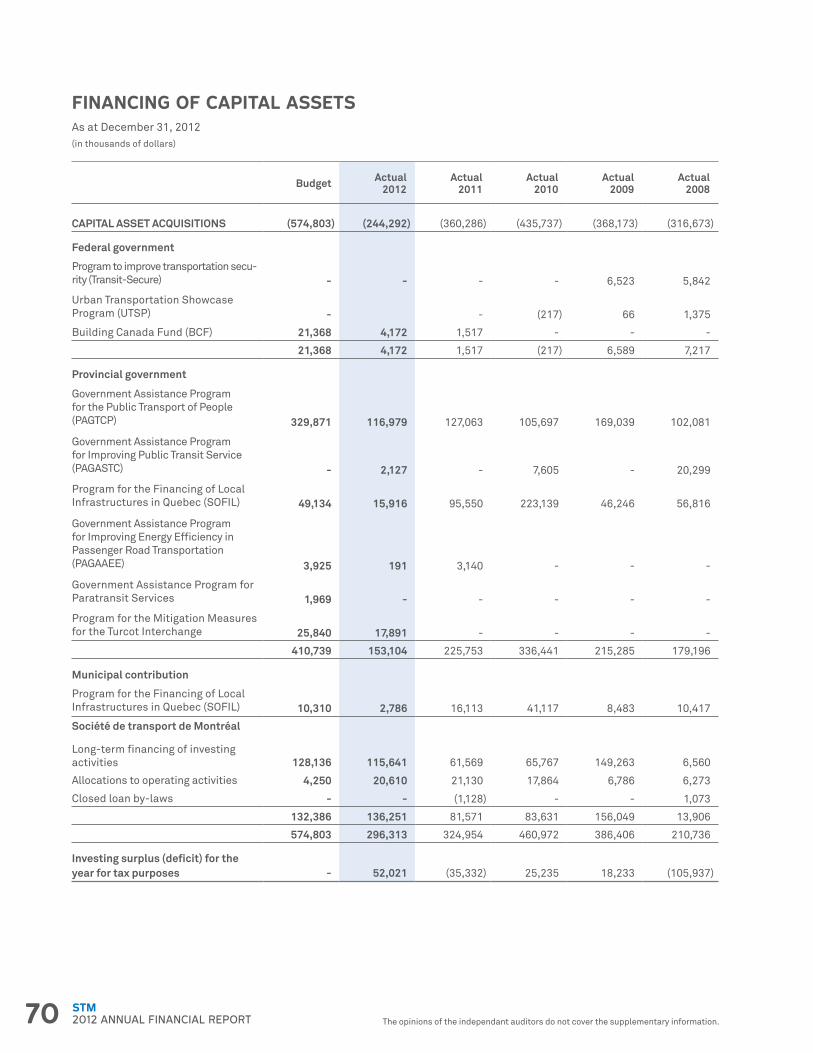
70 STM2012 ANNUAL FINANCIAL REPORT The opinions of the independant auditors do not cover the supplementary information.
FINANCING OF CAPITAL ASSETSAs at December 31, 2012(in thousands of dollars)
- Budget Actual 2012
Actual 2011
Actual 2010
Actual 2009
Actual 2008
CAPITAL ASSET ACQUISITIONS (574,803) (244,292) (360,286) (435,737) (368,173) (316,673)
Federal government - - - - - -
Program to improve transportation secu-rity (Transit-Secure) - - - - 6,523 5,842
Urban Transportation Showcase Program (UTSP) - - - (217) 66 1,375
Building Canada Fund (BCF) 21,368 4,172 1,517 - - -
- 21,368 4,172 1,517 (217) 6,589 7,217
Provincial government - - - - - -
Government Assistance Program for the Public Transport of People (PAGTCP) 329,871 116,979 127,063 105,697 169,039 102,081
Government Assistance Program for Improving Public Transit Service (PAGASTC) - 2,127 - 7,605 - 20,299
Program for the Financing of Local Infrastructures in Quebec (SOFIL) 49,134 15,916 95,550 223,139 46,246 56,816
Government Assistance Program for Improving Energy Efficiency in Passenger Road Transportation (PAGAAEE) 3,925 191 3,140 - - -
Government Assistance Program for Paratransit Services 1,969 - - - - -
Program for the Mitigation Measures for the Turcot Interchange 25,840 17,891 - - - -
- 410,739 153,104 225,753 336,441 215,285 179,196
Municipal contribution - - - - - -
Program for the Financing of Local Infrastructures in Quebec (SOFIL) 10,310 2,786 16,113 41,117 8,483 10,417
Société de transport de Montréal - - - - - -
Long-term financing of investing activities 128,136 115,641 61,569 65,767 149,263 6,560
Allocations to operating activities 4,250 20,610 21,130 17,864 6,786 6,273
Closed loan by-laws - - (1,128) - - 1,073
- 132,386 136,251 81,571 83,631 156,049 13,906
- 574,803 296,313 324,954 460,972 386,406 210,736
Investing surplus (deficit) for the year for tax purposes - 52,021 (35,332) 25,235 18,233 (105,937)
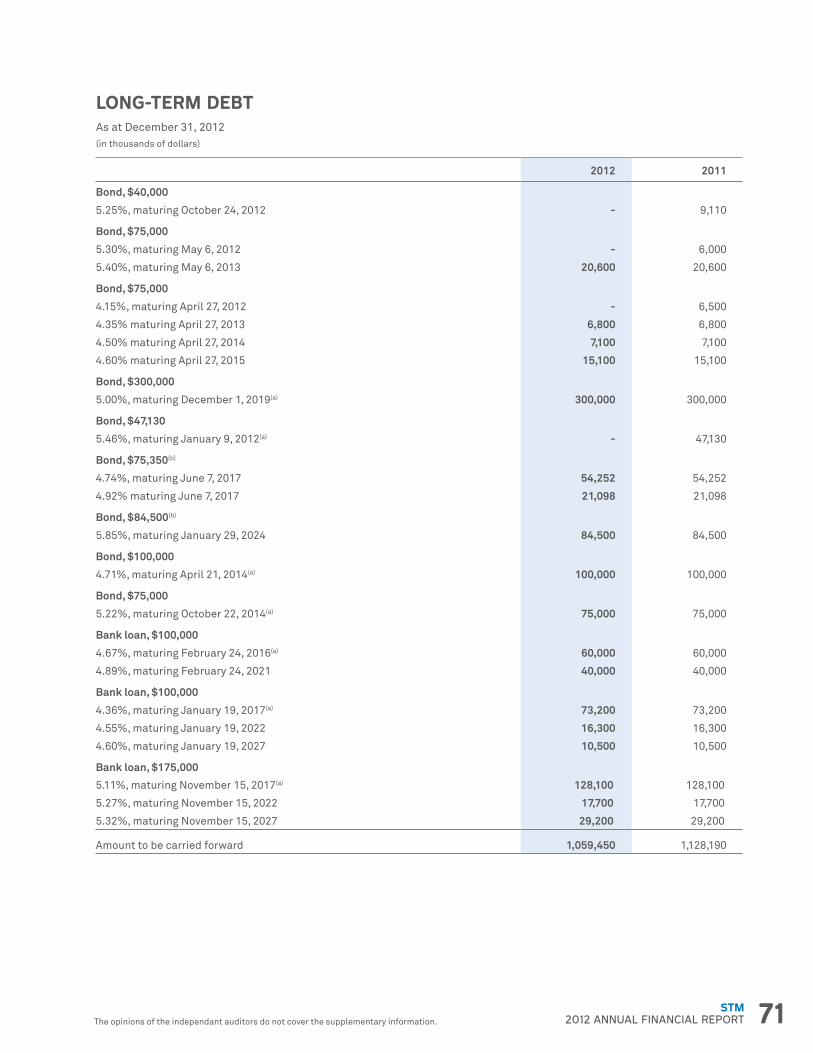
71STM2012 ANNUAL FINANCIAL REPORTThe opinions of the independant auditors do not cover the supplementary information.
LONG-TERM DEBTAs at December 31, 2012(in thousands of dollars)
- 2012 2011
Bond, $40,000 - -
5.25%, maturing October 24, 2012 - 9,110
Bond, $75,000 - -
5.30%, maturing May 6, 2012 - 6,000
5.40%, maturing May 6, 2013 20,600 20,600
Bond, $75,000 - -
4.15%, maturing April 27, 2012 - 6,500
4.35% maturing April 27, 2013 6,800 6,800
4.50% maturing April 27, 2014 7,100 7,100
4.60% maturing April 27, 2015 15,100 15,100
Bond, $300,000 - -
5.00%, maturing December 1, 2019(a) 300,000 300,000
Bond, $47,130 - -
5.46%, maturing January 9, 2012(a) - 47,130
Bond, $75,350(b) - -
4.74%, maturing June 7, 2017 54,252 54,252
4.92% maturing June 7, 2017 21,098 21,098
Bond, $84,500(b) - -
5.85%, maturing January 29, 2024 84,500 84,500
Bond, $100,000 - -
4.71%, maturing April 21, 2014(a) 100,000 100,000
Bond, $75,000 - -
5.22%, maturing October 22, 2014(a) 75,000 75,000
Bank loan, $100,000 - -
4.67%, maturing February 24, 2016(a) 60,000 60,000
4.89%, maturing February 24, 2021 40,000 40,000
Bank loan, $100,000 - -
4.36%, maturing January 19, 2017(a) 73,200 73,200
4.55%, maturing January 19, 2022 16,300 16,300
4.60%, maturing January 19, 2027 10,500 10,500
Bank loan, $175,000 - -
5.11%, maturing November 15, 2017(a) 128,100 128,100
5.27%, maturing November 15, 2022 17,700 17,700
5.32%, maturing November 15, 2027 29,200 29,200
Amount to be carried forward 1,059,450 1,128,190
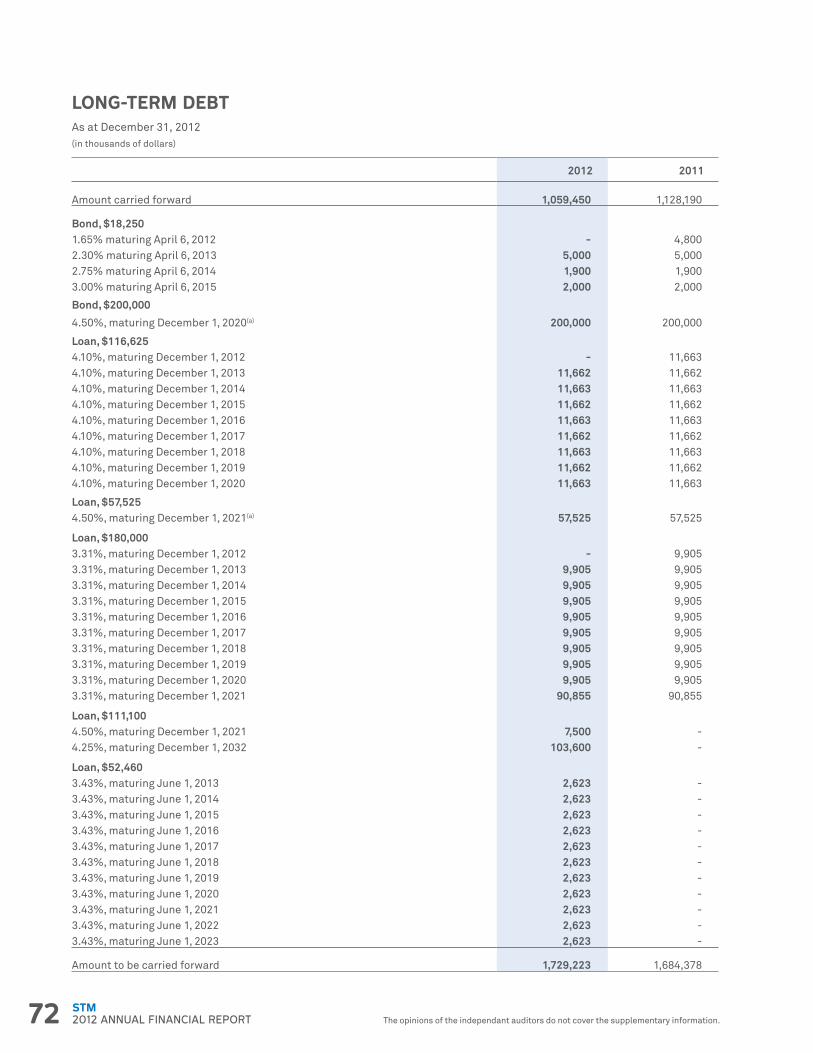
The opinions of the independant auditors do not cover the supplementary information.The opinions of the independant auditors do not cover the supplementary information.72 STM2012 ANNUAL FINANCIAL REPORT
LONG-TERM DEBTAs at December 31, 2012(in thousands of dollars)
- 2012 2011
Amount carried forward 1,059,450 1,128,190
Bond, $18,250 - -1.65% maturing April 6, 2012 - 4,800 2.30% maturing April 6, 2013 5,000 5,000 2.75% maturing April 6, 2014 1,900 1,900 3.00% maturing April 6, 2015 2,000 2,000
Bond, $200,000 - -
4.50%, maturing December 1, 2020(a) 200,000 200,000
Loan, $116,625 - -4.10%, maturing December 1, 2012 - 11,663 4.10%, maturing December 1, 2013 11,662 11,662 4.10%, maturing December 1, 2014 11,663 11,663 4.10%, maturing December 1, 2015 11,662 11,662 4.10%, maturing December 1, 2016 11,663 11,663 4.10%, maturing December 1, 2017 11,662 11,662 4.10%, maturing December 1, 2018 11,663 11,663 4.10%, maturing December 1, 2019 11,662 11,662 4.10%, maturing December 1, 2020 11,663 11,663
Loan, $57,525 - -4.50%, maturing December 1, 2021(a) 57,525 57,525
Loan, $180,000 - -3.31%, maturing December 1, 2012 - 9,905 3.31%, maturing December 1, 2013 9,905 9,905 3.31%, maturing December 1, 2014 9,905 9,905 3.31%, maturing December 1, 2015 9,905 9,905 3.31%, maturing December 1, 2016 9,905 9,905 3.31%, maturing December 1, 2017 9,905 9,905 3.31%, maturing December 1, 2018 9,905 9,905 3.31%, maturing December 1, 2019 9,905 9,905 3.31%, maturing December 1, 2020 9,905 9,905 3.31%, maturing December 1, 2021 90,855 90,855
Loan, $111,100 - -4.50%, maturing December 1, 2021 7,500 - 4.25%, maturing December 1, 2032 103,600 -
Loan, $52,460 - -3.43%, maturing June 1, 2013 2,623 - 3.43%, maturing June 1, 2014 2,623 - 3.43%, maturing June 1, 2015 2,623 - 3.43%, maturing June 1, 2016 2,623 - 3.43%, maturing June 1, 2017 2,623 - 3.43%, maturing June 1, 2018 2,623 - 3.43%, maturing June 1, 2019 2,623 - 3.43%, maturing June 1, 2020 2,623 - 3.43%, maturing June 1, 2021 2,623 - 3.43%, maturing June 1, 2022 2,623 - 3.43%, maturing June 1, 2023 2,623 -
Amount to be carried forward 1,729,223 1,684,378
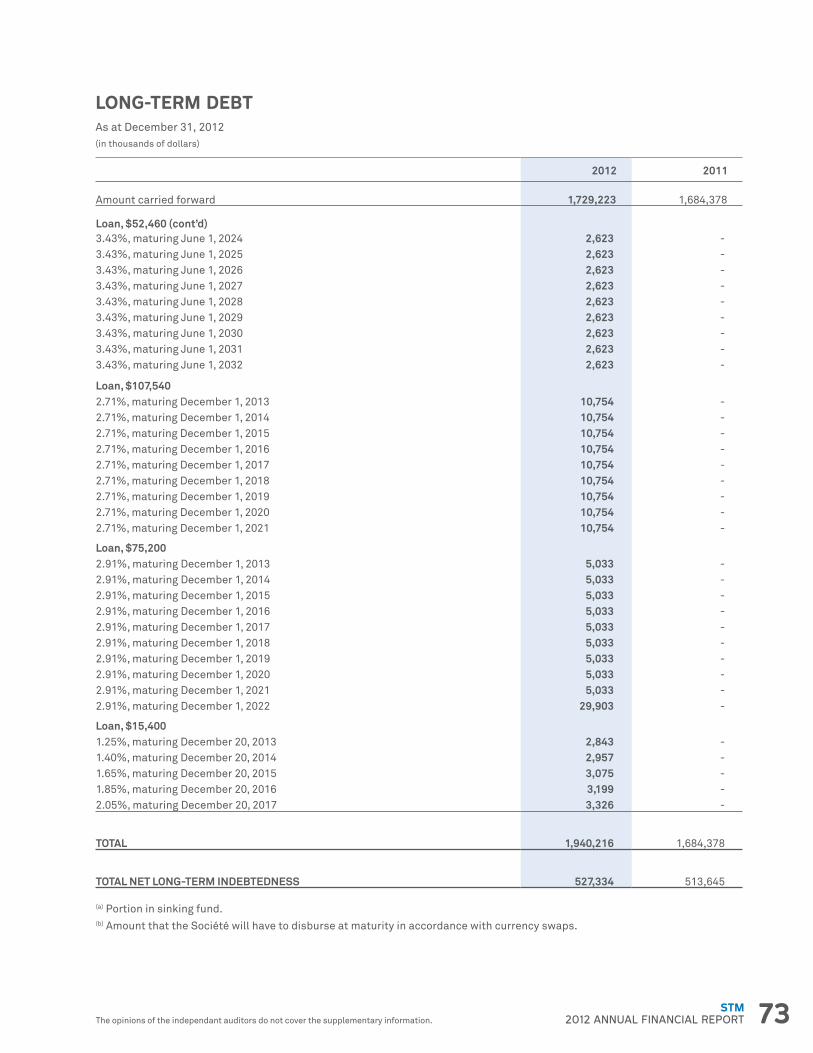
73STM2012 ANNUAL FINANCIAL REPORTThe opinions of the independant auditors do not cover the supplementary information.The opinions of the independant auditors do not cover the supplementary information.
LONG-TERM DEBTAs at December 31, 2012(in thousands of dollars)
- 2012 2011
Amount carried forward 1,729,223 1,684,378
Loan, $52,460 (cont’d) - -3.43%, maturing June 1, 2024 2,623 - 3.43%, maturing June 1, 2025 2,623 - 3.43%, maturing June 1, 2026 2,623 - 3.43%, maturing June 1, 2027 2,623 - 3.43%, maturing June 1, 2028 2,623 - 3.43%, maturing June 1, 2029 2,623 - 3.43%, maturing June 1, 2030 2,623 - 3.43%, maturing June 1, 2031 2,623 - 3.43%, maturing June 1, 2032 2,623 -
Loan, $107,540 - -2.71%, maturing December 1, 2013 10,754 - 2.71%, maturing December 1, 2014 10,754 - 2.71%, maturing December 1, 2015 10,754 - 2.71%, maturing December 1, 2016 10,754 - 2.71%, maturing December 1, 2017 10,754 - 2.71%, maturing December 1, 2018 10,754 - 2.71%, maturing December 1, 2019 10,754 - 2.71%, maturing December 1, 2020 10,754 - 2.71%, maturing December 1, 2021 10,754 -
Loan, $75,200 - -2.91%, maturing December 1, 2013 5,033 - 2.91%, maturing December 1, 2014 5,033 - 2.91%, maturing December 1, 2015 5,033 - 2.91%, maturing December 1, 2016 5,033 - 2.91%, maturing December 1, 2017 5,033 - 2.91%, maturing December 1, 2018 5,033 - 2.91%, maturing December 1, 2019 5,033 - 2.91%, maturing December 1, 2020 5,033 - 2.91%, maturing December 1, 2021 5,033 - 2.91%, maturing December 1, 2022 29,903 -
Loan, $15,400 - -1.25%, maturing December 20, 2013 2,843 - 1.40%, maturing December 20, 2014 2,957 - 1.65%, maturing December 20, 2015 3,075 - 1.85%, maturing December 20, 2016 3,199 - 2.05%, maturing December 20, 2017 3,326 -
TOTAL 1,940,216 1,684,378
TOTAL NET LONG-TERM INDEBTEDNESS 527,334 513,645
(a) Portion in sinking fund.(b) Amount that the Société will have to disburse at maturity in accordance with currency swaps.

The opinions of the independant auditors do not cover the supplementary information.The opinions of the independant auditors do not cover the supplementary information.74 STM2012 ANNUAL FINANCIAL REPORT
FINANCIAL RATIOSAs at December 31, 2012
The Société formalized the normal management practices on which it bases its financing decisions. To do so, it adopted and implemented a corporate policy and segment guidelines, including debt management and financial risk management segment guidelines. The debt management segment guideline favours the use of financial ratios that will serve as long-term indicators of the Société’s financial health. Among these indicators are the indebtedness ratios.
The three ratios chosen are indicators that illustrate how investing decisions impact the Société’s long-term financial position.
These ratios must be compared on a historical basis. Following international benchmarking against same-size entities, the Société set limits for each of the ratios.
All financial statement items used to calculate ratios have been adjusted so that they represent only expenses exclusive to the Société. As such, for comparison purposes, any impact from subsidies related to capital assets has been eliminated.
As at December 31, 2012, all of the ratios are within the limits set by the Société.
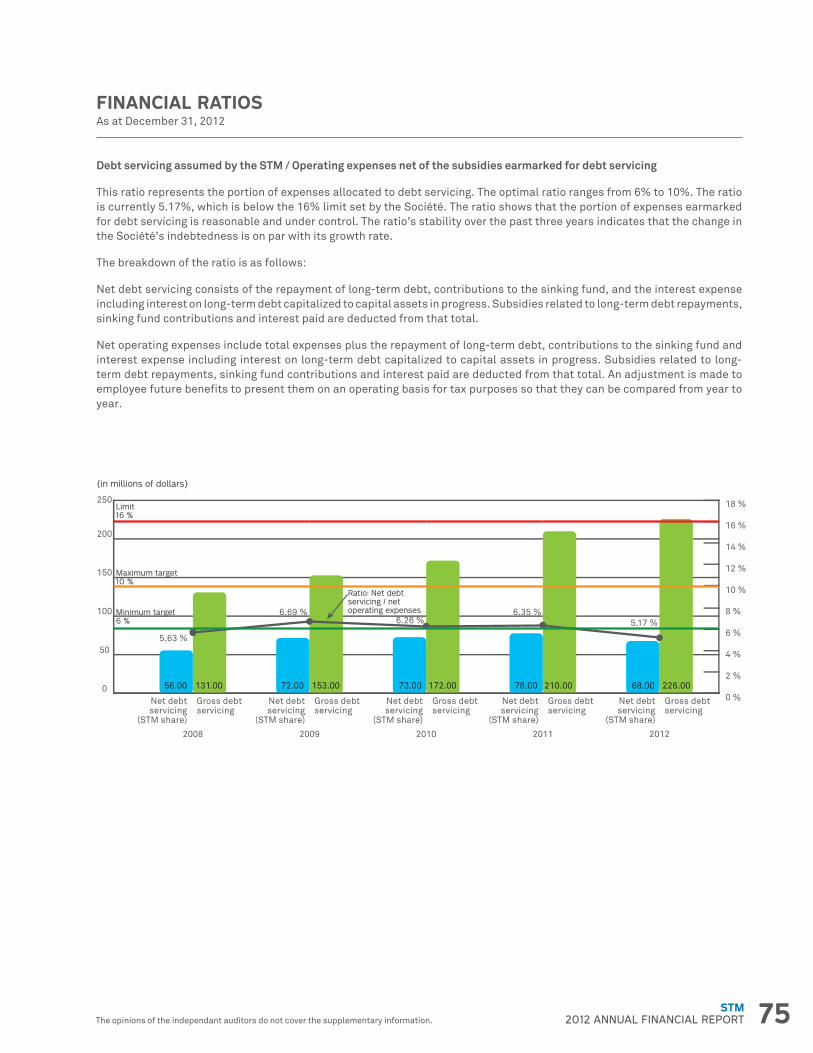
75STM2012 ANNUAL FINANCIAL REPORTThe opinions of the independant auditors do not cover the supplementary information.The opinions of the independant auditors do not cover the supplementary information.
FINANCIAL RATIOSAs at December 31, 2012
Debt servicing assumed by the STM / Operating expenses net of the subsidies earmarked for debt servicing
This ratio represents the portion of expenses allocated to debt servicing. The optimal ratio ranges from 6% to 10%. The ratio is currently 5.17%, which is below the 16% limit set by the Société. The ratio shows that the portion of expenses earmarked for debt servicing is reasonable and under control. The ratio’s stability over the past three years indicates that the change in the Société’s indebtedness is on par with its growth rate.
The breakdown of the ratio is as follows:
Net debt servicing consists of the repayment of long-term debt, contributions to the sinking fund, and the interest expense including interest on long-term debt capitalized to capital assets in progress. Subsidies related to long-term debt repayments, sinking fund contributions and interest paid are deducted from that total.
Net operating expenses include total expenses plus the repayment of long-term debt, contributions to the sinking fund and interest expense including interest on long-term debt capitalized to capital assets in progress. Subsidies related to long-term debt repayments, sinking fund contributions and interest paid are deducted from that total. An adjustment is made to employee future benefits to present them on an operating basis for tax purposes so that they can be compared from year to year.
0
50
100
150
200
250
20122011201020092008
(in millions of dollars)
0
2 %
4 %
6 %
8 %
10 %
12 %
14 %
16 %
18 %
Ratio: Net debt servicing / net operating expensesMinimum target
6 %
Maximum target10 %
Limit16 %
%Net debtservicing
(STM share)
Gross debt servicing
Net debtservicing
(STM share)
Gross debt servicing
Net debtservicing
(STM share)
Gross debt servicing
Net debtservicing
(STM share)
Gross debt servicing
Net debtservicing
(STM share)
Gross debt servicing
6.69 %
5.63 %
6.26 %6.35 %
5.17 %
56.00 131.00 72.00 153.00 73.00 172.00 78.00 210.00 68.00 226.00
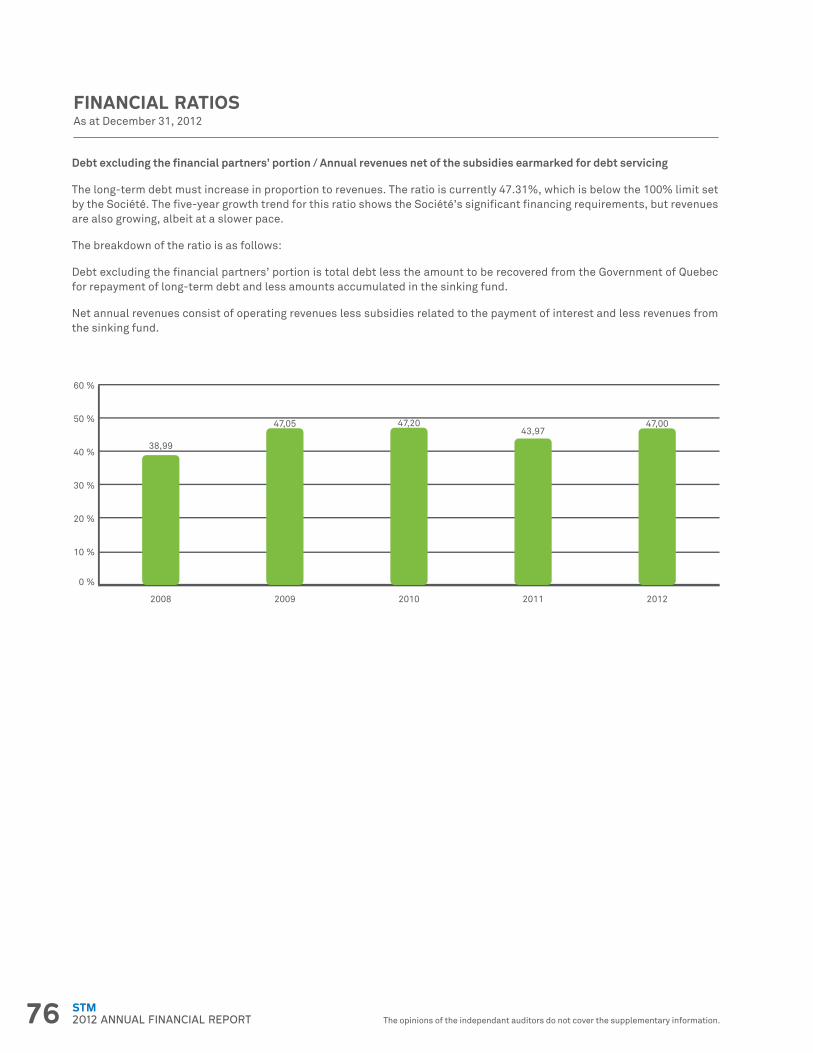
The opinions of the independant auditors do not cover the supplementary information.The opinions of the independant auditors do not cover the supplementary information.76 STM2012 ANNUAL FINANCIAL REPORT
FINANCIAL RATIOSAs at December 31, 2012
Debt excluding the financial partners’ portion / Annual revenues net of the subsidies earmarked for debt servicing
The long-term debt must increase in proportion to revenues. The ratio is currently 47.31%, which is below the 100% limit set by the Société. The five-year growth trend for this ratio shows the Société’s significant financing requirements, but revenues are also growing, albeit at a slower pace.
The breakdown of the ratio is as follows:
Debt excluding the financial partners’ portion is total debt less the amount to be recovered from the Government of Quebec for repayment of long-term debt and less amounts accumulated in the sinking fund.
Net annual revenues consist of operating revenues less subsidies related to the payment of interest and less revenues from the sinking fund.
0 %
10 %
20 %
30 %
40 %
50 %
60 %
2012
47,00
2011
43,97
2010
47,20
2009
47,05
2008
38,99
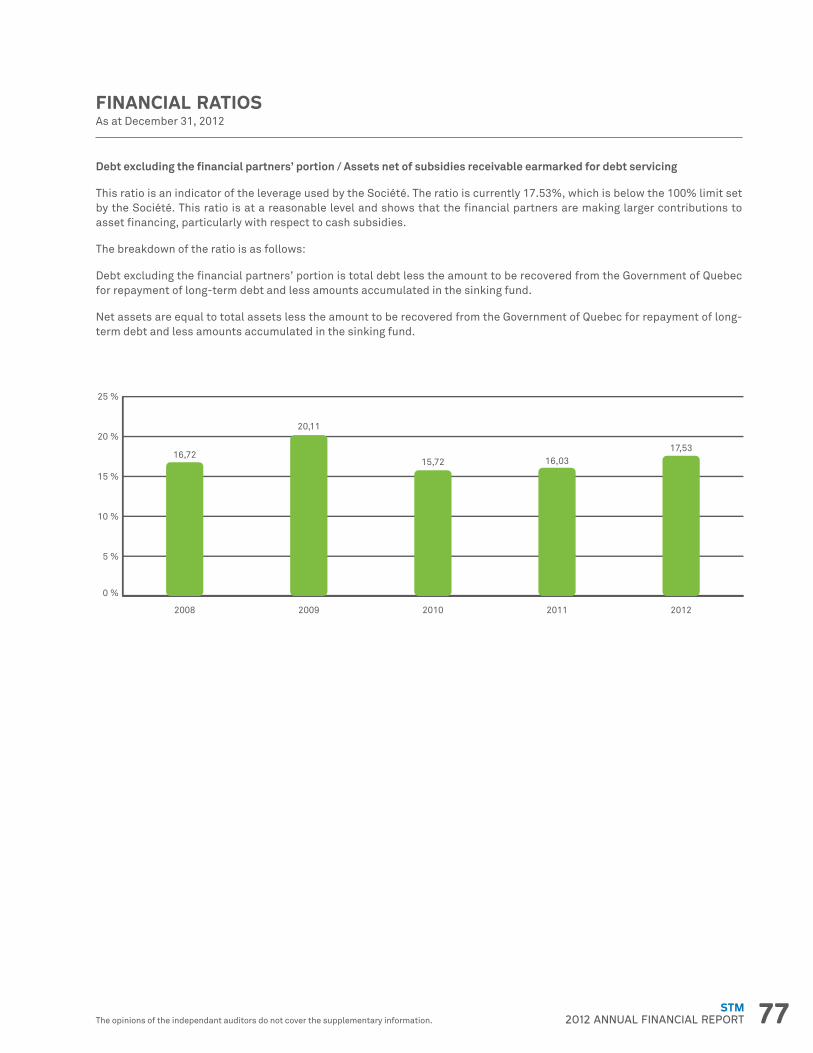
77STM2012 ANNUAL FINANCIAL REPORTThe opinions of the independant auditors do not cover the supplementary information.The opinions of the independant auditors do not cover the supplementary information.
FINANCIAL RATIOSAs at December 31, 2012
Debt excluding the financial partners’ portion / Assets net of subsidies receivable earmarked for debt servicing
This ratio is an indicator of the leverage used by the Société. The ratio is currently 17.53%, which is below the 100% limit set by the Société. This ratio is at a reasonable level and shows that the financial partners are making larger contributions to asset financing, particularly with respect to cash subsidies.
The breakdown of the ratio is as follows:
Debt excluding the financial partners’ portion is total debt less the amount to be recovered from the Government of Quebec for repayment of long-term debt and less amounts accumulated in the sinking fund.
Net assets are equal to total assets less the amount to be recovered from the Government of Quebec for repayment of long-term debt and less amounts accumulated in the sinking fund.
0 %
5 %
10 %
15 %
20 %
25 %
2012
17,53
2011
16,03
2010
15,72
2009
20,11
2008
16,72

PUBLISHED BY THE SOCIÉTÉ DE TRANSPORT DE MONTRÉAL
Executive Branch - Finance and Control Direction - Financial Management and Control 800 De La Gauchetière Street West Suite 9100 Montreal, Quebec H5A 1J6
Legal Deposit Bibliothèque nationale 1st quarter
Ce document est disponible en français.
stm.info You can also view the 2012 Sustainable Development Report, the 2012 Activities Report, as well as the 2012 Budget and the 2012-2014 Three-year Capital Expenditures Program in the Documentation Centre section of our website.