moulding - exco technologies limited · port huron, mi toledo, oh matamoros, mx (2) wylie, tx...
TRANSCRIPT

MOULDINGOUR FUTURE
Investor
Presentation
February 2018
EXCO TECHNOLOGIES LIMITED | 2
Information in this presentation relating to projected growth and financial performance of the Company’s business units, contribution ofour greenfield business units, margin performance and operating efficiencies are forward-looking statements.
Readers are cautioned not to place undue reliance on forward-looking statements made during this presentation referring to growth andfinancial performance of the Company’s business units, margin, operating improvement, capital expenditures and acquisitions becausethese plans, intentions or expectations are based on, among other things, assumptions about the number of automobiles produced inNorth America and Europe, the number of extrusion dies required in North America and South America, the rate of economic growth inNorth America and Europe and emerging markets, investment by OEMs in drivetrain and structural part architecture and other initiativesintended to reduce fuel consumption and/or the weight of automobiles, raw material prices, general economic conditions, capitalexpenditures and currency fluctuations. These forward-looking statements include known and unknown risks, uncertainties, assumptionsand other factors which may cause actual results or achievements to be materially different from those expressed or implied. For a moreextensive discussion of Exco’s risks and uncertainties see the ‘Risks and Uncertainties’ section in the latest Annual Report, AnnualInformation Form (“AIF”) and other reports and securities filings made by the Company. This information is available at www.sedar.comand www.excocorp.com.
While Exco believes that the expectations expressed by such forward-looking statements are reasonable, we cannot assure that they willbe correct. In evaluating forward-looking information and statements, readers should carefully consider the various factors which couldcause actual results or events to differ materially from those indicated in the forward-looking information and statements. Readers arecautioned that the foregoing list of important factors is not exhaustive. Furthermore, the Company will update its disclosure uponpublication of each fiscal quarter’s financial results and otherwise disclaims any obligations to update publicly or otherwise revise anysuch factors or any of the forward-looking information or statements contained herein to reflect subsequent information, events ordevelopments, changes in risk factors or otherwise.
Cautionary Statement

EXCO TECHNOLOGIES LIMITED | 3
Company Overview
Business Highlights
• Global provider of aluminum-focused tooling and interior trim components & solutions to the industrial and automotive markets
• Two principle business segments: Casting & Extrusion and Automotive Solutions
• Emission reduction requirements, vehicle light-weighting trends, market share gains, new product development and interior-trim focused acquisitions are key growth drivers
• Leading market positions; over 60 year history
• Global footprint; concentrated in low cost jurisdictions
• Decentralized divisions run as profit centers
• TSX listed (XTC); control block owns 23% of shares
53%
3%
11%
28%4%United States
Canada
Mexico
Europe
Other
Financial Highlights
• LTM Q1F18 revenue of C$566 million and EBITDA of C$77 million (14% margin)
• Latest 5-Yr Revenue & EBITDA CAGR of 19% & 14%
• Dividend has increased by well over 300% since F2010
• Consistently strong free cash flow
• Low pro-forma financial leverage and strong liquidity
F2017 Sales by Customer Location

EXCO TECHNOLOGIES LIMITED | 4
Principal Business Segments
Last Twelve Months Revenue and EBITDA1
Polytech
ALC
Polydesign
AFX
Neocon
Extrusion Technology
Casting Technology
Castool Group
33%Casting &Extrusion(C$185)
C$566 million in Revenue
C$31M Casting & Extrusion
(17% Margin)
(C$7 million)
C$77 million in EBITDA
Corporate Expense
67%Automotive
Solutions(C$381M)
C$53MAutomotive
Solutions(14% Margin)
1 To the end of Exco’s first fiscal quarter ended December 31st, 2017

EXCO TECHNOLOGIES LIMITED | 5
Global Presence
17 Manufacturing Locations in 8 Countries and 6,671 Employees
Dartmouth, NS
Uxbridge, ONNewmarket, ONMarkham, ONChesterfield, MI
Troy, MIPort Huron, MIToledo, OH
Wylie, TXMatamoros, MX (2)
Queretaro, MX
Medellin, Colombia
Sorocaba, Brazil
Tangier, Morocco
Chonburi,Thailand
Sofia, Bulgaria (3)
Landshut, Germany (sales center)
Automotive Solutions
Extrusion Technology
Casting Technology
Castool Group
Casting & Extrusion Technologies

EXCO TECHNOLOGIES LIMITED | 6
Automotive Solutions Segment

EXCO TECHNOLOGIES LIMITED | 7
Automotive Solutions Segment
• Largest supplier of flexible restraint and storage systems for autos in N.A. with majority share
• Content on popular models; sizeable SUV/CUV exposure
• Five businesses provide an expanding array of product offerings aimed at enhancing vehicle appeal
• Low-cost producer with facilities in Mexico, Morocco and Bulgaria
• Strategically located in Free Trade Zones near US, Eastern and Western European markets
• Recent Supplier Awards from Honda, Toyota, General Motors, Subaru, and Faurecia
Competitive Strengths
A leading innovator for interior trim and convenience solutions to the global auto market
Favorable Market Conditions
• Production volumes expected to continue near record levels
Source: IHS Automotive
10
12
14
16
18
20
22
2011 2012 2013 2014 2015 2016 2017 2018P
Light Vehicle Production (millions of units)
NAFTA Europe

EXCO TECHNOLOGIES LIMITED | 8
Business Manufacturing Location(s)
Facility Size Key Products/ Programs
Polytech Mexico 130,000 sq ft• Netting-based storage systems for trunks, seat backs and door panels, etc.• Netting-based restraint systems for passenger/ cargo separation• Plastic injected moulded consoles, gearshift boots and componentry
Polydesign Morocco 215,000 sq ft• Similar products as Polytech • Cutting and sewing of leather for instrument panels, door panels, consoles,
steering wheels, sun visor assembly and wrapping
Neocon Canada 77,000 sq ft• Thermoformed products• Cargo organizer systems• Flooring and protective systems including bumper covers
Bulgaria 250,000 sq ft
• Tier 2 supplier of leather seat covers for most Mini programs• Audi seat cover contract in Europe ramping up through F2017• Leveraging customer relationships of Polydesign
Mexico 91,000 sq ft
• Tier 2 supplier of interior trim components to diversified N.A customers• Die cut leather sets for seating and most other interior trim applications• Leather wrapped, machine and hand sewn automotive interior parts include
steering wheels, shift knobs & boots, brake handles, armrests
Automotive Solutions Segment
Five businesses provide an expanding array of product offerings

EXCO TECHNOLOGIES LIMITED | 9
$5.49 $6.54 $8.60 $9.25 $10.41
$4.19
$7.16 $7.42 $4.81
$3.76 $6.03
$-
$5
$10
$15
$20
$25
2013 2014 2015 2016 2017
Content Per Vehicle
Polytech, Neocon, Polydesign ALC AFX
$20.44
Automotive Solutions Revenue Drivers
Fiscal year ended September 30Aggregate of revenue for Polytech, Neocon and Polydesign divided by region vehicle production (N.A. for Polytech and Neocon; Europe for Polydesign)ALC acquired March 2014; AFX acquired April 2016 (Vehicle production volume is N.A. for AFX; Europe for ALC)
Growing content per vehicle with essentially endless potential
40% Total CAGR
$5.49
$10.72
$15.76
$21.24
17% Organic CAGR

EXCO TECHNOLOGIES LIMITED | 10
Casting & Extrusion Segment

EXCO TECHNOLOGIES LIMITED | 11
• Largest independent manufacturer of die-cast moulds in North America; estimated 20% share
• Three locations: Ontario, Ohio and Mexico with combined facilities totalling 200,000 square feet
• Industry leading design and engineering
• Capable of producing moulds up to 75 tons
• 3,500 ton die-casting machine and foundry to test products. Furnaces deliver standard aluminum alloy, structural aluminum alloy & magnesium
• $10 million capital program to increase capacity & reduce delivery times; equipment now operational
• Additive printing capability enhances mould design
Casting Technology
Aluminum-focused tooling for automotive powertrain and structural components
Competitive Strengths

EXCO TECHNOLOGIES LIMITED | 12
2012 2013 2014 2015 20163,500
4,000
4,500
5,000
5,500
6,000
Mill
ion
s o
f Po
un
ds
Extrusion Technology
Largest designer and manufacturer of dies for aluminum extrusions in the Americas
Competitive Strengths
• Estimated market share of 30% in North America
• Flagship locations in Ontario and Michigan
• Recent expansions into Brazil, Colombia and Texas
• Customer consolidation and competitor shake-out benefiting well-capitalized players such as Exco
• Upgraded machinery and commonality of design and manufacturing process across plants
31%
37%
10%
10%
10%
2%Transportation/ Auto
Building & Construction
Consumer Durables
Electrical
Machinery & Equipment
Other
N.A. Producer Shipments of Extrusions1
Extruded Products by End Market1
1 The Aluminum Association, Exco

EXCO TECHNOLOGIES LIMITED | 13
Castool Group
Die-Cast Shot Sleeves
Extrusion Container Plunger Tips
Dummy Blocks
Pressure Ring
Equipment, accessories and tooling for aluminum die-cast machines and extrusion presses
• Proprietary consumable tooling components and systems designed to increase equipment efficiency through improved uptime and yields
• State of the art 76,000 sq ft facility in Ontario
• Thailand facility (30,000 sq ft) opened June 2014 to serve the Asian and European markets
Competitive Strengths
Robot Cell

EXCO TECHNOLOGIES LIMITED | 14
Casting & Extrusion Segment
Focus on vehicle light-weighting provides significant ongoing growth opportunity
• Ever more stringent fuel efficiency and emission reduction standards are driving the development of increasingly advanced engines and transmissions by OEM and tier 1 suppliers
• Better fuel economy and lower emissions are also driving transition from steel to aluminum alloys in the production of non-powertrain structural components
19
25
35
42
Net Pounds Per Vehicle of Aluminum Extruded Products
Source: Ducker worldwide
20
25
30
35
40
45
50
55
60
2000 2005 2010 2015 2020 2025
Light Vehicle Miles Per Gallon, Normalized to CAFE
2012 2015 2020 2025
Source: NHTSA and EPA*2025 mpg target currently under review
US 202554.5 mpg*
Dashed line representsfuture requirements
US 201635.5 mpg

EXCO TECHNOLOGIES LIMITED | 15
Financial Results
EXCO TECHNOLOGIES LIMITED | 16
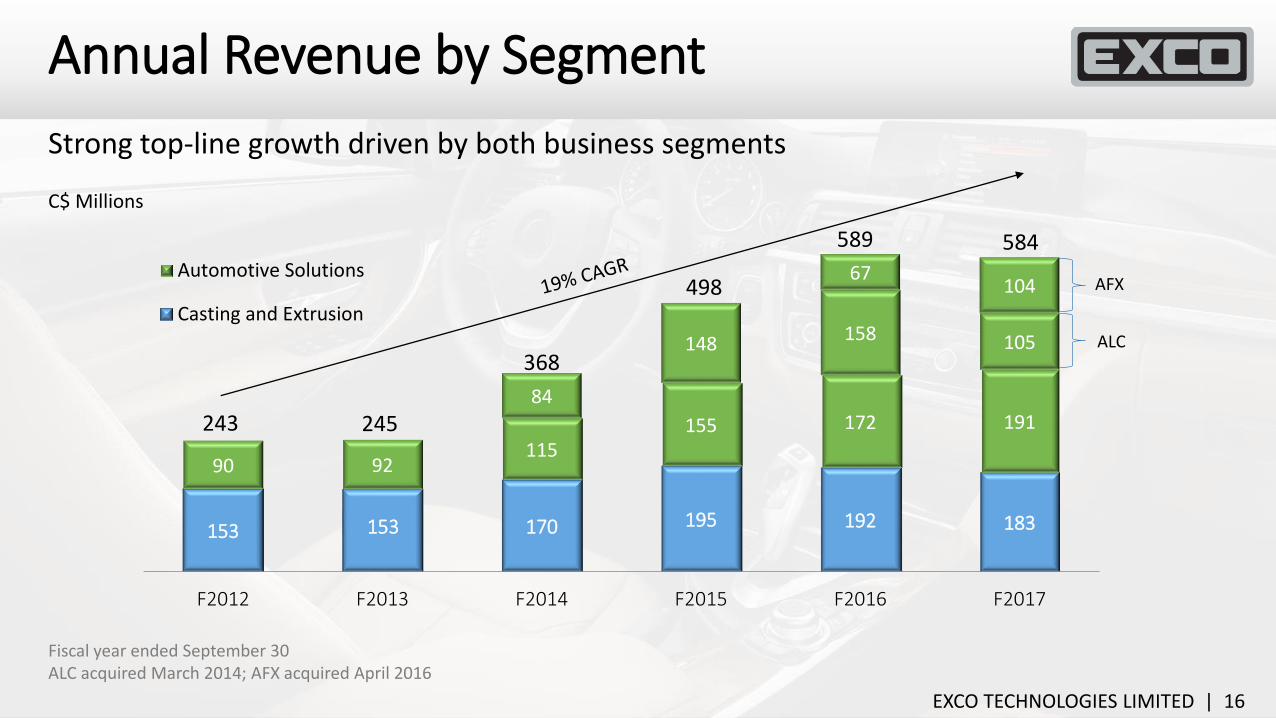
153 153 170 195 192 183
90 92115
155 172 19184
148 158 105
67104
F2012 F2013 F2014 F2015 F2016 F2017
Automotive Solutions
Casting and Extrusion498
589
368
245243
584
ALC
AFX
Annual Revenue by Segment
Strong top-line growth driven by both business segments
Fiscal year ended September 30ALC acquired March 2014; AFX acquired April 2016
C$ Millions

EXCO TECHNOLOGIES LIMITED | 17
Quarterly Revenue by Segment
Lower Automotive Solutions revenue reflects curtailment of ALC’s unprofitable operations and return of seasonality to North American auto production
Fiscal year ended September 30
C$ Millions
45 47 47 44 47
99
146
87
Q1 F17 Q2 F17 Q3 F17 Q4 F17 Q1 F18
AFXALCPolytech, Polydesign, NeoconCasting and Extrusion
108 106
153 154
131
Automotive Solutions
88
135

EXCO TECHNOLOGIES LIMITED | 18
29 29 3443 37 31
17 19
27
41 5459
-4 -5 -7 -7 -7 -6F2012 F2013 F2014 F2015 F2016 F2017
Corporate Expense
Automotive Solutions
Casting and Extrusion
C$ Millions
Annual EBITDA by Segment
EBITDA improvement generally in line with sales growth over time
Fiscal year ended September 30
43
54
77
43
8383

EXCO TECHNOLOGIES LIMITED | 19
Quarterly EBITDA by Segment
Fiscal year ended September 30
C$ Millions
8 9 8 6 8
16 1715
1111
Q1 F17 Q2 F17 Q3 F17 Q4 F17 Q1 F18
Corporate
Automotive Solutions
Casting and Extrusion23
2320
16
Casting and Extrusion EBITDA has started to recover
17
EXCO TECHNOLOGIES LIMITED | 20
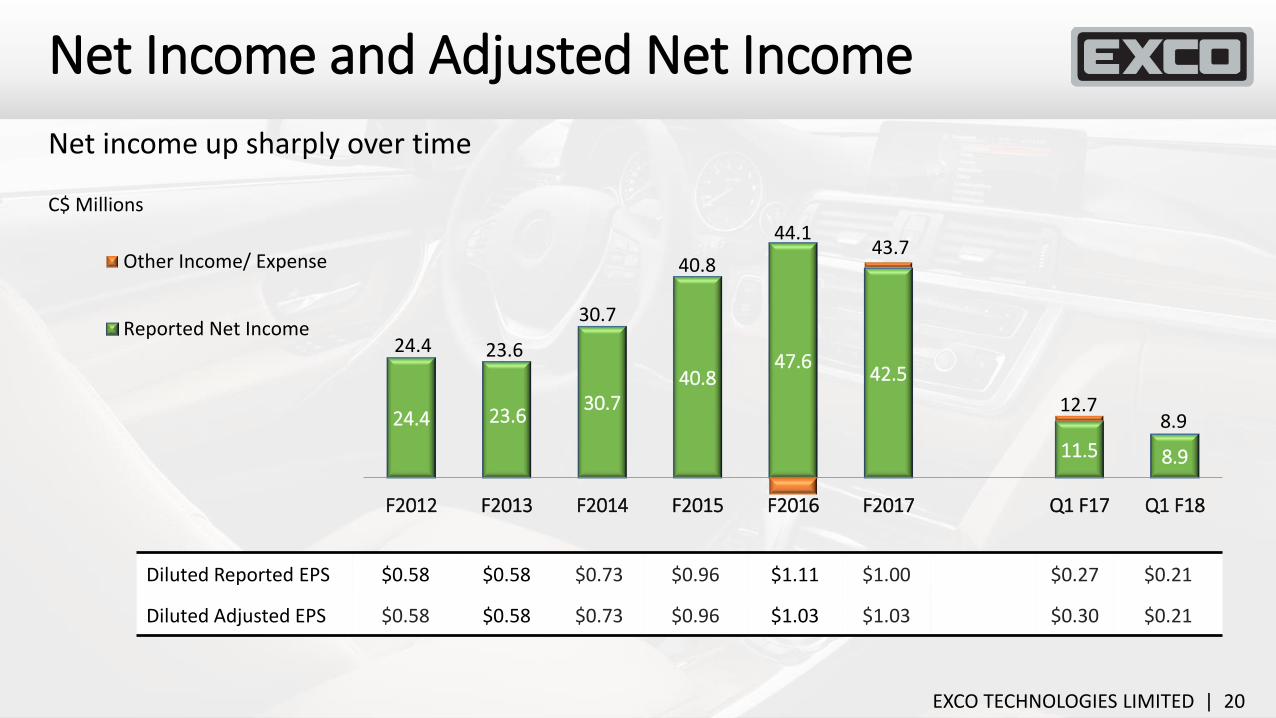
Net Income and Adjusted Net Income
C$ Millions
Net income up sharply over time
24.4 23.630.7
40.847.6
42.5
11.5 8.9
F2012 F2013 F2014 F2015 F2016 F2017 Q1 F17 Q1 F18
Other Income/ Expense
Reported Net Income24.4 23.6
30.7
40.8
Diluted Reported EPS $0.58 $0.58 $0.73 $0.96 $1.11 $1.00 $0.27 $0.21
Diluted Adjusted EPS $0.58 $0.58 $0.73 $0.96 $1.03 $1.03 $0.30 $0.21
44.143.7
12.78.9

EXCO TECHNOLOGIES LIMITED | 21
Dividend
* Dividend increased by 6% to an annualized rate of 34 cents/ share January 2018
CAD Cents/ Share
10.513.5
17.319.5
23.027.0
31.033.5*
F2011 F2012 F2013 F2014 F2015 F2016 F2017 F2018
Strong dividend growth and manageable payout rate
Adj Net Income 32% 22% 30% 27% 24% 26% 30%
FFO^ 18% 17% 22% 19% 16% 17% 20%
EBITDA 14% 15% 16% 15% 13% 14% 16%
% of:
^Cash Flow from Operations before changes in working capital

EXCO TECHNOLOGIES LIMITED | 22
Cash Flow Generation
Continuing strong EBITDA to free cash flow conversion
C$
Mill
ion
s
Fiscal year ended September 30
83 (100%) 18 (22%)
1 (1%) 16 (19%)
49 (59%)
EBITDA Interest/ Taxes/OtherOpex
Working Capital Capex (Net ofDisposals)
Free Cash Flow
F2017

EXCO TECHNOLOGIES LIMITED | 23
Capital Expenditures
C$ Millions
Capex remains relatively stable despite Exco’s strong growth
1 1 2 25
1113 11 10
21
11
188 12
8
0
5
10
15
20
25
30
F2013 F2014 F2015 F2016 F2017 F2018E
Automotive Solutions C&E Maintenance/ Growth C&E Greenfield
22
25
20
23
16
Includes $5 million for
purchase of AFX’s real estate
29
EXCO TECHNOLOGIES LIMITED | 24
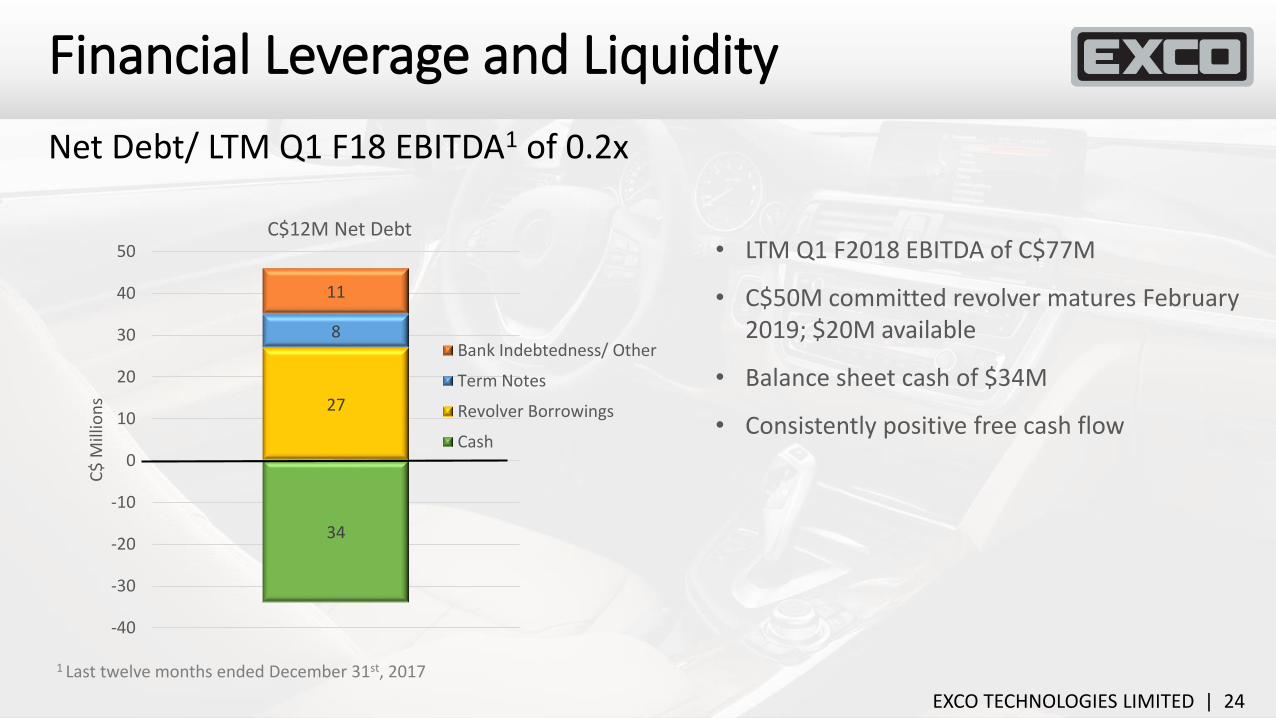
Financial Leverage and Liquidity
Net Debt/ LTM Q1 F18 EBITDA1 of 0.2x
34
27
8
11
-40
-30
-20
-10
0
10
20
30
40
50
C$
Mill
ion
s
C$12M Net Debt
Bank Indebtedness/ Other
Term Notes
Revolver Borrowings
Cash
• LTM Q1 F2018 EBITDA of C$77M
• C$50M committed revolver matures February 2019; $20M available
• Balance sheet cash of $34M
• Consistently positive free cash flow
1 Last twelve months ended December 31st, 2017

EXCO TECHNOLOGIES LIMITED | 25
1.30
1.40
1.50
1.60
65%
27%
5%3%
USD EUR CAD Other
Annual Foreign Exchange Sensitivity
Approximate RevenueExposure by Currency
USD/CAD EUR/CAD
Estimated Impact of a $0.01 FX Change on F2018 Annual Consolidated Sales and Net Profit
1.24
1.32
Δ$0.01
1.41
1.46
Average exchange rate for F15, F16 and F17
~C$2.7M Sales ~C$1.0M
~C$0.5M Net Profit Minimal
1.31 1.46
1.10
1.20
1.30
1.40
1.50

EXCO TECHNOLOGIES LIMITED | 26
Questions

EXCO TECHNOLOGIES LIMITED | 27