application of an optimization-based curtailment service
TRANSCRIPT
RESEARCH Open Access
Application of an optimization-basedcurtailment service provider in real-timesimulationOmid Abrishambaf, Pedro Faria and Zita Vale*
* Correspondence: [email protected] – Research Group onIntelligent Engineering andComputing for AdvancedInnovation and Development,Institute of Engineering –Polytechnic of Porto (ISEP/IPP), RuaDr. António Bernardino de Almeida,431, 4200-072 Porto, Portugal
Abstract
The use of demand response programs and distributed renewable energy resourcesare intensively discussed. These concepts play a key role in the distribution network,especially smart grids and microgrids. Nowadays, most of the implemented demandresponse programs are considered for large-scale resources, which make small andmedium resources unable to participate in electricity market negotiations. In order toovercome this barrier, a third-party entity, namely an aggregator, can be consideredas an intermediate player between the demand side and grid side. For this purpose,curtailment service provider is considered as an aggregator, which aggregates smalland medium-scale resources, who do not have adequate capacity of reduction orgeneration and allow them to participate in wholesale electricity markets as a uniqueresource. However, before massive implementation of business models, the performanceof the curtailment service provider should be adequately surveyed and validated inorder to prevent future problems. This paper proposes a real-time simulation model of acurtailment service provider, which employs several real and laboratory hardwareequipment considered as hardware-in-the-loop in the real-time simulator. Furthermore,an optimization problem is developed for a curtailment service provider in order tooptimally schedule the available resources including several demand response programsand distributed renewable resources, aiming at minimizing its operation costs. Theimplemented case study considers a distribution network with 20 consumers andprosumers, and 26 renewable-based producers including wind and photovoltaicgeneration, where the developed model is performed in real-time for 12 min andbehaviors of small and medium prosumers and producers is surveyed.
Keywords: Demand response, Curtailment service provider, Real-time simulation,Hardware-in-the-loop, Optimization
BackgroundThe daily increment of electrical energy usage impels the network operator to provide
efficient solutions regarding energy resources. Demand Response (DR) programs and
Distributed Generation (DG) are two major concepts, which play a key role in this
context (Aghaei and Alizadeh 2013). DR programs can be defined as the modification
of the consumption in demand side, according to the price variations or financial in-
centive paid by DR managing entity to the consumers (Hurtado et al. 2018). In fact, by
promoting DR programs, all the players can benefit. The demand side will be
Energy Informatics
© The Author(s). 2018 Open Access This article is distributed under the terms of the Creative Commons Attribution 4.0 InternationalLicense (http://creativecommons.org/licenses/by/4.0/), which permits unrestricted use, distribution, and reproduction in any medium,provided you give appropriate credit to the original author(s) and the source, provide a link to the Creative Commons license, andindicate if changes were made.
Abrishambaf et al. Energy Informatics (2018) 1:3 https://doi.org/10.1186/s42162-018-0006-6
encouraged to utilize DR programs for reducing their electricity bills, and the grid side
will benefit from that by reducing congestion of the grid and lowering the consumption
in the peak periods (Falvo et al. 2014). DR programs are categorized into two main
groups (Mortaji et al. 2017; Shariatzadeh et al. 2015):
� Price-based: in which the end-users modify their consumption based on the electri-
city price variations. Real-Time Pricing (RTP) is an example of this group;
� Incentive-based: in which the grid operator pays a remuneration to the end-users in
exchange for modifying their consumption pattern. Direct Load Control (DLC) is
an example of this group.
If the use of DR programs is merged with Distributed Renewable Energy Resources
(DRERs), the grid operator would be able to fully benefit from these concepts and par-
ticipate in market negotiations (Wang et al. 2015). However, both DR and DRERs
should have enough capacity of reduction and generation in order to participate in the
market negotiations. Based on several surveyed references (Bakr and Cranefield 2015;
Khezeli et al. 2017; Paterakis et al. 2017), the minimum reduction capacity of customers
for participating in DR programs in several electricity markets is 100 kW. This means
that in such markets it is not possible for small and medium consumers, such as typical
residential customers, to contribute to market negotiation individually (Gkatzikis et al.
2013). In order to overcome this barrier, a third party entity can be considered as a
solution in order to aggregate small and medium scale resources and represent them as
a unique resource in the energy market negotiations with adequate capacity (Siano
2017; Reddy 2016). Curtailment Service Provider (CSP) is a concept that can be consid-
ered as a third party in the electrical network operation (Hillman 2011; Faria and Vale
2013). However, before the implementation of business models, it is required to test
and validate the model concepts in reliable and physical simulation platforms, which
are capable to provide actual measurement and control in order to identify future prob-
lems (Mao et al. 2018). For this purpose, the use of fully computational resources to
simulate an electrical distribution network can be very difficult and unaffordable, and
perhaps the produced results will be far from the reality (Olivares et al. 2014). There-
fore, a real-time simulation strategy would be a satisfying solution for integrating both
reality and simulation results (Alvarez-Gonzalez et al. 2017).
There are few research works concerning the real-time simulation of a CSP model;
this was a motivation for the present work. This paper provides a real-time simulation
model for a CSP by using several real and laboratory hardware equipment considered
as Hardware-In-the-Loop (HIL). The CSP aggregated resources include consumers,
producers, and prosumers who do not have adequate capacity of generation and DR
reduction in order to participate in the wholesale market negotiation, therefore, they
establish a contract with CSP in order to be aggregated and managed by this third
party. Moreover, an optimization problem is developed in this paper in order to be used
by CSP for optimal resources scheduling, which aims at minimizing its operation costs.
The HIL equipment employed for CSP resources contain two small and medium scale
laboratory loads, laboratory wind turbine and Photovoltaic (PV) emulators, and a real
PV producer, which are controlled and managed by a real-time simulation machine
(OP5600) through MATLAB/Simulink environment. In this way, the main purpose of
Abrishambaf et al. Energy Informatics (2018) 1:3 Page 2 of 17
the paper is to demonstrate that the hybrid simulation platform is also capable to im-
plement optimal scheduling results and DR programs.
The rest of paper is organized as follows: Section 2 presents the related works and
clarifies the main contribution of this paper. Section 3 explains the presented CSP
model including all DR programs and mathematical formulation regarding the
optimization problem. Section 4 presents the real-time simulation model considered
for the CSP, where all HIL infrastructures and MATLAB/Simulink models imple-
mented in the OP5600 are denoted. Section 5 discusses a case study implemented using
the presented model in order to test and validate the system capabilities, and its results
are presented in Section 6. Finally, the main conclusions of the work are presented in
section 7.
Related worksThere are several research works related to this topic. In (Bottaccioli et al. 2017a) the
authors presented a hybrid simulation platform, including a PV simulator and a
real-time network simulation model. The PV simulator models the real PV systems and
calculates the energy generation based on the input data such as the solar radiation.
For the network model, it has been used the OP5600 real-time simulator, in order to
verify the PV model in the real conditions, such as real electricity network configura-
tions. It has been presented a case study for testing the platform on the actual electri-
city network conditions in Turin, Italy, and the results demonstrated that the current
configuration of the network cannot handle the integration of a significant number of
PV installation, therefore, an improvement is necessary for preventing future problems.
Although the authors in (Bottaccioli et al. 2017a) used OP5600 for a hybrid platform,
they did not focus on the aggregation level and optimal resource scheduling, and also,
there was not real or laboratory consumer loads in order to emulate the consumption
profile in real-time.
In (Bottaccioli et al. 2017b), a novel and flexible platform has been developed in
real-time simulator OP5600. In this work, the authors integrated load simulation and
physical devices by employing an Internet of Things (IoT) adaptor. The proposed simu-
lation platform contains PV and storage integration; it can be used for testing and val-
idating the smart grids concepts. They also presented a case study that utilizes the
developed platform in the real conditions of the network in northern Italy, and they
confirmed the performance of the system. However, in this work, the authors did not
include any optimization algorithm integrated with OP5600 regarding the aggregator
concepts.
Reference (Marulanda et al. 2014) utilized a realistic methodology by considering
CSP as a load aggregator in order to evaluate the impact of DR programs in the
day-ahead Colombian electricity market. They considered that CSP can bid in the
wholesale market by using the demand-bidding program. They also presented a tool for
the market operator in order to quantify the impact of DR programs on the system.
Realistic values from Colombian market have been used in order to perform numerical
tests. The numerical results shown that the penetration of demand-bidding program
changes the dispatch for different generation units. Although they utilized real input
data for the model, the final results are totally numerical without any experimental test
and validation.
Abrishambaf et al. Energy Informatics (2018) 1:3 Page 3 of 17
Reference (Rotger-Griful et al. 2016) introduced a co-simulation platform, called
virtual integration laboratory (VirGIL) with HIL devices in order to evaluate DR pro-
grams in a residential building located in Denmark. This platform is able to control the
ventilation system of the building, as well as to integrate power system simulation,
communication, and control. In the case study, the authors surveyed the impacts of a
DR program defined by the CSP on the controlling of the ventilation system in the
building using VirGIL. The results demonstrated the capabilities of the developed
model, in which the ventilation systems can track the changes with 1-min time interval
in order to perform the decisions at the certain time. However, they focused on a
particular consumer on the CSP network, and they do not describe how the CSP per-
form the optimization and the day-ahead scheduling of the resources in order to define
DR programs.
In (Li et al. 2017), the authors presented a real-time operation scheme for thermo-
statically controlled loads aggregation in electricity markets, which is considered as
biding resource contributing in the day-ahead market negotiations. Moreover, they
utilized an optimization model in order to maximize the profit of the aggregator in the
regulation market. They performed several experimental tests with the proposed load
aggregation simulator as a load shedding service provider, which validated the system.
Although, they provided only the numerical results, and they did not use any real-time
simulator or any HIL equipment in order to validate their system with actual measure-
ments and control for gaining realistic results.
The main focus of the present paper is to implement a real-time simulation platform
for an optimization-based CSP model considering several real and laboratory HIL infra-
structures, which are controlled based on the optimal resource scheduling of a CSP
and DR programs implementation. The HIL equipment enables the system to validate
the developed methodology by using real data and enables actual measurements and
control of hardware devices that are outside the simulation environment. The scientific
contribution of this paper is to address an optimization based CSP model to the small
and medium scale consumers and producers by employing a hybrid simulation plat-
form, including real systems, laboratory emulators, and mathematical models.
CSP modelThis section concerns the presented CSP model applying DR programs to its con-
sumers, and the optimization formulations utilized by the CSP in order to optimally
schedule the consumption and generation resources.
Model description
As it was mentioned before, in order to implement a DR program in a network, there
is a minimum capacity for load reduction, which should be reached by the customers
in order to be able to participate in the DR event. In this context, if a consumer has
enough capacity of reduction, He can directly establish a contract with the system oper-
ator or DR managing entity. However, for small and medium consumers, who do not
have adequate capacity of reduction, a third party entity (CSP in this paper) should
aggregate these consumers, and allow them to participate in DR event as one. This
means that the small and medium consumers can establish a DR contract with a CSP
Abrishambaf et al. Energy Informatics (2018) 1:3 Page 4 of 17
in order to be able to utilize DR programs, and participate in the wholesale market
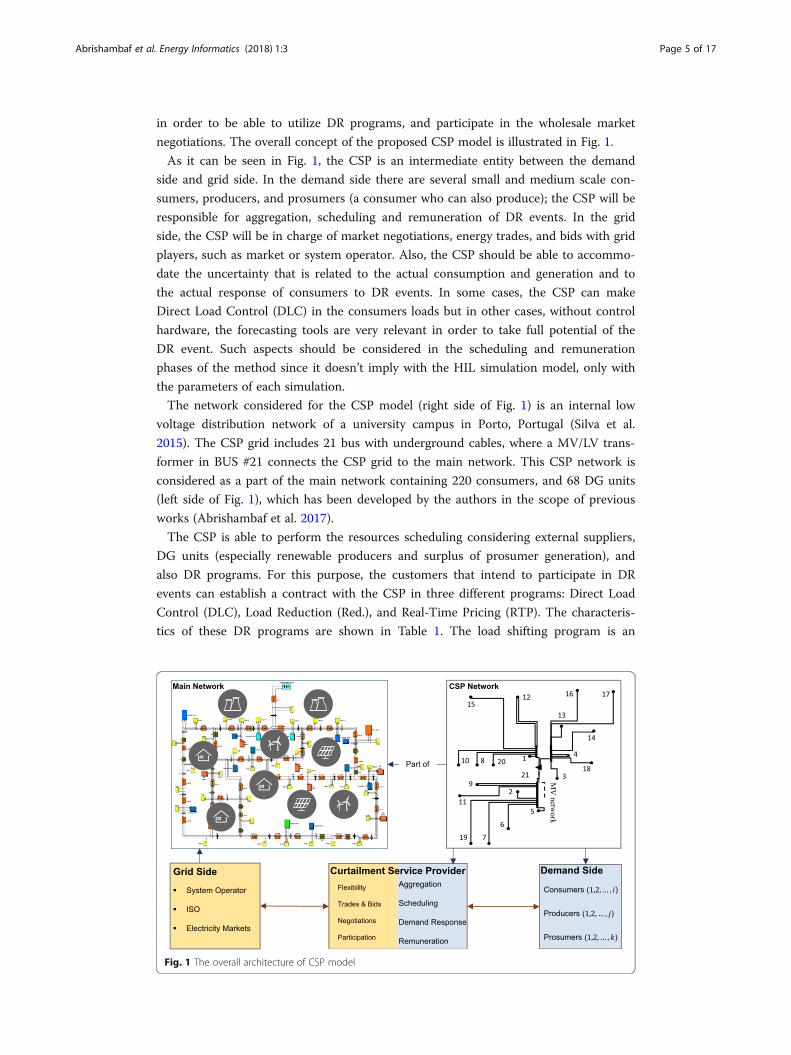
negotiations. The overall concept of the proposed CSP model is illustrated in Fig. 1.
As it can be seen in Fig. 1, the CSP is an intermediate entity between the demand
side and grid side. In the demand side there are several small and medium scale con-
sumers, producers, and prosumers (a consumer who can also produce); the CSP will be
responsible for aggregation, scheduling and remuneration of DR events. In the grid
side, the CSP will be in charge of market negotiations, energy trades, and bids with grid
players, such as market or system operator. Also, the CSP should be able to accommo-
date the uncertainty that is related to the actual consumption and generation and to
the actual response of consumers to DR events. In some cases, the CSP can make
Direct Load Control (DLC) in the consumers loads but in other cases, without control
hardware, the forecasting tools are very relevant in order to take full potential of the
DR event. Such aspects should be considered in the scheduling and remuneration
phases of the method since it doesn’t imply with the HIL simulation model, only with
the parameters of each simulation.
The network considered for the CSP model (right side of Fig. 1) is an internal low
voltage distribution network of a university campus in Porto, Portugal (Silva et al.
2015). The CSP grid includes 21 bus with underground cables, where a MV/LV trans-
former in BUS #21 connects the CSP grid to the main network. This CSP network is
considered as a part of the main network containing 220 consumers, and 68 DG units
(left side of Fig. 1), which has been developed by the authors in the scope of previous
works (Abrishambaf et al. 2017).
The CSP is able to perform the resources scheduling considering external suppliers,
DG units (especially renewable producers and surplus of prosumer generation), and
also DR programs. For this purpose, the customers that intend to participate in DR
events can establish a contract with the CSP in three different programs: Direct Load
Control (DLC), Load Reduction (Red.), and Real-Time Pricing (RTP). The characteris-
tics of these DR programs are shown in Table 1. The load shifting program is an
Fig. 1 The overall architecture of CSP model
Abrishambaf et al. Energy Informatics (2018) 1:3 Page 5 of 17
important tool for the CSP since it can manage the consumption and shift it based
on the available rate of generation. A load shifting model has been developed by
the authors in the scope of their previous work (Faria et al. 2015), and since the
purpose is to show that the developed model can also implement DR programs,
three different programs have been presented in this paper and load shifting is not
considered.
If a customer establishes a contract with the CSP for DLC, He will give permis-
sion to the CSP to directly control the devices whenever it witnesses with critical
periods, for instance, while He faces a technical or economic reason. For this pur-
pose, the customer will be notified about the event, and receive remuneration
based on the actual kWh reduction. If a customer makes a contract with CSP for
Red. program, while the CSP decides to apply DR event, the customer will be noti-
fied for consumption reduction, and if it is accepted, he receives remuneration
based on kWh reduction. Finally, if a customer has a RTP contract, it specifies a
value of electricity price somehow that if the electricity price raises and is greater
than that specific value, He will decrease the consumption as much as it is speci-
fied in the contract. This means that the customer will be notified about the
real-time electricity price, and if He agrees to participate, He will reduce the con-
sumption. In the RTP program, the customer will not earn remuneration for the
consumption reduction, which means RTP program has no cost from CSP
standpoint.
In total, the CSP can perform resource scheduling and aggregation processes consid-
ering DG units, external suppliers, and DR resources. In this context, the CSP should
utilize an optimization problem in order to optimally manage the resources, which will
be demonstrated in the next sub-section.
Optimization problem
The CSP always tends to supply the demand using the local resources. Renewable
resources are the first ones that CSP utilizes for scheduling since these have a
lower price from the CSP standpoint. After that, DR resources, especially RTP
program, are the next options for CSP scheduling, and external suppliers would
be the last choices for the CSP since it is considered as the most expensive re-
sources from the CSP standpoint. Therefore, an optimization problem is required
for the CSP in order to provide an optimal resource scheduling. However, as pre-
viously stated, the optimization problem is not a core contribution of the paper
since the main focus of the paper relies on demonstrating that the hybrid simula-
tion platform is also capable to implement optimal scheduling results and DR
programs.
The objective function presented for CSP to minimize his Operation Cost (OC) is
shown by Eq. (1). In this model, it is considered that technical verification of network is
Table 1 DR Programs proposed by the CSP to customers
DR Type Mandatory/Voluntary Remuneration Activation/Signal Measure/Contract
DLC Mandatory Cost/kWh reduced DLC per equipment Actual kWh reduction
Red. Voluntary Cost/kWh reduced Reduction notification Actual kWh reduction
RTP Voluntary N/A Electricity price notification N/A
Abrishambaf et al. Energy Informatics (2018) 1:3 Page 6 of 17
the responsibility of the network operator, and the CSP is not accountable for such
matters.
Minimize
OC ¼XI
i¼1
XS
s¼1
PExt s;ið Þ � CExt s;ið Þ� �þ
XCs
c¼1
�PDG c;ið Þ � CDG c;ið Þ þ PDLC c;ið Þ � CDLC c;ið Þ
þPRed c;ið Þ � CRed c;ið Þ þ PRTP c;ið Þ � CRTP c;ið Þ�! ð1Þ
There are several constraints considered for this optimization problem. The first con-
straint stands for load balance, as shown in Eq. (2). The second constraint, in eq. (3),
concerns DG units and prosumers, where indicates if the customer is a prosumer, its
DG generation supplies the local demand first, and then, if there is any generation sur-
plus, it will be injected to the CSP network.
XS
s¼1
PExt s;ið Þ þXCs
c¼1
PDG c;ið Þ þ PDLC c;ið Þ þ PRed c;ið Þ þ PRTP c;ið Þ� �
¼ PLoad ið Þ∀i∈ 1;…; If g ð2Þ
PDG c;ið Þ ¼ PDG c;ið Þ−PCons c;ið Þ PDG c;ið Þ > PCons c;ið Þ0 PDG c;ið Þ≤PCons c;ið Þ
�∀c∈ 1;…;Csf g; ∀i∈ 1;…; If g
ð3Þ
Additionally, the technical limitation of each resource should be considered in the
optimization problem. For this purpose, eq. (4) and eq. (5) demonstrate the limitation
regarding external suppliers and DG units, respectively.
0≤PExt s;ið Þ≤PmaxExt s;ið Þ ∀s∈ 1;…; Sf g; ∀i∈ 1;…; If g ð4Þ
0≤PDG c;ið Þ≤PmaxDG c;ið Þ ∀c∈ 1;…;Csf g; ∀i∈ 1;…; If g ð5Þ
The technical limitation regarding DR programs, including DLC, Red., and RTP pro-
grams, is shown by eq.(6–8), respectively.
0≤PDLC c;ið Þ≤PmaxDLC c;ið Þ ∀c∈ 1;…;Csf g; ∀i∈ 1;…; If g ð6Þ
0≤PRed c;ið Þ≤PmaxRed c;ið Þ ∀c∈ 1;…;Csf g; ∀i∈ 1;…; If g ð7Þ
0≤PRTP c;ið Þ≤PmaxRTP c;ið Þ ∀c∈ 1;…;Csf g; ∀i∈ 1;…; If g ð8Þ
In sum, the mathematical formulation of the CSP model for resource scheduling with
the objective of minimizing the operation costs, are shown in this section. In the next
section, this formulation will be implemented in the real-time simulation model consid-
ered for the CSP.
Real-time simulationIn this section, the real-time simulation model considered for the CSP is presented.
Several real and laboratory hardware equipment is employed in order to simulate the
model in real-time considering the HIL methodology.
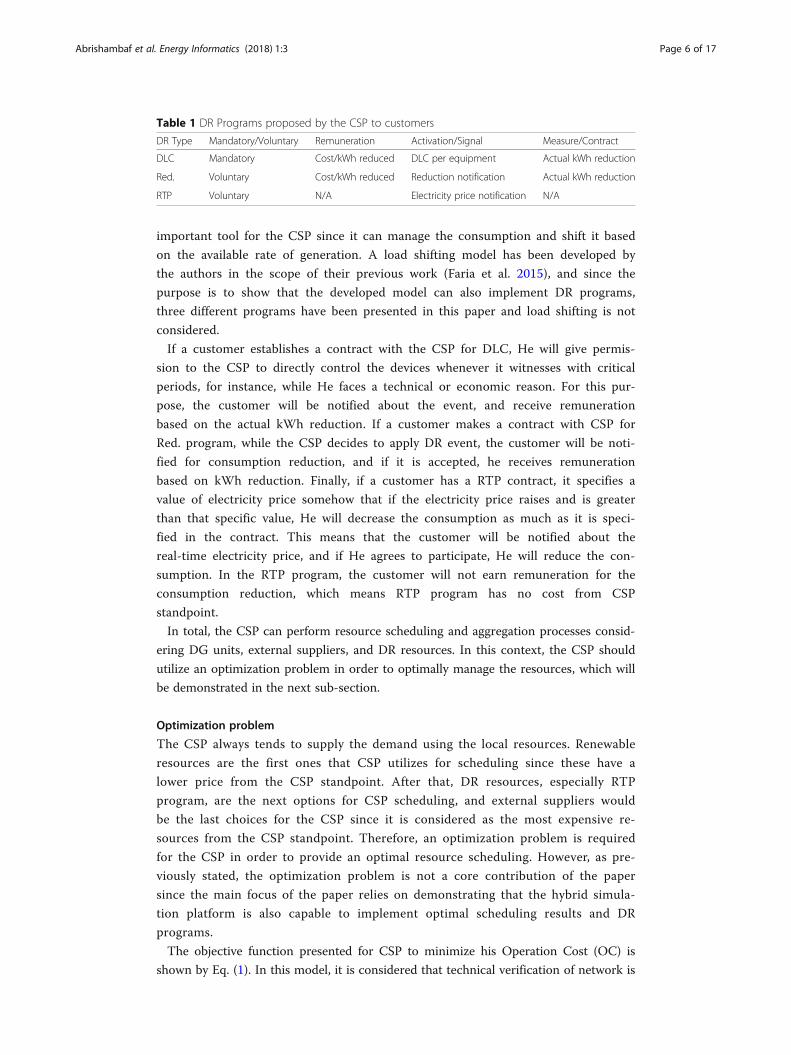
The real-time simulation model implemented for the CSP is shown in Fig. 2. In this
model, it is considered that there are 20 consumers and prosumers, and 26 producers.
Abrishambaf et al. Energy Informatics (2018) 1:3 Page 7 of 17
The consumers are 12 residential buildings, 6 commercial buildings, and 2 industrial
units. Also, the producers are all renewable resources including 22 PV systems and 4
wind generators. Moreover, external suppliers are considered.
As Fig. 2 shows, the CSP network has been modeled in MATLAB/Simulink in
OP5600. In this network, several real and laboratory equipment has been employed in
order to emulate the consumption and generation profiles of the CSP players via the
HIL methodology. BUS #15 is considered as a prosumer, BUS #10 is dedicated to a
1.8 kW PV emulator, and BUS #5 includes a real 10 kW PV producer.
For the prosumer in BUS #15, a 4 kVA and a 30 kW load emulate the consumption,
and a 1.2 kW wind turbine emulator is responsible for wind generation. Moreover, for
the two PV producers, in BUS #10, a 1.8 kW DC power supply connected to a DC/AC
inverter emulates a PV producer, and in BUS #5, a real installation of PV system with a
maximum capacity of 10 kW stands for another PV producer. All this equipment is
controlled and monitored via OP5600 in MATLAB/Simulink.
Regarding the equipment connected to BUS #15 (prosumer), in a 30 kW load, there
are four relays that increase or decrease the rated consumption, and in a 4 kVA load,
there is an Arduino® (www.arduino.cc), which manages the amount of consumption.
The relays in 30 kW load are connected to Digital Output board of OP5600, and Ardu-
ino® has been connected to OP5600 via Ethernet interface, with MODBUS TCP/IP
protocol. Also, in wind turbine emulator, there is an induction motor coupled with the
generator, in which the motor emulates the wind turbine. The motor has a speed con-
troller unit, which manages the speed of the wind, and therefore, the output power
generation of the machine. The speed controller unit of this machine is connected to
the Analog Output of OP5600. More information about these resources is available in
Fig. 2 Real and laboratory HIL equipment in MATLAB/Simulink CSP model
Abrishambaf et al. Energy Informatics (2018) 1:3 Page 8 of 17
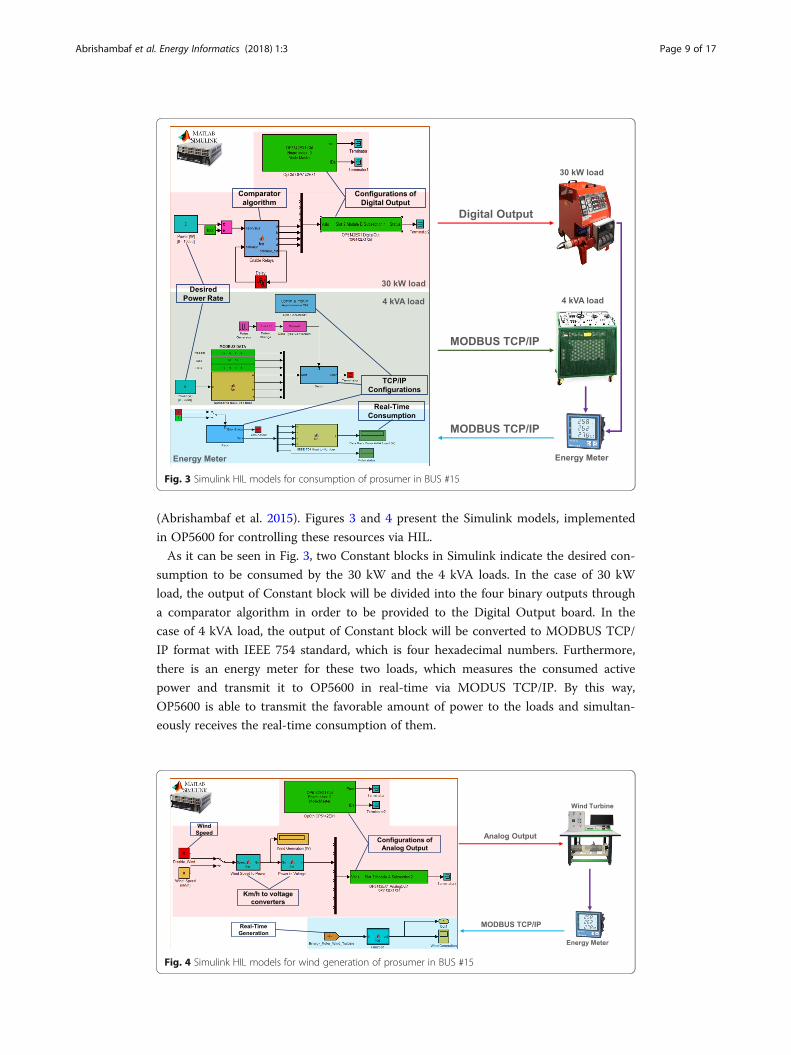
(Abrishambaf et al. 2015). Figures 3 and 4 present the Simulink models, implemented
in OP5600 for controlling these resources via HIL.
As it can be seen in Fig. 3, two Constant blocks in Simulink indicate the desired con-
sumption to be consumed by the 30 kW and the 4 kVA loads. In the case of 30 kW
load, the output of Constant block will be divided into the four binary outputs through
a comparator algorithm in order to be provided to the Digital Output board. In the
case of 4 kVA load, the output of Constant block will be converted to MODBUS TCP/
IP format with IEEE 754 standard, which is four hexadecimal numbers. Furthermore,
there is an energy meter for these two loads, which measures the consumed active
power and transmit it to OP5600 in real-time via MODUS TCP/IP. By this way,
OP5600 is able to transmit the favorable amount of power to the loads and simultan-
eously receives the real-time consumption of them.
Fig. 3 Simulink HIL models for consumption of prosumer in BUS #15
Fig. 4 Simulink HIL models for wind generation of prosumer in BUS #15
Abrishambaf et al. Energy Informatics (2018) 1:3 Page 9 of 17
The Simulink model regarding the wind turbine emulator is shown in Fig. 4. In this
model, since the wind turbine is controlled by Analog Output of OP5600, the wind
speed data should be converted to a 0 to + 10 V signal. The output of a Constant block,
which is favorable wind speed value, is converted to 0 to + 10 V voltage range through
two developed algorithms implemented in two MATLAB Function blocks, and there-
fore, OP5600 controls the emulator based on the provided voltage. Simultaneously,
an energy meter measures the generation of the emulator and transmit it to the
OP5600 in real-time via MODBUS TCP/IP. The TCP/IP configurations blocks re-
garding the energy meter are not shown in Fig. 4 since these are similar to the
ones in Fig. 3.
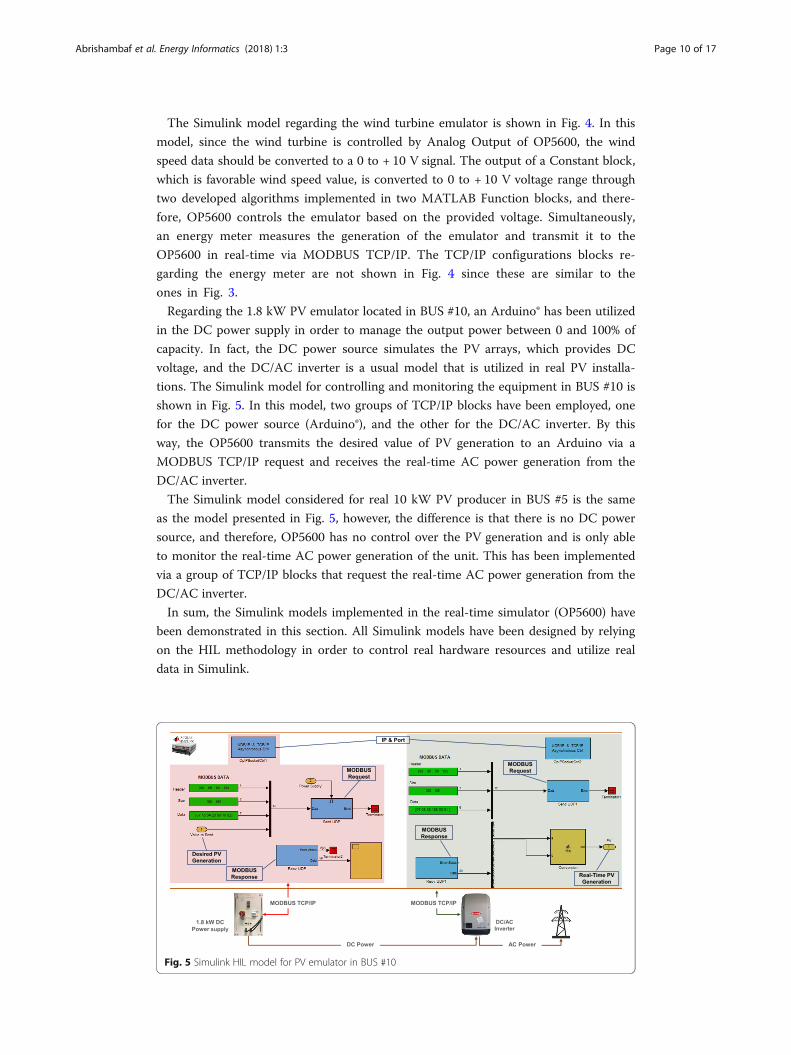
Regarding the 1.8 kW PV emulator located in BUS #10, an Arduino® has been utilized
in the DC power supply in order to manage the output power between 0 and 100% of
capacity. In fact, the DC power source simulates the PV arrays, which provides DC
voltage, and the DC/AC inverter is a usual model that is utilized in real PV installa-
tions. The Simulink model for controlling and monitoring the equipment in BUS #10 is
shown in Fig. 5. In this model, two groups of TCP/IP blocks have been employed, one
for the DC power source (Arduino®), and the other for the DC/AC inverter. By this
way, the OP5600 transmits the desired value of PV generation to an Arduino via a
MODBUS TCP/IP request and receives the real-time AC power generation from the
DC/AC inverter.
The Simulink model considered for real 10 kW PV producer in BUS #5 is the same
as the model presented in Fig. 5, however, the difference is that there is no DC power
source, and therefore, OP5600 has no control over the PV generation and is only able
to monitor the real-time AC power generation of the unit. This has been implemented
via a group of TCP/IP blocks that request the real-time AC power generation from the
DC/AC inverter.
In sum, the Simulink models implemented in the real-time simulator (OP5600) have
been demonstrated in this section. All Simulink models have been designed by relying
on the HIL methodology in order to control real hardware resources and utilize real
data in Simulink.
Fig. 5 Simulink HIL model for PV emulator in BUS #10
Abrishambaf et al. Energy Informatics (2018) 1:3 Page 10 of 17
Case studyIn this section, a case study tests and validates the developed Simulink models in
OP5600. For this purpose, 24 periods of 30 s (12 min in total) are considered for running
the model in real-time and obtain the results. The 12 min period, which is a rather short
one, has been selected in order to provide deeper focus on the results analysis. Longer pe-
riods can be easily implemented using this hybrid platform. The consumption and gener-
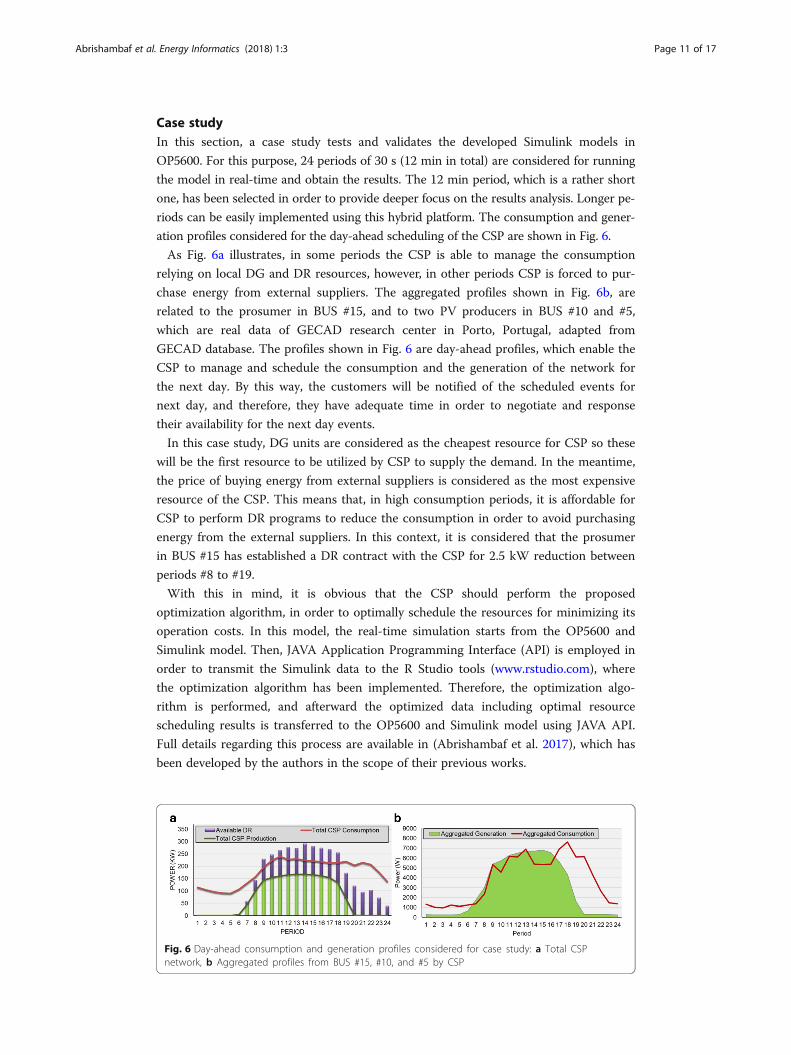
ation profiles considered for the day-ahead scheduling of the CSP are shown in Fig. 6.
As Fig. 6a illustrates, in some periods the CSP is able to manage the consumption
relying on local DG and DR resources, however, in other periods CSP is forced to pur-
chase energy from external suppliers. The aggregated profiles shown in Fig. 6b, are
related to the prosumer in BUS #15, and to two PV producers in BUS #10 and #5,
which are real data of GECAD research center in Porto, Portugal, adapted from
GECAD database. The profiles shown in Fig. 6 are day-ahead profiles, which enable the
CSP to manage and schedule the consumption and the generation of the network for
the next day. By this way, the customers will be notified of the scheduled events for
next day, and therefore, they have adequate time in order to negotiate and response
their availability for the next day events.
In this case study, DG units are considered as the cheapest resource for CSP so these
will be the first resource to be utilized by CSP to supply the demand. In the meantime,
the price of buying energy from external suppliers is considered as the most expensive
resource of the CSP. This means that, in high consumption periods, it is affordable for
CSP to perform DR programs to reduce the consumption in order to avoid purchasing
energy from the external suppliers. In this context, it is considered that the prosumer
in BUS #15 has established a DR contract with the CSP for 2.5 kW reduction between
periods #8 to #19.
With this in mind, it is obvious that the CSP should perform the proposed
optimization algorithm, in order to optimally schedule the resources for minimizing its
operation costs. In this model, the real-time simulation starts from the OP5600 and
Simulink model. Then, JAVA Application Programming Interface (API) is employed in
order to transmit the Simulink data to the R Studio tools (www.rstudio.com), where
the optimization algorithm has been implemented. Therefore, the optimization algo-
rithm is performed, and afterward the optimized data including optimal resource
scheduling results is transferred to the OP5600 and Simulink model using JAVA API.
Full details regarding this process are available in (Abrishambaf et al. 2017), which has
been developed by the authors in the scope of their previous works.
Fig. 6 Day-ahead consumption and generation profiles considered for case study: a Total CSPnetwork, b Aggregated profiles from BUS #15, #10, and #5 by CSP
Abrishambaf et al. Energy Informatics (2018) 1:3 Page 11 of 17
The optimization problem developed in this paper is a linear problem and is solved
using R Studio. Since R studio tools play the role of mathematical problem solver and
are separate from the real-time simulator, OP5600 is able to manage HIL devices
according to the acquired results of any optimization model supported by R Studio,
such as linear or nonlinear problems.
In other words, the outcomes of the optimization process, which is the economic
resource scheduling, is the rate of power that has been requested from each consumer
and generator in the CSP network. In order to implement these optimal scheduling re-
sults on the real resources, the conditions of the electrical network are important. The
OP5600 real-time simulator used in this paper enables us to address this fact; we can
validate the actual amount of reduction in the consumers and actual generation of
energy resources and obtain the actual measurement results in order to be employed in
the remuneration phase.
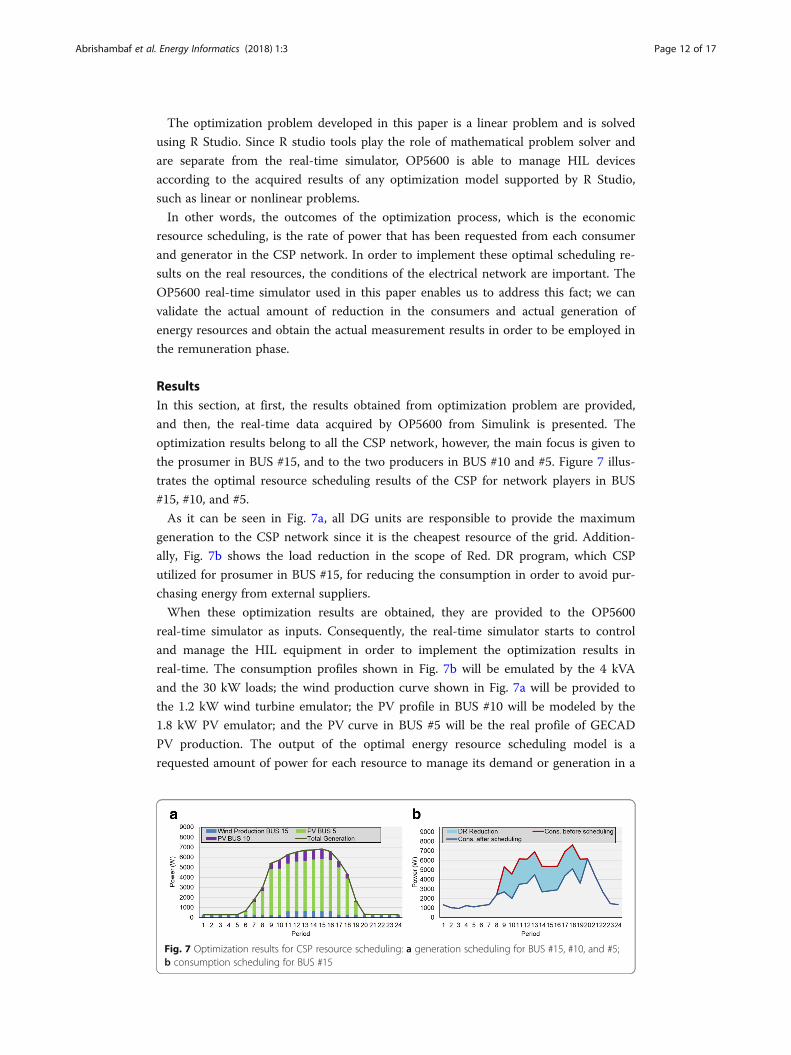
ResultsIn this section, at first, the results obtained from optimization problem are provided,
and then, the real-time data acquired by OP5600 from Simulink is presented. The
optimization results belong to all the CSP network, however, the main focus is given to
the prosumer in BUS #15, and to the two producers in BUS #10 and #5. Figure 7 illus-
trates the optimal resource scheduling results of the CSP for network players in BUS
#15, #10, and #5.
As it can be seen in Fig. 7a, all DG units are responsible to provide the maximum
generation to the CSP network since it is the cheapest resource of the grid. Addition-
ally, Fig. 7b shows the load reduction in the scope of Red. DR program, which CSP
utilized for prosumer in BUS #15, for reducing the consumption in order to avoid pur-
chasing energy from external suppliers.
When these optimization results are obtained, they are provided to the OP5600
real-time simulator as inputs. Consequently, the real-time simulator starts to control
and manage the HIL equipment in order to implement the optimization results in
real-time. The consumption profiles shown in Fig. 7b will be emulated by the 4 kVA
and the 30 kW loads; the wind production curve shown in Fig. 7a will be provided to
the 1.2 kW wind turbine emulator; the PV profile in BUS #10 will be modeled by the
1.8 kW PV emulator; and the PV curve in BUS #5 will be the real profile of GECAD
PV production. The output of the optimal energy resource scheduling model is a
requested amount of power for each resource to manage its demand or generation in a
Fig. 7 Optimization results for CSP resource scheduling: a generation scheduling for BUS #15, #10, and #5;b consumption scheduling for BUS #15
Abrishambaf et al. Energy Informatics (2018) 1:3 Page 12 of 17
certain period. However, the actual implementation of the demand reduction and the
DG production requested for each real resource will depend on the electrical grid con-
ditions. In fact, this is one of the advantages of using real-time simulation (OP5600)
and laboratory equipment, as HIL, for modeling consumption and generation profiles.
With this method, we validate the actual demand reduction, and the actual DG produc-
tion in order to be used in the simulation results, namely for remuneration and aggre-
gation goals.
Figures 8, 9, 10, 11 and 12 show the final results of the real-time simulation for
12 min. All the results illustrated in these figures are adapted from OP5600 and
MATLAB/Simulink. In this model, the time step for real-time simulation is configured
as 0.5 s. This means that OP5600 transmits the optimization results to HIL devices
with 30 s time interval (one value for each period), and then, it acquires the real-time
data with a 0.5 s time interval. The results shown in Figs. 8, 9, 10, 11 and 12 are the be-
haviors and reactions of customers during the scheduled events; they accepted their
availability for these events in the day before.
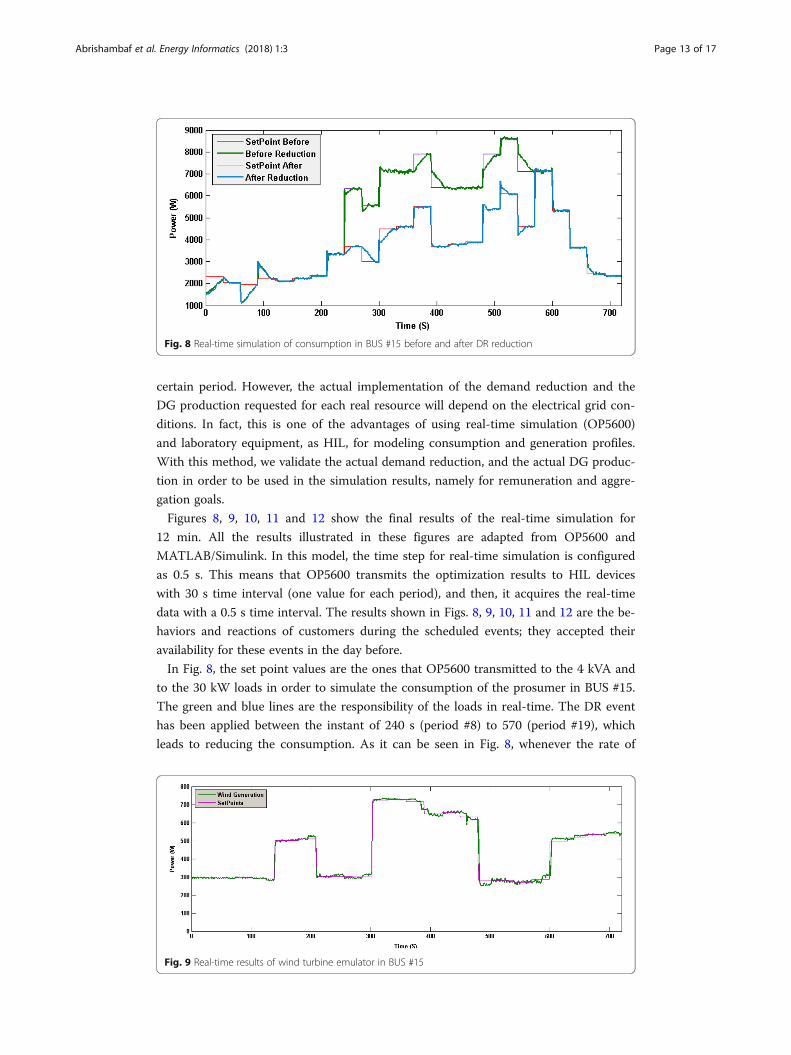
In Fig. 8, the set point values are the ones that OP5600 transmitted to the 4 kVA and
to the 30 kW loads in order to simulate the consumption of the prosumer in BUS #15.
The green and blue lines are the responsibility of the loads in real-time. The DR event
has been applied between the instant of 240 s (period #8) to 570 (period #19), which
leads to reducing the consumption. As it can be seen in Fig. 8, whenever the rate of
Fig. 8 Real-time simulation of consumption in BUS #15 before and after DR reduction
Fig. 9 Real-time results of wind turbine emulator in BUS #15
Abrishambaf et al. Energy Informatics (2018) 1:3 Page 13 of 17
consumption changed, the loads require some time to reach the desired consumption
level. This is one of the main differences between the experimental works and simula-
tion works; in simulation environment the consumption rate changes immediately,
however, consumers modeled by HIL devices employed in this platform require some
time to meet the desired rate of consumption since it accommodates analog control in
AC Loads.
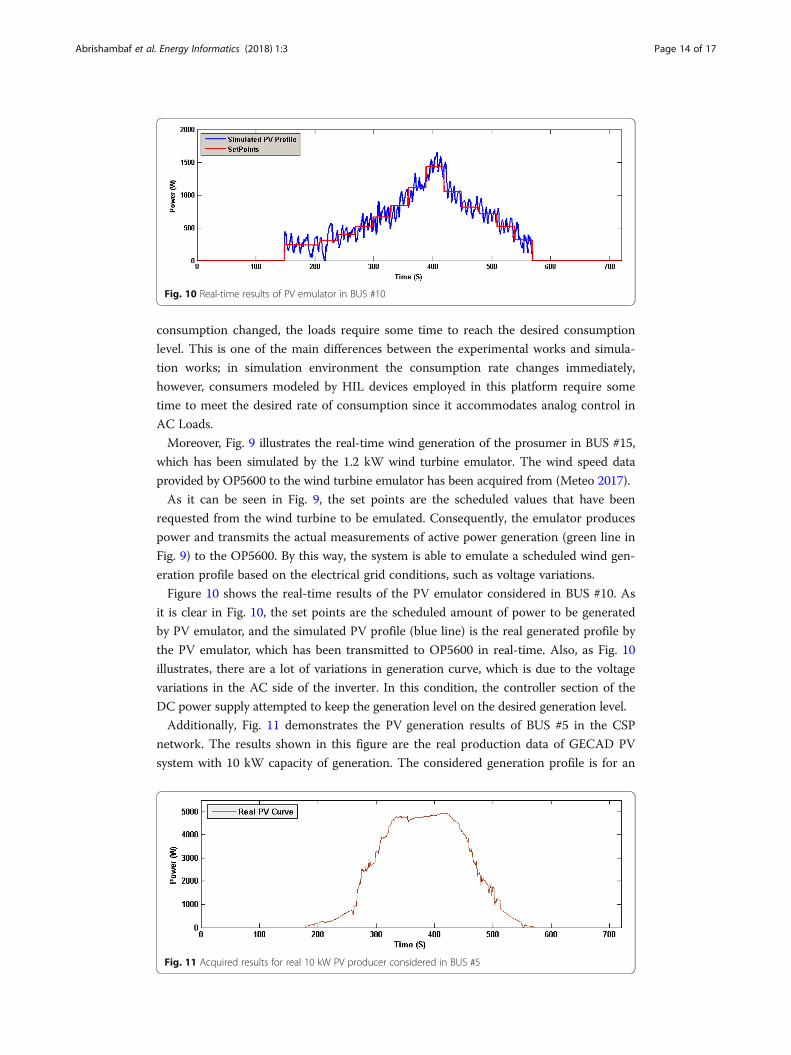
Moreover, Fig. 9 illustrates the real-time wind generation of the prosumer in BUS #15,
which has been simulated by the 1.2 kW wind turbine emulator. The wind speed data
provided by OP5600 to the wind turbine emulator has been acquired from (Meteo 2017).
As it can be seen in Fig. 9, the set points are the scheduled values that have been
requested from the wind turbine to be emulated. Consequently, the emulator produces
power and transmits the actual measurements of active power generation (green line in
Fig. 9) to the OP5600. By this way, the system is able to emulate a scheduled wind gen-
eration profile based on the electrical grid conditions, such as voltage variations.
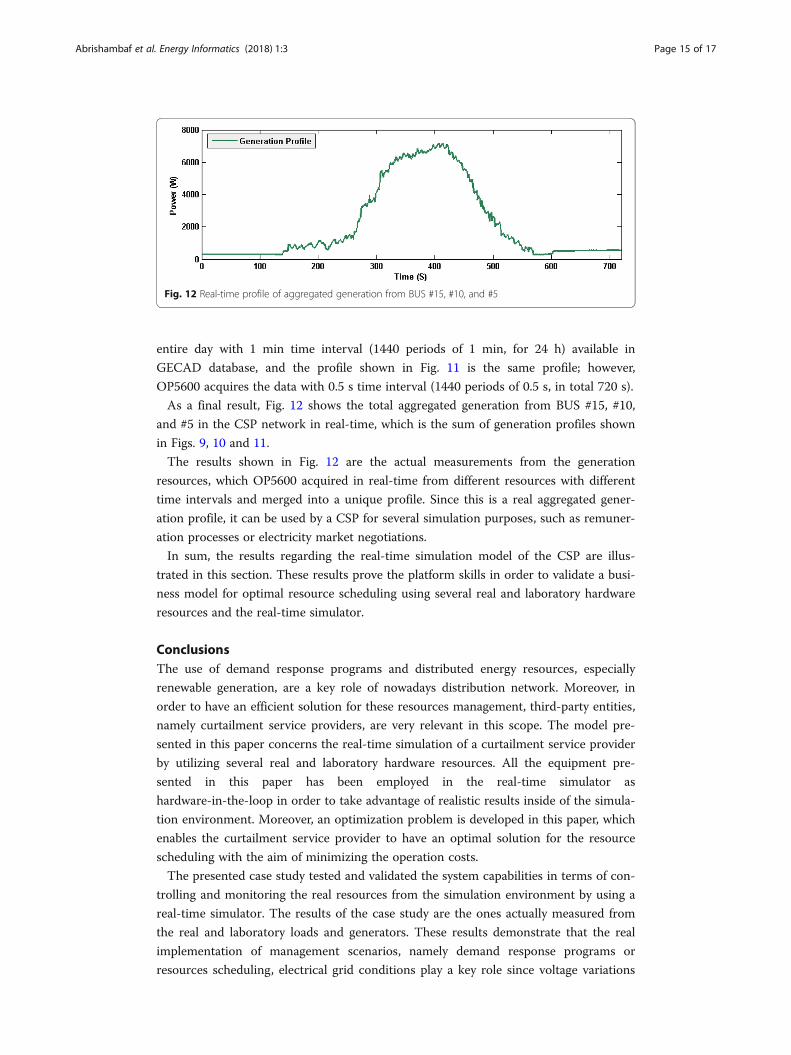
Figure 10 shows the real-time results of the PV emulator considered in BUS #10. As
it is clear in Fig. 10, the set points are the scheduled amount of power to be generated
by PV emulator, and the simulated PV profile (blue line) is the real generated profile by
the PV emulator, which has been transmitted to OP5600 in real-time. Also, as Fig. 10
illustrates, there are a lot of variations in generation curve, which is due to the voltage
variations in the AC side of the inverter. In this condition, the controller section of the
DC power supply attempted to keep the generation level on the desired generation level.
Additionally, Fig. 11 demonstrates the PV generation results of BUS #5 in the CSP
network. The results shown in this figure are the real production data of GECAD PV
system with 10 kW capacity of generation. The considered generation profile is for an
Fig. 10 Real-time results of PV emulator in BUS #10
Fig. 11 Acquired results for real 10 kW PV producer considered in BUS #5
Abrishambaf et al. Energy Informatics (2018) 1:3 Page 14 of 17
entire day with 1 min time interval (1440 periods of 1 min, for 24 h) available in
GECAD database, and the profile shown in Fig. 11 is the same profile; however,
OP5600 acquires the data with 0.5 s time interval (1440 periods of 0.5 s, in total 720 s).
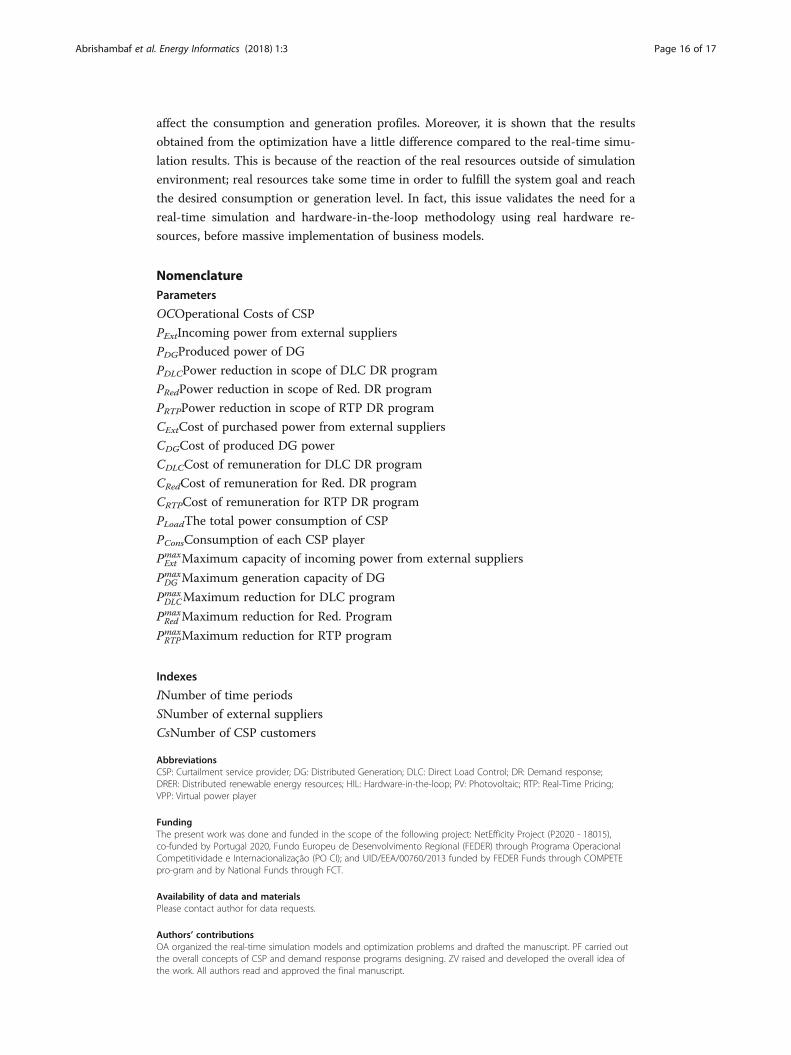
As a final result, Fig. 12 shows the total aggregated generation from BUS #15, #10,
and #5 in the CSP network in real-time, which is the sum of generation profiles shown
in Figs. 9, 10 and 11.
The results shown in Fig. 12 are the actual measurements from the generation
resources, which OP5600 acquired in real-time from different resources with different
time intervals and merged into a unique profile. Since this is a real aggregated gener-
ation profile, it can be used by a CSP for several simulation purposes, such as remuner-
ation processes or electricity market negotiations.
In sum, the results regarding the real-time simulation model of the CSP are illus-
trated in this section. These results prove the platform skills in order to validate a busi-
ness model for optimal resource scheduling using several real and laboratory hardware
resources and the real-time simulator.
ConclusionsThe use of demand response programs and distributed energy resources, especially
renewable generation, are a key role of nowadays distribution network. Moreover, in
order to have an efficient solution for these resources management, third-party entities,
namely curtailment service providers, are very relevant in this scope. The model pre-
sented in this paper concerns the real-time simulation of a curtailment service provider
by utilizing several real and laboratory hardware resources. All the equipment pre-
sented in this paper has been employed in the real-time simulator as
hardware-in-the-loop in order to take advantage of realistic results inside of the simula-
tion environment. Moreover, an optimization problem is developed in this paper, which
enables the curtailment service provider to have an optimal solution for the resource
scheduling with the aim of minimizing the operation costs.
The presented case study tested and validated the system capabilities in terms of con-
trolling and monitoring the real resources from the simulation environment by using a
real-time simulator. The results of the case study are the ones actually measured from
the real and laboratory loads and generators. These results demonstrate that the real
implementation of management scenarios, namely demand response programs or
resources scheduling, electrical grid conditions play a key role since voltage variations
Fig. 12 Real-time profile of aggregated generation from BUS #15, #10, and #5
Abrishambaf et al. Energy Informatics (2018) 1:3 Page 15 of 17
affect the consumption and generation profiles. Moreover, it is shown that the results
obtained from the optimization have a little difference compared to the real-time simu-
lation results. This is because of the reaction of the real resources outside of simulation
environment; real resources take some time in order to fulfill the system goal and reach
the desired consumption or generation level. In fact, this issue validates the need for a
real-time simulation and hardware-in-the-loop methodology using real hardware re-
sources, before massive implementation of business models.
NomenclatureParameters
OCOperational Costs of CSP
PExtIncoming power from external suppliers
PDGProduced power of DG
PDLCPower reduction in scope of DLC DR program
PRedPower reduction in scope of Red. DR program
PRTPPower reduction in scope of RTP DR program
CExtCost of purchased power from external suppliers
CDGCost of produced DG power
CDLCCost of remuneration for DLC DR program
CRedCost of remuneration for Red. DR program
CRTPCost of remuneration for RTP DR program
PLoadThe total power consumption of CSP
PConsConsumption of each CSP player
PmaxExt Maximum capacity of incoming power from external suppliers
PmaxDG Maximum generation capacity of DG
PmaxDLCMaximum reduction for DLC program
PmaxRed Maximum reduction for Red. Program
PmaxRTPMaximum reduction for RTP program
Indexes
INumber of time periods
SNumber of external suppliers
CsNumber of CSP customers
AbbreviationsCSP: Curtailment service provider; DG: Distributed Generation; DLC: Direct Load Control; DR: Demand response;DRER: Distributed renewable energy resources; HIL: Hardware-in-the-loop; PV: Photovoltaic; RTP: Real-Time Pricing;VPP: Virtual power player
FundingThe present work was done and funded in the scope of the following project: NetEfficity Project (P2020 - 18015),co-funded by Portugal 2020, Fundo Europeu de Desenvolvimento Regional (FEDER) through Programa OperacionalCompetitividade e Internacionalização (PO CI); and UID/EEA/00760/2013 funded by FEDER Funds through COMPETEpro-gram and by National Funds through FCT.
Availability of data and materialsPlease contact author for data requests.
Authors’ contributionsOA organized the real-time simulation models and optimization problems and drafted the manuscript. PF carried outthe overall concepts of CSP and demand response programs designing. ZV raised and developed the overall idea ofthe work. All authors read and approved the final manuscript.
Abrishambaf et al. Energy Informatics (2018) 1:3 Page 16 of 17
Ethics approval and consent to participateNot applicable.
Consent for publicationNot applicable.
Competing interestsThe authors declare that they have no competing interests.
Publisher’s NoteSpringer Nature remains neutral with regard to jurisdictional claims in published maps and institutional affiliations.
Received: 10 January 2018 Accepted: 11 June 2018
ReferencesAbrishambaf O, Faria P, Gomes L, Spínola J, Vale Z, Corchado J (2017) Implementation of a real-time microgrid
simulation platform based on centralized and distributed management. Energies 10(6):806–820Abrishambaf O, Gomes L, Faria P, Vale Z (2015) Simulation and control of consumption and generation of hardware
resources in microgrid real-time digital simulator. Paper presented at IEEE PES innovative smart grid technologiesLatin America (ISGT LATAM), Montevideo, 5–7
Aghaei J, Alizadeh M (2013) Demand response in smart electricity grids equipped with renewable energy sources: areview. Renew Sust Energ Rev 18:64–72
Alvarez-Gonzalez F, Griffo A, Sen B, Wang J (2017) Real-time hardware-in-the-loop simulation of permanent-magnetsynchronous motor drives under Stator faults. IEEE Trans Ind Electron 64(9):6960–6969
Bakr S, Cranefield S (2015) Using the Shapley value for fair consumer compensation in energy demand responseprograms: comparing algorithms. Paper presented at IEEE International Conference on Data Science and DataIntensive Systems, Sydney, 11–13
Bottaccioli L, Estebsari A, Patti E, Pons E, Acquaviva A (2017a) A novel integrated real-time simulation platform forassessing photovoltaic penetration impacts in smart grids. Energy Procedia 111:780–789
Bottaccioli L, Estebsari A, Pons E, Bompard E, Macii E, Patti E, Acquaviva A (2017b) A flexible distributed infrastructurefor real-time Cosimulations in smart grids. IEEE Trans Industr Inform 13(6):3265–3274
Falvo M, Graditi G, Siano P (2014) Electric vehicles integration in demand response programs. Paper presented at 2014International Symposium On Power Electronics, Electrical Drives, Automation And Motion, Ischia, Italy, 18–20
Faria P, Vale Z (2013) Demand response programs definition using demand price elasticity to define consumersaggregation for an improved remuneration structure. Paper presented at IEEE PES ISGT Europe, Lyngby, 6–9
Faria P, Vale Z, Baptista J (2015) Constrained consumption shifting management in the distributed energy resourcesscheduling considering demand response. Energy Convers Manag 93:309–320
Gkatzikis L, Koutsopoulos I, Salonidis T (2013) The role of aggregators in smart grid demand response markets. IEEE JSel Areas Commun 31(7):1247–1257
Hillman T (2011) Can demand response receive comparable treatment to traditional generation? 2011 IEEE/PES PowerSystems Conference and Exposition, Phoenix, pp 20–23
Hurtado L, Mocanu E, Nguyen P, Gibescu M, Kamphuis R (2018) Enabling cooperative behavior for building demandresponse based on extended joint action learning. IEEE Trans Industr Inform 14(1):127–136
Khezeli K, Lin W, Bitar E (2017) Learning to buy (and sell) demand response. IFAC-Papers Online 50(1):6761–6767Li C, Chen Y, Luo F, Xu Z, Zheng Y (2017) Real-time decision making model for thermostatically controlled load aggregators by
natural aggregation algorithm. Paper presented at IEEE International Conference On Energy Internet (ICEI), Beijing, 17–21Mao C, Leng F, Li J, Zhang S, Zhang L, Mo R, Wang D, Zeng J, Chen X, An R, Zhao Y (2018) A 400-V/50-kVA digital–
physical hybrid real-time simulation platform for power systems. IEEE Trans Ind Electron 65(5):3666–3676Marulanda G, Valenzuela J, Salazar H (2014) An assessment of the impact of a demand response program on the
Colombian day-ahead electricity market. Paper presented at IEEE PES Transmission & Distribution Conference andExposition - Latin America (PES T&D-LA), Medellin, 10–13
ISEP Meteo (2017) http://meteo.isep.ipp.pt/weather/index.html. Accessed 19 Dec 2017Mortaji H, Hock Ow S, Moghavvemi M, Almurib H (2017) Load shedding and smart-direct load control using internet of
things in smart grid demand response management. IEEE Trans Ind Appl 53(6):5155–5163Olivares D, Mehrizi-Sani A, Etemadi A, Canizares C, Iravani R, Kazerani M et al (2014) Trends in microgrid control. IEEE
Trans Smart Grid 5(4):1905–1919Paterakis N, Erdinç O, Catalão J (2017) An overview of demand response: key-elements and international experience.
Renew Sust Energ Rev 69:871–891Reddy S (2016) Optimizing energy and demand response programs using multi-objective optimization. Electr Eng
99(1):397–406Rotger-Griful S, Chatzivasileiadis S, Jacobsen R, Stewart E, Domingo J, Wetter M (2016) Hardware-in-the-loop co-simulation of
distribution grid for demand response. Paper presented at Power Systems Computation Conference (PSCC), Genoa, 20–24Shariatzadeh F, Mandal P, Srivastava A (2015) Demand response for sustainable energy systems: a review, application
and implementation strategy. Renew Sust Energ Rev 45:343–350Siano P (2017) Demand response and smart grids—a survey. Renew Sust Energ Rev 30:461–478Silva M, Fernandes F, Morais H, Ramos S, Vale Z (2015) Hour-ahead energy resource management in university campus
microgrid. Paper presented at IEEE Eindhoven Powertech, Eindhoven, 29 June-2 July 20Wang Q, Zhang C, Ding Y, Xydis G, Wang J, Østergaard J (2015) Review of real-time electricity markets for integrating
distributed energy resources and demand response. Appl Energy 138:695–706
Abrishambaf et al. Energy Informatics (2018) 1:3 Page 17 of 17