mottling score - journal of pediatric critical care jpcc-oct... · vol. 1 - no.4 october - december...
TRANSCRIPT


JOURNAL OF PEDIATRIC CRITICAL CAREVol. 1 - No.4 October - December 2014 268
Figure 1. Mottling ScoreScore 0= no mottling Score 1= small area of mottling, localised to centre of knee Score 2= modest mottling area that does not extend beyond superior border of kneecap Score 3= mild mottling area that does not extend beyond the mid- thigh Score 4= severe mottling area, not going beyond the groin fold Score 5= extremely severe mottling area, extending beyond groin fold
Step 2: Basic monitoring and assessment of global perfusion
Concept of upstream & downstream markers: The concept of tissue dysfunction in shock, has led to the concept of �‘�‘upstream�’�’ and �‘�‘downstream�’�’ indicators of organ perfusion. Upstream markers assess ow and pressure in the heart, vena cava, pulmonary artery, and aorta. These are the traditional variables that have been used to assess the hemodynamic status of critically ill patients.However, shock with end�–organ dysfunction occurs at the capillary and tissue levels. Tools have therefore been developed that follow alterations in the microvasculature of critically ill patients. These
techniques are known as the �‘�‘downstream�’�’ markers. Since patients�’ oxygen and metabolic needs vary with different stressors and at different times, monitoring downstream variables can be helpful. The current concept is to use these downstream markers to ensure that interventions that alter upstream variables are improving tissue oxygenation.Downstream markers therefore provide a guide to upstream therapy.1. Upstream markers include systemic blood pressure,
heart rate, central venous pressure (CVP), pulmonarycapillary wedge pressure (PCWP), and cardiac output
2. Currently available downstream markers includeurine output, blood lactate, base excess, tissue carbondioxide levels, and mixed venous oxygen and carbondioxide levels.
A. Blood PressureBlood pressure measurement is integral in the support of the critically ill patients. Cardiac output and systemic vascular resistance determine the mean blood pressure. It is very important to remember that pressure does not equal ow. When cardiac output falls, normal blood pressure is maintained by compensatory vasoconstriction causing high systemic vascular resistance. Hypotension is therefore a late sign of cardiovascular decompensation. Hence as clinicians one must not feel reassured by the presence of a normal blood pressure.
Non– invasive BP Monitoring (NIBP): The oscillometric technique is the most commonly used technique to measure arterial pressure. Mean arterial pressure (MAP) is most accurate by this method and diastolic pressure is the least accurate. The blood pressure readings are in uenced by cuff size and placement and ow in the limb. Accurate blood pressure measurement requires the use of a proper sized cuff. Current recommendations require the use of a cuff that covers 40% of the mid upper arm circumference. The major limitations of NIBP are:�• readings can be fallacious in presence of
hypoperfusion or peripheral vasoconstriction�• It gives intermittent readings �• Accuracy of readings are dependent on appropriate
cuff size and placement
SYMPOSIUM: MONITORING IN PEDIATRIC CRITICAL CARE Hemodynamic Monitoring in PICU

JOURNAL OF PEDIATRIC CRITICAL CARE269Vol. 1 - No.4 October - December 2014
Invasive hemodynamic monitoring: Invasive BP monitoring is considered the gold standard for arterial pressure monitoring in an ICU. It is indicated in situations where there is need for continuous, reliable BP recording along with the need for frequent arterial sampling. The BP measured by this method is unaffected by poor ow or perfusion in the limb(3). IBP is a relatively safe procedure. Some of the complications include hemorrhage, hematoma, arterial thrombosis, vasospasm, ischemia and infection.�• The equipment required for invasive BP monitoring
includes an arterial cannula with a heparinized saline column and ushing device, a transducer, an ampli er,and a monitor. A continuous column of uid from the blood vessel lumen to the transducer diaphragm transmits variations in intraluminal pressure; causing changes in resistance and current those are converted into an electrical signal, which is ampli ed to display a waveform and digital pressure on the bedside monitor. Disposable transducers have diaphragms that contain silicon crystals that undergo change in electrical resistance in proportion to the pressure applied to the diaphragm.The arterial pressure waveform is a complex sine wave that is a summation of a series of simple sine waves of different frequencies
�• Pressure is usually measured with a transducer, which is a device that coverts pressure in a uid lled system to electric waveform. Three factors have to be considered when using a transducer: (1) calibration (2) zero setting and (3) leveling
�• Calibration:In this process, a known pressure is applied to the membrane and change in current is related to the applied pressure. The precision and accuracy of arterial pressure system depends on meticulous calibration that must be carried out each shift.
�• Zero setting: Why is zeroing important ? The process of eliminating the atmospheric pressure is called �‘�‘zeroing,�’�’ and what is essentially being done is opening the uid column on the measuring device to atmosphere and adjusting the electronics so that atmospheric pressure is the starting value or zero.
�• Leveling: Leveling eliminates the in uence of hydrostatic pressure on the transducer. A transducer that is positioned below the patient�’s heart will produce falsely elevated pressure and a transducer positioned above the patient�’s heart will produce falsely low pressure. Pressure measurements in a uid- lled system are relative to a reference point. A widely used reference point is the phlebostatic axis which corresponds to the midpoint of the right atrium, because this is where blood comes back to the heart and this is also the pressure that provides the preload for the heart as a whole. The phlebostatic axis is determined by the junction of the two lines, a transverse line along the fourth intercostals space and a vertical line midway between the anterior and posterior chest wall.
�• The system should be arranged such that the reference stopcock of the transducer (that is opened for zeroing the transducer) must be leveled to the phlebostatic axis.
�• Pressure versus Flow:�• Clinicians caring for sick children must remember
that BP and heart rate often do not re ect blood ow. The distinction between pressure and ow is very important. This is most commonly seen during use of vasoconstrictor agents in the management of clinical shock. In this setting, an increase in blood pressure is often assumed to indicate an increase in systemic blood ow, but the opposite effect (a decrease in ow) is also possible. Few pointers:
• Check if system is optimally damped�• Damping is the tendency of the oscillation to
die down; anything that takes energy out of system dampens the system. (Figure2, Table 1 & 2)
Figure 2: The arterial waveforms �– normal, over damped and under damped waveforms.
Hemodynamic Monitoring in PICUSYMPOSIUM: MONITORING IN PEDIATRIC CRITICAL CARE

JOURNAL OF PEDIATRIC CRITICAL CAREVol. 1 - No.4 October - December 2014 270
Table 1 : Characteristic of Underdamped WaveformsNature of waveform
Effect on measurements
Causes
Narrow, peaked tracing
Overestimates SBPUnderestimates DBPMAP remains unchanged
Long tubing Increased vascular resistance
With too much damping (an �“overdamped�” system), however, frictional forces impede the arterial waveform such that it loses energy. Note the widened and slurred waveform characteristic of an overdamped pressure waveform (Figure 2). This waveform tends to underestimate SBP and overestimate DBP (Table-2).In both setting, mean arterial pressure (MAP) remains same, hence rely on MAP when system optimization is in doubt.
Table 2: Characteristic of Overdamped WaveformsNature of waveform
Effect on measurements
Causes
Widened and slurred pressure tracing
Underestimates SBPOverestimates DBP MAP remains unchanged
Air bubbles Overly compliant tubing Blood clots / Fibrin Catheter kinks Stopcocks / Injection ports No uid in ush bag / Low ush bag pressure
Although damping seems to be a solely a theoretical issue, under damped and over damped waveforms are encountered on a daily basis during arterial pressure monitoring in the intensive care unit. The ability to recognize when these potential sources of error or �“dynamic response artifacts�” are present is essential to being able to effectively analyze and apply haemodynamic measurements in the care of the critically ill and avoid potentially detrimental therapy based upon erroneous data
�• Damping can be checked by square wave testA �“fast- ush�” or �“square wave test�” is performed by opening the valve of the continuous ush device such that ow through the catheter-tubing system is acutely increased to 30 mL/hr from the usual 1-3 mL/hr. This generates an acute rise in pressure within the system such that a square wave is generated on the bedside monitor. With
closure of the valve, a sinusoidal pressure wave of a given frequency and progressively decreasing amplitude is generated.�• Optimally damped - one to two oscillations
before return to tracing�• Underdamped �– more than 2 oscillations before
returning to tracing�• Overdamped �– less than 3 oscillations before
returning to zero.
�• Check arterial waveform and interpret
Figure 3. Arterial waveformA wave = anacrotic limb B wave = systolic pressure C wave = dicrotic notch D wave = diastole
Figure 4. Changes of the arterial pressure waveform con guration throughout the arterial tree. Note the increasing steepness and amplitude of the systolic upstroke and the changing location of the dicrotic notch. This phenomenon is also called Distal pulse wave ampli cation.- The farther into the periphery blood pressure
is measured the waveform appears narrower, systolic and pulse pressure increase and .the diastolic pressure decrease. But MAP always remains same.
Hemodynamic Monitoring in PICUSYMPOSIUM: MONITORING IN PEDIATRIC CRITICAL CARE

JOURNAL OF PEDIATRIC CRITICAL CARE271Vol. 1 - No.4 October - December 2014
- Systolic blood pressure variations seen in hypovolemia
- Steep slope of upstroke suggests good contractility- Position of dicrotic notch �– low (low systemic
vascular resistance) and high (high afterload)- Slope of decent �– steep (low systemic vascular
resistance) (Figure 3&4)�• Optimize natural frequency of system- Use wide-bore, high-pressure tubing no longer than
122 cm (48 in) - Avoid tubing extensions and minimize stopcocks - Ensure that all connections are tightened - Eliminate air from the ush uid and air bubbles from
the tubing system - Keep continuous ush bag lled and keep external
pressure cuff at 300 mm Hg pressure - Keep cannulated extremity in a neutral or slightly
extended position to prevent catheter kinking.
B. SpO2 monitoring Continuous SpO2 monitoring enables almost immediate detection of even a small reduction in arterial oxygen saturation, which is an integral part of oxygen delivery. However, based on the sigmoid shape of the dissociation curve there is a time delay of the detection of acute oxygenation failure. Taking into account the shape of the O2 dissociation curve, SpO2 should be maintained >92% in most critically ill patients. The SpO2 signal is often inaccurate in the presence of altered skin perfusion. The inability to measure SpO2 is an indicator of abnormal peripheral perfusion.
C. LactateBlood lactate concentration is commonly used as a global �‘�‘downstream�’�’ marker of tissue perfusion and the adequacy of resuscitation. The normal serum lactate level in resting humans is approximately 1 mmol/L (0.7-2.0). The value is the same whether measured in venous or arterial blood (in the absence of a tourniquet). Elevated serum lactate levels may represent poor tissue perfusion. The association of increased lactate levels with circulatory failure, anaerobic metabolism and the presence of tissue hypoxia have led to its utility as a monitor of tissue perfusion in critically ill patients.
Lactate metabolismLactate is a byproduct of glycolysis. In the energy producing metabolism of glucose two distinct processes occur. The rst series of enzymatic reactions (Enden- Mierhoff pathway), occurring in the cytoplasm of cells, anaerobically transforms 1 molecule of glucose into 2 molecules of pyruvate, generating 2 molecules of ATP. This is the primary energy process for all cells functioning in a low oxygen environment, such as in poorly perfused tissues. Pyruvate may either be converted to lactate, producing one additional molecule of ATP, or move into the second series of reactions. The second series of enzymatic reactions (Krebs cycle) takes place in the mitochondria and requires oxygen: pyruvate is oxidized into CO2 and H2O producing 18 ATP molecules. In the absence of oxygen, pyruvate cannot enter the Krebs cycle and is preferentially transformed into lactate to maintain ATP production. This causes the lactate to pyruvate ratio to increase (normal ratio 10/1). Once molecular oxygen is again available, assuming that mitochondrial function is preserved, the excess lactate is rapidly metabolized back through pyruvate into CO2 and H2O via the Krebs cycle. Some cells, such as red blood cells, do not have mitochondria and thus are primary lactate producers. Since lactate is rapidly metabolized by liver and skeletal muscle, these functional anaerobic cells result in minimal blood lactate levels.Lactate in the blood is metabolized mainly by the liver (50%) and kidneys (20%). Liver function and liver blood ow in uence hepatic lactate clearance, but extreme conditions of pH can also decrease lactate clearance.Types: Hyperlactaemia (>5 mmol litre�–1) is conventionally divided into Type A, in which tissue hypoxia results in faster production than removal Type B, in which overt tissue hypoxia does not play a role. Type B has been further sub-divided depending on whether it is caused by underlying disease (B1), drugs and toxins (B2) or inborn errors of metabolism (B3).
Factors that may contribute to hyperlactataemia: �• Increased production of lactate: tissue hypoxia
Hemodynamic Monitoring in PICUSYMPOSIUM: MONITORING IN PEDIATRIC CRITICAL CARE
JOURNAL OF PEDIATRIC CRITICAL CAREVol. 1 - No.4 October - December 2014 272
�• Increased aerobic glycolysis �• Inhibition of pyruvate dehydrogenase (in sepsis)�• Methanol/ethylene glycol/propofol toxicity �• Decreased clearance of lactate: liver dysfunction
or failure, cardiopulmonary bypass (minor reduction in clearance)
�• Acute hyperventilation can elevate blood lactate levels, perhaps secondary to increased splanchnic release of lactate during hyperventilation
�• Exogenous sources of lactate: �• Lactate buffered solutions used in continuous
veno-venous haemodia ltration (CVVHDF) �• Medications (metformin, nucleosidic reverse
transcriptase inhibitors, long-term linezolid use, intravenous lorazepam, valproic acid)
�• Haematologic malignancies.
While an elevated lactate may be a marker of illness severity and an important prognostic marker, this variable has not been studied as an end point of resuscitation. Lactate clearance lags by many hours following therapeutic interventions and is therefore not suited for goal-directed resuscitation. But, the rate of lactate clearance has been demonstrated to be a good marker of outcome (4).
D. Venous Oximetery Oxygen saturation of the venous blood can be measured either at the level of the pulmonary artery: mixed venous oxygen saturation (SVO2), the level of the inferior vena cava, superior vena cava, or right atrium (RA): central venous oxygen saturation (ScVO2). Although hemodynamic assessment using clinical signs and symptoms, CVP, and urinary output can fail to detect early septic shock, tissue hypoxia suggested by ScVO2 or SVO2, and arterial blood lactate concentration can be an early marker of sepsis or marginal circulation. It is important, however, to remember that venous oxygen saturation like cardiac output is a marker of global tissue hypoxia and does not yield information on oxygen reserves or adequate tissue oxygenation of individual organs.
Physiology of mixed venous oxygen saturation The transport system for oxygen is separated into 4 compartments:
�• Blood oxygen content �• Oxygen delivery �• Oxygen consumption from the microcirculation�• Oxygen extraction ratio
Oxygen content The oxygen carried in arterial blood (CaO2) is in 2 forms: Dissolved in plasma PO2 - <2% Combined with hemoglobin SO2 - >98%.
Oxygen saturation is the ratio of the amount of oxygenated hemoglobin to the total hemoglobin in 100 ml of blood.SaO2 = HbO2 x 100 Hb + HbO2 Oxygen saturation in arterial blood is normally 95 - 98 % ( ie nearly 98 % of the heme groups in the hemogloboin are loaded with oxygen ) whereas the saturation of venous blood is typically 60 - 80 % . SvO2 is an averaged re ection of the saturation of venous blood from various organs. As a result it does not give indication of adequacy of oxygenation of individual vascular bed rather; it is global indicator of oxygen balance between oxygen consumption (VO2) and its delivery (DO2). Generally, the tissues utilise approximately 25% of the available oxygen leaving a luxury reserve of 75 % for periods of increased requirements. Since > 98% of all the circulating oxygen is bound to haemoglobin, oxyhaemoglobin saturation is a direct indicator of the oxygen content of blood, CaO2 = (0.003 x PaO2) + (1.34 x Hb x SaO2 ) 0.003 - solubility coef cient of oxygen in plasma - this fraction is negligible and insigni cant 1.34 mls oxygen carried / gm of Hb
Note: Changes in hemoglobin have a larger impact on arterial oxygenation than changes in PaO2 Hypoxemia (re ected by a decrease in PaO2) has a relatively minor impact on arterial oxygenation if the accompanying change in SaO2 is small. PaO2 in uences oxygenation only to the extent that it in uences saturation, depending on the position on the oxygen dissociation curve.
Oxygen delivery (DO2)This is the amount of oxygen delivered to the tissues every min (ml/min) O2 delivery is
Hemodynamic Monitoring in PICUSYMPOSIUM: MONITORING IN PEDIATRIC CRITICAL CARE

JOURNAL OF PEDIATRIC CRITICAL CARE273Vol. 1 - No.4 October - December 2014
dependent on 2 factors - oxygen content of arterial blood and the blood ow to tissues as re ected by the cardiac output (Q). DO2 = CaO2 x Q = (1.34 x Hb x SaO2 ) x Q In this analogy, the blood is compared to a train (Figure 5) consisting of boxcars (hemoglobin molecules). These boxcars have been lled (saturated) with a valuable product (oxygen) at the loading station (the lungs).
Figure 5. Oxygen Delivery explained in analogy
Oxygen consumption (VO2) As the train progresses along the track, it stops at multiple depots. A portion of the product carried by the train is unloaded at each of these depots. Similarly, as blood ows from the left ventricle through the capillaries, oxygen is needed to meet the metabolic needs of the tissues. The difference between the amount of oxygen carried to the tissues (arterial oxygen delivery) and the amount of oxygen returned to the heart (venous oxygen delivery) indicates the total amount of oxygen consumed by the tissues (Figure 6). Mixed venous oxygen saturation re ects the amount of oxygen returning to the pulmonary capillaries, since it was not needed by the tissues to support metabolic function.
Figure 6. Oxygen transport & consumption
SvO2 represents the end result of both oxygen delivery and consumption at the tissue level.SvO2 = Oxygen Delivered �– Oxygen Consumed(SaO2, Hb, CO) (VO2)When a threat to normal oxygen supply/demand occurs, the body attempts to compensate, and its success is immediately re ected by SvO2. If the SvO2 value is normal, there is suf cient oxygen supply available to the tissues. However, if the SvO2 value is low, then either the oxygen supply is insuf cient or the oxygen demand is elevated (Table 3 & 4). Regardless of the cause, a decrease in SvO2 indicates that the body has called upon its one of the last line of defense to preserve oxygen balance and therapeutic interventions may be appropriate
Oxygen Extraction ratio (O2 ER) The ratio of O2uptake to O2 delivery, it is the fraction of oxygen delivered to the microcirculation that is taken up by the tissues. O2 ER = VO2/DO2 Normally 0.2 - 0.3 or 20 - 30 %, only this small a fraction is required to support aerobic metabolism under normal circumstances i.e. 25% of delivered oxygen and thus theoretically has a reserve of 75% oxygen. (Normal oxygen ux is 1000 ml and the oxygen consumption is 250 ml) However 100% oxygen extraction is not possible and beyond SvO2 of 30%, anaerobic metabolism will start. The fall or rise in SvO2 can be due to increased demands or decreased supply or increased supply or decreased demand respectively. Table 3 lists the clinical conditions in which these changes in SVO2 are likely to occur.
Hemodynamic Monitoring in PICUSYMPOSIUM: MONITORING IN PEDIATRIC CRITICAL CARE
JOURNAL OF PEDIATRIC CRITICAL CAREVol. 1 - No.4 October - December 2014 274
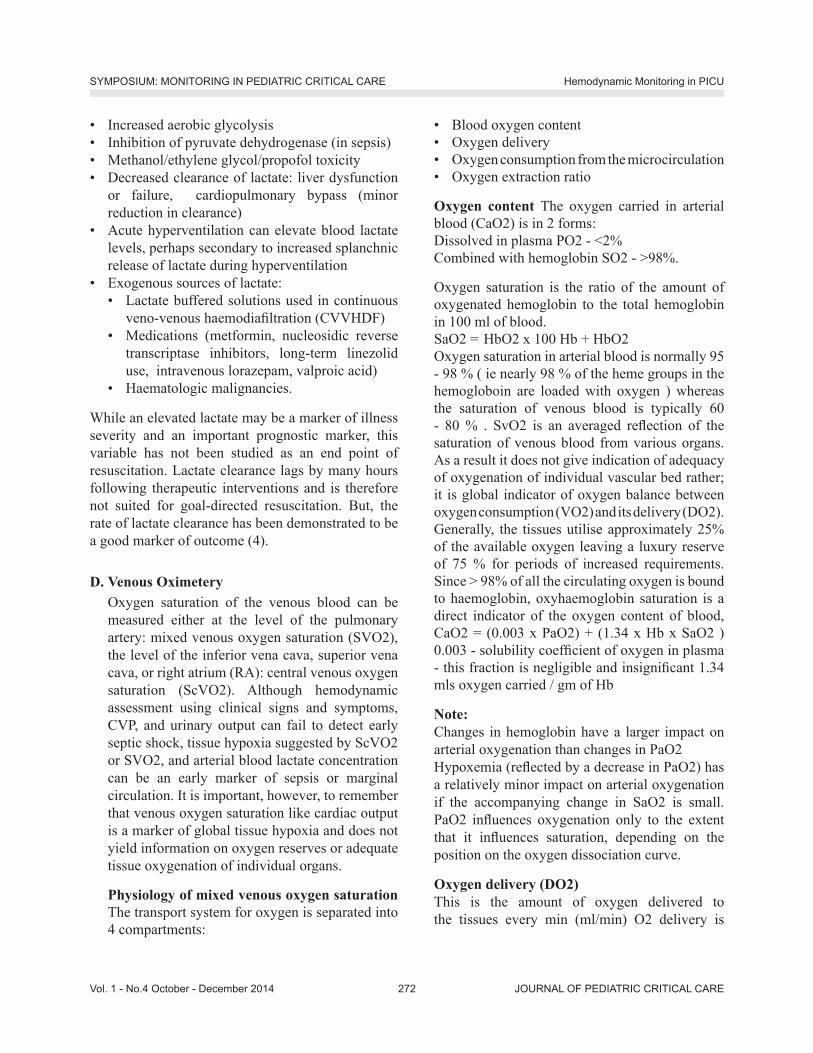
Table 3. Clinical conditions and their effects on O2 delivery and O2 consumption and on venous oximetryDecrease in SvO2/ScvO2 Increase in SvO2/ScvO2O2 consumption
O2 delivery
O2 consumption
O2 delivery
Stress painhyperthermiashivering
anemiahypoxialow CO
Analgesia sedationmechanical ventilationhypothermia
high CaO2high CO blood transfusionmaintain MAP
During exercise SvO2 normally decreases despite increasing DO2. Therefore a drop in SvO2 or ScvO2 does not necessarily mean that tissue hypoxia occurs. The magnitude of the decrease indicates the extent to which the physiological reserves are stressed. In healthy individuals, anaerobic metabolism may occur when SvO2 drops below 48%, its normal value of 75% to 30�–40%, table 4 lists the correlation between values of mixed venous oxygen saturation status of oxygen supply and demand.
Table 4. Limits of SvO2 (& ScvO2) and clinical correlatesSvO2 Value Clinical Correlate SvO2 >75% Normal extraction, O2 supply >O2
demand 75% >SvO2 >50% Compensatory extraction, Increasing
O2 demand or decreasing O2 supply 50% >SvO2 >30% Exhaustion of extraction, Beginning of
lactic acidosis O2 supply <O2 demand 30% >SvO2 >25% Severe lactic acidosis SvO2 <25% Cellular death
What is the relationship is between the (ScvO2) and (ScvO2), and can ScvO2 be substituted for SvO2? The problems with the use of mixed venous oximetry as a monitoring tool or as a therapeutic goal are: obtaining SvO2 needs insertion of a pulmonary artery catheter which requires particular skill, a lot of time and may be associated with complications. On the other hand, central venous catheter insertion is part of standard management of most critically ill patients, is an essential skill for the intensivist, and can be done rapidlyThe tip of the central venous catheter usually lies at the junction of the superior vena cava and the right atrium or in the superior vena cava. The sample drawn from here represents not the mixed venous
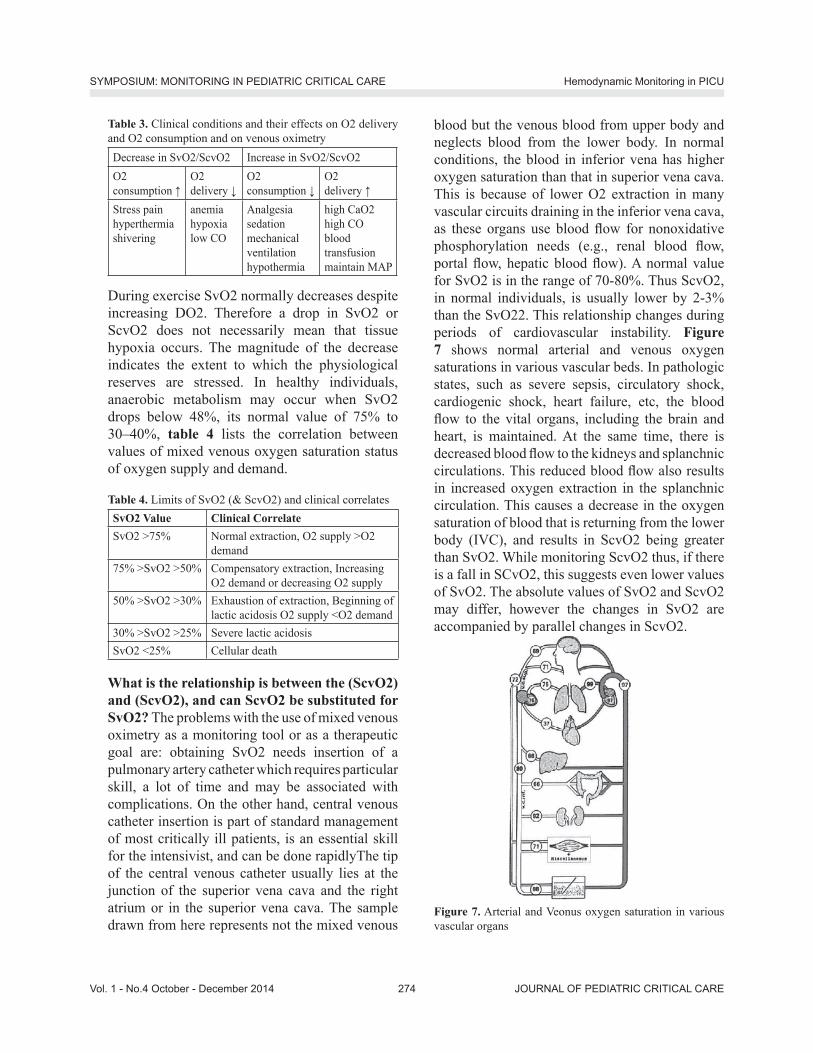
blood but the venous blood from upper body and neglects blood from the lower body. In normal conditions, the blood in inferior vena has higher oxygen saturation than that in superior vena cava. This is because of lower O2 extraction in many vascular circuits draining in the inferior vena cava, as these organs use blood ow for nonoxidative phosphorylation needs (e.g., renal blood ow, portal ow, hepatic blood ow). A normal value for SvO2 is in the range of 70-80%. Thus ScvO2, in normal individuals, is usually lower by 2-3% than the SvO22. This relationship changes during periods of cardiovascular instability. Figure 7 shows normal arterial and venous oxygen saturations in various vascular beds. In pathologic states, such as severe sepsis, circulatory shock, cardiogenic shock, heart failure, etc, the blood ow to the vital organs, including the brain and heart, is maintained. At the same time, there is decreased blood ow to the kidneys and splanchnic circulations. This reduced blood ow also results in increased oxygen extraction in the splanchnic circulation. This causes a decrease in the oxygen saturation of blood that is returning from the lower body (IVC), and results in ScvO2 being greater than SvO2. While monitoring ScvO2 thus, if there is a fall in SCvO2, this suggests even lower values of SvO2. The absolute values of SvO2 and ScvO2 may differ, however the changes in SvO2 are accompanied by parallel changes in ScvO2.
Figure 7. Arterial and Veonus oxygen saturation in various vascular organs
Hemodynamic Monitoring in PICUSYMPOSIUM: MONITORING IN PEDIATRIC CRITICAL CARE
JOURNAL OF PEDIATRIC CRITICAL CARE275Vol. 1 - No.4 October - December 2014
Clinical utility of mixed venous saturation:In the clinical setting, a decrease in SvO2 of 5% from its normal value (65%-77%) represents a signi cant fall in DO2 and/or an increase in O2 demand. The ScVO2 can be used in 2 ways: 1. Relating the absolute ScVO2 value to the OER
(eg, a low ScVO2 value [< 70%] accompanied by a high OER [> 0.25] could indicate relatively low CO)
2. Changes in ScVO2 might guide hemodynamictherapy, although it is dif cult in hyperdynamic conditions (5).
In adult patients with sepsis, restoring ScVO2 to > 70% might improve outcome (6). This might also be true for children with septic shock(7). Unfortunately, studies in septic adults have shown that many patients already have a ScVO2 value of> 70% at the start of therapy, although they might still need hemodynamic improvement.At present, the additional value of ScVO2 measurement in pediatric clinical practice is not clear. Nevertheless, ScVO2 monitoring is already incorporated in the surviving sepsis campaign algorithm for both adults and children. If ScVO2 is used, it should preferably be combined with CO measurement or markers of insuf cient oxygen perfusion such as lactate levels.Note: Occasionally, normal or increased SvO2 values are observed in a patient, who, by all other criteria, demonstrates compromised tissue oxygenation. Three etiologic mechanisms have been postulated for this observation: arterial admixture, abnormalities in distribution of blood ow, and histotoxic hypoxia.
Step 3: Preload and uid responsivenessIn the presence of hypotension, an important step is the assessment of preload and uid responsiveness. Preload is de ned as end-diastolic myocardial stretch (wall tension) and is often estimated at the bedside by a single/static measurement e.g. central venous pressure, CVP. More recently, assessment of uid responsiveness (e.g. pulse pressure variation PPV, systolic pressure variation, SPV) has been utilised in the care of critically ill patients. (Figure 9)Clinically, preload may be separated into right ventricular (RV) and left ventricular (LV) preload.
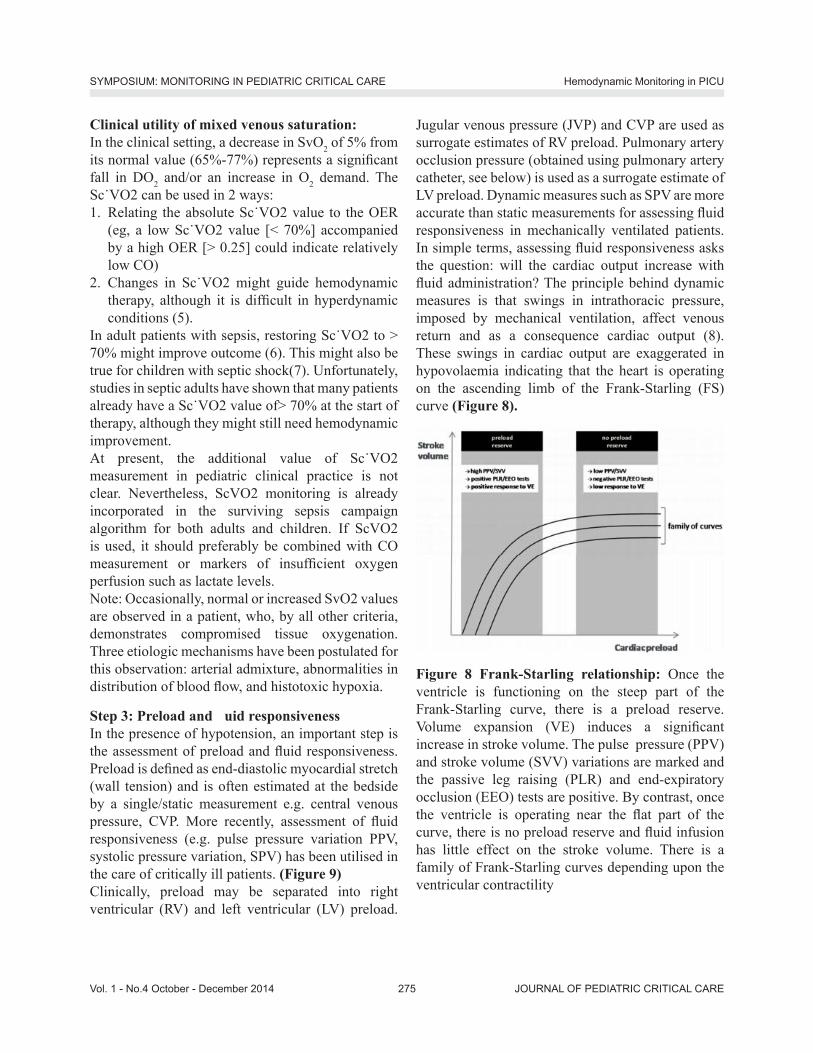
Jugular venous pressure (JVP) and CVP are used as surrogate estimates of RV preload. Pulmonary artery occlusion pressure (obtained using pulmonary artery catheter, see below) is used as a surrogate estimate of LV preload. Dynamic measures such as SPV are more accurate than static measurements for assessing uid responsiveness in mechanically ventilated patients. In simple terms, assessing uid responsiveness asks the question: will the cardiac output increase with uid administration? The principle behind dynamic measures is that swings in intrathoracic pressure, imposed by mechanical ventilation, affect venous return and as a consequence cardiac output (8). These swings in cardiac output are exaggerated in hypovolaemia indicating that the heart is operating on the ascending limb of the Frank-Starling (FS) curve (Figure 8).
Figure 8 Frank-Starling relationship: Once the ventricle is functioning on the steep part of the Frank-Starling curve, there is a preload reserve. Volume expansion (VE) induces a signi cant increase in stroke volume. The pulse pressure (PPV) and stroke volume (SVV) variations are marked and the passive leg raising (PLR) and end-expiratory occlusion (EEO) tests are positive. By contrast, once the ventricle is operating near the at part of the curve, there is no preload reserve and uid infusion has little effect on the stroke volume. There is a family of Frank-Starling curves depending upon the ventricular contractility
Hemodynamic Monitoring in PICUSYMPOSIUM: MONITORING IN PEDIATRIC CRITICAL CARE
JOURNAL OF PEDIATRIC CRITICAL CAREVol. 1 - No.4 October - December 2014 276
Central Venous PressureCentral venous pressure is the intravascular pressure in the great thoracic veins, measured relative to atmospheric pressure. It is conventionally measured at the junction of the superior vena cava and the right atrium and provides an estimate of the right atrial pressure.
Interpretation of central venous pressureNormal mean CVP is 5 to 3 mm Hg. Clinicians often assume that low values indicate hypovolemia and high values indicate hypervolemia or heart failure. However, isolated single CVP measurements are of limited utility. Instead, trends in CVP measurement over time or changes in CVP in response to therapy are better indicators of a patient�’s intravascular volume status. For example, a rapid uid bolus (eg, 500 mL) administered to a hypovolemic patient with good ventricular function will increase CVP minimally (1-2 mm Hg), with a return to baseline within 10 to 15 minutes due to circulatory re exes and stress relaxation of the vessels. The combination of a minimal rise in CVP and an associated increase in arterial blood pressure indicates a �‘�‘volume-responsive�’�’ patient who may be hypovolemic.
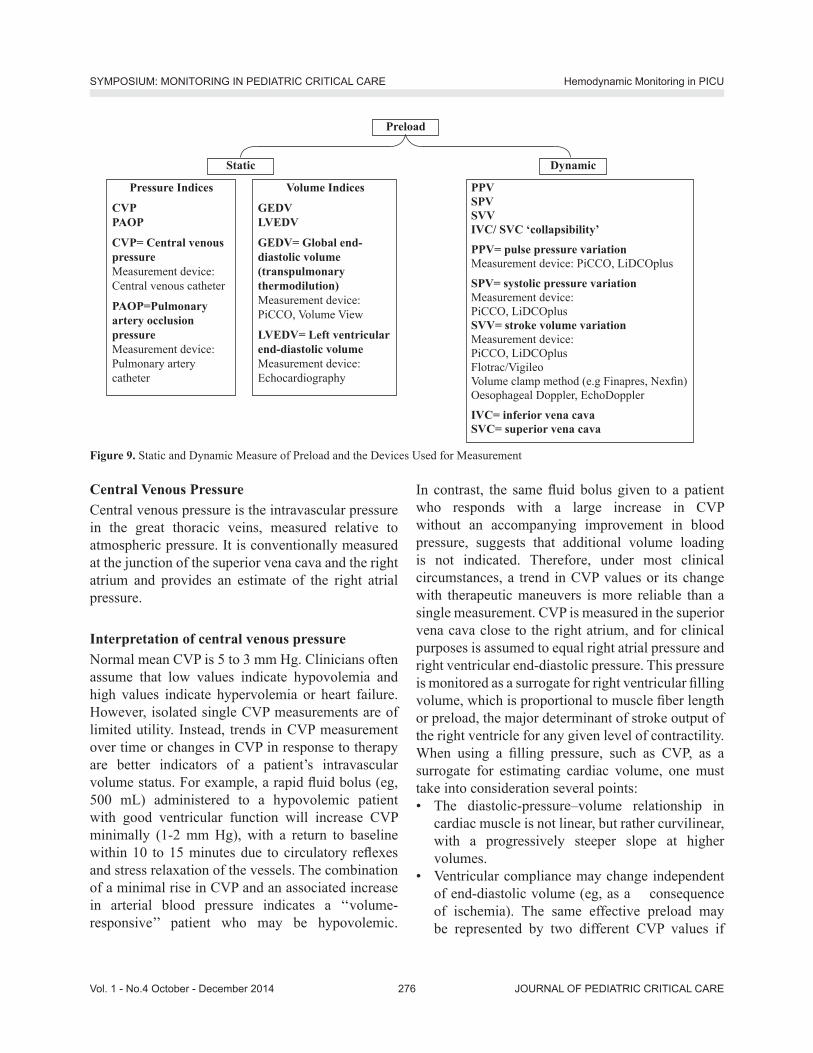
Preload
Static Dynamic
Pressure Indices
CVP PAOP
CVP= Central venous pressure Measurement device: Central venous catheter
PAOP=Pulmonary artery occlusion pressureMeasurement device: Pulmonary artery catheter
Volume Indices
GEDV LVEDV
GEDV= Global end-diastolic volume (transpulmonary thermodilution) Measurement device: PiCCO, Volume View
LVEDV= Left ventricularend-diastolic volume Measurement device: Echocardiography
PPV SPV SVVIVC/ SVC ‘collapsibility’
PPV= pulse pressure variationMeasurement device: PiCCO, LiDCOplus
SPV= systolic pressure variation Measurement device: PiCCO, LiDCOplus SVV= stroke volume variation Measurement device: PiCCO, LiDCOplus Flotrac/VigileoVolume clamp method (e.g Finapres, Nex n) Oesophageal Doppler, EchoDoppler
IVC= inferior vena cava SVC= superior vena cava
In contrast, the same uid bolus given to a patient who responds with a large increase in CVP without an accompanying improvement in blood pressure, suggests that additional volume loading is not indicated. Therefore, under most clinical circumstances, a trend in CVP values or its change with therapeutic maneuvers is more reliable than a single measurement. CVP is measured in the superior vena cava close to the right atrium, and for clinical purposes is assumed to equal right atrial pressure and right ventricular end-diastolic pressure. This pressure is monitored as a surrogate for right ventricular lling volume, which is proportional to muscle ber length or preload, the major determinant of stroke output of the right ventricle for any given level of contractility.When using a lling pressure, such as CVP, as a surrogate for estimating cardiac volume, one must take into consideration several points:�• The diastolic-pressure�–volume relationship in
cardiac muscle is not linear, but rather curvilinear, with a progressively steeper slope at higher volumes.
�• Ventricular compliance may change independent of end-diastolic volume (eg, as a consequence of ischemia). The same effective preload may be represented by two different CVP values if
Figure 9. Static and Dynamic Measure of Preload and the Devices Used for Measurement
Hemodynamic Monitoring in PICUSYMPOSIUM: MONITORING IN PEDIATRIC CRITICAL CARE

JOURNAL OF PEDIATRIC CRITICAL CARE277Vol. 1 - No.4 October - December 2014
ventricular compliance changes (Figure 10).�• CVP measurements are referenced to atmospheric
pressure, but physiologically, it is transmural pressure (the difference between intracardiac and intrathoracic-extracardiac pressure) that determines ventricular preload. Increased intrathoracic or high intrapericardial pressure (eg, high positive end-expiratory pressure levels, cardiac tamponade, large pleural effusion) may attenuate venous return but, at the same time, paradoxically increase measured CVP (Figure 11)
In summary, changes in CVP over time or in response to uid administration are more useful clinically than reliance on absolute numeric values. Central venous pressure must be considered to be the result of the complex interaction between intravascular volume status, ventricular compliance, and intrathoracic pressure.
Figure 10. Pressure�–volume relationship in a ventricle with normal or abnormal compliance. When ventricular compliance is normal, a 20-mL increase in right ventricular end-diastolic volume (RVEDV) produces a 2-mm-Hg rise in CVP (point A to point B) when RVEDV is 80 mL, but an 8-mm-Hg rise in CVP (point B to point C) when RVEDV is 100 mL. When ventricular compliance changes, as with ischemia or ventricular hypertrophy, higher lling pressures are required to generate the same RVEDV (point A to point D).
Figure 11. CVP changes during positive-pressure mechanical ventilation. Mean CVP increases at onset of each positive-pressure breath (arrows), but venous return decreases when the measured CVP increases.
Normal central venous pressure waveform morphologyThe CVP has three prominent positive waves: the �‘a,�’ �‘c,�’ and �‘v�’ waves and two prominent negative waves, the �‘x�’ and �‘y�’ descents. The �‘a�’ wave is due to atrial contraction, the �‘c�’ wave is due to the backward buckling of the tricuspid valve at the onset of systole, and the �‘v�’ wave is due to atrial lling during diastole. The �‘x�’ descent is due to the fall in atrial pressure during relaxation of the atrial contraction. The �‘y�’ descent is due to the sudden decrease in atrial pressure at the onset of diastole when the atrioventricular valve opens and allows the atrium to empty into the ventricle. (Table 5)
Table 5. Central Venous Pressure Waveform ComponentsWaveform Component
Phase of Cardiac Cycle Mechanical Event
a wave End diastole Atrial contraction
c wave Early systoleIsovolumic ventricular contraction, tricuspid motion toward the right atrium
v wave Late systole Systolic lling of the atrium
h wave Mid to late diastole Diastolic plateau
x descent Mid systole Atrial relaxation, descent of the base, systolic collapse
y descent Early diastole Early ventricular lling, diastolic collapse
Electronic measurement of central venous pressureProminent �‘a�’ and �‘v�’ waves raise the question where one should make the measurement on the tracing: at the top of the waves, the bottom, or the middle (Figure 12). As in all pressure measurements, there is an arbitrariness of the measurement; however, the
Figure 12: Normal CVP and its temporal relationship to the ECG.
Hemodynamic Monitoring in PICUSYMPOSIUM: MONITORING IN PEDIATRIC CRITICAL CARE
JOURNAL OF PEDIATRIC CRITICAL CAREVol. 1 - No.4 October - December 2014 278
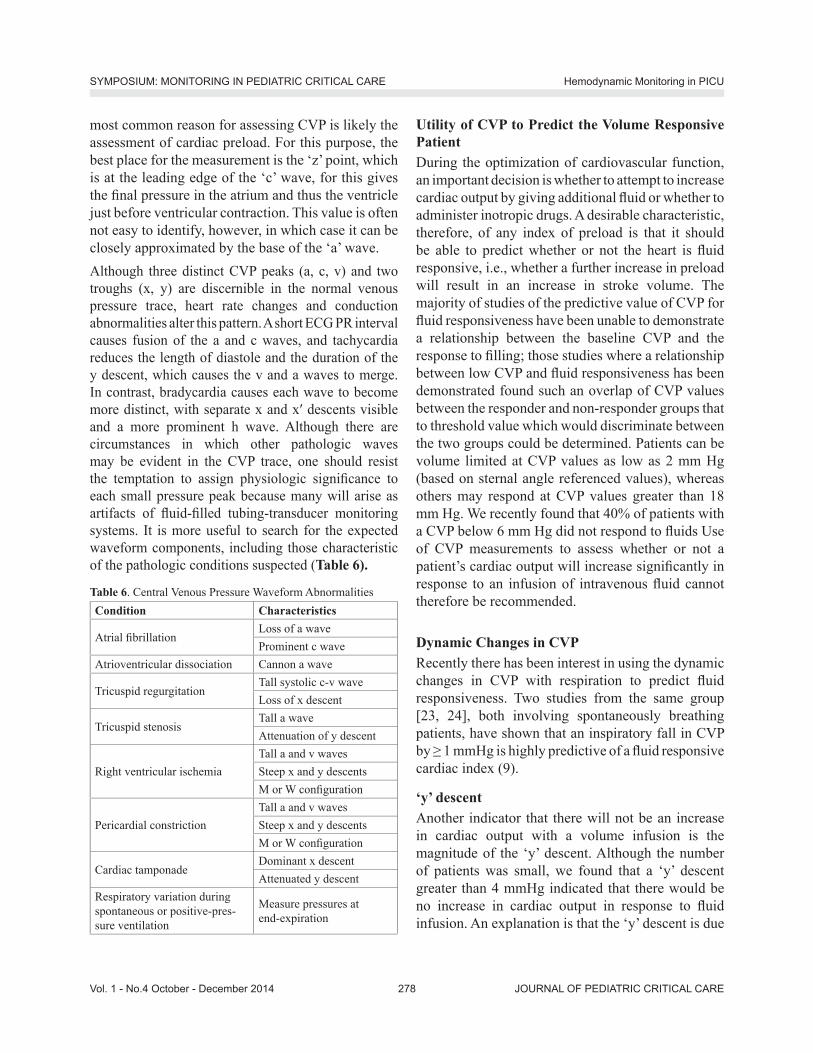
most common reason for assessing CVP is likely the assessment of cardiac preload. For this purpose, the best place for the measurement is the �‘z�’ point, which is at the leading edge of the �‘c�’ wave, for this gives the nal pressure in the atrium and thus the ventricle just before ventricular contraction. This value is often not easy to identify, however, in which case it can be closely approximated by the base of the �‘a�’ wave.Although three distinct CVP peaks (a, c, v) and two troughs (x, y) are discernible in the normal venous pressure trace, heart rate changes and conduction abnormalities alter this pattern. A short ECG PR interval causes fusion of the a and c waves, and tachycardia reduces the length of diastole and the duration of the y descent, which causes the v and a waves to merge. In contrast, bradycardia causes each wave to become more distinct, with separate x and x descents visible and a more prominent h wave. Although there are circumstances in which other pathologic waves may be evident in the CVP trace, one should resist the temptation to assign physiologic signi cance to each small pressure peak because many will arise as artifacts of uid- lled tubing-transducer monitoring systems. It is more useful to search for the expected waveform components, including those characteristic of the pathologic conditions suspected (Table 6).
Table 6. Central Venous Pressure Waveform AbnormalitiesCondition Characteristics
Atrial brillationLoss of a waveProminent c wave
Atrioventricular dissociation Cannon a wave
Tricuspid regurgitationTall systolic c-v waveLoss of x descent
Tricuspid stenosisTall a waveAttenuation of y descent
Right ventricular ischemiaTall a and v wavesSteep x and y descentsM or W con guration
Pericardial constrictionTall a and v wavesSteep x and y descentsM or W con guration
Cardiac tamponadeDominant x descentAttenuated y descent
Respiratory variation during spontaneous or positive-pres-sure ventilation
Measure pressures at end-expiration
Utility of CVP to Predict the Volume Responsive PatientDuring the optimization of cardiovascular function, an important decision is whether to attempt to increase cardiac output by giving additional uid or whether to administer inotropic drugs. A desirable characteristic, therefore, of any index of preload is that it should be able to predict whether or not the heart is uid responsive, i.e., whether a further increase in preload will result in an increase in stroke volume. The majority of studies of the predictive value of CVP for uid responsiveness have been unable to demonstrate a relationship between the baseline CVP and the response to lling; those studies where a relationship between low CVP and uid responsiveness has been demonstrated found such an overlap of CVP values between the responder and non-responder groups that to threshold value which would discriminate between the two groups could be determined. Patients can be volume limited at CVP values as low as 2 mm Hg (based on sternal angle referenced values), whereas others may respond at CVP values greater than 18 mm Hg. We recently found that 40% of patients with a CVP below 6 mm Hg did not respond to uids Use of CVP measurements to assess whether or not a patient�’s cardiac output will increase signi cantly in response to an infusion of intravenous uid cannot therefore be recommended.
Dynamic Changes in CVPRecently there has been interest in using the dynamic changes in CVP with respiration to predict uid responsiveness. Two studies from the same group [23, 24], both involving spontaneously breathing patients, have shown that an inspiratory fall in CVP by 1 mmHg is highly predictive of a uid responsive cardiac index (9).
‘y’ descentAnother indicator that there will not be an increase in cardiac output with a volume infusion is the magnitude of the �‘y�’ descent. Although the number of patients was small, we found that a �‘y�’ descent greater than 4 mmHg indicated that there would be no increase in cardiac output in response to uid infusion. An explanation is that the �‘y�’ descent is due
Hemodynamic Monitoring in PICUSYMPOSIUM: MONITORING IN PEDIATRIC CRITICAL CARE

JOURNAL OF PEDIATRIC CRITICAL CARE279Vol. 1 - No.4 October - December 2014
to emptying the atrial volume during early diastole, and a steep fall means that volume must have started on the steep part of the diastolic pressure�–volume curve (10)
Hepatojugular re uxAnother useful test is the hepatojugular re ux. The application of pressure to the abdomen can increase the return function and increase CVP. If the heart is functioning on the ascending portion of the cardiac function curve, the increase in preload will increase cardiac output, and the CVP will return to baseline in less than 10 seconds. If the heart is functioning on the at part of the function curve, however, the rise in CVP will be sustained. This test thus indicates a limitation function of the right side of the heart(11)
Pulmonary artery pressuresThough the CVP is a reasonable measure of right ventricular preload, its utility in clinical care has been limited by the concern that it may not be a true re ection of left ventricular performance. As a consequence, with the emergence of technology that allows pulmonary artery catheterisation at the bedside, there has been increasing use of right heart pressures and more importantly of the PAoP to evaluate left ventricular preload. The Swan-Ganz pulmonary artery catheter, which has been in clinical use since 1970, is a ow-directed, balloon oatation catheter that is placed without radiographic assistance in the intensive care unit. Access is obtained via the internal jugular, subclavian or femoral vein.
Why are lling pressures inaccurate measures of preload? The lack of correlation between measured CVP and PAoP on the one hand and diastolic volume and uid-responsiveness on the other, springs from a multitude of causes. Broadly they fall in one of two categories; those affecting the reliable measurement of these pressures and those related to the physiological assumptions made in measuring these pressures.a. Factors limiting reproducible measurement Inaccuracies in measuring low pressures: One of the major issues in using uid lled transducing systems for the measurement of low pressures like the CVP
and PAoP is the need to lter out all hydrostatic errors. Accurate levelling of the transducer after zeroing to the atmosphere is crucial. A small shift of 1.36 cms in the levelling of the transducer can alter the measured pressure by 1 mm Hg, which is quite relevant in the range of values being measured. (Figure 12)
Figure 12: The crucial issue in measuring low pressures such as the CVP is levelling the transducer to eliminate the in uence of hydrostatic pressure. Levelling to the top of the chamber (H) is more accurate than to the mid chest. The difference of 7cm (averaged from observations in patients) will affect measured pressures by 5 mm Hg
There seems to be confusion even amongst researchers about the physical principles underlying the measurement of pressures with uid lled external transducers especially in reference to the importance of levelling to the top of a uid column and the irrelevance of the relative position of the catheter tip. Based on these considerations one recent recommendation suggests �“that in the routine clinical setting external transducers be positioned approximately 5 cm below the left sternal border at the fourth intercostal space�” (�“H�” in Figure 12). It is also important to recognise that the external landmarks are best identi ed in supine patients. Lateral rotation of the patients, as is often done in the ICU, confounds accurate and reproducible identi cation of appropriate levelling landmarks Pleural pressure: Ventilation, spontaneous or mechanical, can cause signi cant changes in the pleural pressure (Ppl) that can in uence the measurement of vascular pressures. In order to annul the effect of these swings of Ppl, vascular pressures are measured at end exhalation (atmospheric pressure). This would be represented as the highest point in the pressure tracing during a spontaneous breathing cycle and as the lowest point during positive pressure ventilation. Unfortunately this point is far more dif cult to measure in tachypneic patients with expiratory muscle recruitment either on the ventilator or during spontaneous breathing. Sedation to minimise patient effort or maintenance of a
Hemodynamic Monitoring in PICUSYMPOSIUM: MONITORING IN PEDIATRIC CRITICAL CARE

JOURNAL OF PEDIATRIC CRITICAL CAREVol. 1 - No.4 October - December 2014 280
mechanical rate high enough to override spontaneous breathing will allow better identi cation of the end-expiratory point in critically ill patients.b. Failure of assumptions Besides the factors thatmay result in mismeasurement of vascular pressures, the poor correlation of CVP and PAoP with other estimates of preload is probably due to the lack of robustness of the physiological assumptions we make prior to measuring these pressures. Inter-individual differences may further confound the interpretation of CVP and PAoP. In conclusion for static pressure indices, it is wrong to believe that the CVP and PAoP are foolproof measures of preload, as there are many limitations to accurate measurement. A full understanding of limitations will minimize errors in estimation and interpretation and allow these parameters to be used more effectively in clinical practice.
Dynamic indices for preload assessmentIf absolute measures of cardiovascular values cannot be used effectively as parameters describing cardiovascular status or responsiveness, then more provocative maneuvers need to be employed to improve the utility of these measures. Cavallaro has proposed a useful classi cation of dynamic indices that predict volume responsiveness (8).- Group A consists of indices based on cyclic variation
in SV or SV-related hemodynamic parameters determined by mechanical ventilation induced cyclic variation in intrathoracic pressure, and includes such metrics as pulse pressure variation (PPV), its derivatives, and aortic blood ow.
- Group B is made up of indices based on cyclic variations of non-stroke volume-related hemodynamic parameters determined by mechanical ventilation, and includes vena cava diameter or ventricular pre-ejection period.
- Group C consists of indices based on preload redistribution maneuvers; mechanical ventilation is not required, and group C includes passive leg raising and Valsalva maneuvers.
Group A and B techniques are based on the physiologic interaction of the heart and lungs within a closed thoracic cavity, and rely on the phasic changes
in SV created by changing intrathoracic pressure due to positive pressure mechanical ventilation. During positive pressure inspiration, preload to the right heart is decreased because of increased intrathoracic pressure, both from compression of the vena cava (decreased venous return) and increased right atrial pressure. This decrease in right ventricular (RV) preload leads to a decrease in RV output, which subsequently leads to a decrease in pulmonary artery blood ow, LV lling, and LV output. Other mechanisms postulated to increase LV SV variation with PPV include the following changes during inspiration, caused by increased transpulmonary pressure - Increased RV afterload- Increased LV preload- Decreased LV afterload.The end result of these pressure changes is that LV SV increases, while RV SV decreases during positive pressure inspiration. The delay of pulmonary blood transit time results in decreased RV SV translating to a decreased LV SV a few heartbeats later (ie, usually during expiration). These phasic differences are exaggerated in the setting of hypovolemia for several reasons:- The under lled vena cava is more collapsible- The under lled right atrium is more susceptible to
increased intrathoracic pressureMore of the lung demonstrates the physiology of West Zones 1 and 2 (in West Zone 1 the alveolar pressure is greater then the arteriolar pressure, which is greater than venous pressure; in West Zone 2 the arteriolar pressure is greater than alveolar pressure, which is greater than venous pressure), which effectively increases RV afterload. Larger changes are seen when operating on the steeper portion of the Frank-Starling curve. This increased variation in pressures between the inspiratory phase and the expiratory phase can be used to identify hypovolemia and volume responsiveness, and is the basis for Cavallaro�’s group A and B indices, including stroke volume variation (SVV) and pulse pressure variation.
Stroke Volume VariationSVV examines the difference between the SV during
Hemodynamic Monitoring in PICUSYMPOSIUM: MONITORING IN PEDIATRIC CRITICAL CARE

JOURNAL OF PEDIATRIC CRITICAL CARE281Vol. 1 - No.4 October - December 2014
the inspiratory and expiratory phases of ventilation, and requires a means to directly or indirectly assess SV. This eliminates arterial compliance as a variable, but until recently, has required invasive monitoring such as aortic ow probes. Now, the PiCCO (Pulsion Medical Systems,Germany), LiDCO (LiDCO Group PLC, England) and FloTrac sensor (Edwards Lifesciences, USA) monitors uses pulse contour analysis through a proprietary formula to measure cardiac output and SVV. SVV of 10% has also been shown to be a speci c and sensitive predictor of uid responsiveness.
Systolic Pressure Variation ( gure 13)Systolic pressure variation (SPV) is the difference between the maximum and the minimum systolic pressure over a single respiratory cycle and can be expressed in millimeters of mercury (SPmax - SPmin) or as a percent SPV(%) = 100 X (SPmax - SPmin)/ [(SPmax + SPmin)/2]). Increased SPV was the rst of these indices to be recognized to correlate with hypovolemia and was later shown to have a sensitivity of 82%, speci city of 86%, and area under the receiver operator characteristic (ROC) curve (AUC) of 0.92, using a threshold of 8.5 mm Hg. SPV can be broken down into delta up (dUp) and delta down (dDown). These two components are calculated using a reference systolic pressure measured during an end�–expiratory pause according to the following equations:dUp = SPmax - SPref
dDown = SPref - SPmin
where SPmax is the maximum systolic pressure in a single respiratory cycle; SPref is the reference systolic pressure at end�–expiration, and SPmin is the minimum systolic pressure measured in a single respiratory cycle. dUp re ects the inspiratory increase in systolic pressure, resulting from an increase in extramural aortic pressure (increase in diastolic pressure) and an increase in LV SV. As the extramural aortic pressure component seems more signi cant in many patients,increased dUp is not a reliable indicator of uid responsiveness. dDown re ects the expiratory decrease in LV SV related to the inspiratory decrease in RV SV.
Figure 13. Arterial pressure (ART) waveform showing systolic pressure variation during positive pressure mechanical ventilation. End-expiratory systolic blood pressure (1) serves as a baseline from which an early inspiratory increase (2, Dup) can be measured, followed by a delayed decrease (3, Ddown). The large Ddown and total systolic pressure variation of nearly 30 mm Hg suggests the diagnosis of hypovolemia
Pulse Pressure Variation ( gure 14)Arterial pulse pressure is the difference between arterial systolic and diastolic pressure. This difference is in uenced by SV and the arterial compliance. Comparison of the pulse pressure during inspiration with pulse pressure during expiration demonstrates the degree to which the pulse pressure is preload-limited. As comparison is being made during a single respiratory cycle, change in arterial compliance theoretically should be minimal. Prerequisites for the adequate use of PPV include sinus rhythm, absence of spontaneous ventilatory effort (sedated), absence of right heart failure and a tidal volume
8 mL/kg. Analysis of the PPV thus can be used to predict volume responsiveness, and is expressed as a percentage: PPV(%) = 100X (PPmax - PPmin)/[(PPmax + PPmin)/2].
Figure 14: Pulse pressure variation
A PPV of 13% has been shown to be a speci c and sensitive indicator of preload responsiveness (12)
Hemodynamic Monitoring in PICUSYMPOSIUM: MONITORING IN PEDIATRIC CRITICAL CARE

JOURNAL OF PEDIATRIC CRITICAL CAREVol. 1 - No.4 October - December 2014 282
Respiratory variability of the superior and inferior vena cavaThe inferior and superior venae cavae are distensible blood vessels whose diameters and ow vary with respiration. These variations are re ected by changes in aortic ow within a few beats of the heart.In PPV, the increase in pleural pressure is transmitted fully to the right atrium, and partially transmitted to the abdomen via depression of the diaphragm, causing an overall increase in transmural pressure of the IVC. Because the IVC is distensible, this increase in pressure causes an increase in diameter of the IVC. In hypovolemic patients (ie, those on the steep part of the pressure volume curve), these diameter changes should be larger than if the IVC is full (ie, on the at part of the pressure volume curve). Unlike the IVC, the course of the SVC is mainly intrathoracic. Positive pressure ventilation then should cause a decrease in transmural pressure, and subsequent decrease in the diameter of the SVC, especially in hypovolemic patients.Barbier and colleagues determined that the distensibility index of the IVC (dIVC), de ned as (Dmax - Dmin)/Dmin and expressed as a percentage, was predictive of uid responsiveness with a sensitivity of 90% and a speci city of 90%. They concluded that a dIVC above 18% was predictive of an increase in cardiac index of at least 15% with uid loading(13). Viellard-Baron studied the effect of PPV on the SVC and the ability to predict volume responsiveness. They studied 66 mechanically ventilated patients in septic shock with acute lung injury. An SVC collapsibility index (maximum diameter on expiration �– minimum diameter on inspiration/maximum diameter on expiration) threshold of 36% allowed discrimination between non-responders and responders with sensitivity of 90% and speci city of 100%(14).Cautions Regarding Cavallaro Group A and B IndicesThere are several important caveats to keep in mind when using these dynamic indices to predict uid responsiveness:- Positive pressure, controlled ventilation is
required to obtain meaningful values for any of the Cavallaro group A or B indices. Spontaneous respiratory efforts, even when supported by the ventilator, alter the mechanics such that these
numbers lose their reliability.- Sinus rhythm is required. Arrhythmia or frequent
extra systoles result in altered SV and invalidate these tools to predict volume responsiveness.
- Many of these techniques require invasive arterial blood pressure monitoring with a catheter, and as such, they are prone to the same errors in measurement associated with invasive blood pressure monitoring: air bubbles in the catheter tubing, excessive tubing length, kinks in the tubing, excessively compliant tubing, and other errors.
- A single value never should replace clinical judgment. A high PPV value in a normotensive patient with evidence of normal tissue perfusion does not mean that person requires volume expansion.
- Further investigation of these techniques in the setting of vasoactive medications is needed.
- How extremes of ventilation (ie, low tidal volume, high respiratory rate, high positive end-expiratory pressure [PEEP]) affect group A and B indices is not yet clear. Most of the early data came from patients ventilated with at least 10 mL/kg tidal volumes.
Passive Leg Raising ( gure 15)Passive leg raising (PLR) is a form of reversible volume challenge that can be used to evaluate which patients will bene t from intravenous uid and increased preload. Elevating a patient�’s legs allows a passive transfer of blood from the lower part of the body toward the central circulation. The amount of blood transferred from the legs is variable and has been estimated to be between 150 to 750 mL (equivalent approximately to 4.3 ml/kg) depending on technique and patient. Importantly, PLR can be used in spontaneously breathing patients and in patients not in sinus rhythm. The increase in preload from the maneuver is reversed completely when the legs are returned to horizontal, meaning it is safe even in cases in which increasing blood volume may be harmful, such as ARDS. International consensus guidelines now recommend PLR to evaluate uid responsiveness in patients with shock. Using esophageal Doppler measurements of aortic blood ow as a surrogate of cardiac output, Monnet found that an increase in
Hemodynamic Monitoring in PICUSYMPOSIUM: MONITORING IN PEDIATRIC CRITICAL CARE

JOURNAL OF PEDIATRIC CRITICAL CARE283Vol. 1 - No.4 October - December 2014
aortic blood ow of at least 10% with PLR predicted volume responsiveness with a sensitivity of 97% and speci city of 94% (15). Changes in aortic blood ow were rapid (within 30 seconds of PLR) and transient. The authors found that the PLR-induced changes in aortic blood ow and arterial pulse pressure variation were predictive of volume responsiveness, but the former was more accurate than the latter. Jabot and colleagues con rmed that maximal uid shifts, and therefore better predictive value, are obtained when patients are shifted from the semirecumbent (chair) position to supine with legs elevated. Elevating the legs of a horizontal supine patient may still be helpful, but sensitivity is decreased. In the largest study to date, Thiel and colleagues measured SV changes with PLR, using a transthoracic Doppler device, they determined that a greater than or equal to 15% increase in SV with PLR predicted. Vasoconstrictors, increased intra-abdominal pressures, and elastic compression stockings all may have an impact on validity of PLR; further studies are needed to clarify these issues. It would be prudent to avoid PLR in patients with increased intracranial pressure.
Figure 15. Postural change during PLR
Respiratory Systolic Variation Test ( gure 16)The respiratory systolic pressure variation (RSVT) is a technique whereby three or four consecutive pressure-controlled breaths of increasing peak inspiratory pressures are administered over a brief period of time to intubated, sedated patients. The minimum systolic blood pressure (SBP) value following each of these breaths is recorded, and the results plotted against their respective airway pressures. A steeper slope (ie, larger decrease in SBP with increasing tidal volume) implies that the patient will be uid-responsive, whereas less of a slope
implies the patient�’s ventricles are on the at part of the Frank-Starling curve, and the patient will not increase cardiac output with uid loading.
Figure. 16. Response of the arterial blood pressure (BP) to the RSVT. Three consecutive mechanical pressure-controlled breaths are delivered with inspiratory pressures of 10, 20, and 30 cm H2O. Minimal values of SBP in response to each breath are recorded, and then the slope of the relationship between the decrease in BP and inspiratory pressure is calculated.
End-expiratory occlusion test (EEOT)It is hypothesized that upon interrupting mechanical ventilation at the end of expiration for a period of 15 sec, the preload increases due to an increase of the venous return in such a way suf cient to predict a uid response. Recently, Monnet et al. validated this hypothesis in patients with circulatory failure. Responsive patients demonstrated an increase of the pulse pressure and cardiac index with this maneuver. It is also possible to apply this test to patients with arrhythmia in whom a partial ventilatory modality is being used or in patients with ARDS with low pulmonary compliance where the use of the PPV and SVV do not present greater usefulness.
Cardiac Preload Evaluation Using Echocardiographic TechniquesIn short, using echocardiographic and Doppler parameters, low volume status is often characterized by a small inferior vena cava size and large diameter respiratory changes, large respiratory movements of the interatrial septum, small LV size, E/A ratio < 1, DTE > 150 ms, TDA > 60 ms, A/a > 1, SF > 55 %, E/Em < 8 and E/Vp < 2.5, low cardiac output and
Hemodynamic Monitoring in PICUSYMPOSIUM: MONITORING IN PEDIATRIC CRITICAL CARE

JOURNAL OF PEDIATRIC CRITICAL CAREVol. 1 - No.4 October - December 2014 284
large respiratory variations of aortic ow or stroke volume (16).Conclusion: Dynamic indices repeatedly have been shown to be superior to static measures for determining preload responsiveness in critically ill patients. The number of options for assessing uid responsiveness available to the clinician is increasing; however, few have been evaluated in large, multicenter trials. Currently there are no data on whether managing patients using dynamic indices affects outcomes. It is important to remember that preload responsiveness does not equate to needing more preload. Healthy individuals are preload-responsive, and will increase their cardiac output in response to a uid challenge, but they do not require increased blood volume. Therefore even with accurate measures of preload responsiveness, clinical judgment remains essential.
Step 4: Cardiac output monitoringCardiac output (CO) monitoring plays an essential role in critical care. Direct measurement of CO should be considered when a patient remains hypotensive despite adequate uid resuscitation or when there is ongoing evidence of global tissue hypoperfusion. There are many CO monitoring devices available today. These include devices which use methodologies based on indicator dilution, thermodilution, pulse pressure analysis, Doppler principles, and also Fick principle. Patient status dictates the type of CO monitoring required. These systems can be easily listed in order of degree of invasiveness, from the highly invasive PAC to the completely non-invasive bioimpedance/bioreactance technique and transthoracic echo-doppler.
Methods of cardiac output measurements:A. Invasive
�• Dilution techniques�• Dye dilution�• Pulmonary artery
thermodilution�• Transpulmonary
thermodilution�• Lithium dilution�• Direct - Fick
B. Non- invasive/Minimal Invasive
�• Indirest Fick using CO2
�• Bioimpedance�• Echocardiography�• Transoesophageal
Doppler�• Pulse contour analysis
In general, dilution techniques deliver a reliable CO measurement for children from 3.5 kg, but all require insertion of central venous and arterial catheters. Less invasive methods are often less reliable. At present the transpulmonary thermodilution method is considered to be the clinical gold standard for children (17). The transpulmonary thermodilution technology also offers the measurement of global enddiastolic volume, re ecting preload, and extravascular lung water (EVLW), which re ects pulmonary edema. In general, the bedside CO techniques cannot be used in patients with intracardiac and extracardiac shunts. However, the transpulmonary thermodilution technology and the modi ed CO2 Fick methods might be feasible in this situation.Nonetheless, in adults there is no evidence that the use of a pulmonary artery catheter improves morbidity and/or mortality rates (18). Likewise, the evidence that CO monitoring improves outcome in critically ill children is also missing. CO monitoring does provide the clinician with important hemodynamic information and provides a physiologic value that can be used to determine and guide therapy. Clinical studies of CO-guided hemodynamic therapy in children, therefore, are warranted.
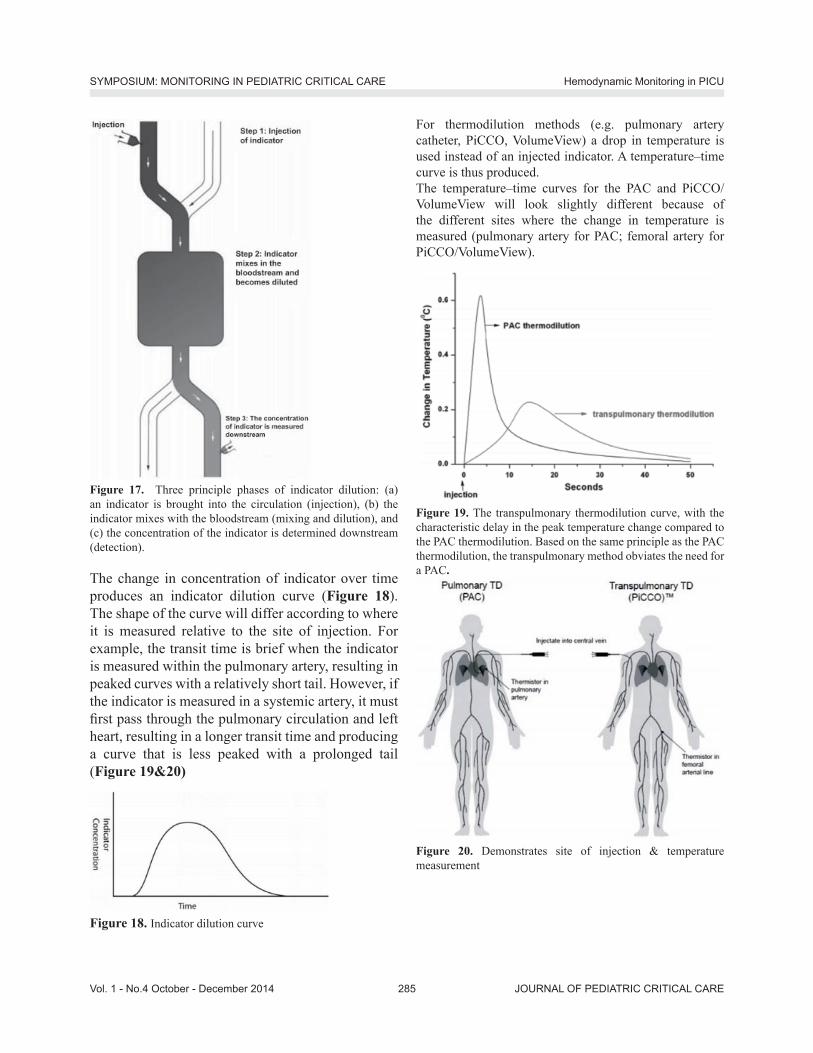
Basic principles of thermodilution and indicator dilution methods The principles underlying these techniques are essentially the same (Table 7). An indicator is injected into a central vein, and cardiac output is calculated by measuring the change in blood indicator concentration over time at a point downstream of the injection. The method for sensing the indicator varies according to the injectate and may utilize a thermistor (temperature), densitometry or oximetry (dye), or an ion-selective electrode (lithium charge) (Figure 17).
Hemodynamic Monitoring in PICUSYMPOSIUM: MONITORING IN PEDIATRIC CRITICAL CARE
JOURNAL OF PEDIATRIC CRITICAL CARE285Vol. 1 - No.4 October - December 2014
Figure 17. Three principle phases of indicator dilution: (a) an indicator is brought into the circulation (injection), (b) the indicator mixes with the bloodstream (mixing and dilution), and (c) the concentration of the indicator is determined downstream (detection).
The change in concentration of indicator over time produces an indicator dilution curve (Figure 18). The shape of the curve will differ according to where it is measured relative to the site of injection. For example, the transit time is brief when the indicator is measured within the pulmonary artery, resulting in peaked curves with a relatively short tail. However, if the indicator is measured in a systemic artery, it must rst pass through the pulmonary circulation and left heart, resulting in a longer transit time and producing a curve that is less peaked with a prolonged tail (Figure 19&20)
Figure 18. Indicator dilution curve
For thermodilution methods (e.g. pulmonary artery catheter, PiCCO, VolumeView) a drop in temperature is used instead of an injected indicator. A temperature�–time curve is thus produced. The temperature�–time curves for the PAC and PiCCO/VolumeView will look slightly different because of the different sites where the change in temperature is measured (pulmonary artery for PAC; femoral artery for PiCCO/VolumeView).
Figure 19. The transpulmonary thermodilution curve, with the characteristic delay in the peak temperature change compared to the PAC thermodilution. Based on the same principle as the PAC thermodilution, the transpulmonary method obviates the need for a PAC.
Figure 20. Demonstrates site of injection & temperature measurement
Hemodynamic Monitoring in PICUSYMPOSIUM: MONITORING IN PEDIATRIC CRITICAL CARE

JOURNAL OF PEDIATRIC CRITICAL CAREVol. 1 - No.4 October - December 2014 286
The Direct Fick MethodThe Fick method was rst described by Adolph Fick in 1870(19), who applied the concept of mass balance to the measurement of blood ow. As such, it remains one of the most technically challenging, yet useful techniques for measuring cardiac output, not least because of its applicability to patients with anatomic shunts. The Fick principle involves adding (or removing) an indicator and measuring the change in indicator concentration upstream and downstream of the point of indicator addition (or removal); ow can then be calculated via the formula:Flow (volume/time) = indicator added (mass/time)/change in indicator concentration (mass/volume)For calculation of cardiac output, the most common measured indicator is oxygen consumption, although carbon dioxide production can also be utilized. A valuable aspect of the Fick principle is that it allows cardiac output to be calculated separately for the systemic (Qs) and pulmonary (Qp) circulations. The Fick technique requires a method for measuring oxygen consumption or carbon dioxide production, as well as access to the arterial and mixed venous circulations. Traditional methods for measuring oxygen consumption, such as the Douglas bag or
Table 7. Dilution methods for determining cardiac outputMethod Advantages Disadvantages Additional variables measuredThermodilution: (pulmonary artery sampling)
Proven track record; semicontinuous mode available
Variations in cardiac output with respiratory cycle; dif cult access in small patients; inaccurate at low ow; low but signi cant morbidity: infection, bleeding, catheter knotting
Pulmonary pressure; wedge pressure; mixed venous oxygen saturation
Thermodilution: Transpulmonary (systemic artery sampling)
Easy access in small patients; repeatable; continuous if device is combined with arterial pulse contour method (combination commercially available)
Requires dedicated arterial line, safe length of insertion time unknown, frequent recalibration required if used in conjunction with pulse contour method
Intrathoracic blood volume (preload); cardiac function index (contractility); extravascular lung water; stroke volume variability (if used with pulse contour method)
Dye dilution Accurate Sequential measurements limited by dye clearance; commercial availability of dye and devices
Lithium chloride dilution
Utilizes preexisting central venous and arterial lines; continuous if device is combined with arterial pulse contour method (combination commercially available)
Sequential measurements limited by lithium clearance; theoretical risk of toxicity; requires blood sample with each measurement; unlicensed in <40 kg; frequent recalibration required if used in conjunction with pulse contour method
Stroke volume variability (if used with pulse contour method)
spirometry, preclude measurement in the intensive care environment. However, these techniques have been advanced with portable metabolic monitors and/or mass spectrometry. As the Fick technique is vulnerable to many sources of error at each measurement step, attention to detail is vital.
Continuous cardiac output measurement: Minimal/Non-invasive: Arterial pressure waveform analysisThe PiCCO and LiDCO and Flotrac/Vigileo systems provide continuous CO m easurement using the arterial pressure waveform. These systems analyse the arterial waveform and use algorithms to calculate the CO. The newer versions LiDCO (LiDCOrapid) and Flotrac/Vigileo do not require calibration (20). The main advantage of the arterial pressure trace-derived systems is that they are less invasive than the PAC. However they have weaknesses which limit their use in certain clinical situations.The way in which the arterial pressure waveform is analysed is slightly different with each device (Figure 21). PiCCO analyses the systolic portion of the arterial waveform. LiDCO analyses the waveform with what is called pulse power analysis. Flotrac/
Hemodynamic Monitoring in PICUSYMPOSIUM: MONITORING IN PEDIATRIC CRITICAL CARE

JOURNAL OF PEDIATRIC CRITICAL CARE287Vol. 1 - No.4 October - December 2014
Vigileo analyses the waveform 100 times/second over 20 seconds, capturing 2000 data points for analysis. This is then incorporated into a proprietary formula to calculate CO.
Figure 21. Demonstrates technologies to assess arterial waveform analysis
Echocardiography and Doppler technology to measure cardiac output Echocardiography has become an important diagnostic and monitoring tool in critical care. Cardiac output can be measured by 2D echocardiography and Doppler technology, using either a transthoracic (TTE) or transoesophageal (TOE) technique. TTE has the advantage of being rapid and non-invasive, but images may sometimes be limited in ventilated ICU patients. TOE provides high quality images but is more invasive than TTE. Stroke volume is calculated using Doppler to measure the velocity time integral (VTi) of the ow signal at a given site, and 2D echo to measure the cross sectional area of the same site. These measurements of ow and diameter are usually obtained at the level of the left ventricular out ow tract (LVOT), and then used to calculate CO. Many modern machines will compute this information automatically when measurements are entered. Echo-Doppler calculation of CO is operator dependent, and continuous measurement of CO cannot be performed using this technique.Continuous transoesophageal echocardiography is a miniaturised TOE probe which allows continuous
qualitative haemodynamic assessment from a transverse plane, allowing visual assessment of cardiac performance and uid status. It consists of a disposable probe (licensed for use up to 72 hours) which is connected to the echocardiography machine. Although smaller than a conventional TOE probe, some of the contraindications to TOE use may still apply with this device. There has been limited evaluation of this technique to date in critically ill patients. Oesophageal Doppler monitoring Oesophageal Doppler (ODM) measures blood ow velocity in the descending aorta by using a Doppler transducer at the tip of a probe, which is inserted into the oesophagus via the mouth or nose.
CO2 rebreathingCO2 rebreathing systems, based on the Fick principle, use a CO2 sensor, a disposable air ow sensor and a disposable rebreathing loop. CO2 production is calculated from minute ventilation and its CO2 content, and the arterial CO2 content is estimated from end-tidal CO2. Partial rebreathing reduces CO2 elimination and increases the end-tidal CO2. By combining measurements taken during and without rebreathing, venous CO2 content can be eliminated from the Fick equation. However, intrapulmonary shunting of blood and rapid hemodynamic changes affect the accuracy of the measurement, so that this technique is not considered to be reliable in acutely ill patients.
Bioimpedance and bioreactanceBioimpedance is based on the fact that the conductivity of a high-frequency, low-magnitude alternating current passed across the thorax changes as blood ow varies with each cardiac cycle. These changes can be measured using electrodes placed on a patient�’s chest and used to generate a waveform from which cardiac output can be calculated. Bioreactance has developed out of bioimpedance and measures changes in the frequency of the electrical currents traversing the chest, rather than changes in impedance, potentially making it less sensitive to noise. These techniques are non-invasive and
Hemodynamic Monitoring in PICUSYMPOSIUM: MONITORING IN PEDIATRIC CRITICAL CARE

JOURNAL OF PEDIATRIC CRITICAL CAREVol. 1 - No.4 October - December 2014 288
can be applied quickly. They have been used for physiological studies in healthy individuals and may be useful in perioperative applications, but are less reliable in critically ill patients. Electrical interference may also occur in the ICU environment.
Volume clamp methodThis newer non-invasive technique uses an in atable nger cuff. Photoelectric plethysmography in combination with a volume clamp technique (in atable nger cuff) is used to produce a brachial arterial waveform, allowing continuous CO to be measured. Data to date on the usefulness of this technique in the critically ill is limited.
Step 5: Assessment of cardiac contractilityAssessing cardiac contractility is important in establishing the aetiology of shock, and in guiding further therapy. For example, a patient in cardiogenic shock with poor LV function is likely to require inotropy with adrenaline or dobutamine infusion, whereas a septic patient with a hyperdynamic heart is more likely to bene t from a vasopressor infusion such as noradrenaline.
EchocardiographyCardiac performance may be rapidly assessed at the bedside using transthoracic echocardiography (TTE). A visual assessment of LV function will often reveal any signi cant abnormality. Formal estimation of LV contractility can be performed by measuring ejection fraction (EF). The EF is the percentage of LV diastolic volume ejected with each heart beat (normal >55%)(Table 8).EF (%) = {(EDV- ESV)/ EDV} x 100
Table 8. Left Ventricular ejection fraction rangeEjection fraction (EF) Value %Normal 55% Mild impairment 45�–54% Moderate impairment 30�–44%Severe impairment <30
The utility of echocardiography as a haemodynamic monitor is far greater than assessment of LV function.
It is the test of choice in critically ill hypotensive patients to identify or exclude a �‘cardiac�’ cause of shock as it is portable to the bedside, safe and can provide an immediate diagnosis. Left ventricular contractility can also be estimated by analysis of the arterial waveform. It is derived from the maximum speed of the arterial pressure curve (dP/dtmax) during the ejection phase.Echocardiography should not be viewed simply in the context of cardiac output or ejection fraction. It can provide an assessment of preload and diagnose potentially reversible ventricular or valvular pathologies, cardiac tamponade, or massive pulmonary embolism or congenital shunt defects.
Step 6: Assessment of microcirculation / regional tissue perfusionMeasuring the adequacy of microcirculatory blood ow as a direct indicator of the success of the cardiovascular system to provide adequate oxygen and nutrients to the cells, can be regarded as an important extension of the measurement of systemic hemodynamic variables [21,22]. However several issues need to be addressed. These are:1. The reliability and reproducibility of the
measurement2. The identication of the most relevant
microcirculatory parameters which need to be determined; and
3. The prognostic value of these parameters inguiding therapy
A. Orthogonal polarisation spectral (OPS) and sidestream dark eld (SDF) imaging devices: Orthogonal polarization spectral (OPS) imaging is the rst hand-held imaging device that allows bedside visualization of the microcirculation. OPS imaging is based on the optical technique introduced by Slaaf et al, in which green polarized light is used to illuminate the tissue area of interest, which at the bedside is usually the buccal or sublingual mucosa. The green light is absorbed by hemoglobin within the red blood cells (RBCs) in the microcirculation. The re ected light is detected by an orthogonally placed analyzer which lters out surface re ections in order to
Hemodynamic Monitoring in PICUSYMPOSIUM: MONITORING IN PEDIATRIC CRITICAL CARE

JOURNAL OF PEDIATRIC CRITICAL CARE289Vol. 1 - No.4 October - December 2014
produce a high contrast re ected light image of owing RBCs within the microcirculation. Sidestream dark eld (SDF) imaging is the improved successor to OPS imaging and is based on the dark eld illumination technique introduced by Sherman et al. In this technique, the micro circulation can be observed without the need to use transillumination (Figure 22). Instead SDF imaging uses a stroboscopic light emitting diode ring-based imaging device so it provides better image quality of the microcirculation.
Figure 22. Sidestream dark- eld (SDF) imaging: This imaging technique is an improved method of observing the human microcirculation at the bedside. (a) SDF imaging consists of a light guide surrounded by green light-emitting diodes (LEDs; wavelength 530 nm) whose light penetrates the tissue and illuminates the microcirculation. The light is absorbed by hemoglobin of the red blood cells and scattered by leukocytes. A magnifying lens projects the image onto a video camera. Placed on organ surfaces, SDF imaging provides crisp images of the red blood cells and leukocytes owing through the microcirculation. (b) As an example of the improved image quality provided by SDF imaging, the sublingual microcirculation of a volunteer is shown, with a magni ed inset showing several leukocytes.
These techniques can be used only on organs covered by a thin epithelial layer. In the sublingual area, which is the area that has been investigated most, capillaries and venules of variable size (resolution is 2�–3 lm) can be visualized; arterioles are usually not visualized because they are located in deeper layers. Red blood cells are identi ed as black bodies and tissue perfusion can be characterized in individual vessels.What can be measured with these techniques and what is important? Different variables can be measured, including vascular density, heterogeneity of perfusion, and microvascular blood ow (Table 9). Several limitations should be acknowledged. Secretions and movement artifacts may impair image quality. In addition, movement artifacts can spuriously interrupt ow in some microvessels. Finally, the investigation of the sublingual area is only feasible in sedated or cooperative patients. It is also impossible to evaluate the sublingual microcirculation in hypoxemic patients who are being treated with noninvasive mechanical ventilation.
B. NIRS (Near-infrared spectroscopy)Near-infrared spectroscopy (NIRS) is a technique that utilizes near-infrared light to measure chromophores (oxy- and deoxyhemoglobin, myoglobin, and cytochrome aa3) in tissues. The fractions of oxy- and deoxyhemoglobin are used to calculate tissue O2 saturation (StO2). In addition, total light absorption is used to compute total tissue hemoglobin (HbT) and the absolute tissue hemoglobin index (THI), two indicators of blood volume in the region of microvasculature sensed by the probe.According to Beer�’s law, the NIRS signal is limited to vessels that have a diameter less than 1 mm (arterioles, capillaries, and venules), but, as 75% of the blood in a skeletal muscle is venous, NIRS StO2 measurements mostly represent local venous hemoglobin O2 saturation. This represents the aggregate of O2 saturations in the sampling volume and this technique is not suitable in conditions of heterogeneous blood ow. Indeed, even though StO2 is slightly lower in septic patients compared to healthy volunteers, there
Hemodynamic Monitoring in PICUSYMPOSIUM: MONITORING IN PEDIATRIC CRITICAL CARE

JOURNAL OF PEDIATRIC CRITICAL CAREVol. 1 - No.4 October - December 2014 290
is a huge overlap between the groups. StO2 also differs from ScvO2 saturation in sepsis.The analysis of changes in StO2 during a brief episode of forearm ischemia enables quanti cation of microvascular dysfunction. This technique, which can easily be repeated, is particularly promising as it provides quantitative information on microvascular function within a few minutes. One should bear in mind that NIRS does not measure microcirculatory blood ow, making interpretation of the absolute StO2 value in terms of tissue oxygenation dif cult. As StO2 represents the balance between O2 delivery and O2 consumption, any change in StO2 can re ect a change in ow in the same direction and/or a change in metabolism in the opposite direction. More importantly, proportional changes in ow and metabolism may be associated with unchanged StO2.
Figure 23. Portable near infrared spectroscopy (NIRS) monitor in use. The probe is placed over the thenar eminence.
Figure 24. Schematic illustration of the StO2 changes during VOT.In addition, the vasoreactivity test evaluates a different aspect of microvascular function than ow: it evaluates microvascular reserve more than actual microvascular perfusion (23). NIRS-derived measurements are in uenced by adipose tissue thickness as well as the presence of edema; hence, in the majority of studies, the thenar eminence has been used because the thickness of skin and adipose tissue covering this muscle is less in uenced by any increase in uid content or body mass index (Figure 23&24). The in uence of temperature and vasoactive substances on NIRS-derived variables obtained in the thenar eminence need to be evaluated. Likewise, the relationship between peripheral and more central microvascular beds need to be further studied in critically ill patients. Finally, NIRS devices vary in
Table 9: Parameters for the evaluation and scoring of the microcirculation by SDF.Microcirculation parameter
Information provided Measurement
Microvascular ow index (MFI)
Perfusion quality (for small, medium, and large vessels)
The image is divided into four quadrants; a number is assigned for each quadrant according to the predominant type of ow (0 = no ow; 1 =intermittent; 2 = sluggish; 3 = continuous). The MFI results from the averaged values
De Backer score (n/mm)
Vessel density The image is divided by 3 vertical and 3 horizontal lines; the De Backer score is calculated as the number of vessels crossing the lines divided by the total length of the lines
Total vessel density (mm/mm2)
Vessel density (for small, medium, and large vessels)
Total length of vessels is divided by the total surface of the analyzed area
Perfused vessel density (mm/mm2)
Functional vessel density (for small, medium, and large vessels)
Total length of perfused vessels (sluggish or continuous) is divided by the total surface of the analyzed area
Proportion of perfused vessels (%)
Perfusion quality (for small, medium, and large vessels)
100 number of perfused vessels is divided by thetotal number of vessels
Flow heterogeneity index (FHI)
Perfusion heterogeneity The difference between the highest MFI and the lowest MFI is divided by the mean MFI. MFI is intended as the averaged MFI of each site
*Vessel diameter classi cation: <20 = small; 20�–50 = medium; 50�–100 = large. Three or ve sites are evaluated. MFI of small vessels can be calculated separately.
Hemodynamic Monitoring in PICUSYMPOSIUM: MONITORING IN PEDIATRIC CRITICAL CARE


JOURNAL OF PEDIATRIC CRITICAL CAREVol. 1 - No.4 October - December 2014 292
14. Vieillard-Baron A, Chergui K, Rabiller A, et al. Superior vena caval collapsibility as a gauge of volume status in ventilated septic patients. Intensive Care Med 2004; 30:1734�–9.
15. Monnet X, Rienzo M, Osman D, et al. Passive leg raising predicts uid response in the critically ill. Crit Care Med 2006; 34(5):1402�–7.
16. Jardin F. Ventricular interdependence: how does it impact on hemodynamic evaluation in clinical practice? Intensive Care Med 2003; 29:361-363.
17. Tibby S, Transpulmonary thermodilution: nally, a gold standard for pediatric cardiac output measurement, Pediatr Crit Care Med, 2008;9:341-2.
18. Shah MR, Hasselblad V, Stevenson LW, et al. Impact of the pulmonary artery catheter in critically ill patients: meta-analysis of randomized clinical trials. JAMA. 2005; 294(13): 1664 �–1670
19. Fick A. Ueber die Messung des Blutquantums in den
Herzventrikeln [German]. Sitzungsberichte der Physiologisch -Medizinosche Gesellschaft zu Wuerzburg 1870;2:16.
20. Pittman J, Bar-Yosef S, SumPing J, et al. Continuous cardiac output monitoring with pulse contour analysis: a comparison with lithium indicator dilution cardiac output measurement. Crit Care Med 2005; 33:2015�–21.
21. De Backer D, Hollenberg S, Boerma C, et al. How to evaluate the microcirculation: report of a round table conference. Crit Care 2007;11:R101.
22. Sakr Y, Dubois MJ, De Backer D, Creteur J, Vincent JL. Persistent microcirculatory alterations are associated with organ failure and death in patients with septic shock. Crit Care Med 2004; 32: 1825-31.
23. Gómez H, Torres A, Polanco P, et al. Use of non-invasive NIRS during a vascular occlusion test to assess dynamic tissue O(2) saturation response. Intensive Care Med 2008; 34:1600-7.
Hemodynamic Monitoring in PICUSYMPOSIUM: MONITORING IN PEDIATRIC CRITICAL CARE