mosfet amplifier - learn-ltspice.weebly.comlearn-ltspice.weebly.com/.../mosfet_amplifier.pdf ·...
TRANSCRIPT

MOSFET AMPLIFIER
I shall chose one of the MOSFETs from the list of LTSpice library. It is IRLML6346, an International Rectifier device and the data sheet can be found here:
http://www.irf.com/product-info/datasheets/data/irlml6346pbf.pdf
Key features of the MOSFET : IRLML6346
1. Maximum Drain-Source Voltage (VDS): 30V2. Gate Threshold Voltage (VGS)(TH): 0.5 – 1.1 V3. Maximum Drain Current (ID): 3.4 A4. Maximum Power Dissipation (PD): 1.3 W
Sajjad Haidar

Transconductance
Let us use LTSpice to find the transfer characteristics of the MOSFET. To do this the following schematic is drawn:
In the EDIT SIMULATION window, we may use the Directive, which varies V1 fro 0 to 1.5V with step size 0.01V
VGS
ID
Pressing RUN button gives us
From this graph we will find out the transfer characteristics,More commonly known as Transconductance: ∆𝐼𝐷
∆𝑉𝐺𝑆 Sajjad Haidar

Transconductance
DVGS
DID
We can see that the transconductance, gm varies as VGS varies. The Higher the drain current, the higher is gm
∆𝐼𝐷∆𝑉𝐺𝑆
Transconductance, gm =
0.8 0.9 1.0 1.1 1.2 1.3
0.0
0.2
0.4
0.6
0.8
1.0
Dra
in C
urr
en
t (I
D)
Gate-Source Voltage (VGS
)
VGS
vs ID
0
1
2
3
4
5
VGS
vs gm
Tra
nsco
nd
ucta
nce
(g
m )
This can be more clearly shown below:
𝐼𝐷 = 𝐾 𝑉𝐺𝑆 − 𝑉𝑇𝐻2
𝑔𝑚 =𝑑 𝐼𝐷𝑑 𝑉𝐺𝑆
= 2𝐾 𝑉𝐺𝑆 − 𝑉𝑇𝐻
𝑔𝑚 =2 𝐼𝐷
𝑉𝐺𝑆 − 𝑉𝑇𝐻Sajjad Haidar

MOSFET Amplifier Biasing
ID
VD = 2.5 V
IS
I1
I1
Let us consider, we are using 5V supply voltage (V1). We are going to
use this circuit diagram. First we have to choose the Value of R3. Let
us consider VD =2.5 V, to get the maximum output swing. So, voltage
drop across R3 = V1-2.5 V = 2.5V. Current Id should be less than that
can be handled by the MOSFET. Let us consider the value of R3=100
Ohm. So Id = 2.5/100 A = 0.025 A = 25 mA. Source current Is is equal
to the drain current (25mA). For R4, less value will give us higher
gain, at the expense of higher instability. Let us take this value, R4 =
20 Ohm. For Is = 25 mA, voltage drop (Vs) at R4 = 25 mAx20 = 0.5V.
As MOSFET Gate acts like a capacitor, steady state gate current is
zero, we can take the values of R2 and R1 several kilo Ohms, or
hundreds of kilo Ohms. R1 and R2 are to be used as a voltage divider,
with Vg to be equal to Vs +Vth. From the previous transconductance
curve, we found Vth ~ 1V. So, Vg = 1+0.5 V = 1.5 V. If we take, R2
=100K, R1 becomes 42.85K, we may take 43K.
VG = VTH + 0.5 V
Key Considerations:
1. Input impedance of MOSFET is very high, so
R1 and R2 could be of high values (~ 100K)
2. R3 should be chosen considering the current
and power handling capability of the MOSFET
Sajjad Haidar

Simulated Results
VD
VS
VG
The simulated results are shown, these
closely matches that have been calculated.
Simulation also shows the steady state
power dissipation:~50mW.
5V
50mA
VD
ID
The result can also be shown
graphically using load line as shown
Sajjad Haidar

Amplifier: Input Coupling
After the biasing is done, then comes the matter of coupling
AC signal to the amplifier and coupling a load at the output.
For this we need two capacitors, one coupling signal to the
Gate of the MOSFET, and the other at the Drain coupling
the load as shown in the circuit. Let us first consider that
the input signal is of low frequency like audio frequency
(20 Hz – 20 kHz); for this range the MOSFET Gate
capacitance won’t affect. The input coupling circuit will
look like:
AC simulation
Gives us this
Sajjad Haidar

Amplifier: Output Coupling
Amplifier-output equivalent circuit can shown as
For LTSpice simulation we consider
Frequency response
Sajjad Haidar

Amplifier - Gain
Small signal equivalent circuit is shown here
𝑉𝑜 = 𝑔𝑚. 𝑣𝑔𝑠 .𝑅𝐿
𝑊ℎ𝑒𝑟𝑒, 𝑅𝐿 = 𝑅3 ]]𝑅1
𝑉𝑖 = 𝑣𝑔𝑠 + 𝑔𝑚. 𝑣𝑔𝑠. 𝑅4
𝐴𝑣 =𝑣𝑜𝑣𝑖=
𝑔𝑚 𝑣𝑔𝑠 𝑅𝐿
𝑣𝑔𝑠 1 + 𝑔𝑚 𝑅4=
𝑔𝑚 𝑅𝐿1 + 𝑔𝑚 𝑅4
(vo is the output and vi is the input voltage )
Voltage gain Av
We can find out the value of gm at the biasing point (25 mA)
Using the transconductance curve
gm = DID / DVGS = 0.8 A/V
DID
DVGS
Sajjad Haidar
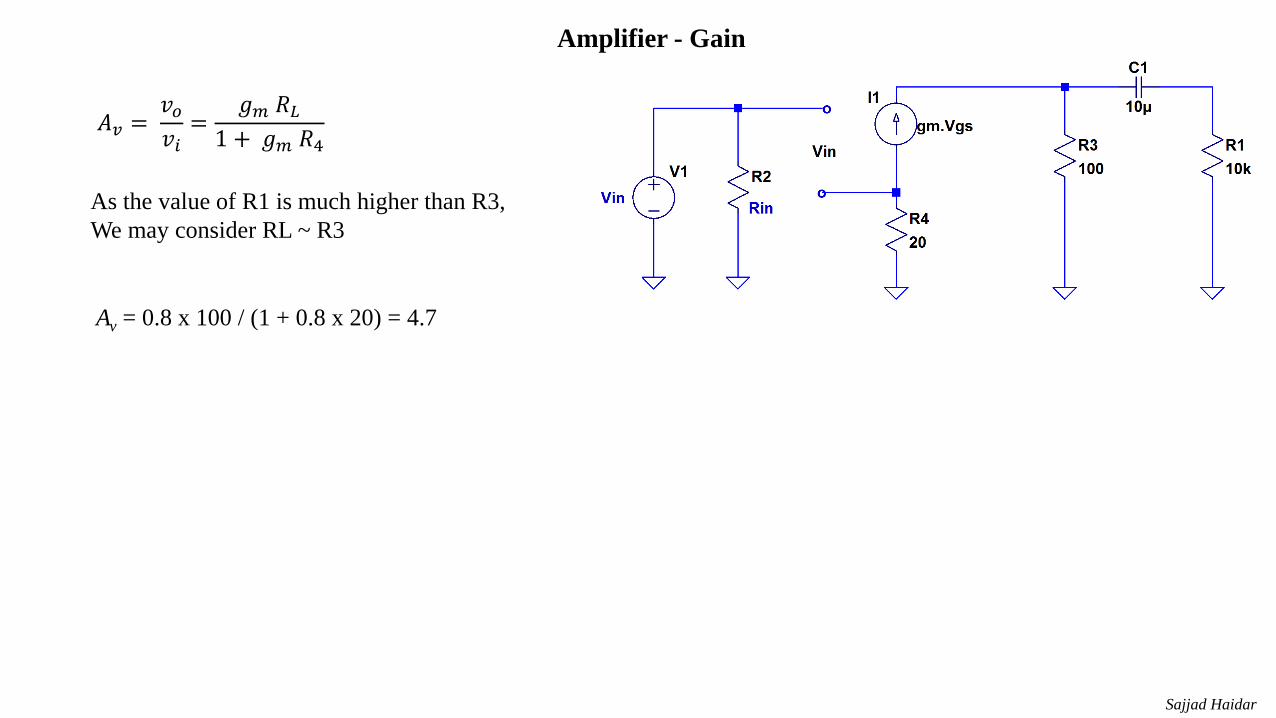
Amplifier - Gain
𝐴𝑣 =𝑣𝑜𝑣𝑖=
𝑔𝑚 𝑅𝐿1 + 𝑔𝑚 𝑅4
As the value of R1 is much higher than R3,
We may consider RL ~ R3
Av = 0.8 x 100 / (1 + 0.8 x 20) = 4.7
Sajjad Haidar

Amplifier – Gain: Simulation Results
Simulation was run with input peak voltage 0f 100 mV and
frequency of 1kHz. Simulation results are shown below, input
being red and output being blue lines.
From these waveforms gain can be found:
Av = 472/102 = 4.63
This is close to that of the calculated value
Sajjad Haidar

Gain Enhancement Using Source Bypass Capacitor
𝐴𝑣 =𝑣𝑜
𝑣𝑖=
𝑔𝑚 𝑅𝐿
1+ 𝑔𝑚 𝑅4≈ 𝑔𝑚 𝑅𝐿 = 0.8 x 100 = 80
Equivalent circuit with bypass capacitor C3. At
frequencies above tens of Hz, C3 nearly shorts the
resistor R4 out.
Voltage gain becomes:
Sajjad Haidar

Simulation With Bypass Capacitor
As the voltage gain becomes 80, with the same input signal level (0.1V), the output is clipped as shown
above. To get distortion less waveform we have to decrease the input level from 0.1 V to lower level.
Sajjad Haidar

Simulation With Bypass Capacitor
Decreasing the input level to 0.01 V(10 mV), gives a good looking waveform at the output with a gain of 46. This
discrepancy between the calculated value and the simulated value can be explained. We took input frequency 1kHz, at this
frequency still the capacitive reactances (1/ wc) are not sufficiently gone down. At 5kHz, the gain will reach 75, which can
be easily simulated. Sajjad Haidar

Simulation : Large Signal Input
0.8 0.9 1.0 1.1 1.2 1.3
0.0
0.2
0.4
0.6
0.8
1.0
Dra
in C
urr
en
t (I
D)
Gate-Source Voltage (VGS
)
VGS
vs ID
0
1
2
3
4
5
VGS
vs gm
Tra
nsco
nd
ucta
nce
(g
m )
ID
If the input signal level is increased from 10 mV to ~ 45 mV, we get
different amplification for positive and negative swing for the output
signal. This is because at higher drain current transconductance goes
higher
Sajjad Haidar