morphological and physiological traits influencing biomass productivity in short-rotation coppice...
TRANSCRIPT

Morphological and physiological traits influencingbiomass productivity in short-rotation coppicepoplar
A.M. Rae, K.M. Robinson, N.R. Street, and G. Taylor
Abstract: Fast-growing hybrid poplar (Populus spp.) have potential as a short-rotation coppice crop grown for biomassenergy. This work identifies traits for fast growth studied in an American interspecific pedigree derived from Populustrichocarpa Torr. & A. Gray × Populus deltoides Marsh. grown in the United Kingdom for the first time. The biomassyield after the first coppice rotation was estimated to range from 0.04 to 23.68 oven-dried t·ha–1·year–1. This greatrange suggests that genotypes from this pedigree may be used to understand the genetic basis of high yield inshort-rotation coppice, which would be advantageous for informing breeding programs for biomass crops. Relationshipsbetween stem, leaf, cell traits, and biomass yield were investigated. Partial least-squares analysis was used to order thetraits by importance. The traits most influential on biomass were maximum stem height throughout the growing season,basal diameter, number of stems, and number of sylleptic branches, which showed high heritability, indicating excellentpotential for breeding programs. The leaf traits, leaf area, number of leaves on the leading stem, and plastochron indexwere also associated with an increase in biomass, leading to a better understanding of this trait.
Résumé : Les hybrides de peuplier (Populus spp.) à croissance rapide ont les qualités requises pour la production entaillis sur courte révolution de biomasse à des fins énergétiques. Les auteurs de l’étude ont identifié des caractères liésà la croissance rapide chez une descendance américaine interspécifique provenant d’un croisement entre Populus tricho-carpa Torr. & A. Gray × Populus deltoides Marsh. Cette descendance a été testée au Royaume-Uni pour la premièrefois. Le rendement en biomasse après une première révolution en taillis variait de 0,04 à 23,68 tonnes anhydres·ha–1·an–1.Cet écart considérable indique que les génotypes de cette descendance pourraient être utilisés pour mieux comprendreles bases génétiques du rendement supérieur en taillis sur courte révolution; ce qui contribuerait avantageusement auxprogrammes d’amélioration pour la production de biomasse. Les auteurs ont étudié les relations entre le rendement enbiomasse et les caractères relatifs à la tige, aux feuilles et aux cellules. Ils ont eu recours à l’analyse des moindres car-rés partiels pour classer les caractères selon leur importance. Les traits qui avaient le plus d’influence sur le rendementen biomasse étaient la hauteur maximale de la tige au cours de la saison de croissance, le diamètre à la base, lenombre de tiges et le nombre de branches sylleptiques. Ce dernier caractère avait la plus forte héritabilité, démontrantainsi un excellent potentiel pour l’amélioration génétique. Les caractères relatifs aux feuilles, incluant la surface fo-liaire, le nombre de feuilles sur la tige principale et l’indice plastochrone étaient également reliés à une biomasse supé-rieure, permettant ainsi de mieux comprendre les facteurs qui affectent cette dernière.
[Traduit par la Rédaction] Rae et al. 1498
Introduction
Hardwood trees grown as short-rotation coppice crops havethe potential for wider use as a source of carbon-neutral renew-able energy (El Bassam 1998; Tuskan 1998). Fast-growingPopulus hybrids are being developed as biofuels, owing totheir rapid juvenile growth (Bergez et al. 1989), highphotosynthetic capacity (Barigah et al. 1994), superiorgrowth performance (Heilman et al. 1994), and large woodybiomass production (Hansen 1991). There have been reportsof poplar biomass yields being as great as 35 oven-dried
tonnes (ODT)·ha–1·year–1 (Scarascia-Mugnozza et al. 1997),and this genus also has the potential for “marker-assisted”molecular breeding, given the availability of genetic mapsand physical sequence (Wulshleger et al. 2002).
Coppicing poplar promotes the regrowth of multiplestems, increasing final biomass (Sennerby-Forsse et al.1992) and enabling more than one harvest from the originalrootstock (Abrahamson et al. 1998). The early growth rate ofcoppice shoots is faster than that of seedlings or cuttings, be-cause they benefit from the existing root system and therapid development of a high leaf area index. A high numberof shoots per unit area gives rapid leaf area development,leading to fast crown closure and efficient utilization ofspace. In addition, coppice shoots have early onset of growthand have continuous development of new nodes until lateinto the growing season (Sennerby-Forsse et al. 1992). Theabsence of allocation of resources to sexual reproduction isalso beneficial to vegetative yield. There has been limitedwork reported on the suitability of poplar for coppicing (Eket al. 1983; Herve and Ceulemans 1996), but dry mass yields
Can. J. For. Res. 34: 1488–1498 (2004) doi: 10.1139/X04-033 © 2004 NRC Canada
1488
Received 8 August 2003. Accepted 9 February 2004.Published on the NRC Research Press Web site athttp://cjfr.nrc.ca on 24 July 2004.
A.M. Rae, K.M. Robinson, N.R. Street, and G. Taylor.1
University of Southampton, School of Biological Sciences,Bassett Crescent East, Southampton, SO16 7PX, UK.
1Corresponding author (e-mail: [email protected]).
© 2004 NRC Canada
Rae et al. 1489
have been shown to be higher in a number of species ofcoppiced poplar than in single-stem poplar (Sims et al. 2001).
Overall biomass gain in woody coppice systems is a func-tion of many internal plant processes and their interactionwith the environment. These can be studied by focusing at sev-eral levels — at the physiological, leaf, and canopy levels — aswell as considering the processes contributing to yieldwithin a stand, such as inter-tree competition effects. It is,therefore, important to study the relationships and interac-tions between biomass and other significant traits. It is use-ful to study the heritability and variability of such traits toassess the efficiency of selection for the trait during breedingprograms. Traits with high heritability and strong correlationwith biomass that can be easily and economically scoredearly on during growth would be ideal selection criteria forbreeding for biomass yield.
Tree stem height and basal area have been shown to bestrongly correlated with biomass in poplar (Madgwick 1971;Heilmann and Xie 1993; Verwijst 1993; Pointailler et al.1997; Scarascia-Mugnozza et al. 1997). As the site of lightinterception and carbon fixation, leaf growth is an importantfactor in tree stem growth (Van Volkenburgh and Taylor1996; Robinson et al. 2004). Final coppice leaf area is deter-mined by factors such as rate of growth of an individual leaf,plastochron index (PI), and the duration of canopy growththroughout the season (Ridge et al. 1986; Michael et al.1990). Both total leaf area and individual leaf area have beenshown to be strongly correlated with total biomass produc-tion in poplar hybrids (Barigah et al. 1994).
There is debate as to whether water use efficiency islinked to high yield, although differing conclusions may bethe result of differences in dryness of trial sites (Prasolova etal. 2003) and tree canopy position sampled (Bond and Stock1990; Prasolova et al. 2000). It is certainly the case thathigh-yielding genotypes with poor water use efficiencywould have limited value in an improvement program. Wecan estimate water use efficiency indirectly by studying leaftissue carbon isotope discrimination, or δ13C. This is the ex-clusion of 13CO2 relative to 12CO2 during gas exchange inplants (Farquhar et al. 1989). Genotypic differences in leafδ13C have been reported in a number of studies on trees(Guehl et al. 1995; Brendel et al. 2002).
This study seeks to elucidate the relative contributions ofa number of morphological and developmental stem and leafproperties to final tree yield, with particular emphasis oncoppice for biomass trees in a genetically diverse popula-tion. The pedigree used to investigate these traits is a mor-phologically diverse Populus trichocarpa Torr. & A. Gray ×Populus deltoides Marsh. F2 population derived from mate-rial segregating for many leaf and stem traits, which had pre-viously only been grown as single-stem trees in the climateof North America (Bradshaw et al. 1994). The large range ofvariation between individuals in this F2 pedigree was ofgreat advantage to this study.
Materials and methods
Plant pedigreeThe pedigree was generated by the hybridization of the
maternal P. trichocarpa clone 93-968 from western Wash-ington and the paternal P. deltoides clone ILL-129 from cen-
tral Illinois in 1981. Two siblings, 53-246 and 53-242, fromthe resulting F1 family (family 53) were crossed to form anF2 family (family 331) (Bradshaw et al. 1994; Bradshaw andStettler 1995). In 1999, this pedigree was imported into theUnited Kingdom.
A field trial was conducted in the United Kingdom at theForestry Commission field site, Headley (51°07′N, 0°50′W).The trial was established from 25-cm unrooted hardwoodcuttings of 93-968, ILL-129, and the F1 and F2 genotypesderived from a stool bed at the University of Washington,Seattle, Washington, USA. The thickness of all cuttings wasmeasured prior to planting and sorted between replicates ac-cording to size. Planting took place between 5 and 9 May2000. The site was set out in three randomized blocks, eachconsisting of 300 cuttings at 1-m spacing.
One cutting of each genotype was planted in each block toa depth of 20 cm. A double row of P. deltoides × Populusnigra L. ‘Gaver’ was planted around the entire trial at thesame spacing to serve as a buffer. The site was irrigated asnecessary throughout the growing season. The trial was pro-tected by a 1-m electric fence, and the entire nursery wasprotected by deer fencing. All genotypes in the field trialwere measured for tree height, basal diameter, and numberof sylleptic branches at the end of the first growing season(203 days after planting(DAP)).
The field trial was coppiced on 11 January 2001 (243DAP = 0 days after cutback (DAC)) to allow the study ofmultistemmed trees. Table 1 shows the traits that werescored throughout the trial, with DAP and DAC noted.
Traits measured
Tree architectureMaximum stem height was measured to the nearest
0.01 m with a digital measure pole. Stem diameter was mea-sured to the nearest millimetre with digital callipers at220 mm from ground level. For stems thicker than 30 mm,the diameter was measured in two perpendicular directions,and the mean value was used in further calculations(Pontailler et al. 1997). Stem diameter was converted to totalbasal stem area on the multistem trees. Stem volume indexwas then calculated as maximum height multiplied by totalbasal area (modified from Madgwick 1971; Verwijst 1993;Pointailler et al. 1997; Scarascia-Mugnozza et al. 1997). Acount was made of the number of sylleptic branches on themain stem of each tree at the end of the first growing season,and an assessment was made of the presence or absence ofsylleptic branches for multistem trees at the end of the sec-ond growing season.
Stem growthStem extension increment was measured to the nearest
millimetre on the tallest stem over a 7-day period (138–145DAC). The number of live coppice stems on each stool wascounted.
Canopy durationBudburst was assessed weekly as number of days from 31
March 2001 to the first fully unfolded leaf being visible onthe terminal shoot (Frewen et al. 2000). Budset was scoredin the autumn as the date at which the leading stem had aterminal bud, defined as the stage when the stipules of the

leaves covered the shoot apex and the youngest leaf was off-set from the axis of the shoot apex (Frewen et al. 2000).Canopy duration was calculated as the number of days be-tween budburst and budset.
Petiole length and leaf areaOne recently mature, fully expanded leaf from the upper
canopy was chosen, and the petiole length was measured tothe nearest millimetre. Leaf length was measured from thefoliar base to the junction with the stem to the nearest milli-metre with a paper ruler. A single recently matured represen-tative leaf from the terminal shoot was sampled from eachtree and scanned into Corel PhotoPaint (Corel Corp., Ot-tawa, Ont.). The images were analyzed to obtain leaf areas(excluding petiole area) with Scion Image (release Beta 3b,Scion Corporation, Frederick, Md., USA). Specific leaf area(mm2·g–1) was obtained by drying samples for a minimumof 72 h at 85 °C, with petioles removed, and calculated asleaf area divided by the leaf dry mass.
Plastochron indexPI, the rate at which leaves were produced, was calculated
on the basis of the formula of Erickson and Michelini(1957); see Larson and Isebrands (1971) for details.
Leaf extension and production rateThe length of the youngest unfolded leaf with lamina
length nearest to 20 mm was measured with a graph paperruler at 7-day intervals (see Table 1 for periods), and the ex-tension rate was calculated in millimetres per day. We scoredleaf production over the same 7-day periods by counting thenumber of existing visible individual leaves (including those
that were unrolled) between the tagged leaf and the tip ofthe stem. The increase in leaf number was converted to leafproduction per day.
Number of leaves on leading stemThe number of leaves, including distinct leaf abscission
scars on the leading stem, were counted twice during thegrowing season.
Carbon isotope ratioA single recently fully expanded leaf was taken from the
leading stem of each genotype in the first two blocks andoven-dried at 85 °C until constant mass was reached (~72 h).Samples, excluding the midrib and major veins, were groundwith a Pulverisette-14 rotor-speed mill to a homogeneouspowder. Carbon isotope ratios were measured on 1-mgaliquots of powdered leaf tissue by the Biomedical MassSpectrometry Unit, Dental School, University of Newcastle,United Kingdom. Analysis was conducted against a refer-ence plant flour standard, calibrated against InternationalAtomic Energy Agency standards.
Herbivore and rust damageLeaf damage caused by both sawfly larvae and
chrysomelid beetles was assessed. The worst affected leaf oneach plant was scored with a binary scoring system, where 0was damage to less than 20% of the leaf surface; and 1 wasdamage to more than 20% of the leaf surface.
Severity of leaf infection by rust (Melampsora larici-populinaKleb.) was assessed visually on a scale of rust pustule densityobserved on the abaxial leaf surface from 0 (no pustules) to5 (surface pustule saturation) on a representative leaf taken
© 2004 NRC Canada
1490 Can. J. For. Res. Vol. 34, 2004
Trait Days after planting or cutback
Tree architecture Maximum stem height (m) 203 DAPNo. of sylleptic branches 203 DAPBasal stem diameter (mm) 203 DAPMaximum stem height (m) 94, 359 DACStem extension increment (mm) 138–145 DACNo. of stems on stool 137, 359 DACTotal basal stem area (mm2) 359 DACStem volume index 359 DACSylleptic branch presence 359 DACWhole-tree dry mass (ODT·ha–1·year–1) 366 DAC
Leaf Spring budburst (days from 31 March 2001) 69–133 DACNo. of leaves leading stem 140, 181 DACPlastochron index 140, 181 DACLeaf extension rate (mm·day–1) 137–144, 174–181, 210–217 DACLeaf production rate (no.·day–1) 137–144, 174–181 DACIndividual leaf area (mm2) 165, 210 DACSpecific leaf area (mm2·g–1) 165 DACPetiole length (mm) 214 DAC
Cell Adaxial epidermal cell area (µm2) 172 DACNo. of adaxial epidermal cells per leaf (×107) 172 DAC
Biochemical Carbon isotope discrimination 224 DACDisease Rust assessment (0–5) 256 DAC
Herbivore damage (0–1) 132 DAC
Note: DAC, days after cutback; DAP, days after planting; ODT, oven-dried tonnes.
Table 1. Summary of chronology and replication of single-stem and coppice traits measured in thePopulus trichocarpa × Populus deltoides pedigree over two growing seasons.
from midheight of the main stem (D. Lonsdale, personalcommunication, Forest Research, Farnham, UK).
Final harvestThe entire trial was harvested in February 2002 (366
DAC), and the fresh mass of each individual was recordedwith a top pan balance. From the total population, a sampleof 20 individuals, representing a range of sizes and growthforms, was selected. Each plant was oven-dried at 80 °C un-til constant mass was reached. Regression analysis was car-ried out to test the relationship between fresh mass and drymass. The resulting regression equation (R2 = 0.99, p <0.001) allowed the estimation of dry mass for all individualsin the population. This value was then converted toODT·ha–1·year–1 and used as the value for aboveground bio-mass yield (Verwijst and Telenius 1999).
Statistical analysisData were entered and manipulated in Microsoft Excel.
Analysis of variance (ANOVA) and analysis of covariance(ANCOA) were carried out with Minitab release 13.1 (MinitabInc., State College, Penn., USA). Partial least-squares (PLS)analysis was conducted with Simca-P10.1 (Umetrics AB,Umea, Sweden).
Discrete traitsOne-way ANOVAs were used to interpret differences in
biomass production between the traits scored in discrete cat-egories: herbivore damage, rust, and presence of syllepticbranches.
Continuous traitsTwo-way ANOVAs were conducted for each trait to test
for variation between blocks and between genotypes for93-968, ILL-129, and the F1s. Subsequent two-wayANOVAs were then carried out on the total pedigree data forthe traits to test for variation between blocks and genotypes.ANCOVAs were carried out to look for effects of the initialcutting diameter on traits throughout the growing period.PLS analysis was used on the pedigree data to determine theorder of variable importance. This is a regression extensionof principal component analysis, which can be used to de-velop a model equation, but in this case it was used to calcu-late the variable influence on projection (VIP). The VIPvalues reflect the importance of terms in the model with re-spect to y — in this case, biomass. Traits with large VIP, thatis, larger than 1, are the most relevant for explaining bio-mass.
HeritabilityThe two-way ANOVA between genotypes and blocks for
each trait enabled us to calculate genetic variance (VG,) andenvironmental variance (VE). The error mean square (MSE)was taken as environmental variance, VE. The genetic vari-ance, VG, was calculated as
[1] VG = (MSG – MSE)/r
where MSG is the mean square between genotypes; and r isthe number of replicates. Within-family broad-senseheritability was calculated by dividing the genetic varianceby the total or phenotypic variance (VP = VG + VE) for eachtrait (Falconer and Mackay 1996).
Results
Discrete traitsNo significant difference was seen between blocks for
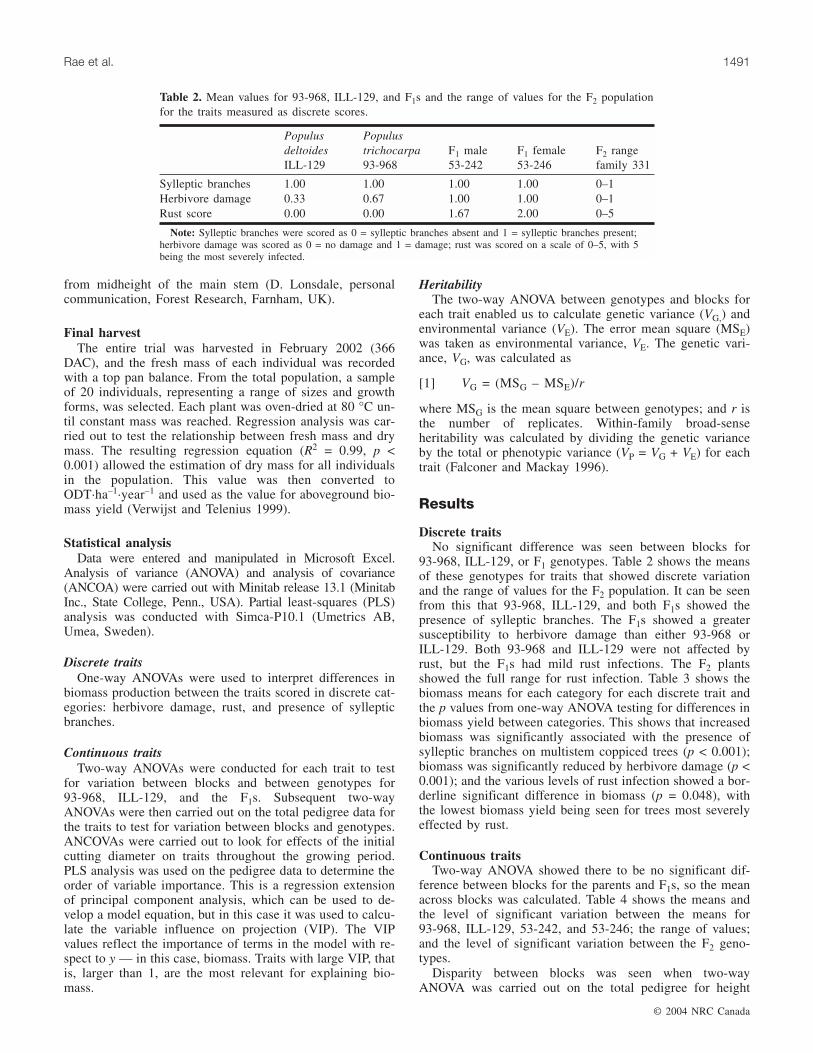
93-968, ILL-129, or F1 genotypes. Table 2 shows the meansof these genotypes for traits that showed discrete variationand the range of values for the F2 population. It can be seenfrom this that 93-968, ILL-129, and both F1s showed thepresence of sylleptic branches. The F1s showed a greatersusceptibility to herbivore damage than either 93-968 orILL-129. Both 93-968 and ILL-129 were not affected byrust, but the F1s had mild rust infections. The F2 plantsshowed the full range for rust infection. Table 3 shows thebiomass means for each category for each discrete trait andthe p values from one-way ANOVA testing for differences inbiomass yield between categories. This shows that increasedbiomass was significantly associated with the presence ofsylleptic branches on multistem coppiced trees (p < 0.001);biomass was significantly reduced by herbivore damage (p <0.001); and the various levels of rust infection showed a bor-derline significant difference in biomass (p = 0.048), withthe lowest biomass yield being seen for trees most severelyeffected by rust.
Continuous traitsTwo-way ANOVA showed there to be no significant dif-
ference between blocks for the parents and F1s, so the meanacross blocks was calculated. Table 4 shows the means andthe level of significant variation between the means for93-968, ILL-129, 53-242, and 53-246; the range of values;and the level of significant variation between the F2 geno-types.
Disparity between blocks was seen when two-wayANOVA was carried out on the total pedigree for height
© 2004 NRC Canada
Rae et al. 1491
PopulusdeltoidesILL-129
Populustrichocarpa93-968
F1 male53-242
F1 female53-246
F2 rangefamily 331
Sylleptic branches 1.00 1.00 1.00 1.00 0–1Herbivore damage 0.33 0.67 1.00 1.00 0–1Rust score 0.00 0.00 1.67 2.00 0–5
Note: Sylleptic branches were scored as 0 = sylleptic branches absent and 1 = sylleptic branches present;herbivore damage was scored as 0 = no damage and 1 = damage; rust was scored on a scale of 0–5, with 5being the most severely infected.
Table 2. Mean values for 93-968, ILL-129, and F1s and the range of values for the F2 populationfor the traits measured as discrete scores.

(203 DAP), diameter (203 DAP), number of syllepticbranches (DAP), leaf production rate (137 DAC), leaf exten-sion rate (174 and 210 DAC), leaf area (165 DAC), specificleaf area, δ13C, number of stems (137 and 359 DAC), can-opy duration, and harvest height, but there was no evidenceof interaction between blocks and genotypes. It is likely thatsome of the differences between blocks seen in the first-yearmeasurements were caused by differences in the diameter ofthe hardwood cuttings due to size sorting before planting.ANCOVA suggested that cutting diameter influenced thefirst-growing-season traits, height (p < 0.001), total basal di-ameter (p < 0.001), and number of sylleptic branches (p <0.001). Cutting diameter is unlikely to have affected mea-surements beyond the first growing season (Ayberk et al.1991). In fact, there is evidence to suggest that the effect ofcutting diameter decreases after 5 weeks of growth(Dickmann et al. 1980).
Traits scored during the first growing season showed that93-968 had greater values for height (p = 0.050), stem diam-eter (p = 0.164), and number of sylleptic branches (p =0.001) than ILL-129. Heterosis of the female F1 (53-246)over 93-968 was seen for single-stem height and diameter.
It can be seen from Table 4 that 93-968 was consistentlytaller and had a greater number of stems, greater basal diam-eter, and greater basal area throughout the second growingseason, although the height measurements did not show sig-nificant differences. It can be seen that, at harvest, 93-968had three times as many stems than ILL-129, but the two ge-notypes did not differ significantly in total basal area or stemvolume index. This is a result of 93-968 having manysmaller stems, rather than a few large stems, as in the caseof ILL-129.
Maternal clone 93-968 had a marginally higher number ofleaves on the leading stem throughout the growing season,although this was not significant. Paternal clone ILL-129had a greater leaf extension and leaf production rate than
93-968 early in the season, but the reverse was observedlater in the season.
Budburst was, on average, 3 weeks earlier in 93-968, re-sulting in extended canopy duration. Maternal clone 93-968showed higher δ13C than ILL-129. This implies that 93-968has a higher photosynthesis/stomatal conductance ratio. De-spite the larger stem volume and longer growing season in93-968, the overall biomass yield was only marginallygreater than that of ILL-129. Heterosis for both F1 plantswas seen for early and late season leaf extension and pro-duction rate. Early in the growing season, both F1s showedheterosis for leaf area, although this was not significant. Bio-mass showed considerable variation across the interspecificpopulation, with estimated yields reaching 23.7 ODT·ha–1·year–1,twice the yield of 93-968, ILL-129, or F1s. With the excep-tion of specific leaf area and petiole length, ANOVA re-vealed there to be variation between genotypes for all traitsin coppiced trees, suggesting that alleles for most traits aresegregating in this population and, therefore, will be suitablecandidates for selective breeding programs.
Partial least-squares regressionPLS regression fitted a model to the pedigree data, result-
ing in the variable importance in the projection for eachtrait, as shown in Table 5. From this it can be seen that stemtraits were the variables mostly responsible for the harvestedbiomass. The trait with the highest importance as biomassindicator was stem volume index. The regression plot of thistrait on biomass (Fig. 1a) has an R2 value of 0.74. As wouldbe expected, total basal area and height at harvest, whichwere used to calculate the stem volume index, were the nextmost important traits. The establishment and early sec-ond-year stem traits, basal diameter (203 DAP) and maxi-mum stem height (203 DAP, 94 DAC), were also important.This suggests that traits scored in the establishment year be-fore coppice and early in the second year have a strong asso-ciation with second-year harvest biomass.
The number of sylleptic branches (203 DAP), number ofstems on stool (359 DAC), number of leaves on the leadingstem (181 DAC, 140 DAC), and individual leaf area (165DAC) all showed similar importance. The regression ofnumber of leaves (140 DAC) and individual leaf area (165DAC) on biomass (Figs. 1b and 1c) had R2 values of 0.24and 0.25, respectively. The above leaf traits and PI (140DAC) showed greater importance than the stem traits, num-ber of stems (137 DAC), and stem extension increment(138–145 DAC). Specific leaf area and adaxial epidermalcell area had the least association with biomass.
HeritabilityTable 6 shows the heritability for the traits that were
scored for all replicates. Maximum stem height (94 DAC),total basal area (359 DAC), and stem volume index (359DAC) all showed high heritabilities (>0.70), withearly-season stem height showing the highest heritability(0.79). Leaf production rate (137–144 DAC, 174–181 DAC),leaf extension rate (174–181 DAC), and herbivore damageall showed low heritability (< 0.30), and all other traitsshowed moderate heritability.
© 2004 NRC Canada
1492 Can. J. For. Res. Vol. 34, 2004
CategoryMean(ODT·ha–1·year–1) SD
Sylleptic branchesPresent 1.705 2.206Absent 4.543 3.832p<0.001
Herbivore damageDamage 2.786 3.375No damage 4.055 3.599p<0.001
Rust score0 3.278 3.8691 3.214 3.1472 4.156 4.1093 4.287 2.9204 3.192 2.3955 0875 0898p=0.048
Table 3. Mean biomass yield and SD for each cate-gory in (i) presence or absence of sylleptic branches;(ii) herbivore damage; and (iii) rust infection.

© 2004 NRC Canada
Rae et al. 1493
Tra
it
Popu
lus
delt
oide
sIL
L-1
29
Popu
lus
tric
hoca
rpa
93-9
68F
1m
ale
53-2
42F
1fe
mal
e53
-246
Var
iati
onam
ong
93-9
68,
ILL
-129
,an
dF
1s(p
)F
2ra
nge
fam
ily
331
Var
iati
onbe
twee
nF
2
geno
type
s(p
)
Max
imum
stem
heig
ht(m
)(2
03D
AP
)12
3.67
169.
3315
7.67
189.
330.
050
3.7–
249.
0<
0.00
1B
asal
stem
diam
eter
(mm
)(2
03D
AP
)14
.019
.417
.220
.90.
164
1.6–
30.8
<0.
001
No.
ofsy
llep
tic
bran
ches
(203
DA
P)
3.3
25.0
13.7
16.0
0.00
10.
0–35
.0<
0.00
1B
udbu
rst
(day
sfr
om31
Mar
ch20
01)
40.0
19.0
23.7
28.3
0.01
14.
0–61
.0<
0.00
1M
axim
umst
emhe
ight
(m)
(94
DA
C)
72.3
82.3
78.0
82.0
0.35
05.
0–94
.0<
0.00
1S
tem
exte
nsio
nin
crem
ent
(mm
)(1
38–1
45D
AC
)12
.312
.311
.012
.70.
856
0.0–
34.0
<0.
001
No.
ofst
ems
onst
ool
(137
DA
C)
6.7
16.3
5.3
5.7
<0.
001
1.0–
30.0
<0.
001
No.
ofle
aves
onle
adin
gst
em(1
40D
AC
)18
.019
.019
.319
.70.
805
2.0–
38.0
<0.
001
Pla
stoc
hron
inde
x(1
40D
AC
)17
.75
16.5
019
.17
19.2
9N
A0.
73–3
4.00
NA
Lea
fex
tens
ion
rate
(mm
·day
–1)
(134
–144
DA
C)
11.0
29.
9911
.51
12.0
8N
A0.
00–5
.43
NA
Lea
fpr
oduc
tion
rate
(no.
·day
–1)
(137
–144
DA
C)
0.38
0.24
0.38
0.47
0.63
30.
00–2
.29
0.04
3N
o.of
leav
eson
lead
ing
stem
(181
DA
C)
28.3
329
.67
25.6
721
.67
0.57
30.
0–42
.0<
0.00
1P
last
ochr
onin
dex
(181
DA
C)
24.1
428
.67
26.0
826
.68
0.68
50.
0–42
.0<
0.00
1L
eaf
exte
nsio
nra
te(m
m·d
ay–1
)(1
74–1
81D
AC
)4.
867.
246.
905.
230.
390
0.14
–9.7
10.
138
Lea
fpr
oduc
tion
rate
(no.
·day
–1)
(174
–181
DA
C)
1.67
1.67
2.33
1.67
0.85
90.
00–6
.00
0.07
2In
divi
dual
leaf
area
(mm
2 )(1
65D
AC
)14
500
1168
315
685
1572
20.
883
180–
3392
4<
0.00
1S
peci
fic
leaf
area
(mm
2 ·g–1
)(1
65D
AC
)12
646
1051
910
897
1060
10.
946
149
4.9–
127
992.
5<
0.00
1P
etio
lele
ngth
(mm
)(2
14D
AC
)99
.043
.063
.067
.00.
012
5.0–
156.
00.
542
Lea
fex
tens
ion
rate
(mm
·day
–1)
(210
–217
DA
C)
5.48
6.63
6.80
5.56
0.21
80.
00–9
.18
<0.
001
Indi
vidu
alle
afar
ea(m
m2 )
(210
DA
C)
2921
618
363
2710
826
990
0.47
682
5–37
509
<0.
001
Car
bon
isot
ope
disc
rim
inat
ion
(224
DA
C)
–28.
29–2
5.27
–26.
34–2
5.86
0.02
3–3
0.97
-–1
9.99
<0.
001
Ada
xial
epid
erm
alce
llar
ea( µ
m2 )
(172
DA
C)
330.
5348
9.6
369.
0—
NA
128.
7–91
1.9
NA
No.
ofad
axia
lep
ider
mal
cell
spe
rle
af(1
72D
AC
)3.
527
3.05
26.
577
—N
A0.
156–
11.5
26N
AH
eigh
t(m
)(3
59D
AC
)33
2.0
372.
036
8.0
340.
00.
367
27.0
–429
.0<
0.00
1N
o.of
stem
son
stoo
l(3
59D
AC
)4.
312
.04.
75.
30.
005
1–22
<0.
001
Tota
lba
sal
area
(mm
2 )(3
59D
AC
)2
198.
33
341.
32
241.
02
269.
50.
348
12.5
7–5
248.
82<
0.00
1S
tem
volu
me
inde
x(3
59D
AC
)12
456
714
28
287
779
70.
211
6.16
–19
189.
62<
0.00
1C
anop
ydu
rati
on(d
ays)
164.
2018
5.7
185.
717
1.7
0.00
175
.0–2
16.0
<0.
001
Bio
mas
s(O
DT
·ha–1
·yea
r–1)
(366
DA
C)
11.9
312
.42
10.5
311
.10
0.96
20.
04–2
3.68
<0.
001
Not
e:D
AP
and
DA
Car
eno
ted.
The
mea
nsar
esh
own
for
93-9
68,
ILL
-129
,an
dF 1
s,an
dth
era
nge
issh
own
for
F 2.
Var
iatio
nbe
twee
nge
noty
pes
isin
dica
ted
for
all
trai
tssc
ored
with
repl
icat
ion,
with
the
valu
eof
psh
own.
DA
C,
days
afte
rcu
tbac
k;D
AP,
days
afte
rpl
antin
g;N
A,
not
appl
icab
lefo
rtr
aits
that
wer
eno
tsc
ored
inal
lre
plic
ate
bloc
ks;
OD
T,
oven
-dri
edto
nnes
.
Tab
le4.
All
trai
tsm
easu
red
ona
cont
inuo
ussc
ale.

Discussion
This study has shown that members of this poplar pedi-gree, selected in the United States, have potential to achievehigh yield when grown in the United Kingdom under cop-pice. The primary aim of this study was to identify traits im-portant for high yield, both in first-year single-stem growthand in second-year multistem growth, for future coppicedpoplar breeding and improvement. The large range for esti-mated biomass yield in the F2 (0.04–23.68 ODT·ha–1·year–1)suggests that this population has much potential for selectivebreeding and as a tool for understanding the basis of yield,as high transgressive segregation is shown.
The results suggest that 93-968 has a longer growing sea-son, over which it produces many small stems, whereas theILL-129 has a shorter growing season with fewer, largerstems (as has been previously reported by Wu and Stettler1994), but both growth architectures produce similar endyield results. It is likely to be the combination of the advan-tages of these two growing behaviours that causes theheterosis of biomass yield in the F1 generation and the ap-pearance of extreme genotypes in the segregating F2 genera-tion.
PLS regression is designed for use with many, often corre-lated variables, to show how they affect the y variable
(Eriksson et al. 2001). The advantages of PLS regression areits abilities to handle many variables, to analyze noisy data,to deal with multicollinearity, and to process incompletedata (Van Eeuwijk et al. 2002). An F2 population is highlysuitable for PLS regression because of the divergence ofsegregating traits. It is also appropriate for this study be-cause many traits discussed here show multicollinearity. Thevariable importance plot showed that stem traits were mostindicative of biomass yield and that the leaf traits that con-tributed most strongly to biomass were the number of leaveson the leading stem, PI, and leaf area (Table 5). The impor-tance of the stem traits in this model were as expected, asmany studies have shown height and diameter to be excel-lent predictors of biomass (Madgwick 1971; Heilmann andXie 1993; Verwijst 1993; Pointailler et al. 1997;Scarascia-Mugnozza et al. 1997).
This analysis has pinpointed the most important leaf traitsin the coppice habit that influence aboveground biomassgain. It has been previously reported that leaves on syllepticbranches export carbon mainly to the lower stem and roots,whereas main stem leaves contribute much to the heightgrowth of the tree (Scarascia Mugnozza et al. 1999). Previ-ous studies reported sylleptic branching to positively influ-ence stem volume growth (Scarascia-Mugnozza et al. 1999)and biomass yield (Barigah et al. 1994). It is interesting thatin the pedigree studied here, despite the difference in num-ber of sylleptic branches between 93-968 and ILL-129, simi-lar biomass yields were achieved by these clones.
PLS analysis suggested that biomass was associated witha high number of leaves and large leaf area. Harrington et al.(1997) found a high positive correlation between mature in-dividual leaf area and relative growth rates in poplar geno-types. Leaf area has also been related to biomass sufficientlyfor Harrington and Fownes (1993) to produce equations toestimate total biomass and leaf area index from basal diame-ter measurements.
The time at which traits were scored during the growingseason may be important to biomass estimation. In the caseof leaf area, little difference was seen between the parentalleaf areas early in the growing season, and the F1s showedhigh heterosis. But later in the season ILL-129 showed fargreater leaf area than 93-968, as reported elsewhere (Ferriset al. 2002), and the F1s showed values just lower than thosefor ILL-129. The fact that 93-968 broke bud before ILL-129may have had an effect on early leaf area.
In general, young poplar leaves are net importers ofphotosynthates from mature leaves (Isebrands et al. 1976;Larson et al. 1980; Dickson and Isebrands 1991). Ageingleaves gradually become net exporters, translocating approx-imately 50% of their photosynthetic products. Once fullymature, leaves only export carbohydrates, as they are func-tionally independent for carbon (Turgeon 1989; Dickson andIsebrands 1991). Work by Nelson (1985) and Ceulemans etal. (1987) suggests that mature leaves produce the most pho-tosynthates for the production of woody biomass. This hasled to the suggestion that given an avoidance of damage fromearly frosts, long periods of leaf retention and photosyntheticactivity in an extensive mature canopy may be an importantselection criterion. Rapid rates of individual leaf maturationmay give rise to a mature canopy early in the growing sea-son, which may be advantageous.
© 2004 NRC Canada
1494 Can. J. For. Res. Vol. 34, 2004
Trait VIP
Stem volume index (359 DAC) 1.996Total basal area (359 DAC) 1.854Maximum sten height (359 DAC) 1.408Basal stem diameter (203 DAP) 1.340Maximum stem height (94 DAC) 1.316Maximum stem height (203 DAP) 1.303No. of sylleptic branches (203 DAP) 1.156No. of stems on stools (359 DAC) 1.110Individual leaf area (165 DAC) 1.099No. of leaves on leading stem (181 DAC) 1.096No. of leaves on leading stem (140 DAC) 1.054Plastochron index (140 DAC) 1.031Stem extension increment (138–145 DAC) 0.881No. of stems on stool (137 DAC) 0.853Individual leaf area (210 DAC) 0.852No. of adaxial epidermal cells per leaf (172 DAC) 0.831Canopy duration 0.808Plastochron index (181 DAC) 0.797Budburst (days from 31/03/01) 0.623Leaf extension rate (210–217 DAC) 0.644Leaf extension rate (137–144 DAC) 0.511Leaf production rate (174–181 DAC) 0.457Leaf extension rate (174–181 DAC) 0.457Petiole length (214 DAC) 0.422Leaf production rate (137–144 DAC) 0.328Carbon isotope ratio (224 DAC) 0.276Specific leaf area (165 DAC) 0.206Adaxial epidermal cell area (172 DAC) 0.168
Note: DAC, days after cutback; DAP, days after planting.
Table 5. Variable influence on projection (VIP) values for traitsin the first partial least-squares component carried out on the to-tal pedigree for all traits measured on a continuous scale.

Adaxial cell area showed least association with biomass.The poor correlation between adaxial cell area is interesting,as previous studies of this pedigree have shown there to bestrong correlations between leaf cell area and the traits in-dicative of biomass — stem height and diameter — evenfinding co-locating quantitative trait loci (QTL) (Taylor et al.2001). However, here the number of adaxial cells per leafhas been found to be much more influential on biomass gainthan cell area, confirming a report that adaxial cell numberof several poplar clones of contrasting yield showed highyield correlated with cell number (Bunn et al. 2004).Fast-growing poplar (Populus × Populus euramericana
(Populus deltoides × P. nigra)) exposed to elevated CO2also has larger leaves, because of a stimulation in leaf cellproduction (Taylor et al. 2003).
Reich et al. (1999) showed that specific leaf area affectsleaf longevity. In the present study, a strong correlation wasseen between specific leaf area and canopy duration (r =0.134, p = 0.001) and between canopy duration and biomass(r = 0.389, p < 0.001), yet no correlation was seen betweenspecific leaf area and biomass (r = 0.128, p = 0.059).
Of the traits measured, carbon isotope ratios showed theleast association with biomass. In pine, positive correlationsof δ13C with height and diameter have been reported in wetconditions, but negative correlations have been reported un-der dry conditions (Prasolova et al. 2003). This fits with theresults presented here, as this study was carried out in awell-watered trial. Maternal clone 93-968 was selected fromfloodplains (Dunlap and Stettler 2001) and has been re-ported as being less responsive to water stress, whereas pa-ternal clone ILL-129 was selected from a region with lessrainfall and closes stomata immediately under stress(Hinckley et al. 1989). This implies that despite 93-968 hav-ing a high ratio of photosynthetic assimilation to stomatalconductance under wet conditions, ILL-129 has the advan-tage under dry conditions. It is important to consider this
© 2004 NRC Canada
Rae et al. 1495
Fig. 1. Plots for the traits (a) stem volume index (359 DAC),(b) number of leaves on main stem (140 DAC) and (c) leaf area(165 DAC) regressed against biomass for the F2 pedigree of theinterspecific cross Populus trichocarpa × Populus deltoides.DAC, days after cutback. Trait
Heritability(VG/VP)
Single stemMaximum stem height 0.50Basal diameter 0.52No. of sylleptic branches 0.65
MultistemBudburst 0.53Height (94 DAC) 0.79Stem extension increment (138–145 DAC) 0.25No. of stems (137 DAC) 0.46No. of leaves on leading stem (140 DAC) 0.58Leaf production rate (137–144 DAC) 0.13No. of leaves on leading stem (181 DAC) 0.62Plastochron index (181 DAC) 0.37Leaf extension rate (174–181 DAC) 0.08Leaf production rate (174–181 DAC) 0.11Leaf area (165 DAC) 0.52Leaf extension rate (210–217 DAC) 0.28Leaf area (210 DAC) 0.60Carbon isotope ratio (224 DAC) 0.46Height (359 DAC) 0.69No. of stems (359 DAC) 0.51Total basal area (359 DAC) 0.71Stem volume index (359 DAC) 0.76Canopy duration 0.30Rust score 0.33Herbivore damage 0.07Sylleptic branches (359 DAC) 0.36Biomass (366 DAC) 0.61
Note: VG, genetic variance; VP, total phenotypic variance (VP = VE +VG), where VE is environmental variance.
Table 6. Values for percent heritability for all traits scored withreplication.

when selecting trees for breeding in different environments,and this trait may be worth further study in this pedigree.
An important consideration in breeding programs is theselection for pest- and disease-tolerant trees. It was shownhere that plants that suffered herbivore damage had signifi-cantly reduced biomass yield, probably becausephotosynthetic leaf area was reduced. The effect of rust in-fection on biomass did not become appreciable until themost severe rust infection was apparent. As with herbivoredamage, this suggests that rust damages the leaf area of ashoot, resulting in a decline in growth rate. Melampsoraspp. was shown to have a negative effect on height in willow(Verwijst 1993). A slight reduction in biomass was seen forstools that had no or little rust infection, in comparison withthose having mild to moderate rust. This may be the resultof a trade-off for establishing a defence against infection(Ronnberg-Wastjung and Gullberg 1999). Three QTL forrust resistance have been mapped in this pedigree in theUnited States (Newcombe and Bradshaw 1996), and futurework to study this pedigree exposed to different Melampsoraisolates in the United Kingdom should be interesting.
The percentage of variation that can be explained by VPfor many of the traits linked to biomass production is en-couraging, as it suggests that selective breeding for thesetraits will yield good results.
This method of calculating heritability may give slightoverestimations, as there may be some environmental effectsincluded in the variance between genotypes. But it can beused as an estimation of “clonal repeatability” (Falconer andMackay 1996). Work by Wu and Stettler (1997) has shownthere to be significant differences in broad-sense heritabilityestimates between poplar grown in different environments.
In this paper, the biomass yield has been reported inODT·ha–1·year–1. Elsewhere it has been reported that growthof 2-year-old single-tree plots do not perfectly representlater growth trajectories and cannot be assumed to representgrowth per hectare (Stanton 2001), but this estimation ofbiomass should enable comparisons of this study with otheryield studies.
It can be seen that this pedigree has potential to be grownas a coppiced high-yielding biomass crop and will be invalu-able in elucidating the genetic determinants of the traits, par-ticularly leaf traits, identified here for future poplarimprovement. The tree architecture traits have been shown tobe good predictors of biomass in both single-stem andmultistem trees and have high heritabilities, whereas leafarea and number of cells per leaf show moderateheritabilities. The ease with which height, basal diameter,number of stems, and sylleptic branches can be scored makethem useful traits in future breeding programs.
Acknowledgements
This research was supported by grants to G. Taylor fromthe United Kingdom Department for Environment, Food andRural Affairs (NF0410, NF0424), a Biotechnology and Bio-logical Sciences Research Council – Co-operative Awards inScience and Engineering (BBSRC–CASE) studentship toK.M. Robinson (99/B2/P/05446), a National EnvironmentResearch Council studentship to N.R. Street (NER/S/A/2001/06361), and was supported by the European Commis-
sion through the Directorate General Research within theFifth Framework for Research – Quality of Life and Man-agement of the Living Resources Programme, contractQLK5-CT-2002-00953 (POPYOMICS), coordinated by theUniversity of Southampton. We thank F. Zhang, G.J.J.Clarkson, and M.R. Cotton for help with planting of thetrees; and C.A Dixon, T.J. Blackburn, G. Swithinbank, andMaricela Rodregas for assistance with tree harvest and traitscoring. We are grateful to Paul Tabbush for help and advicein developing the coppice experiment, Tracy Houston foradvice on experimental design, and Toby Bradshaw for thesupply of the pedigree plant material.
References
Abrahamson, L.P., Robison, D.J., Volk, T.A., White, E.H.,Neuhauser, E.F., Benjamin, W.H., and Peterson, J.M. 1998.Sustainability and environmental issues associated with willowbioenergy development in New York (U.S.A.). BiomassBioenergy, 15: 17–22.
Ayberk, S., Tolay, U., and Uludag, S., 1991. The influence of ini-tial spacing and lengths of cuttings on the quality of saplings ofthe clones of P. × euramericana “I-214” and “45/51”. PoplarResearch Institute, Abstracts on Silviculture, No. 36.
Barigah, T.S., Saugier, B., Mousseau, M., Guitte, J., andCeulemans, R. 1994. Photosynthesis, leaf area and productivityof 5 poplar clones during their establishment year. Ann. Sci.For. 51: 613–625.
Bergez, J.E., Auclair, D., and Bouvarel, L. 1989. 1st-year growthof hybrid poplar shoots from cutting or coppice origin. For. Sci.35: 1105–1113.
Bond, W.J., and Stock, W.D. 1990. Preliminary assessment of thegrading of Eucalyptus clones using carbon isotope discrimina-tion. S. Afr. J. For. 154: 51–55.
Bradshaw, H.D., and Stettler, R.F. 1995. Molecular genetics ofgrowth development in Populus. IV. Mapping QTLs with largeeffects on growth, form and phenology traits in a forest tree. Ge-netics, 139: 963–973.
Bradshaw, H.D., Villar, M., Watson, B.D., Otto, K.G., Stewart, S.,and Stettler, R.F. 1994. Molecular genetics of growth and devel-opment in Populus. III. A genetic linkage map of a hybrid pop-lar composed of RFLP, STS and RAPD markers. Theor. Appl.Genet. 89: 167–178.
Brendel, O., Pot, D., Plomion, C., Rozenberg, P., and Guehl, J.M.2002. Genetic parameters and QTL analysis of δ13C and ringwidth in maritime pine. Plant Cell Environ. 25: 945–953.
Bunn, S.M., Rae, A.M., Herbert, C.S., and Taylor, G. 2004. Leaflevel productivity traits in Populus grown in short rotation cop-pice for biomass energy. Forestry, 77(4). In press.
Ceulemans, R., Impens, I., and Steenackers, V. 1987. Variations inphotosynthetic, anatomical, and enzymatic leaf traits and corre-lations with growth in recently selected Populus hybrids. Can. J.For. Res. 17: 273–283.
Dickmann, D., Phipps, H., and Netzer, D. 1980. Cutting diameterinfluences early survival and growth of several Populus clones.U.S. Dep. Agric. For. Serv. Res. Pap. NC-261.
Dickson, R.E., and Isebrands, J.G. 1991. Leaves as regulators ofstress response. In Response of plants to multiple stresses.Edited by H.A. Mooney, W.E. Winner, and E.J. Pell. AcademicPress Inc., San Diego, Calif. pp. 3–34.
Dunlap, J.M., and Stettler, R.F. 2001. Variation in leaf epidermaland stomatal traits of Populus trichocarpa from two transectsacross the Washington Cascades. Can. J. Bot. 75: 528–536.
© 2004 NRC Canada
1496 Can. J. For. Res. Vol. 34, 2004

Ek, A.R., Lenarz, J.E., and Dudek, A. 1983. Growth and yield ofPopulus coppice stands grown under intensive culture. In Inten-sive plantation culture: 12 years research. Edited by E.A.Hansen. U.S. Dep. Agric. Gen. Tech. Rep. NC-91. pp. 64–71.
El Bassam, N. (Editor). 1998. Energy plant species: their use andimpact on environment and development. James & James (Sci-ence Publishers) Ltd., London, UK.
Eriksson, L., Johansson, E., Kettaneh-Wold, N., and Wold, S.2001. Multi- and megavariate data analysis: principles and ap-plications. Umetrics AB, Umeå, Sweden.
Erickson, R.O., and Michelini, F.J. 1957. The plastochron index.Am. J. Bot. 44: 297–305.
Falconer, D.S., and Mackay, T.F.C. 1996. Introduction to quantita-tive genetics. Pearson Education Limited, Harlow, UK.
Farquhar, G.D., Ehleringer, J.R., and Hubick, K.T. 1989. Carbonisotope discrimination and photosynthesis. Ann Rev PlantPhysiol. Plant Mol. Biol. 40: 503–537.
Ferris, R., Long, L., Bunn, S.M., Robinson, K.M., Bradshaw, H.D.,Rae, A.M., and Taylor, G. 2002. Leaf stomatal and epidermalcell development: identification of putative quantitative trait lociin relation to elevated carbon dioxide concentration in poplar.Tree Physiol. 22: 633–640.
Frewen, B.E., Chen, T.H.H., Howe, G.T., Davis, J., Rohde, A.,Boerjan, W., and Bradshaw, H.D., Jr. 2000. Quantitative traitloci and candidate gene mapping of bud set and bud flush inPopulus. Genetics, 154: 837–845.
Guehl, J.M., Nguyen-Queyrens, A., Loustau, D., and Ferhi, A.1995. Genetic and environment determinants of water use effi-ciency and carbon isotope discrimination in forest trees. InEUROSILVA contribution to forest tree physiology. Edited byH. Sandermann and M. Bonnet-Masimbert. INRA, Paris,France. pp. 297–321.
Hansen, E.A. 1991. Poplar woody biomass yields: a look to the fu-ture. Biomass Bioenergy, 1: 1–7.
Harrington, C.A., Radwan, M.A., and Dean, D.S. 1997. Leaf char-acteristics reflect growth rates of 2-year-old Populus trees. Can.J. For. Res. 27: 1321–1325.
Harrington, R.A., and Fownes, J.H. 1993. Allometry and growth ofplanted versus coppiced stands of 4 fast-growing tropical treespecies. For. Ecol. Manage. 56: 315–327.
Heilman, P.E., and Xie, F. 1993. Influence of nitrogen growth andproductivity of short-rotation Populus trichocarpa × Populusdeltoides hybrids. Can. J. For. Res. 23: 1863–1869.
Heilman, P.E., Ekuan, G., and Fogle, D. 1994. Above- and be-low-ground biomass and fine roots of 4-year-old hybrids ofPopulus trichocarpa × Populus deltoides and parental species inshort-rotation culture. Can. J. For. Res. 24: 1186–1192.
Herve, C., and Ceulemans, R. 1996. Short-rotation coppiced vs.non-coppiced poplar: a comparative study at two different fieldsites. Biomass Bioenergy, 11: 139–150.
Hinckley, T.M., Ceulemans, R., Dunlap, J.M., Figliola, A.,Heilman, P.E., Isebrands, J.G., Scarascia-Mugnozza, G.,Schulte, P.J., Smit, B., Stettler, R.F., Van Volkenburgh, E., andWiard, B.M. 1989. Physiological, morphological and anatomicalcomponents of hybrid vigour in Populus. In Structural and func-tional responses to environmental stresses. Edited by K.H.Kreeb, H. Richter, and T.M. Hinckley. SPB Academic Pub-lishing bv, The Hague, Netherlands. pp. 199–217.
Isebrands, J.G., Dickson, R.E., Larson, P.R. 1976. Translocationand incorporation of 14C into the petiole from different regionswithin developing cottonwood leaves. Planta, 128: 185–193.
Larson, P.R., and Isebrands, J.G 1971. The plastochron index asapplied to developmental studies of cottonwood. Can. J. For.Res. 1: 1–11.
Larson, P.R., Isebrands, J.G., and Dickson, R.E. 1980. Sink tosource transition of Populus leaves. Ber. Deutsch. Bot. Ges. 93:79–90.
Madgwick, H.A.I. 1971. The accuracy and precision of estimatesof the dry matter in stems, branches and foliage in an old-fieldPinus virginiana stand. In Forest biomass studies. Univ. MaineLife Sci. Agric. Exp. Stn. Misc. Publ. 132. pp. 105–112.
Michael, D.A., Dickmann, D.I., Isebrands, J.G., and Nelson, N.D.1990. Photosynthesis patterns during the establishment yearwithin two Populus clones with contrasting morphology andphenology. Tree Physiol. 6: 11–27.
Nelson, N.D. 1985. Photosynthetic life span of attached poplarleaves under favourable controlled environment conditions. For.Sci. 31: 700–705.
Pontailler, J.Y., Ceulemans, R., and Guittet, J. 1997. Linear andnon-linear functions of volume index to estimate woody bio-mass in high density young poplar stands. Ann. Sci. For. 54:335–345.
Prasolova, N.V., Xu, Z.H., Farquhar, G.D., Saffigna, P.G., and Di-eters, M.J. 2000. Variation in branchlet d13C in relation tobranchlet nitrogen concentration and growth in 8-year-old hooppine families (Araucaria cunninghamii) in subtropical Australia.Tree Physiol. 20: 1049–1055.
Prasolova, N.V., Xu, Z.H., Lundkvist, K., Farquhar, G.D., Dieters,M.J., Walker, S., and Saffigna, P.G. 2003. Genetic variation infoliar carbon isotope composition in relation to tree growth andfoliar nitrogen concentration in clones of the F1 hybrid betweenslash pine and Caribbean pine. For. Ecol. Manage. 172:145–160.
Reich, P.B., Ellsworth, D.S., Walters, M.B., Vose, J.M., Gresham,C., Volin, J.C., and Bowman, W.D. 1999. Generality of leaf traitrelationships: a test across six biomes. Ecology, 80: 1955–1969.
Ridge, C.R., Hinckley, T.M., Stettler, R.F., and Van Volkenburgh,E. 1986. Leaf growth characteristics of fast growing poplar hy-brids Populus trichocarpa × P. deltoides. Tree Physiol. 1:209–216.
Robinson, M.K., Karp, A., and Taylor, G. 2004. Defining leaf traitslinked to yield in short-rotation coppice Salix. BiomassBioenergy, 26: 417–431.
Ronnberg-Wastjung, A.C., and Gullberg, U. 1999. Genetics ofbreeding characters with possible effects on biomass productionin Salix viminalis (L.). Theor. Appl. Genet. 98: 531–540.
Scarascia-Mugnozza, G.E., Ceulemans, R., Heilman, P.E.,Isebrands, J.G., Stettler, R.F., and Hinckley, T.M. 1997. Produc-tion physiology and morphology of Populus species and theirhybrids grown under short rotation. II. Biomass components andharvest index of hybrid and parental species clones. Can. J. For.Res. 27: 285–294.
Scarascia-Mugnozza, G.E., Hinckley, T.M., Stettler, R.F., Heilman,P.E., and Isebrands, J.G. 1999. Production physiology and mor-phology of Populus species and their hybrids grown under shortrotation. III. Seasonal carbon allocation patterns from branches.Can. J. For. Res. 29: 1419–1432.
Sennerby-Forsse, L., Fern, A., and Kauppi, A. 1992. Coppicingability and sustainability. In Ecophysiology of short-rotation for-est crops. Edited by C.P. Mitchell, J.B. Ford-Robertson, T.Hinckley, and L. Sennerby-Forsse. Elsevier Applied Science,London, UK. pp. 146–184.
Sims, R.E.H., Maiava, T.G., and Bullock, B.T. 2001. Short rotationcoppice tree species selection for woody biomass production inNew Zealand. Biomass Bioenergy, 20: 329–335.
Stanton, B.J. 2001. Clonal variation in basal area growth patternsduring stand development in hybrid poplar. Can. J. For. Res. 31:2059–2066.
© 2004 NRC Canada
Rae et al. 1497

Taylor, G., Beckett, K.P., Robinson, K.M., Stiles, K., and Rae,A.M. 2001. Identifying QTL for yield in biomass poplar. As-pects Appl. Biol. 65: 173–182.
Taylor, G., Tricker, P.J., Zhang, F.Z., Alston, V.J., Miglietta, F., andKuzminsky, E. 2003. Spatial and temporal effects of free-airCO2 enrichment (POPFACE) on leaf growth, cell expansion, andcell production in a closed canopy of poplar. Plant Physiol. 131:177–185.
Turgeon, R. 1989. The sink-source transition in leaves. Annu. Rev.Plant Physiol. 40: 119–138.
Tuskan, G.A. 1998. Short rotation woody crop supply systems inthe United States: What do we know and what do we need toknow? Biomass Bioenergy, 14: 307–315.
Van Eeuwijk, F.A., Crossa, J., Vargas, M., and Ribaut, J.-M. 2002.Analysing QTL–environment interaction by factorial regression,with an application to the CIMMYT drought and low-nitrogenstress programme in maize. In Quantitative genetics, genomicsand plant breeding. Edited by M.S. Kang. CAB International,Wallingford, UK. pp. 245–256.
Van Volkenburgh, E., and Taylor, G. 1996. Leaf growth physiology.In Biology of Populus and its implications for management and
conservation. Edited by R.F. Stettler, H.D. Bradshaw, P.E.Heilman, and T.M. Hinckley. NRC Research Press, Ottawa,Ont. pp. 283–300.
Verwijst, T. 1993. Influence of the pathogen Melampsora-epitea onintraspecific competition in a mixture of Salix-viminalis clones.J. Veg. Sci. 4: 717–722.
Verjwist, T., and Telenius, B. 1999. Biomass estimation proceduresin short-rotation forestry. For. Ecol. Manage. 121: 137–146.
Wu, R., and Stettler, F.R. 1994. Quantitative genetics of growth de-velopment in Populus. I. A three generation comparison of treearchitecture during the first 2 years of growth. Theor. Appl.Genet. 89: 1046–1054.
Wu, R., Bradshaw, H.D., and Stettler, R.F. 1997. Molecular genet-ics of growth and development in Populus. V. Mapping quantita-tive trait loci affecting leaf variation. Am. J. Bot. 84: 143–153.
Wullschleger, S.D., Jansson, S., and Taylor, G. 2002. Genomicsand forest biology: Populus emerges as the perennial favourite.Plant Cell, 14: 2651–3655.
© 2004 NRC Canada
1498 Can. J. For. Res. Vol. 34, 2004