morningstar fund research 2012: annual global...
TRANSCRIPT

Morningstar Fund Research | 7 March 2013
2012: Annual Global Flows Report
Sylvester FloodProduct Manager, Morningstar Direct+1 312 696 [email protected]
Michael RawsonFund Analyst+1 312 696 [email protected]
John GabrielETF Strategist+1 312 384 [email protected]
Ali MasarwahEditor in Chief, German Websites+49 69 271377 [email protected]
Chiho ShimadaChief Editor+81 3 6826 [email protected]
Darren CunneenFund Research Analyst+1 61 2 9276 [email protected]
IntroductionThis survey examines the trends that drove flows into mutual funds in 2012 in five key markets: Canada, Europe, Japan, Australia, and the United States.
The report begins with a worldwide overview that includes all of these regions as well as other markets in which Morningstar tracks fund performance and assets. We then examine each key market in greater detail, analyzing flows by broad asset class, Morningstar category, fund group, and Morningstar Rating and other dimensions. We also evaluate new fund launches and look at the active versus passive dynamic in each market.
The data are based on assets reported by almost 2,400 fund groups across 71 domiciles. In total, more than 53,000 fund portfolios encompassing over 171,000 share classes are represented.
Morningstar defines estimated net flow at the fund level as the change in assets between two periods not explained by the return of the fund. When a fund reports its assets at the share- class level, the share-class return is used to compute flow. If a fund only reports assets at the fund level, the return of the oldest share class is used. Fund-level reporting prevails in the UK market and to a lesser degree in Luxembourg.
We also make adjustments for reinvested dividends, which can have a large impact in markets in which dividend payouts are significant and frequent, such as the United States.
When one share class merges into another, we reduce the target share class’ flow in the month of the merger by the final assets of the obsolete fund. Only US flows are, however, free of survivorship bias (meaning funds that were merged or liquidated are included in the data) in the commentary and tables that follow.
Organic growth rate is defined as the estimated net flow over a period divided by beginning net assets. It is used extensively by the analyst community to gauge the health of asset management firms and the industry as a whole.
We occasionally reference cross-border funds. By definition these funds are domiciled in tax havens such as Luxembourg and Ireland and are distributed in many markets, primarily in Europe, but also in Asia, Latin America and the Middle East. Cross-border funds are included in the Europe commentary that follows even when they are not explicitly referenced.
Worldwide Flows
Canada
Europe
Japan
Australia
United StatesSpecial: Investor Returns!
4
10
15
21
28
32
Contents
© 2013 Morningstar. All rights reserved. The information, data, analyses, and opinions contained herein (1) are proprietary to Morningstar, Inc. and its affiliates (collectively, “Morningstar”), (2) may not be copied or redistributed, (3) do not constitute investment advice offered by Morningstar (4) are provided solely for informational purposes and therefore are not an offer to buy or sell a security, and (5) are not warranted to be accurate, complete, or timely. Morningstar shall not be responsible for any trading decisions, damages, or other losses resulting from, or related to, this information, data, analyses or opinions or their use. Past performance is no guarantee of future results.
Morningstar Fund Research | 7 March 2013, Page 2 of 39
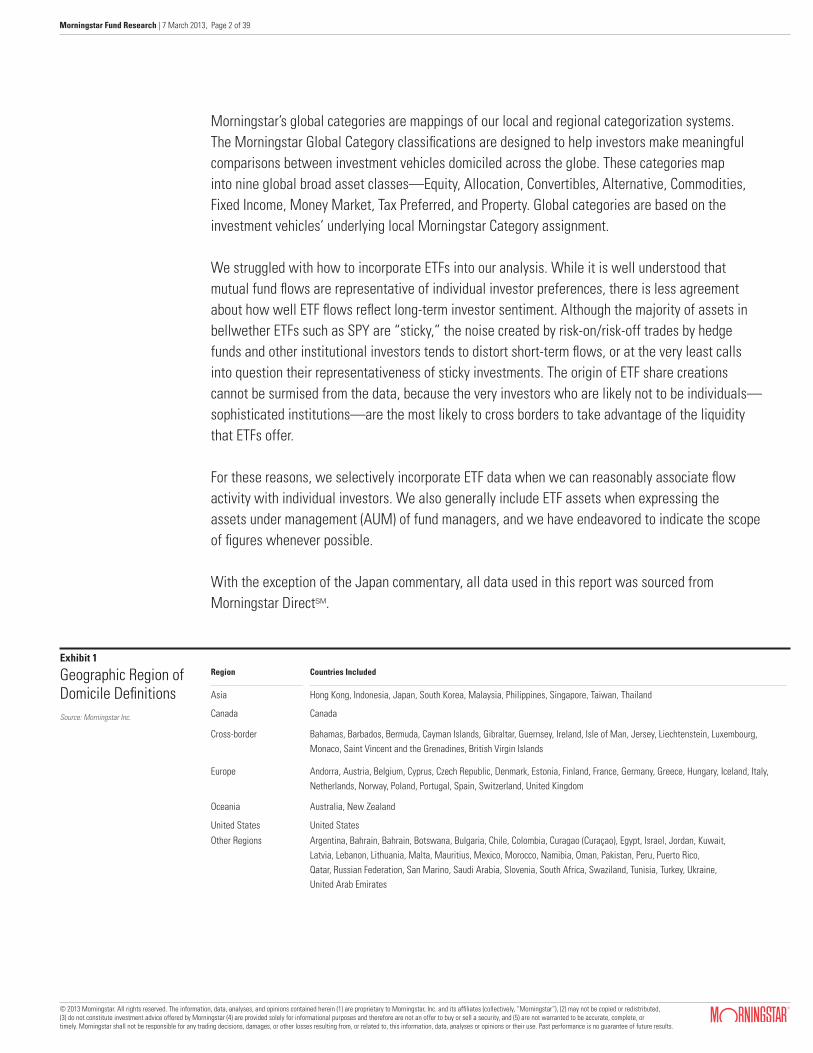
Morningstar’s global categories are mappings of our local and regional categorization systems. The Morningstar Global Category classifications are designed to help investors make meaningful comparisons between investment vehicles domiciled across the globe. These categories map into nine global broad asset classes—Equity, Allocation, Convertibles, Alternative, Commodities, Fixed Income, Money Market, Tax Preferred, and Property. Global categories are based on the investment vehicles’ underlying local Morningstar Category assignment.
We struggled with how to incorporate ETFs into our analysis. While it is well understood that mutual fund flows are representative of individual investor preferences, there is less agreement about how well ETF flows reflect long-term investor sentiment. Although the majority of assets in bellwether ETFs such as SPY are “sticky,” the noise created by risk-on/risk-off trades by hedge funds and other institutional investors tends to distort short-term flows, or at the very least calls into question their representativeness of sticky investments. The origin of ETF share creations cannot be surmised from the data, because the very investors who are likely not to be individuals—sophisticated institutions—are the most likely to cross borders to take advantage of the liquidity that ETFs offer.
For these reasons, we selectively incorporate ETF data when we can reasonably associate flow activity with individual investors. We also generally include ETF assets when expressing the assets under management (AUM) of fund managers, and we have endeavored to indicate the scope of figures whenever possible.
With the exception of the Japan commentary, all data used in this report was sourced from Morningstar DirectSM.
Region Countries Included
Asia Hong Kong, Indonesia, Japan, South Korea, Malaysia, Philippines, Singapore, Taiwan, Thailand
Canada Canada
Cross-border Bahamas, Barbados, Bermuda, Cayman Islands, Gibraltar, Guernsey, Ireland, Isle of Man, Jersey, Liechtenstein, Luxembourg, Monaco, Saint Vincent and the Grenadines, British Virgin Islands
Europe Andorra, Austria, Belgium, Cyprus, Czech Republic, Denmark, Estonia, Finland, France, Germany, Greece, Hungary, Iceland, Italy, Netherlands, Norway, Poland, Portugal, Spain, Switzerland, United Kingdom
Oceania Australia, New Zealand
United States United States
Other Regions Argentina, Bahrain, Bahrain, Botswana, Bulgaria, Chile, Colombia, Curagao (Curaçao), Egypt, Israel, Jordan, Kuwait, Latvia, Lebanon, Lithuania, Malta, Mauritius, Mexico, Morocco, Namibia, Oman, Pakistan, Peru, Puerto Rico, Qatar, Russian Federation, San Marino, Saudi Arabia, Slovenia, South Africa, Swaziland, Tunisia, Turkey, Ukraine, United Arab Emirates
Exhibit 1
Geographic Region of Domicile DefinitionsSource: Morningstar Inc.

© 2013 Morningstar. All rights reserved. The information, data, analyses, and opinions contained herein (1) are proprietary to Morningstar, Inc. and its affiliates (collectively, “Morningstar”), (2) may not be copied or redistributed, (3) do not constitute investment advice offered by Morningstar (4) are provided solely for informational purposes and therefore are not an offer to buy or sell a security, and (5) are not warranted to be accurate, complete, or timely. Morningstar shall not be responsible for any trading decisions, damages, or other losses resulting from, or related to, this information, data, analyses or opinions or their use. Past performance is no guarantee of future results.
Morningstar Fund Research | 7 March 2013, Page 3 of 39
Markets Not Included in This ReportFunds domiciled in India and China have collectively decided not to report assets to the public in a meaningful way.
We track Brazil-domiciled funds, but we have not yet established local Morningstar categories. These will become available in May 2013.
Although we comprehensively track funds domiciled in Israel, they are not included in this report because of an oversight in our data production that was discovered too late to be addressed by the publishing date.
© 2013 Morningstar. All rights reserved. The information, data, analyses, and opinions contained herein (1) are proprietary to Morningstar, Inc. and its affiliates (collectively, “Morningstar”), (2) may not be copied or redistributed, (3) do not constitute investment advice offered by Morningstar (4) are provided solely for informational purposes and therefore are not an offer to buy or sell a security, and (5) are not warranted to be accurate, complete, or timely. Morningstar shall not be responsible for any trading decisions, damages, or other losses resulting from, or related to, this information, data, analyses or opinions or their use. Past performance is no guarantee of future results.
Morningstar Fund Research | 7 March 2013, Page 4 of 39
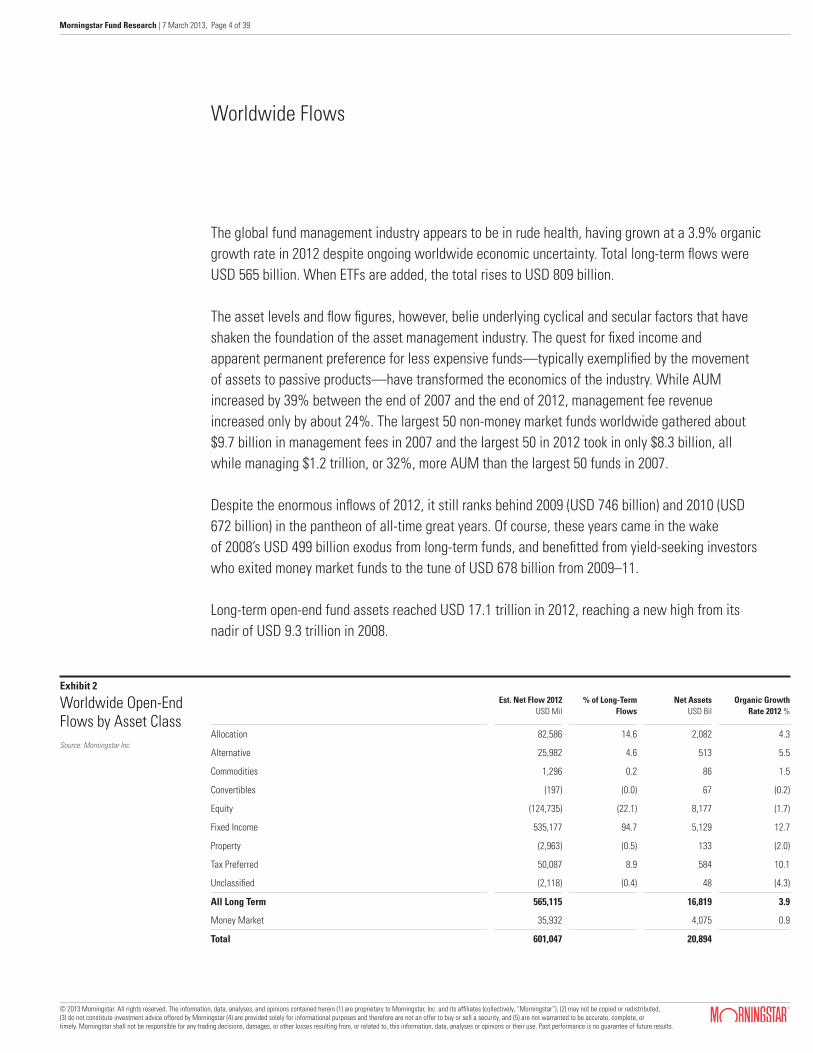
The global fund management industry appears to be in rude health, having grown at a 3.9% organic growth rate in 2012 despite ongoing worldwide economic uncertainty. Total long-term flows were USD 565 billion. When ETFs are added, the total rises to USD 809 billion.
The asset levels and flow figures, however, belie underlying cyclical and secular factors that have shaken the foundation of the asset management industry. The quest for fixed income and apparent permanent preference for less expensive funds—typically exemplified by the movement of assets to passive products—have transformed the economics of the industry. While AUM increased by 39% between the end of 2007 and the end of 2012, management fee revenue increased only by about 24%. The largest 50 non-money market funds worldwide gathered about $9.7 billion in management fees in 2007 and the largest 50 in 2012 took in only $8.3 billion, all while managing $1.2 trillion, or 32%, more AUM than the largest 50 funds in 2007.
Despite the enormous inflows of 2012, it still ranks behind 2009 (USD 746 billion) and 2010 (USD 672 billion) in the pantheon of all-time great years. Of course, these years came in the wake of 2008’s USD 499 billion exodus from long-term funds, and benefitted from yield-seeking investors who exited money market funds to the tune of USD 678 billion from 2009–11.
Long-term open-end fund assets reached USD 17.1 trillion in 2012, reaching a new high from its nadir of USD 9.3 trillion in 2008.
Worldwide Flows
Est. Net Flow 2012 USD Mil
% of Long-Term Flows
Net Assets USD Bil
Organic Growth Rate 2012 %
Allocation 82,586 14.6 2,082 4.3
Alternative 25,982 4.6 513 5.5
Commodities 1,296 0.2 86 1.5
Convertibles (197) (0.0) 67 (0.2)
Equity (124,735) (22.1) 8,177 (1.7)
Fixed Income 535,177 94.7 5,129 12.7
Property (2,963) (0.5) 133 (2.0)
Tax Preferred 50,087 8.9 584 10.1
Unclassified (2,118) (0.4) 48 (4.3)
All Long Term 565,115 16,819 3.9
Money Market 35,932 4,075 0.9
Total 601,047 20,894
Exhibit 2
Worldwide Open-End Flows by Asset ClassSource: Morningstar Inc.
© 2013 Morningstar. All rights reserved. The information, data, analyses, and opinions contained herein (1) are proprietary to Morningstar, Inc. and its affiliates (collectively, “Morningstar”), (2) may not be copied or redistributed, (3) do not constitute investment advice offered by Morningstar (4) are provided solely for informational purposes and therefore are not an offer to buy or sell a security, and (5) are not warranted to be accurate, complete, or timely. Morningstar shall not be responsible for any trading decisions, damages, or other losses resulting from, or related to, this information, data, analyses or opinions or their use. Past performance is no guarantee of future results.
Morningstar Fund Research | 7 March 2013, Page 5 of 39
This worldwide commentary encompasses the 71 domiciles in which we track assets for funds—USD 20.7 trillion worth, including money markets—and touches on the USD 1.9 trillion Morningstar ETF universe when applicable.
The hearty condition of the fund industry should not be surprising given the gift bestowed upon it by developed-world central banks. More than any other factor, low interest rates have driven investors to seek income and, to a lesser degree, embrace riskier asset classes than they would in a normal rate environment. The perceived safety of bonds relative to stocks should not be underestimated as a contributing factor
The prevailing trend today, therefore, is investor hunger for yield and the quest for the perceived safety of fixed-income funds. Worldwide, these funds, including US municipal bond funds, gathered USD 535 billion in 2012, or nearly 95% of long-term net flows.
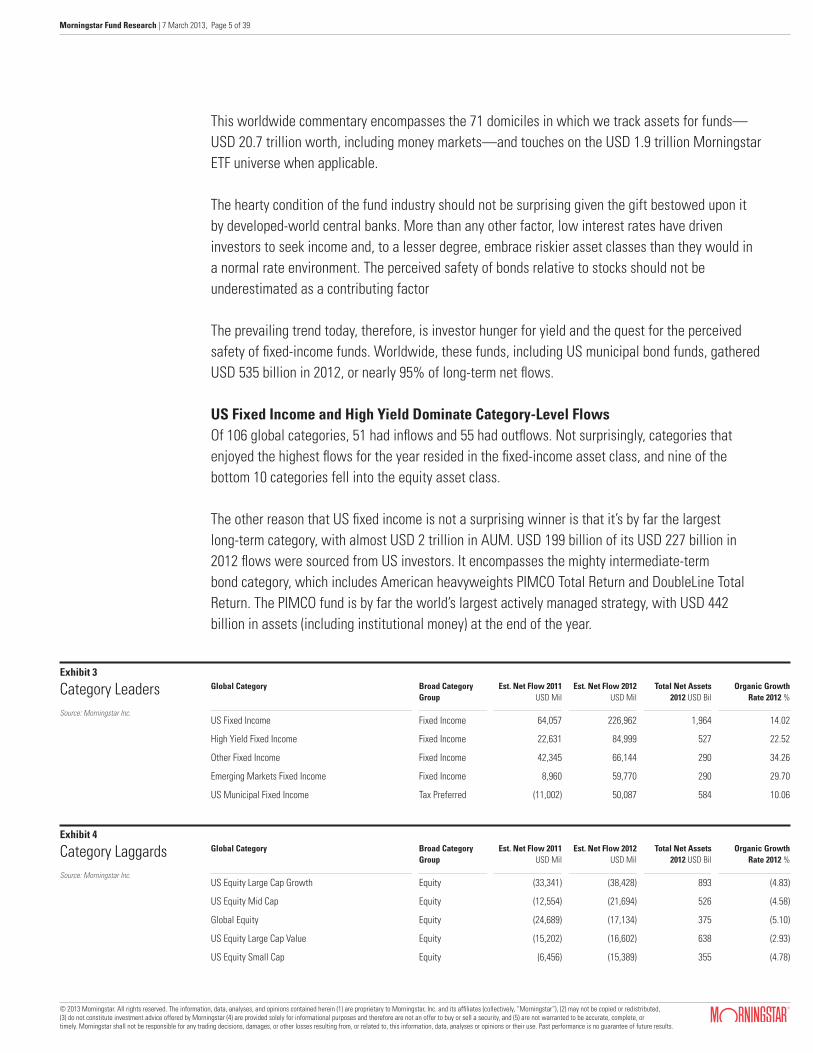
US Fixed Income and High Yield Dominate Category-Level FlowsOf 106 global categories, 51 had inflows and 55 had outflows. Not surprisingly, categories that enjoyed the highest flows for the year resided in the fixed-income asset class, and nine of the bottom 10 categories fell into the equity asset class.
The other reason that US fixed income is not a surprising winner is that it’s by far the largest long-term category, with almost USD 2 trillion in AUM. USD 199 billion of its USD 227 billion in 2012 flows were sourced from US investors. It encompasses the mighty intermediate-term bond category, which includes American heavyweights PIMCO Total Return and DoubleLine Total Return. The PIMCO fund is by far the world’s largest actively managed strategy, with USD 442 billion in assets (including institutional money) at the end of the year.
Global Category Broad Category Group
Est. Net Flow 2011 USD Mil
Est. Net Flow 2012 USD Mil
Total Net Assets 2012 USD Bil
Organic Growth Rate 2012 %
US Fixed Income Fixed Income 64,057 226,962 1,964 14.02
High Yield Fixed Income Fixed Income 22,631 84,999 527 22.52
Other Fixed Income Fixed Income 42,345 66,144 290 34.26
Emerging Markets Fixed Income Fixed Income 8,960 59,770 290 29.70
US Municipal Fixed Income Tax Preferred (11,002) 50,087 584 10.06
Exhibit 3
Category LeadersSource: Morningstar Inc.
Global Category Broad Category Group
Est. Net Flow 2011 USD Mil
Est. Net Flow 2012 USD Mil
Total Net Assets 2012 USD Bil
Organic Growth Rate 2012 %
US Equity Large Cap Growth Equity (33,341) (38,428) 893 (4.83)
US Equity Mid Cap Equity (12,554) (21,694) 526 (4.58)
Global Equity Equity (24,689) (17,134) 375 (5.10)
US Equity Large Cap Value Equity (15,202) (16,602) 638 (2.93)
US Equity Small Cap Equity (6,456) (15,389) 355 (4.78)
Exhibit 4
Category LaggardsSource: Morningstar Inc.
© 2013 Morningstar. All rights reserved. The information, data, analyses, and opinions contained herein (1) are proprietary to Morningstar, Inc. and its affiliates (collectively, “Morningstar”), (2) may not be copied or redistributed, (3) do not constitute investment advice offered by Morningstar (4) are provided solely for informational purposes and therefore are not an offer to buy or sell a security, and (5) are not warranted to be accurate, complete, or timely. Morningstar shall not be responsible for any trading decisions, damages, or other losses resulting from, or related to, this information, data, analyses or opinions or their use. Past performance is no guarantee of future results.
Morningstar Fund Research | 7 March 2013, Page 6 of 39
The love affair with high yield heated up significantly in 2012. Investors worldwide uniformly chased high-yield funds, but the figure that stands out is the 47% organic growth rate for category funds among cross-border investors. Many of the most popular offerings are tended by US-based asset managers, including AllianceBernstein, Muzinich, Neuberger Berman, and PIMCO. The leading cross-border high-yield fund, however, was AXA IM FIIS US Short Duration Hi Yld, with USD 5.8 billion in inflows.
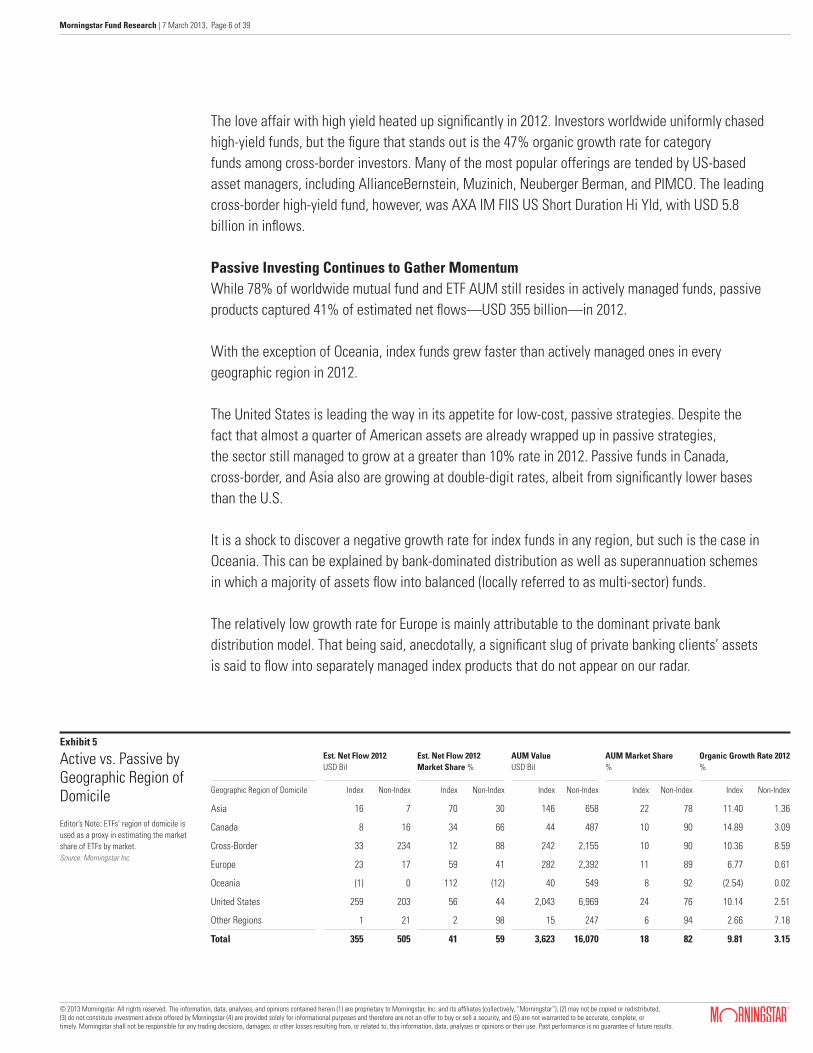
Passive Investing Continues to Gather MomentumWhile 78% of worldwide mutual fund and ETF AUM still resides in actively managed funds, passive products captured 41% of estimated net flows—USD 355 billion—in 2012.
With the exception of Oceania, index funds grew faster than actively managed ones in every geographic region in 2012.
The United States is leading the way in its appetite for low-cost, passive strategies. Despite the fact that almost a quarter of American assets are already wrapped up in passive strategies, the sector still managed to grow at a greater than 10% rate in 2012. Passive funds in Canada, cross-border, and Asia also are growing at double-digit rates, albeit from significantly lower bases than the U.S.
It is a shock to discover a negative growth rate for index funds in any region, but such is the case in Oceania. This can be explained by bank-dominated distribution as well as superannuation schemes in which a majority of assets flow into balanced (locally referred to as multi-sector) funds.
The relatively low growth rate for Europe is mainly attributable to the dominant private bank distribution model. That being said, anecdotally, a significant slug of private banking clients’ assets is said to flow into separately managed index products that do not appear on our radar.
Est. Net Flow 2012USD Bil
Est. Net Flow 2012Market Share %
AUM Value USD Bil
AUM Market Share %
Organic Growth Rate 2012%
Geographic Region of Domicile Index Non-Index Index Non-Index Index Non-Index Index Non-Index Index Non-Index
Asia 16 7 70 30 146 658 22 78 11.40 1.36
Canada 8 16 34 66 44 487 10 90 14.89 3.09
Cross-Border 33 234 12 88 242 2,155 10 90 10.36 8.59
Europe 23 17 59 41 282 2,392 11 89 6.77 0.61
Oceania (1) 0 112 (12) 40 549 8 92 (2.54) 0.02
United States 259 203 56 44 2,043 6,969 24 76 10.14 2.51
Other Regions 1 21 2 98 15 247 6 94 2.66 7.18
Total 355 505 41 59 3,623 16,070 18 82 9.81 3.15
Exhibit 5
Active vs. Passive by Geographic Region of Domicile
Editor’s Note: ETFs’ region of domicile is used as a proxy in estimating the market share of ETFs by market.Source: Morningstar Inc.
© 2013 Morningstar. All rights reserved. The information, data, analyses, and opinions contained herein (1) are proprietary to Morningstar, Inc. and its affiliates (collectively, “Morningstar”), (2) may not be copied or redistributed, (3) do not constitute investment advice offered by Morningstar (4) are provided solely for informational purposes and therefore are not an offer to buy or sell a security, and (5) are not warranted to be accurate, complete, or timely. Morningstar shall not be responsible for any trading decisions, damages, or other losses resulting from, or related to, this information, data, analyses or opinions or their use. Past performance is no guarantee of future results.
Morningstar Fund Research | 7 March 2013, Page 7 of 39
Est. Net Flow 2012USD Bil
Net AssetsDec 2012
USD Bil
% of Flows % of AUM
5-star 314 2,537 52.7 14.8
4-star 148 5,297 24.8 31.0
3-star (173) 4,472 (29.1) 26.2
2-star (160) 1,329 (26.9) 7.8
1-star (52) 299 (8.8) 1.7
Not Rated: <1 Year 284 331 47.8 1.9
Not Rated: 1–2 Years 142 411 23.8 2.4
Not Rated: 2+ Years 94 2,423 15.7 14.2
All Rated 77 13,934 12.7 81.5
All Unrated 520 3,164 87.3 18.5
Exhibit 6
Unrated Funds Captured the Lion’s Share of Flows in 2012 (Long-TermFunds)Source: Morningstar Inc.
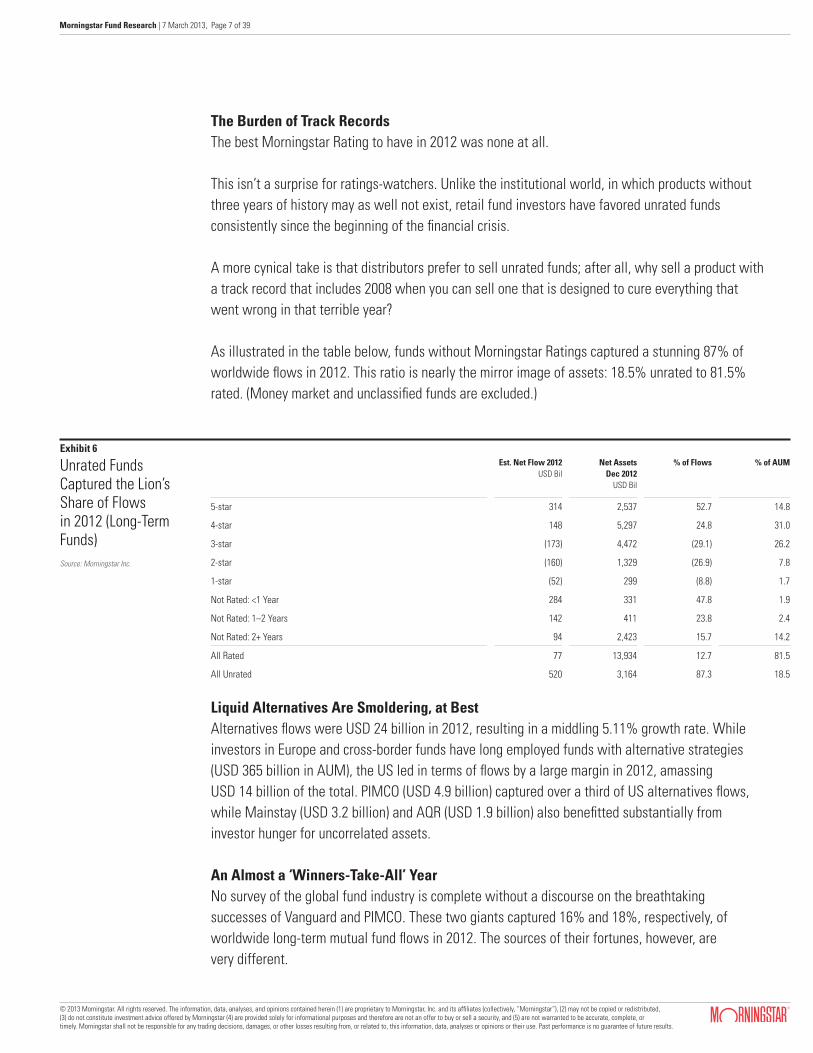
The Burden of Track RecordsThe best Morningstar Rating to have in 2012 was none at all.
This isn’t a surprise for ratings-watchers. Unlike the institutional world, in which products without three years of history may as well not exist, retail fund investors have favored unrated funds consistently since the beginning of the financial crisis.
A more cynical take is that distributors prefer to sell unrated funds; after all, why sell a product with a track record that includes 2008 when you can sell one that is designed to cure everything that went wrong in that terrible year?
As illustrated in the table below, funds without Morningstar Ratings captured a stunning 87% of worldwide flows in 2012. This ratio is nearly the mirror image of assets: 18.5% unrated to 81.5% rated. (Money market and unclassified funds are excluded.)
Liquid Alternatives Are Smoldering, at BestAlternatives flows were USD 24 billion in 2012, resulting in a middling 5.11% growth rate. While investors in Europe and cross-border funds have long employed funds with alternative strategies (USD 365 billion in AUM), the US led in terms of flows by a large margin in 2012, amassing USD 14 billion of the total. PIMCO (USD 4.9 billion) captured over a third of US alternatives flows, while Mainstay (USD 3.2 billion) and AQR (USD 1.9 billion) also benefitted substantially from investor hunger for uncorrelated assets.
An Almost a ‘Winners-Take-All’ YearNo survey of the global fund industry is complete without a discourse on the breathtaking successes of Vanguard and PIMCO. These two giants captured 16% and 18%, respectively, of worldwide long-term mutual fund flows in 2012. The sources of their fortunes, however, are very different.

© 2013 Morningstar. All rights reserved. The information, data, analyses, and opinions contained herein (1) are proprietary to Morningstar, Inc. and its affiliates (collectively, “Morningstar”), (2) may not be copied or redistributed, (3) do not constitute investment advice offered by Morningstar (4) are provided solely for informational purposes and therefore are not an offer to buy or sell a security, and (5) are not warranted to be accurate, complete, or timely. Morningstar shall not be responsible for any trading decisions, damages, or other losses resulting from, or related to, this information, data, analyses or opinions or their use. Past performance is no guarantee of future results.
Morningstar Fund Research | 7 March 2013, Page 8 of 39
Vanguard is uniquely positioned to benefit from growing investor awareness of cost in investing outcomes. Across mutual funds and ETFs, the firm raked in USD 145 billion in long-term flows and ended the year with USD 1.9 trillion in assets. Two thirds of its worldwide AUM is in funds that have 4- or 5-star Morningstar Ratings. The firm’s 2012 flow is greater than the sum of the 3,244 fund groups with the worst flows. Ninety-seven percent of its AUM is US-based.
What’s more, it may also be a shock to learn that USD 628 billion, or 33%, of Vanguard’s AUM lineup consists of actively managed funds. The Vanguard story demonstrates that alpha-seeking strategies also become more appealing when they are low-cost.
The company is only the 36th largest asset manager in Europe, having moved up three slots since the end of 2011.
The European fund industry should be alarmed rather than comforted by this fact. With the Retail Distribution Review (RDR) in force in the UK and with the rest of Europe watching closely, the gallows await weaker, high-cost players. It’s not a matter of if, but when.
Vanguard’s core characteristics—low costs, a broad lineup of products, direct distribution, and a mutualized ownership structure—together weave an inimitable web of activities that keeps rival fund executives awake at night. Whether Vanguard can leverage its primarily American success in the increasingly American-looking UK market will foreshadow continental Europe’s future.
Assets USD Bil Market Share of AUM % Est. Net Flow USD Mil
Name 12/2012 12/2011 2012 2011 2012 Market Share of Flow %
Vanguard 1,627 1,362 9.62 9.27 91,331 15.39
Fidelity 1,141 996 6.75 6.78 2,731 0.46
American Funds (Capital Group) 920 854 5.44 5.81 (61,619) (10.38)
PIMCO 707 540 4.18 3.67 106,881 18.00
Franklin Templeton 555 482 3.28 3.28 9,855 1.66
BlackRock 365 306 2.16 2.08 13,778 2.32
T. Rowe Price 339 281 2.00 1.91 14,951 2.52
JPMorgan 295 234 1.75 1.59 36,619 6.17
Invesco 231 197 1.37 1.34 2,347 0.40
UBS 194 175 1.15 1.19 2,852 0.48
Exhibit 8
Largest Open-End Fund Groups WorldwideRanked by December 2012 AUMExcludes money markets and funds of fundsSource: Morningstar Inc.
Est. Net Flow 2012 Active
USD Mil
Est. Net Flow 2012PassiveUSD Mil
ETF+OE AUM USD Bil
Organic Growth Rate 2012 %
Flows from New Products
(<36 mos)
% of Non-US AUM
Vanguard 18,750 125,943 1,874 9.44 5.5 3.2
PIMCO 112,148 716 717 20.75 39.8 20.2
Exhibit 7
Dominating Differing NichesSource: Morningstar Inc.
© 2013 Morningstar. All rights reserved. The information, data, analyses, and opinions contained herein (1) are proprietary to Morningstar, Inc. and its affiliates (collectively, “Morningstar”), (2) may not be copied or redistributed, (3) do not constitute investment advice offered by Morningstar (4) are provided solely for informational purposes and therefore are not an offer to buy or sell a security, and (5) are not warranted to be accurate, complete, or timely. Morningstar shall not be responsible for any trading decisions, damages, or other losses resulting from, or related to, this information, data, analyses or opinions or their use. Past performance is no guarantee of future results.
Morningstar Fund Research | 7 March 2013, Page 9 of 39
No firm has benefitted from the worldwide demand for fixed-income products more than PIMCO. The California manager has amassed an estimated USD 353 billion of inflows since the beginning of 2008, and 2012 was the first year it broke through the USD 100 billion barrier.
The company’s non-US business is much more robust than Vanguard’s. PIMCO has proved that it can succeed in the fragmented European market; its association with Allianz could only have helped it in this regard.
Finally, PIMCO has responded to the financial crisis with products that resonate with investor tastes, such as Real Return, Commodity Real Return, Unconstrained Bond, and Emerging Local Bond. About one third of their flows in 2012 came from funds that don’t yet have a three-year track record.
The firm is not content to rest on the success of its fixed-income franchise. It is aggressively seeking to establish a robust non-fixed-income product lineup for the day when investor sentiment favors equities once again. Only 3% of PIMCO’s worldwide open-end AUM resided in equity products at the end of 2012, while 91% rested in fixed income.
© 2013 Morningstar. All rights reserved. The information, data, analyses, and opinions contained herein (1) are proprietary to Morningstar, Inc. and its affiliates (collectively, “Morningstar”), (2) may not be copied or redistributed, (3) do not constitute investment advice offered by Morningstar (4) are provided solely for informational purposes and therefore are not an offer to buy or sell a security, and (5) are not warranted to be accurate, complete, or timely. Morningstar shall not be responsible for any trading decisions, damages, or other losses resulting from, or related to, this information, data, analyses or opinions or their use. Past performance is no guarantee of future results.
Morningstar Fund Research | 7 March 2013, Page 10 of 39
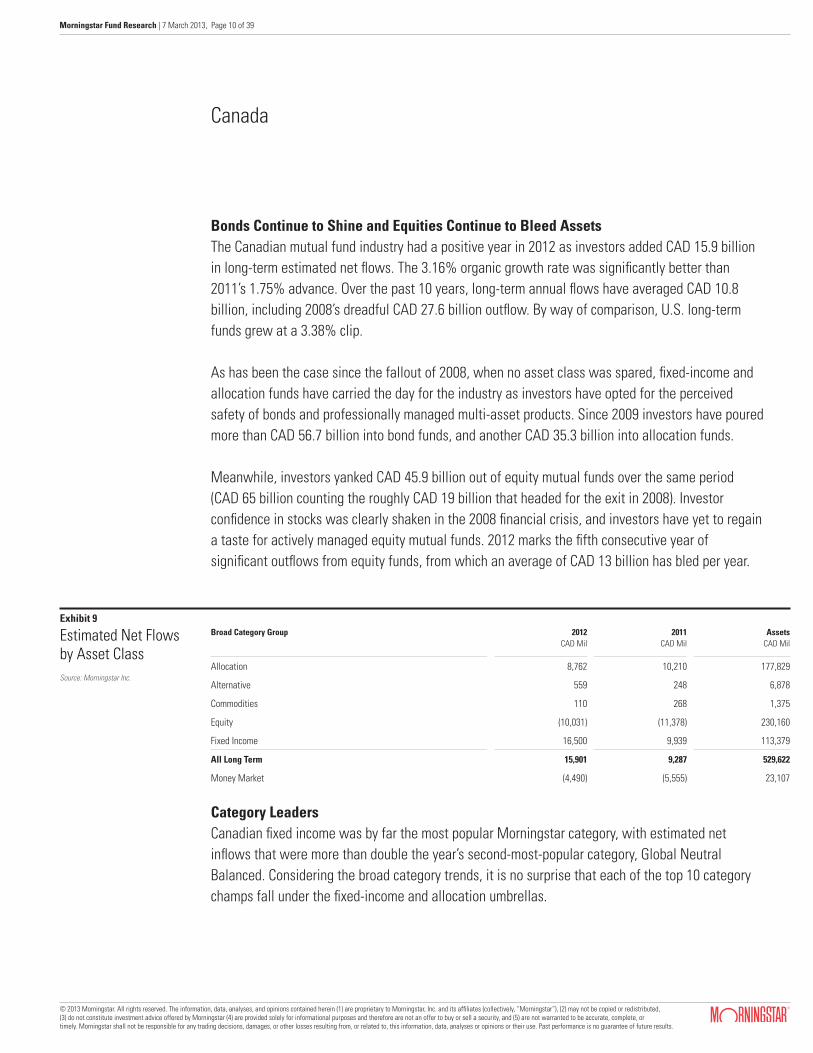
Bonds Continue to Shine and Equities Continue to Bleed AssetsThe Canadian mutual fund industry had a positive year in 2012 as investors added CAD 15.9 billion in long-term estimated net flows. The 3.16% organic growth rate was significantly better than 2011’s 1.75% advance. Over the past 10 years, long-term annual flows have averaged CAD 10.8 billion, including 2008’s dreadful CAD 27.6 billion outflow. By way of comparison, U.S. long-term funds grew at a 3.38% clip.
As has been the case since the fallout of 2008, when no asset class was spared, fixed-income and allocation funds have carried the day for the industry as investors have opted for the perceived safety of bonds and professionally managed multi-asset products. Since 2009 investors have poured more than CAD 56.7 billion into bond funds, and another CAD 35.3 billion into allocation funds.
Meanwhile, investors yanked CAD 45.9 billion out of equity mutual funds over the same period (CAD 65 billion counting the roughly CAD 19 billion that headed for the exit in 2008). Investor confidence in stocks was clearly shaken in the 2008 financial crisis, and investors have yet to regain a taste for actively managed equity mutual funds. 2012 marks the fifth consecutive year of significant outflows from equity funds, from which an average of CAD 13 billion has bled per year.
Canada
Broad Category Group 2012CAD Mil
2011CAD Mil
Assets CAD Mil
Allocation 8,762 10,210 177,829
Alternative 559 248 6,878
Commodities 110 268 1,375
Equity (10,031) (11,378) 230,160
Fixed Income 16,500 9,939 113,379
All Long Term 15,901 9,287 529,622
Money Market (4,490) (5,555) 23,107
Exhibit 9
Estimated Net Flows by Asset ClassSource: Morningstar Inc.
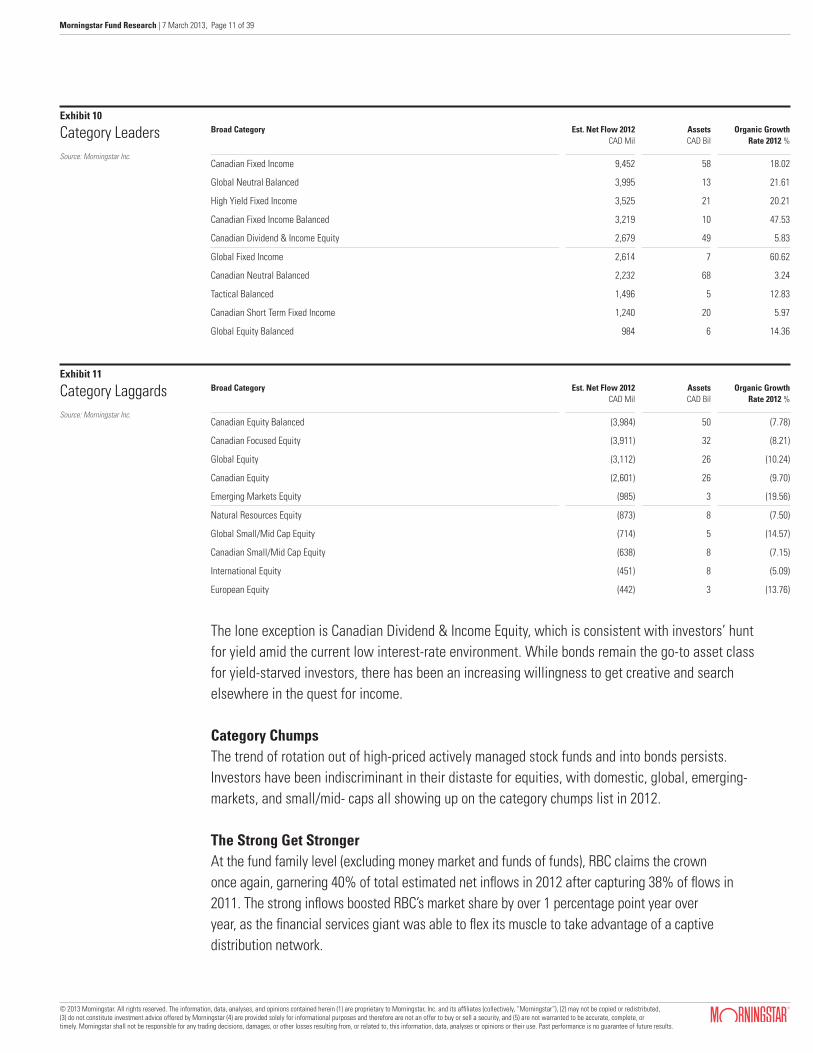
Category LeadersCanadian fixed income was by far the most popular Morningstar category, with estimated net inflows that were more than double the year’s second-most-popular category, Global Neutral Balanced. Considering the broad category trends, it is no surprise that each of the top 10 category champs fall under the fixed-income and allocation umbrellas.
© 2013 Morningstar. All rights reserved. The information, data, analyses, and opinions contained herein (1) are proprietary to Morningstar, Inc. and its affiliates (collectively, “Morningstar”), (2) may not be copied or redistributed, (3) do not constitute investment advice offered by Morningstar (4) are provided solely for informational purposes and therefore are not an offer to buy or sell a security, and (5) are not warranted to be accurate, complete, or timely. Morningstar shall not be responsible for any trading decisions, damages, or other losses resulting from, or related to, this information, data, analyses or opinions or their use. Past performance is no guarantee of future results.
Morningstar Fund Research | 7 March 2013, Page 11 of 39
The lone exception is Canadian Dividend & Income Equity, which is consistent with investors’ hunt for yield amid the current low interest-rate environment. While bonds remain the go-to asset class for yield-starved investors, there has been an increasing willingness to get creative and search elsewhere in the quest for income.
Category ChumpsThe trend of rotation out of high-priced actively managed stock funds and into bonds persists. Investors have been indiscriminant in their distaste for equities, with domestic, global, emerging-markets, and small/mid- caps all showing up on the category chumps list in 2012.
The Strong Get StrongerAt the fund family level (excluding money market and funds of funds), RBC claims the crown once again, garnering 40% of total estimated net inflows in 2012 after capturing 38% of flows in 2011. The strong inflows boosted RBC’s market share by over 1 percentage point year over year, as the financial services giant was able to flex its muscle to take advantage of a captive distribution network.
Broad Category Est. Net Flow 2012 CAD Mil
Assets CAD Bil
Organic Growth Rate 2012 %
Canadian Fixed Income 9,452 58 18.02
Global Neutral Balanced 3,995 13 21.61
High Yield Fixed Income 3,525 21 20.21
Canadian Fixed Income Balanced 3,219 10 47.53
Canadian Dividend & Income Equity 2,679 49 5.83
Global Fixed Income 2,614 7 60.62
Canadian Neutral Balanced 2,232 68 3.24
Tactical Balanced 1,496 5 12.83
Canadian Short Term Fixed Income 1,240 20 5.97
Global Equity Balanced 984 6 14.36
Broad Category Est. Net Flow 2012 CAD Mil
Assets CAD Bil
Organic Growth Rate 2012 %
Canadian Equity Balanced (3,984) 50 (7.78)
Canadian Focused Equity (3,911) 32 (8.21)
Global Equity (3,112) 26 (10.24)
Canadian Equity (2,601) 26 (9.70)
Emerging Markets Equity (985) 3 (19.56)
Natural Resources Equity (873) 8 (7.50)
Global Small/Mid Cap Equity (714) 5 (14.57)
Canadian Small/Mid Cap Equity (638) 8 (7.15)
International Equity (451) 8 (5.09)
European Equity (442) 3 (13.76)
Exhibit 10
Category LeadersSource: Morningstar Inc.
Exhibit 11
Category LaggardsSource: Morningstar Inc.
© 2013 Morningstar. All rights reserved. The information, data, analyses, and opinions contained herein (1) are proprietary to Morningstar, Inc. and its affiliates (collectively, “Morningstar”), (2) may not be copied or redistributed, (3) do not constitute investment advice offered by Morningstar (4) are provided solely for informational purposes and therefore are not an offer to buy or sell a security, and (5) are not warranted to be accurate, complete, or timely. Morningstar shall not be responsible for any trading decisions, damages, or other losses resulting from, or related to, this information, data, analyses or opinions or their use. Past performance is no guarantee of future results.
Morningstar Fund Research | 7 March 2013, Page 12 of 39
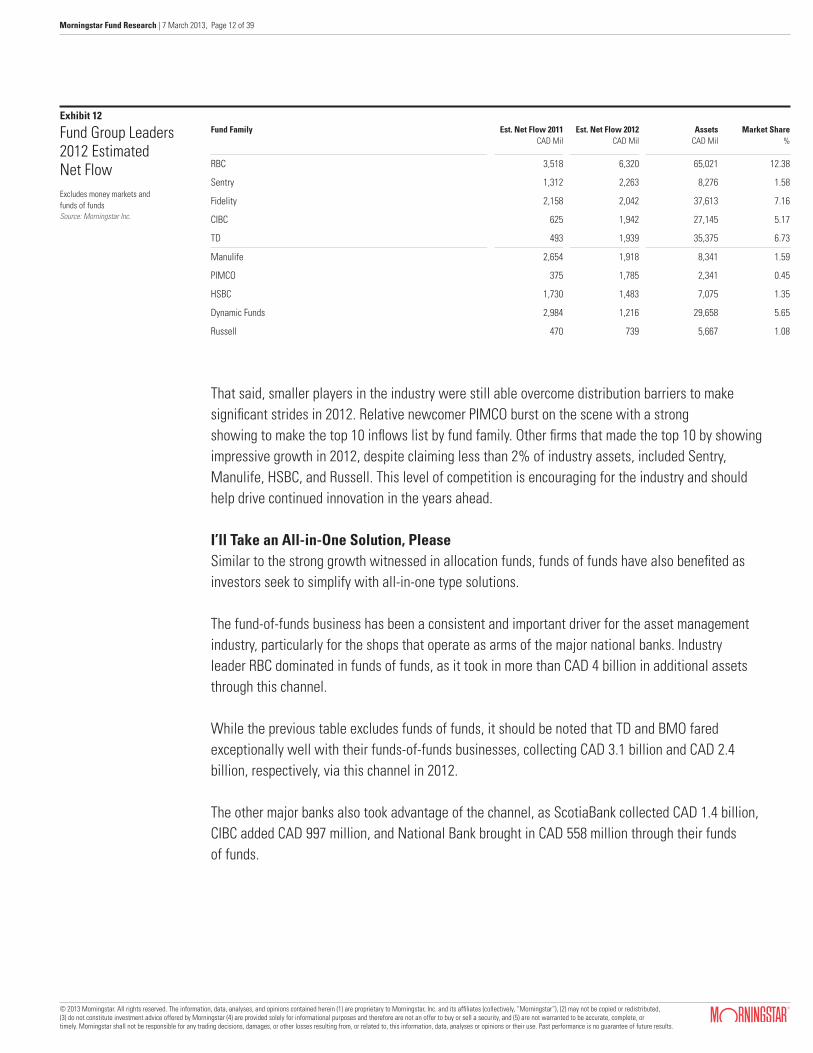
That said, smaller players in the industry were still able overcome distribution barriers to make significant strides in 2012. Relative newcomer PIMCO burst on the scene with a strong showing to make the top 10 inflows list by fund family. Other firms that made the top 10 by showing impressive growth in 2012, despite claiming less than 2% of industry assets, included Sentry, Manulife, HSBC, and Russell. This level of competition is encouraging for the industry and should help drive continued innovation in the years ahead.
I’ll Take an All-in-One Solution, PleaseSimilar to the strong growth witnessed in allocation funds, funds of funds have also benefited as investors seek to simplify with all-in-one type solutions.
The fund-of-funds business has been a consistent and important driver for the asset management industry, particularly for the shops that operate as arms of the major national banks. Industry leader RBC dominated in funds of funds, as it took in more than CAD 4 billion in additional assets through this channel.
While the previous table excludes funds of funds, it should be noted that TD and BMO fared exceptionally well with their funds-of-funds businesses, collecting CAD 3.1 billion and CAD 2.4 billion, respectively, via this channel in 2012.
The other major banks also took advantage of the channel, as ScotiaBank collected CAD 1.4 billion, CIBC added CAD 997 million, and National Bank brought in CAD 558 million through their funds of funds.
Fund Family Est. Net Flow 2011 CAD Mil
Est. Net Flow 2012 CAD Mil
AssetsCAD Mil
Market Share%
RBC 3,518 6,320 65,021 12.38
Sentry 1,312 2,263 8,276 1.58
Fidelity 2,158 2,042 37,613 7.16
CIBC 625 1,942 27,145 5.17
TD 493 1,939 35,375 6.73
Manulife 2,654 1,918 8,341 1.59
PIMCO 375 1,785 2,341 0.45
HSBC 1,730 1,483 7,075 1.35
Dynamic Funds 2,984 1,216 29,658 5.65
Russell 470 739 5,667 1.08
Exhibit 12
Fund Group Leaders 2012 Estimated Net FlowExcludes money markets and funds of fundsSource: Morningstar Inc.
© 2013 Morningstar. All rights reserved. The information, data, analyses, and opinions contained herein (1) are proprietary to Morningstar, Inc. and its affiliates (collectively, “Morningstar”), (2) may not be copied or redistributed, (3) do not constitute investment advice offered by Morningstar (4) are provided solely for informational purposes and therefore are not an offer to buy or sell a security, and (5) are not warranted to be accurate, complete, or timely. Morningstar shall not be responsible for any trading decisions, damages, or other losses resulting from, or related to, this information, data, analyses or opinions or their use. Past performance is no guarantee of future results.
Morningstar Fund Research | 7 March 2013, Page 13 of 39
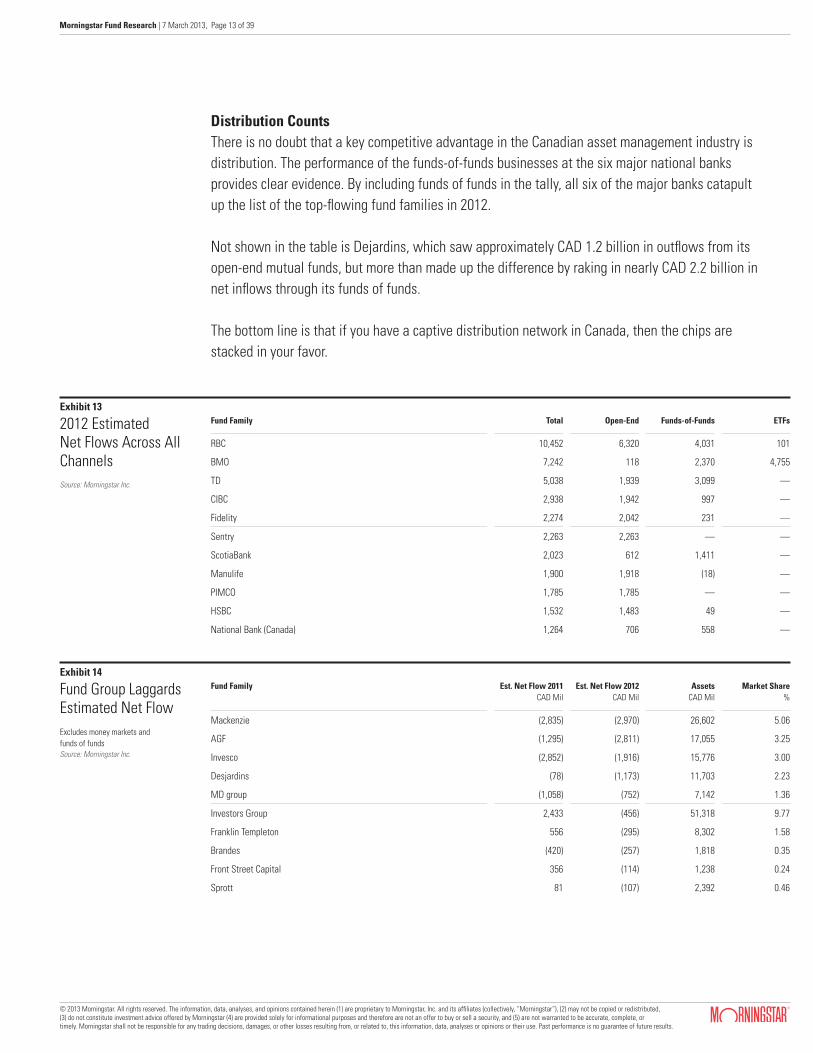
Fund Family Total Open-End Funds-of-Funds ETFs
RBC 10,452 6,320 4,031 101
BMO 7,242 118 2,370 4,755
TD 5,038 1,939 3,099 —
CIBC 2,938 1,942 997 —
Fidelity 2,274 2,042 231 —
Sentry 2,263 2,263 — —
ScotiaBank 2,023 612 1,411 —
Manulife 1,900 1,918 (18) —
PIMCO 1,785 1,785 — —
HSBC 1,532 1,483 49 —
National Bank (Canada) 1,264 706 558 —
Exhibit 13
2012 EstimatedNet Flows Across All ChannelsSource: Morningstar Inc.
Fund Family Est. Net Flow 2011 CAD Mil
Est. Net Flow 2012 CAD Mil
AssetsCAD Mil
Market Share%
Mackenzie (2,835) (2,970) 26,602 5.06
AGF (1,295) (2,811) 17,055 3.25
Invesco (2,852) (1,916) 15,776 3.00
Desjardins (78) (1,173) 11,703 2.23
MD group (1,058) (752) 7,142 1.36
Investors Group 2,433 (456) 51,318 9.77
Franklin Templeton 556 (295) 8,302 1.58
Brandes (420) (257) 1,818 0.35
Front Street Capital 356 (114) 1,238 0.24
Sprott 81 (107) 2,392 0.46
Exhibit 14
Fund Group Laggards Estimated Net FlowExcludes money markets and funds of fundsSource: Morningstar Inc.
Distribution CountsThere is no doubt that a key competitive advantage in the Canadian asset management industry is distribution. The performance of the funds-of-funds businesses at the six major national banks provides clear evidence. By including funds of funds in the tally, all six of the major banks catapult up the list of the top-flowing fund families in 2012.
Not shown in the table is Dejardins, which saw approximately CAD 1.2 billion in outflows from its open-end mutual funds, but more than made up the difference by raking in nearly CAD 2.2 billion in net inflows through its funds of funds.
The bottom line is that if you have a captive distribution network in Canada, then the chips are stacked in your favor.

© 2013 Morningstar. All rights reserved. The information, data, analyses, and opinions contained herein (1) are proprietary to Morningstar, Inc. and its affiliates (collectively, “Morningstar”), (2) may not be copied or redistributed, (3) do not constitute investment advice offered by Morningstar (4) are provided solely for informational purposes and therefore are not an offer to buy or sell a security, and (5) are not warranted to be accurate, complete, or timely. Morningstar shall not be responsible for any trading decisions, damages, or other losses resulting from, or related to, this information, data, analyses or opinions or their use. Past performance is no guarantee of future results.
Morningstar Fund Research | 7 March 2013, Page 14 of 39
Broad Category Top-Flowing Fund Est. Net Flow 2012 CAD Mil
Assets CAD Mil
Organic Growth Rate 2012 %
Fixed Income PIMCO Monthly Income Fund 1,665 2,009 886.1
Allocation Fidelity Monthly Income Series 2,176 6,448 54.4
Alternative Dynamic Alternative Yield Series 338 308 —
Commodities Sprott Gold Bullion 29 268 12.6
Equity RBC Canadian Equity Income 1,102 2,106 120.2
Exhibit 15
Top-Flowing FundsSource: Morningstar Inc.
Outside Looking InThe common theme among the Canadian fund families that experienced the sharpest estimated net outflows in 2012 is that they are not part of a bank with a national branch network.
2012 Individual Fund WinnersTwo relatively new funds rose to prominence in 2012, claiming the most estimated net inflows in their respective broad categories for the year. PIMCO Monthly Income Fund took the top spot in fixed income, while Dynamic Alternative Yield Series took the crown in alternatives. Across the board, the dominating theme once again was—you guessed it—income.
Give the People What They WantIn general, Canadian fund companies hit the mark with new fund launches in 2012. Top-flowing broad categories, fixed income and allocation, were also the top asset-gatherers among new funds launched during the year. In response to investors’ insatiable thirst for yield, 18 of the 34 new fixed-income funds were emerging-markets, global, and high-yield corporate bond funds. With the hunt for yield proving to be one of the most prominent industry themes in 2012, fund companies answered the call by launching another 26 equity funds with explicit dividend or income mandates. Heeding the pulse of the industry paid off, as new equity funds attracted healthy inflows despite a challenging environment for the broad equity category as a whole. RBC was the busiest of the major fund shops in 2012, with a total of 15 new launches, followed by Scotia with 11 new funds. Fidelity and TD launched eight new funds each, while Russell, Manulife, and Sentry each launched seven.
© 2013 Morningstar. All rights reserved. The information, data, analyses, and opinions contained herein (1) are proprietary to Morningstar, Inc. and its affiliates (collectively, “Morningstar”), (2) may not be copied or redistributed, (3) do not constitute investment advice offered by Morningstar (4) are provided solely for informational purposes and therefore are not an offer to buy or sell a security, and (5) are not warranted to be accurate, complete, or timely. Morningstar shall not be responsible for any trading decisions, damages, or other losses resulting from, or related to, this information, data, analyses or opinions or their use. Past performance is no guarantee of future results.
Morningstar Fund Research | 7 March 2013, Page 15 of 39
2012: A Year of Bond Fund Hegemony The books are closed on 2012, and despite the challenging macroeconomic environment, European investors were still enthusiastic about long-term funds. They added EUR 26.6 billion in December 2012, bringing total net inflows to long-term funds to EUR 204.6 billion over the course of 2012. Still, inflows remained well below 2009 and 2010 levels, when long-term funds attracted EUR 214.8 billion and EUR 255.2 billion, respectively.
But compared with 2011, when the eurozone crisis was raging more violently, sentiment in 2012 was bullish. That year, investors pulled EUR 58.6 billion out of long-term funds. Bearing in mind that the crisis is not resolved, Europe’s fund promoters have fared reasonably well.
The Changing Landscape of Mutual Funds in EuropeThe eurozone crisis has, however, invoked a marked shift in Europe’s fund landscape. Fixed-income vehicles witnessed an unprecedented boom in 2012. Investors poured a breathtaking EUR 178.1 billion into bond funds in 2012, the highest inflows on record (Morningstar’s European flows data dates back to 2007). In fact, bond funds captured 10 times the inflows in 2012 than they did from 2007 to 2011 combined.
Within fixed income, higher-yielding bond funds captured far more money than government bond funds, which are seen as neither risk-free nor high-yielding.
In contrast to the US, where the love affair with bond funds dates back to 2007, the fixation is newer for Europe. Before 2012, flows in Europe were distributed fairly evenly between bond and equity funds. In fact, from 2007 to 2011, equity funds enjoyed greater net inflows than bond funds, posting a combined EUR 28.4 billion in inflows compared with EUR 18.6 billion seen by fixed-income funds over that five-year period.
Equity Funds: A Brighter Shade of Pale Towards Last Year’s CloseStock funds suffered net outflows of EUR 6.8 billion in 2012. Had the fourth quarter not seen a gradual return of risk appetite, the picture for equity funds would have been even bleaker. Equity fund flows bounced back in the last three months of 2012, enjoying inflows of EUR 7.0 billion in December and EUR 13.7 billion from October to December.
Allocation funds, whose multi-asset nature appeals to investors in uncertain times, were another success story in 2012. Mixed-asset vehicles saw EUR 29.7 billion in net new money with cautious and flexible funds profiting the most.
Europe
© 2013 Morningstar. All rights reserved. The information, data, analyses, and opinions contained herein (1) are proprietary to Morningstar, Inc. and its affiliates (collectively, “Morningstar”), (2) may not be copied or redistributed, (3) do not constitute investment advice offered by Morningstar (4) are provided solely for informational purposes and therefore are not an offer to buy or sell a security, and (5) are not warranted to be accurate, complete, or timely. Morningstar shall not be responsible for any trading decisions, damages, or other losses resulting from, or related to, this information, data, analyses or opinions or their use. Past performance is no guarantee of future results.
Morningstar Fund Research | 7 March 2013, Page 16 of 39
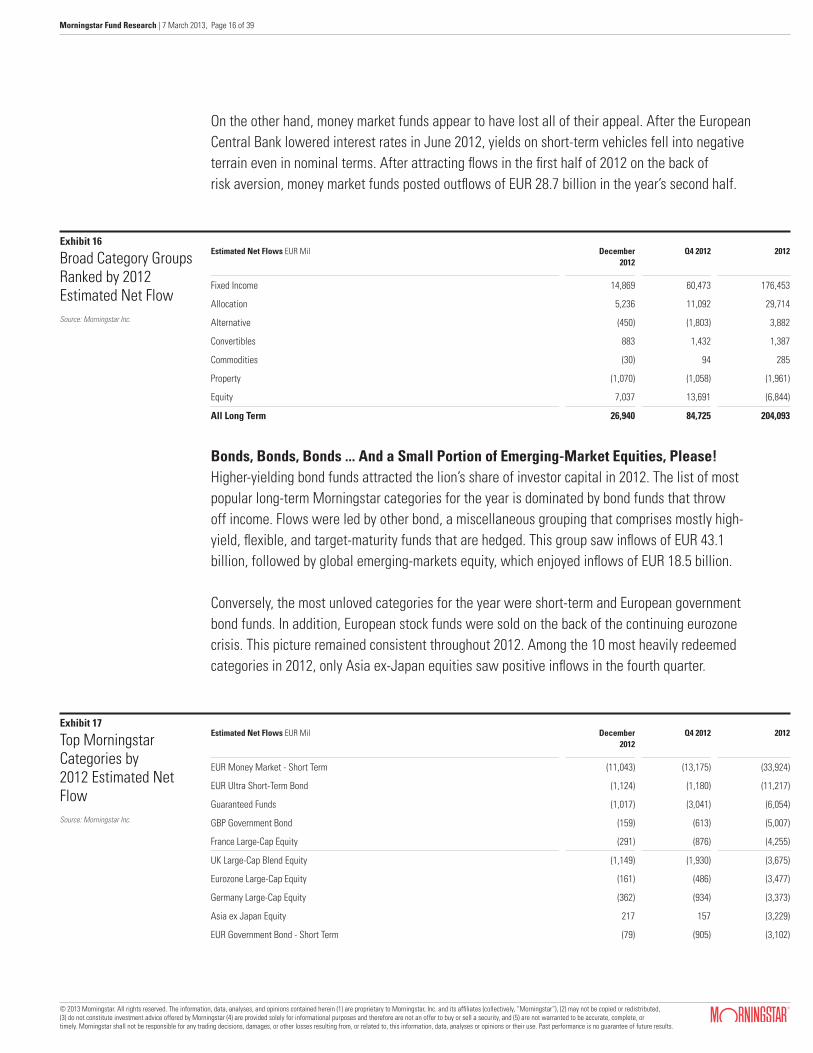
On the other hand, money market funds appear to have lost all of their appeal. After the European Central Bank lowered interest rates in June 2012, yields on short-term vehicles fell into negative terrain even in nominal terms. After attracting flows in the first half of 2012 on the back of risk aversion, money market funds posted outflows of EUR 28.7 billion in the year’s second half.
Estimated Net Flows EUR Mil December 2012
Q4 2012 2012
Fixed Income 14,869 60,473 176,453
Allocation 5,236 11,092 29,714
Alternative (450) (1,803) 3,882
Convertibles 883 1,432 1,387
Commodities (30) 94 285
Property (1,070) (1,058) (1,961)
Equity 7,037 13,691 (6,844)
All Long Term 26,940 84,725 204,093
Estimated Net Flows EUR Mil December 2012
Q4 2012 2012
EUR Money Market - Short Term (11,043) (13,175) (33,924)
EUR Ultra Short-Term Bond (1,124) (1,180) (11,217)
Guaranteed Funds (1,017) (3,041) (6,054)
GBP Government Bond (159) (613) (5,007)
France Large-Cap Equity (291) (876) (4,255)
UK Large-Cap Blend Equity (1,149) (1,930) (3,675)
Eurozone Large-Cap Equity (161) (486) (3,477)
Germany Large-Cap Equity (362) (934) (3,373)
Asia ex Japan Equity 217 157 (3,229)
EUR Government Bond - Short Term (79) (905) (3,102)
Exhibit 16
Broad Category Groups Ranked by 2012 Estimated Net FlowSource: Morningstar Inc.
Exhibit 17
Top Morningstar Categories by 2012 Estimated Net FlowSource: Morningstar Inc.
Bonds, Bonds, Bonds ... And a Small Portion of Emerging-Market Equities, Please!Higher-yielding bond funds attracted the lion’s share of investor capital in 2012. The list of most popular long-term Morningstar categories for the year is dominated by bond funds that throw off income. Flows were led by other bond, a miscellaneous grouping that comprises mostly high-yield, flexible, and target-maturity funds that are hedged. This group saw inflows of EUR 43.1 billion, followed by global emerging-markets equity, which enjoyed inflows of EUR 18.5 billion.
Conversely, the most unloved categories for the year were short-term and European government bond funds. In addition, European stock funds were sold on the back of the continuing eurozone crisis. This picture remained consistent throughout 2012. Among the 10 most heavily redeemed categories in 2012, only Asia ex-Japan equities saw positive inflows in the fourth quarter.
© 2013 Morningstar. All rights reserved. The information, data, analyses, and opinions contained herein (1) are proprietary to Morningstar, Inc. and its affiliates (collectively, “Morningstar”), (2) may not be copied or redistributed, (3) do not constitute investment advice offered by Morningstar (4) are provided solely for informational purposes and therefore are not an offer to buy or sell a security, and (5) are not warranted to be accurate, complete, or timely. Morningstar shall not be responsible for any trading decisions, damages, or other losses resulting from, or related to, this information, data, analyses or opinions or their use. Past performance is no guarantee of future results.
Morningstar Fund Research | 7 March 2013, Page 17 of 39
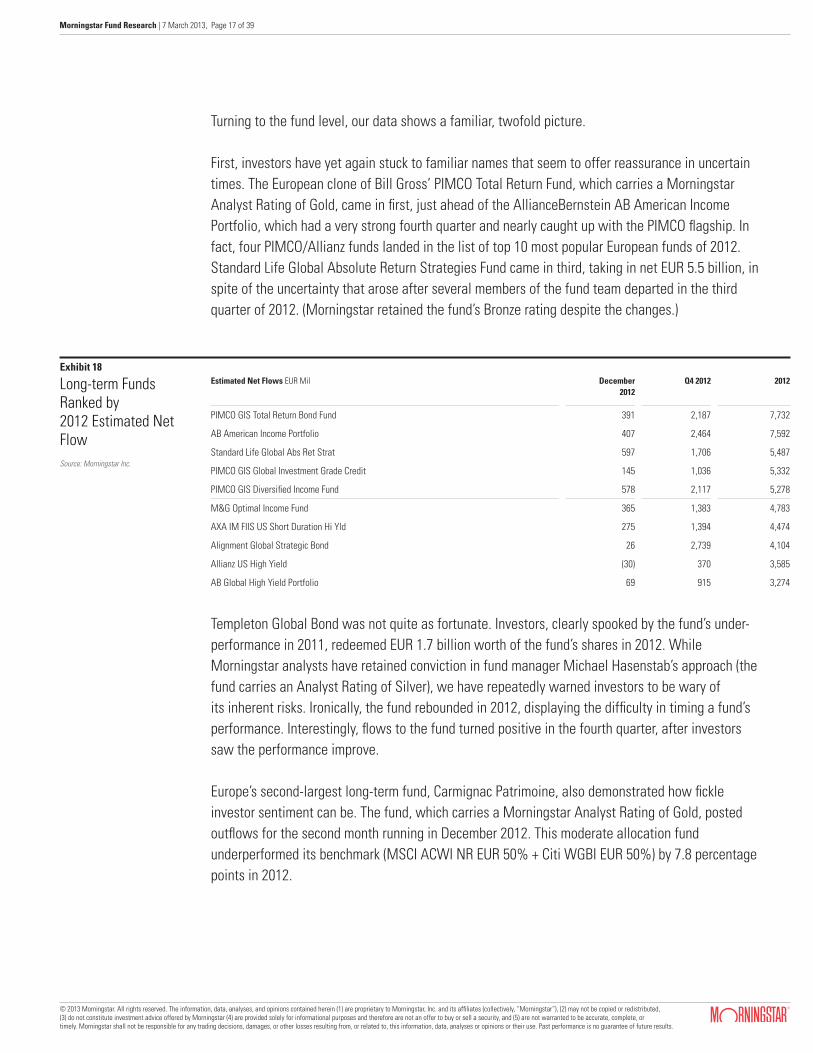
Turning to the fund level, our data shows a familiar, twofold picture.
First, investors have yet again stuck to familiar names that seem to offer reassurance in uncertain times. The European clone of Bill Gross’ PIMCO Total Return Fund, which carries a Morningstar Analyst Rating of Gold, came in first, just ahead of the AllianceBernstein AB American Income Portfolio, which had a very strong fourth quarter and nearly caught up with the PIMCO flagship. In fact, four PIMCO/Allianz funds landed in the list of top 10 most popular European funds of 2012. Standard Life Global Absolute Return Strategies Fund came in third, taking in net EUR 5.5 billion, in spite of the uncertainty that arose after several members of the fund team departed in the third quarter of 2012. (Morningstar retained the fund’s Bronze rating despite the changes.)
Estimated Net Flows EUR Mil December 2012
Q4 2012 2012
PIMCO GIS Total Return Bond Fund 391 2,187 7,732
AB American Income Portfolio 407 2,464 7,592
Standard Life Global Abs Ret Strat 597 1,706 5,487
PIMCO GIS Global Investment Grade Credit 145 1,036 5,332
PIMCO GIS Diversified Income Fund 578 2,117 5,278
M&G Optimal Income Fund 365 1,383 4,783
AXA IM FIIS US Short Duration Hi Yld 275 1,394 4,474
Alignment Global Strategic Bond 26 2,739 4,104
Allianz US High Yield (30) 370 3,585
AB Global High Yield Portfolio 69 915 3,274
Exhibit 18
Long-term Funds Ranked by 2012 Estimated Net FlowSource: Morningstar Inc.
Templeton Global Bond was not quite as fortunate. Investors, clearly spooked by the fund’s under-performance in 2011, redeemed EUR 1.7 billion worth of the fund’s shares in 2012. While Morningstar analysts have retained conviction in fund manager Michael Hasenstab’s approach (the fund carries an Analyst Rating of Silver), we have repeatedly warned investors to be wary of its inherent risks. Ironically, the fund rebounded in 2012, displaying the difficulty in timing a fund’s performance. Interestingly, flows to the fund turned positive in the fourth quarter, after investors saw the performance improve.
Europe’s second-largest long-term fund, Carmignac Patrimoine, also demonstrated how fickle investor sentiment can be. The fund, which carries a Morningstar Analyst Rating of Gold, posted outflows for the second month running in December 2012. This moderate allocation fund underperformed its benchmark (MSCI ACWI NR EUR 50% + Citi WGBI EUR 50%) by 7.8 percentage points in 2012.

© 2013 Morningstar. All rights reserved. The information, data, analyses, and opinions contained herein (1) are proprietary to Morningstar, Inc. and its affiliates (collectively, “Morningstar”), (2) may not be copied or redistributed, (3) do not constitute investment advice offered by Morningstar (4) are provided solely for informational purposes and therefore are not an offer to buy or sell a security, and (5) are not warranted to be accurate, complete, or timely. Morningstar shall not be responsible for any trading decisions, damages, or other losses resulting from, or related to, this information, data, analyses or opinions or their use. Past performance is no guarantee of future results.
Morningstar Fund Research | 7 March 2013, Page 18 of 39
Estimated Net Flows EUR Mil December 2012
Q4 2012 2012 Fund Size EUR Mil
Templeton Glb Bond 46 454 (1,700) 34,237
Carmignac Patrimoine (121) (271) 1,997 28,014
PIMCO GIS Total Return Bond Fund 391 2,187 7,732 25,756
Templeton Global Total Return 510 1,430 2,164 22,240
AB Global High Yield Portfolio 69 915 3,274 18,753
Standard Life Global Abs Ret Strat 597 1,706 5,487 18,014
PIMCO GIS Global Investment Grade Credit 145 1,036 5,332 17,337
IP High Income (63) (153) (314) 14,629
M&G Optimal Income Fund 365 1,383 4,783 13,674
Templeton Asian Growth (140) (204) (81) 13,298
Exhibit 19
Long-term Funds Ranked by Fund SizeSource: Morningstar Inc.
Estimated Net Flows EUR Mil December 2012
Q3 2012 2012
PIMCO 3,051 10,774 32,085
AllianceBernstein 1,362 4,729 13,236
AXA 438 2,174 9,032
BlackRock 1,179 4,196 8,336
M&G 42 940 7,993
Aberdeen 1,429 3,544 7,975
Nordea 648 1,834 7,012
JPMorgan 953 3,135 6,907
Credit Suisse 1,040 5,706 6,743
Pictet 931 1,517 5,714
Exhibit 20
Top 10 Fund Promoters by 2012 Estimated Net FlowSource: Morningstar Inc.
And What about the Fund Promoters? Unsurprisingly in the year of the bond fund, fixed-income specialist PIMCO dominated flows, posting 2.5 times the inflows seen by runner-up AllianceBernstein. Only two of the 10 most popular fund providers were not bond-focused. Aberdeen was the main beneficiary of the flows to emerging-markets equity funds, and M&G benefited from the popularity of allocation funds. If investors continue to focus on fixed-income investments in 2013, the beneficiaries of 2012 appear well set to continue featuring prominently in fund sales rankings going forward.
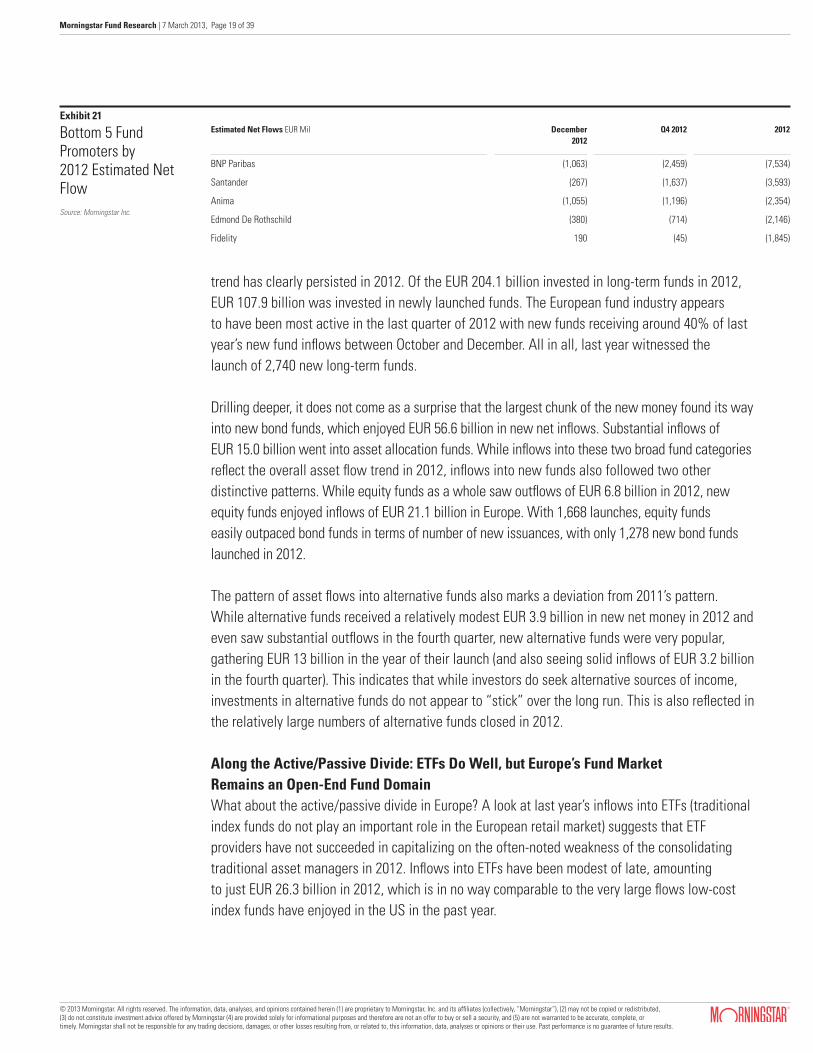
On the other side of the coin, the asset managers with the highest outflows in 2012 were mainly providers exposed to EUR government bonds (BNP Paribas, Santander, Anima), French equities and alternative funds (Edmond de Rothschild), or Asian and European equities (Fidelity).
New Funds Capture the Minds of European Investors—And Pry Open their WalletsThe European fund market is often described as being thematically driven. Fund promoters—and financial services companies—have been dependent on constantly digging up new investment stories that capture the imagination of the retail audience, and make them open their wallets. This
© 2013 Morningstar. All rights reserved. The information, data, analyses, and opinions contained herein (1) are proprietary to Morningstar, Inc. and its affiliates (collectively, “Morningstar”), (2) may not be copied or redistributed, (3) do not constitute investment advice offered by Morningstar (4) are provided solely for informational purposes and therefore are not an offer to buy or sell a security, and (5) are not warranted to be accurate, complete, or timely. Morningstar shall not be responsible for any trading decisions, damages, or other losses resulting from, or related to, this information, data, analyses or opinions or their use. Past performance is no guarantee of future results.
Morningstar Fund Research | 7 March 2013, Page 19 of 39
Estimated Net Flows EUR Mil December 2012
Q4 2012 2012
BNP Paribas (1,063) (2,459) (7,534)
Santander (267) (1,637) (3,593)
Anima (1,055) (1,196) (2,354)
Edmond De Rothschild (380) (714) (2,146)
Fidelity 190 (45) (1,845)
Exhibit 21
Bottom 5 Fund Promoters by 2012 Estimated Net FlowSource: Morningstar Inc.
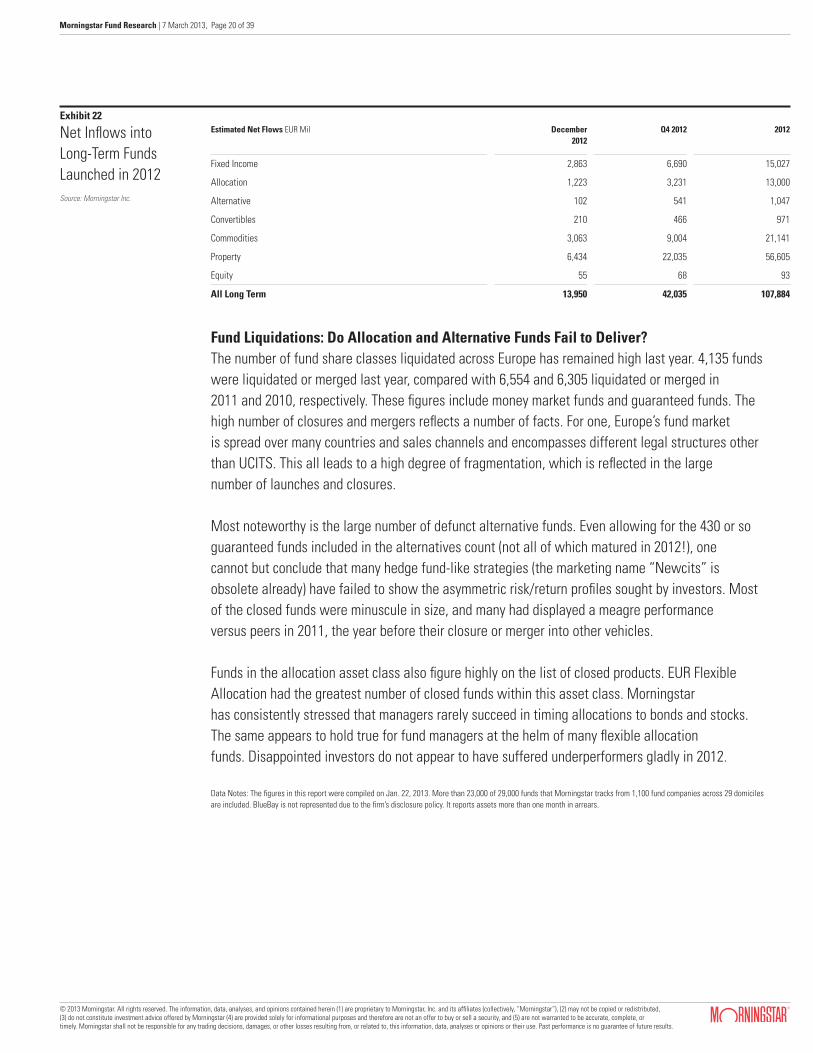
trend has clearly persisted in 2012. Of the EUR 204.1 billion invested in long-term funds in 2012, EUR 107.9 billion was invested in newly launched funds. The European fund industry appears to have been most active in the last quarter of 2012 with new funds receiving around 40% of last year’s new fund inflows between October and December. All in all, last year witnessed the launch of 2,740 new long-term funds.
Drilling deeper, it does not come as a surprise that the largest chunk of the new money found its way into new bond funds, which enjoyed EUR 56.6 billion in new net inflows. Substantial inflows of EUR 15.0 billion went into asset allocation funds. While inflows into these two broad fund categories reflect the overall asset flow trend in 2012, inflows into new funds also followed two other distinctive patterns. While equity funds as a whole saw outflows of EUR 6.8 billion in 2012, new equity funds enjoyed inflows of EUR 21.1 billion in Europe. With 1,668 launches, equity funds easily outpaced bond funds in terms of number of new issuances, with only 1,278 new bond funds launched in 2012.
The pattern of asset flows into alternative funds also marks a deviation from 2011’s pattern. While alternative funds received a relatively modest EUR 3.9 billion in new net money in 2012 and even saw substantial outflows in the fourth quarter, new alternative funds were very popular, gathering EUR 13 billion in the year of their launch (and also seeing solid inflows of EUR 3.2 billion in the fourth quarter). This indicates that while investors do seek alternative sources of income, investments in alternative funds do not appear to “stick” over the long run. This is also reflected in the relatively large numbers of alternative funds closed in 2012.
Along the Active/Passive Divide: ETFs Do Well, but Europe’s Fund Market Remains an Open-End Fund DomainWhat about the active/passive divide in Europe? A look at last year’s inflows into ETFs (traditional index funds do not play an important role in the European retail market) suggests that ETF providers have not succeeded in capitalizing on the often-noted weakness of the consolidating traditional asset managers in 2012. Inflows into ETFs have been modest of late, amounting to just EUR 26.3 billion in 2012, which is in no way comparable to the very large flows low-cost index funds have enjoyed in the US in the past year.
© 2013 Morningstar. All rights reserved. The information, data, analyses, and opinions contained herein (1) are proprietary to Morningstar, Inc. and its affiliates (collectively, “Morningstar”), (2) may not be copied or redistributed, (3) do not constitute investment advice offered by Morningstar (4) are provided solely for informational purposes and therefore are not an offer to buy or sell a security, and (5) are not warranted to be accurate, complete, or timely. Morningstar shall not be responsible for any trading decisions, damages, or other losses resulting from, or related to, this information, data, analyses or opinions or their use. Past performance is no guarantee of future results.
Morningstar Fund Research | 7 March 2013, Page 20 of 39
Fund Liquidations: Do Allocation and Alternative Funds Fail to Deliver?The number of fund share classes liquidated across Europe has remained high last year. 4,135 funds were liquidated or merged last year, compared with 6,554 and 6,305 liquidated or merged in 2011 and 2010, respectively. These figures include money market funds and guaranteed funds. The high number of closures and mergers reflects a number of facts. For one, Europe’s fund market is spread over many countries and sales channels and encompasses different legal structures other than UCITS. This all leads to a high degree of fragmentation, which is reflected in the large number of launches and closures.
Most noteworthy is the large number of defunct alternative funds. Even allowing for the 430 or so guaranteed funds included in the alternatives count (not all of which matured in 2012!), one cannot but conclude that many hedge fund-like strategies (the marketing name “Newcits” is obsolete already) have failed to show the asymmetric risk/return profiles sought by investors. Most of the closed funds were minuscule in size, and many had displayed a meagre performance versus peers in 2011, the year before their closure or merger into other vehicles.
Funds in the allocation asset class also figure highly on the list of closed products. EUR Flexible Allocation had the greatest number of closed funds within this asset class. Morningstar has consistently stressed that managers rarely succeed in timing allocations to bonds and stocks. The same appears to hold true for fund managers at the helm of many flexible allocation funds. Disappointed investors do not appear to have suffered underperformers gladly in 2012.
Estimated Net Flows EUR Mil December 2012
Q4 2012 2012
Fixed Income 2,863 6,690 15,027
Allocation 1,223 3,231 13,000
Alternative 102 541 1,047
Convertibles 210 466 971
Commodities 3,063 9,004 21,141
Property 6,434 22,035 56,605
Equity 55 68 93
All Long Term 13,950 42,035 107,884
Exhibit 22
Net Inflows into Long-Term Funds Launched in 2012Source: Morningstar Inc.
Data Notes: The figures in this report were compiled on Jan. 22, 2013. More than 23,000 of 29,000 funds that Morningstar tracks from 1,100 fund companies across 29 domiciles are included. BlueBay is not represented due to the firm’s disclosure policy. It reports assets more than one month in arrears.
© 2013 Morningstar. All rights reserved. The information, data, analyses, and opinions contained herein (1) are proprietary to Morningstar, Inc. and its affiliates (collectively, “Morningstar”), (2) may not be copied or redistributed, (3) do not constitute investment advice offered by Morningstar (4) are provided solely for informational purposes and therefore are not an offer to buy or sell a security, and (5) are not warranted to be accurate, complete, or timely. Morningstar shall not be responsible for any trading decisions, damages, or other losses resulting from, or related to, this information, data, analyses or opinions or their use. Past performance is no guarantee of future results.
Morningstar Fund Research | 7 March 2013, Page 21 of 39
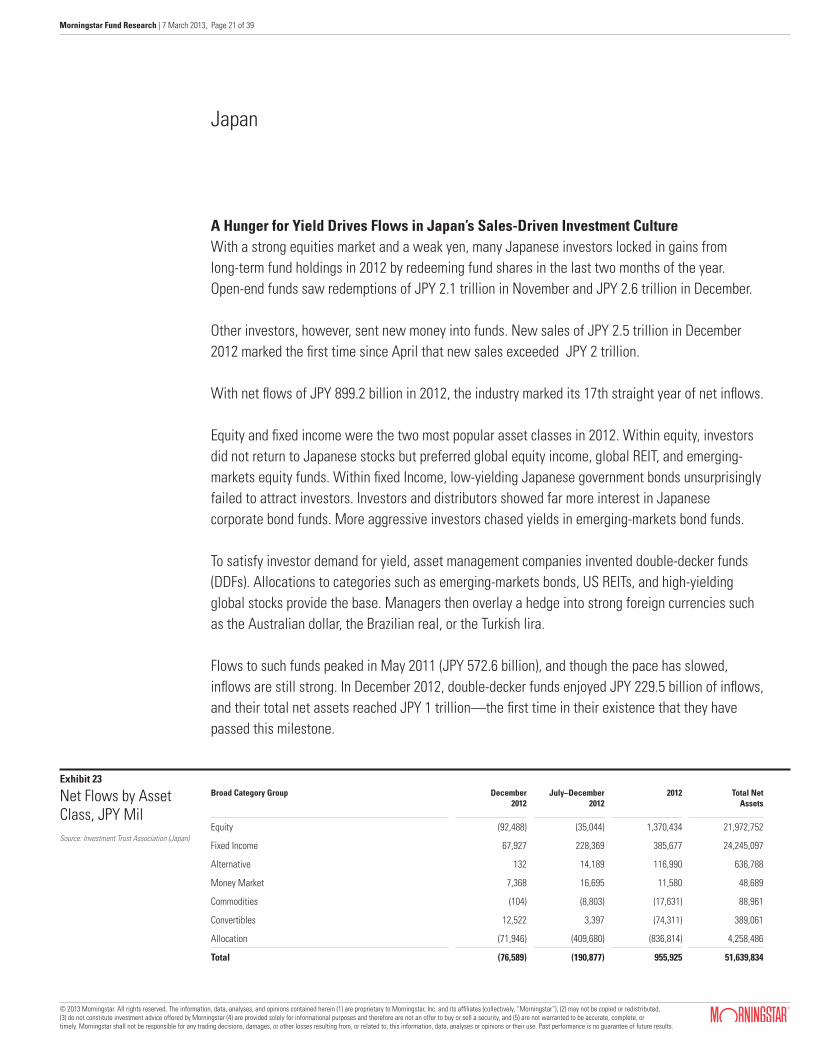
A Hunger for Yield Drives Flows in Japan’s Sales-Driven Investment CultureWith a strong equities market and a weak yen, many Japanese investors locked in gains from long-term fund holdings in 2012 by redeeming fund shares in the last two months of the year. Open-end funds saw redemptions of JPY 2.1 trillion in November and JPY 2.6 trillion in December.
Other investors, however, sent new money into funds. New sales of JPY 2.5 trillion in December 2012 marked the first time since April that new sales exceeded JPY 2 trillion.
With net flows of JPY 899.2 billion in 2012, the industry marked its 17th straight year of net inflows.
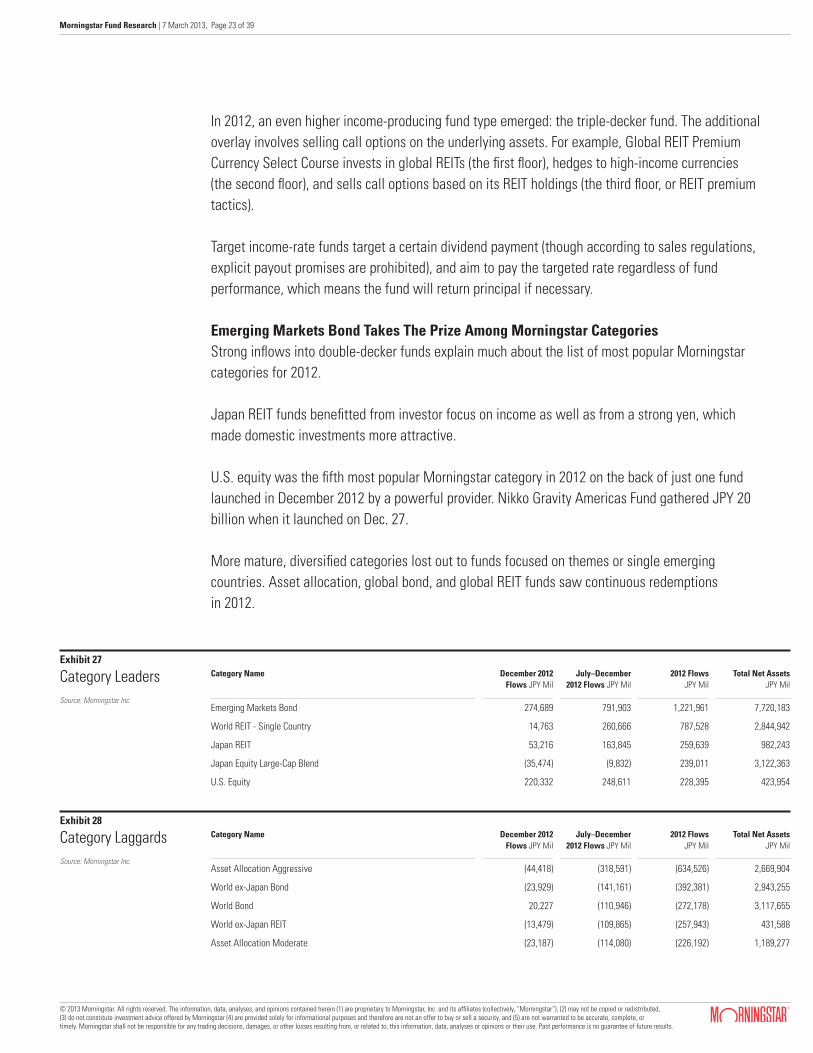
Equity and fixed income were the two most popular asset classes in 2012. Within equity, investors did not return to Japanese stocks but preferred global equity income, global REIT, and emerging-markets equity funds. Within fixed Income, low-yielding Japanese government bonds unsurprisingly failed to attract investors. Investors and distributors showed far more interest in Japanese corporate bond funds. More aggressive investors chased yields in emerging-markets bond funds.
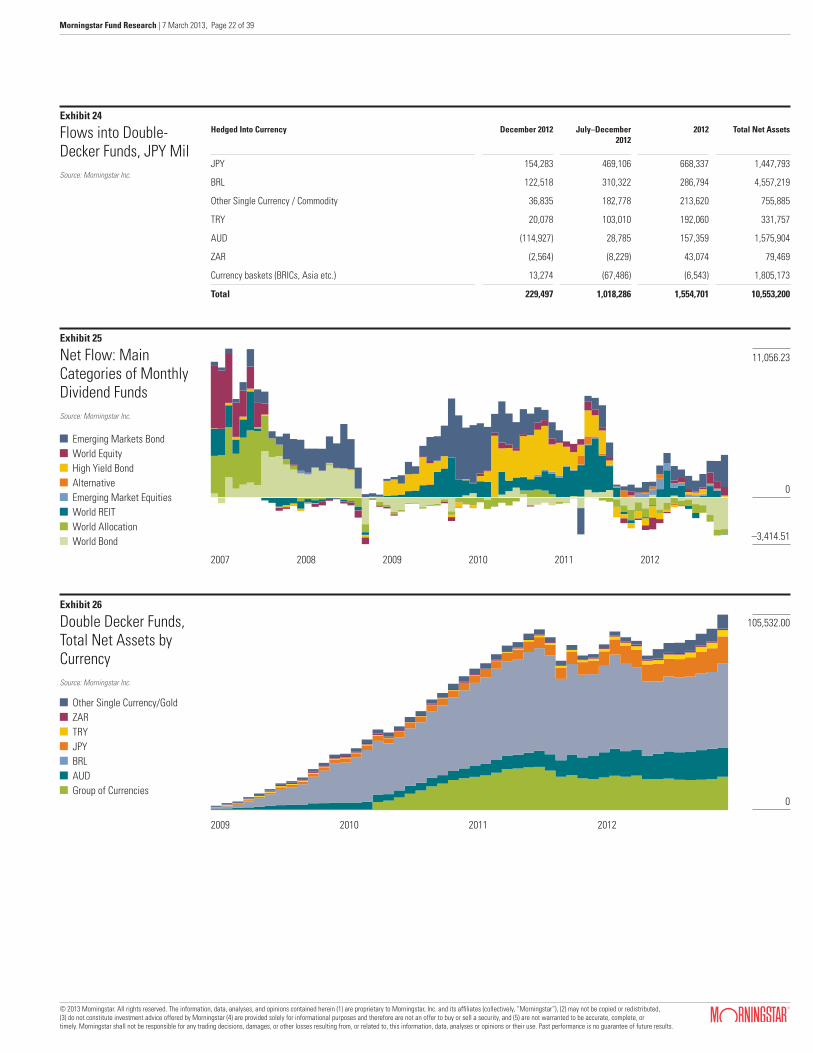
To satisfy investor demand for yield, asset management companies invented double-decker funds (DDFs). Allocations to categories such as emerging-markets bonds, US REITs, and high-yielding global stocks provide the base. Managers then overlay a hedge into strong foreign currencies such as the Australian dollar, the Brazilian real, or the Turkish lira.
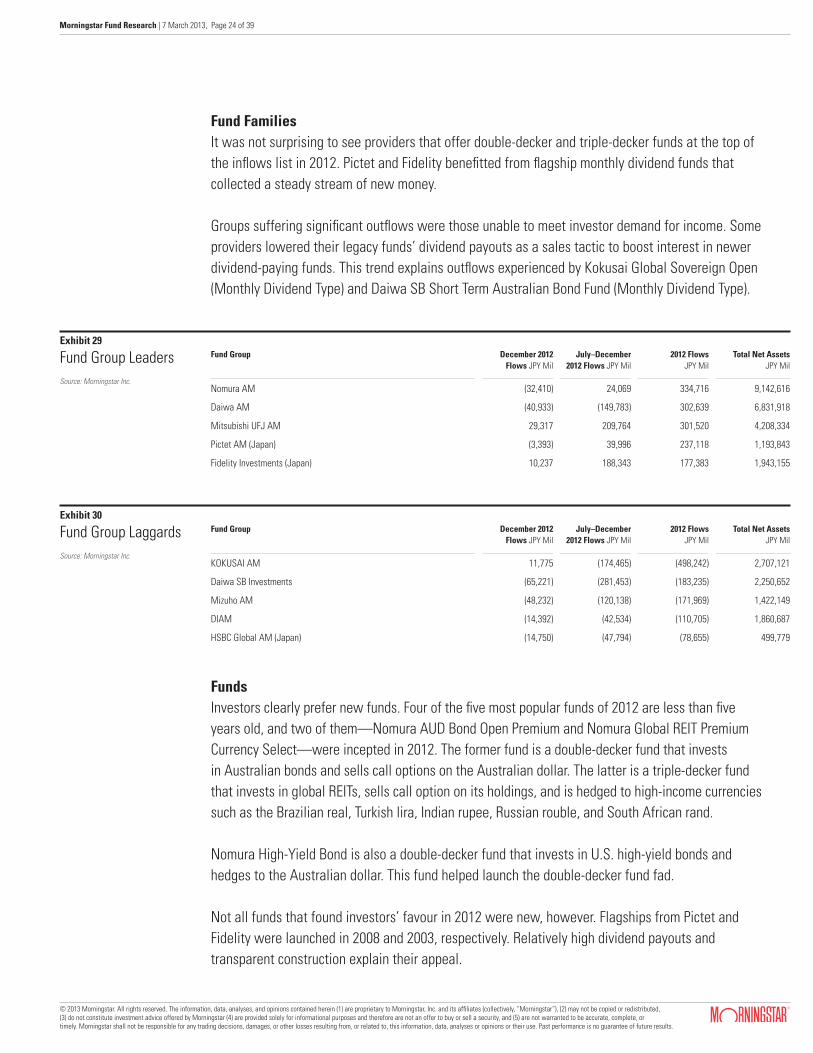
Flows to such funds peaked in May 2011 (JPY 572.6 billion), and though the pace has slowed, inflows are still strong. In December 2012, double-decker funds enjoyed JPY 229.5 billion of inflows, and their total net assets reached JPY 1 trillion—the first time in their existence that they have passed this milestone.
Japan
Broad Category Group December 2012
July–December2012
2012 Total Net Assets
Equity (92,488) (35,044) 1,370,434 21,972,752
Fixed Income 67,927 228,369 385,677 24,245,097
Alternative 132 14,189 116,990 636,788
Money Market 7,368 16,695 11,580 48,689
Commodities (104) (8,803) (17,631) 88,961
Convertibles 12,522 3,397 (74,311) 389,061
Allocation (71,946) (409,680) (836,814) 4,258,486
Total (76,589) (190,877) 955,925 51,639,834
Exhibit 23
Net Flows by Asset Class, JPY MilSource: Investment Trust Association (Japan)
© 2013 Morningstar. All rights reserved. The information, data, analyses, and opinions contained herein (1) are proprietary to Morningstar, Inc. and its affiliates (collectively, “Morningstar”), (2) may not be copied or redistributed, (3) do not constitute investment advice offered by Morningstar (4) are provided solely for informational purposes and therefore are not an offer to buy or sell a security, and (5) are not warranted to be accurate, complete, or timely. Morningstar shall not be responsible for any trading decisions, damages, or other losses resulting from, or related to, this information, data, analyses or opinions or their use. Past performance is no guarantee of future results.
Morningstar Fund Research | 7 March 2013, Page 22 of 39
Hedged Into Currency December 2012 July–December2012
2012 Total Net Assets
JPY 154,283 469,106 668,337 1,447,793
BRL 122,518 310,322 286,794 4,557,219
Other Single Currency / Commodity 36,835 182,778 213,620 755,885
TRY 20,078 103,010 192,060 331,757
AUD (114,927) 28,785 157,359 1,575,904
ZAR (2,564) (8,229) 43,074 79,469
Currency baskets (BRICs, Asia etc.) 13,274 (67,486) (6,543) 1,805,173
Total 229,497 1,018,286 1,554,701 10,553,200
Exhibit 24
Flows into Double-Decker Funds, JPY MilSource: Morningstar Inc.
Exhibit 25
Net Flow: Main Categories of Monthly Dividend FundsSource: Morningstar Inc.
Exhibit 26
Double Decker Funds, Total Net Assets by CurrencySource: Morningstar Inc.
0
105,532.00
–3,414.51
0
11,056.23
Emerging Markets Bond World Equity High Yield Bond Alternative Emerging Market Equities World REIT World Allocation World Bond
Other Single Currency/Gold ZAR TRY JPY BRL AUD Group of Currencies
2007 2008 2009 2010 2011 2012
2009 2010 2011 2012
© 2013 Morningstar. All rights reserved. The information, data, analyses, and opinions contained herein (1) are proprietary to Morningstar, Inc. and its affiliates (collectively, “Morningstar”), (2) may not be copied or redistributed, (3) do not constitute investment advice offered by Morningstar (4) are provided solely for informational purposes and therefore are not an offer to buy or sell a security, and (5) are not warranted to be accurate, complete, or timely. Morningstar shall not be responsible for any trading decisions, damages, or other losses resulting from, or related to, this information, data, analyses or opinions or their use. Past performance is no guarantee of future results.
Morningstar Fund Research | 7 March 2013, Page 23 of 39
In 2012, an even higher income-producing fund type emerged: the triple-decker fund. The additional overlay involves selling call options on the underlying assets. For example, Global REIT Premium Currency Select Course invests in global REITs (the first floor), hedges to high-income currencies (the second floor), and sells call options based on its REIT holdings (the third floor, or REIT premium tactics).
Target income-rate funds target a certain dividend payment (though according to sales regulations, explicit payout promises are prohibited), and aim to pay the targeted rate regardless of fund performance, which means the fund will return principal if necessary.
Emerging Markets Bond Takes The Prize Among Morningstar CategoriesStrong inflows into double-decker funds explain much about the list of most popular Morningstar categories for 2012.
Japan REIT funds benefitted from investor focus on income as well as from a strong yen, which made domestic investments more attractive.
U.S. equity was the fifth most popular Morningstar category in 2012 on the back of just one fund launched in December 2012 by a powerful provider. Nikko Gravity Americas Fund gathered JPY 20 billion when it launched on Dec. 27.
More mature, diversified categories lost out to funds focused on themes or single emerging countries. Asset allocation, global bond, and global REIT funds saw continuous redemptions in 2012.
Category Name December 2012Flows JPY Mil
July–December 2012 Flows JPY Mil
2012 Flows JPY Mil
Total Net AssetsJPY Mil
Emerging Markets Bond 274,689 791,903 1,221,961 7,720,183
World REIT - Single Country 14,763 260,666 787,528 2,844,942
Japan REIT 53,216 163,845 259,639 982,243
Japan Equity Large-Cap Blend (35,474) (9,832) 239,011 3,122,363
U.S. Equity 220,332 248,611 228,395 423,954
Exhibit 27
Category LeadersSource: Morningstar Inc.
Category Name December 2012Flows JPY Mil
July–December 2012 Flows JPY Mil
2012 Flows JPY Mil
Total Net AssetsJPY Mil
Asset Allocation Aggressive (44,418) (318,591) (634,526) 2,669,904
World ex-Japan Bond (23,929) (141,161) (392,381) 2,943,255
World Bond 20,227 (110,946) (272,178) 3,117,655
World ex-Japan REIT (13,479) (109,865) (257,943) 431,588
Asset Allocation Moderate (23,187) (114,080) (226,192) 1,189,277
Exhibit 28
Category LaggardsSource: Morningstar Inc.
© 2013 Morningstar. All rights reserved. The information, data, analyses, and opinions contained herein (1) are proprietary to Morningstar, Inc. and its affiliates (collectively, “Morningstar”), (2) may not be copied or redistributed, (3) do not constitute investment advice offered by Morningstar (4) are provided solely for informational purposes and therefore are not an offer to buy or sell a security, and (5) are not warranted to be accurate, complete, or timely. Morningstar shall not be responsible for any trading decisions, damages, or other losses resulting from, or related to, this information, data, analyses or opinions or their use. Past performance is no guarantee of future results.
Morningstar Fund Research | 7 March 2013, Page 24 of 39
Fund FamiliesIt was not surprising to see providers that offer double-decker and triple-decker funds at the top of the inflows list in 2012. Pictet and Fidelity benefitted from flagship monthly dividend funds that collected a steady stream of new money.
Groups suffering significant outflows were those unable to meet investor demand for income. Some providers lowered their legacy funds’ dividend payouts as a sales tactic to boost interest in newer dividend-paying funds. This trend explains outflows experienced by Kokusai Global Sovereign Open (Monthly Dividend Type) and Daiwa SB Short Term Australian Bond Fund (Monthly Dividend Type).
Fund Group December 2012Flows JPY Mil
July–December 2012 Flows JPY Mil
2012 Flows JPY Mil
Total Net AssetsJPY Mil
Nomura AM (32,410) 24,069 334,716 9,142,616
Daiwa AM (40,933) (149,783) 302,639 6,831,918
Mitsubishi UFJ AM 29,317 209,764 301,520 4,208,334
Pictet AM (Japan) (3,393) 39,996 237,118 1,193,843
Fidelity Investments (Japan) 10,237 188,343 177,383 1,943,155
Fund Group December 2012Flows JPY Mil
July–December 2012 Flows JPY Mil
2012 Flows JPY Mil
Total Net AssetsJPY Mil
KOKUSAI AM 11,775 (174,465) (498,242) 2,707,121
Daiwa SB Investments (65,221) (281,453) (183,235) 2,250,652
Mizuho AM (48,232) (120,138) (171,969) 1,422,149
DIAM (14,392) (42,534) (110,705) 1,860,687
HSBC Global AM (Japan) (14,750) (47,794) (78,655) 499,779
Exhibit 29
Fund Group LeadersSource: Morningstar Inc.
Exhibit 30
Fund Group LaggardsSource: Morningstar Inc.
FundsInvestors clearly prefer new funds. Four of the five most popular funds of 2012 are less than five years old, and two of them—Nomura AUD Bond Open Premium and Nomura Global REIT Premium Currency Select—were incepted in 2012. The former fund is a double-decker fund that invests in Australian bonds and sells call options on the Australian dollar. The latter is a triple-decker fund that invests in global REITs, sells call option on its holdings, and is hedged to high-income currencies such as the Brazilian real, Turkish lira, Indian rupee, Russian rouble, and South African rand.
Nomura High-Yield Bond is also a double-decker fund that invests in U.S. high-yield bonds and hedges to the Australian dollar. This fund helped launch the double-decker fund fad.
Not all funds that found investors’ favour in 2012 were new, however. Flagships from Pictet and Fidelity were launched in 2008 and 2003, respectively. Relatively high dividend payouts and transparent construction explain their appeal.
© 2013 Morningstar. All rights reserved. The information, data, analyses, and opinions contained herein (1) are proprietary to Morningstar, Inc. and its affiliates (collectively, “Morningstar”), (2) may not be copied or redistributed, (3) do not constitute investment advice offered by Morningstar (4) are provided solely for informational purposes and therefore are not an offer to buy or sell a security, and (5) are not warranted to be accurate, complete, or timely. Morningstar shall not be responsible for any trading decisions, damages, or other losses resulting from, or related to, this information, data, analyses or opinions or their use. Past performance is no guarantee of future results.
Morningstar Fund Research | 7 March 2013, Page 25 of 39
Fund Name December 2012Flows JPY Mil
July–December 2012 Flows JPY Mil
2012 Flows JPY Mil
Total Net AssetsJPY Mil
Nomura AUD Bond Open Premium D1M (6,772) 43,449 339,310 350,546
Pictet Emerging Inc Eq D1M (8,740) 77,064 303,086 412,228
Nomura US High-Yield Bond AUD D1M (11,089) 111,959 212,089 391,434
Nomura Global REIT Premium Ccy Sel D1M (3,744) 19,643 207,377 217,568
Fidelity US REIT B 9,778 200,255 205,561 708,252
Fund Name December 2012Flows JPY Mil
July–December 2012 Flows JPY Mil
2012 Flows JPY Mil
Total Net AssetsJPY Mil
Kokusai Glbl Sovereign D1M (25,945) (172,044) (419,232) 1,532,785
Nomura Global HY Bd Res Countrs Ccy D1M (26,921) (163,704) (305,006) 542,378
Daiwa Global REIT Op D1M (9,478) (92,609) (206,385) 188,778
DaiwaSB Short term AUD Bond D1M (55,259) (236,748) (191,337) 988,039
Daiwa High Grade Oceania Bd D1M (48,200) (155,448) (189,716) 800,019
Star Rating December 2012Flows JPY Mil
July–December 2012 Flows JPY Mil
2012 Flows JPY Mil
Total Net AssetsJPY Mil
5 (191,947) (423,628) (233,946) 6,670,742
4 (96,287) (111,056) (174,510) 11,191,702
3 (1,115) 64,547 69,043 7,893,639
2 (90,707) (395,845) 152,041 8,930,134
1 (123,072) (580,561) (1,285,209) 7,749,111
Not Rated 426,665 1,304,381 2,524,839 9,204,506
Exhibit 31
Fund LeadersSource: Morningstar Inc.
Exhibit 32
Fund LaggardsSource: Morningstar Inc.
Exhibit 33
Net Flow by Ibbotson Star RatingSource: Morningstar Inc.
Funds suffering the biggest outflows retain large asset bases and are still solid offerings. They have simply been substituted for newer, higher-yielding funds.
Looking at investment flow by Ibbotson Japan Star Rating, 1-star funds, which have poor track records relative to their peers, unsurprisingly suffered heavy redemptions. Otherwise, a clear trend is hard to discern. The heaviest flows were into Not Rated funds, reflecting investor appetite for newly launched funds. (Funds require a three-year track record to receive a rating.)
There are almost 4,000 open-end funds in Japan. 31% of these funds are not rated because they have less than three years of history. These unrated funds saw inflows of JPY 478 billion in 2012 while the other 69% of funds with longer track records saw outflows of JPY 504 billion. The mixed picture also reflects the profound influence of Japanese sales advisors, who play an essential role in directing investments.
© 2013 Morningstar. All rights reserved. The information, data, analyses, and opinions contained herein (1) are proprietary to Morningstar, Inc. and its affiliates (collectively, “Morningstar”), (2) may not be copied or redistributed, (3) do not constitute investment advice offered by Morningstar (4) are provided solely for informational purposes and therefore are not an offer to buy or sell a security, and (5) are not warranted to be accurate, complete, or timely. Morningstar shall not be responsible for any trading decisions, damages, or other losses resulting from, or related to, this information, data, analyses or opinions or their use. Past performance is no guarantee of future results.
Morningstar Fund Research | 7 March 2013, Page 26 of 39
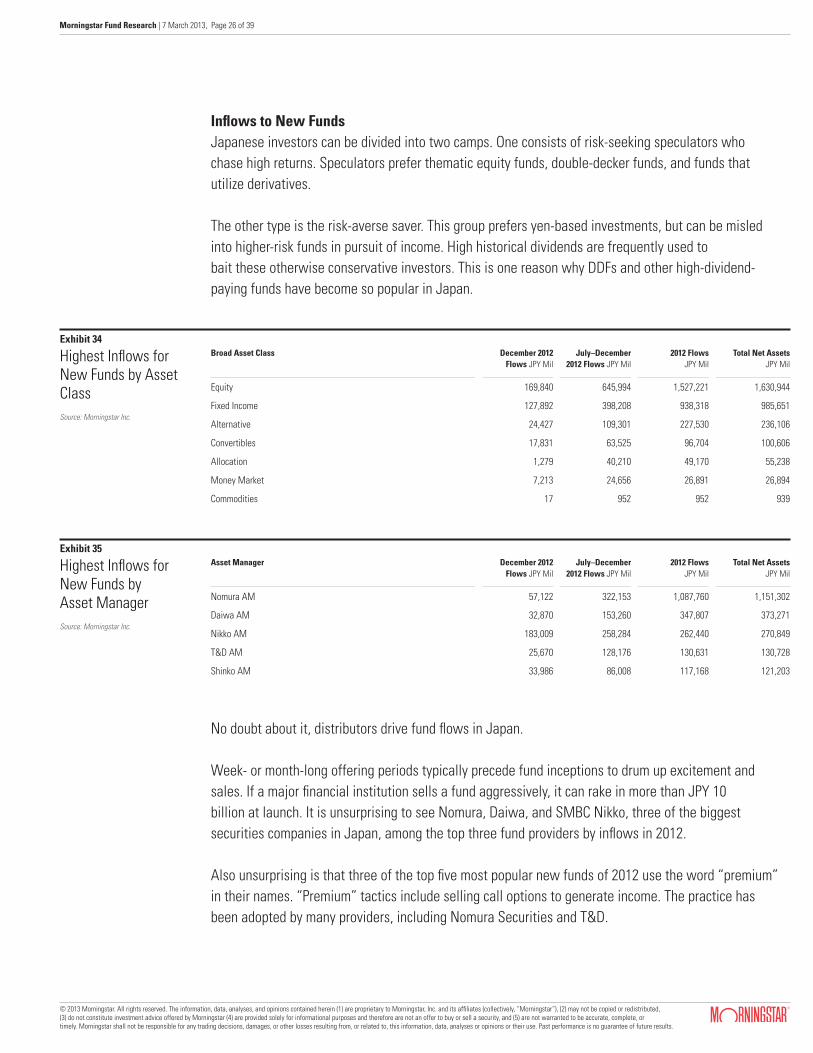
Inflows to New FundsJapanese investors can be divided into two camps. One consists of risk-seeking speculators who chase high returns. Speculators prefer thematic equity funds, double-decker funds, and funds that utilize derivatives.
The other type is the risk-averse saver. This group prefers yen-based investments, but can be misled into higher-risk funds in pursuit of income. High historical dividends are frequently used to bait these otherwise conservative investors. This is one reason why DDFs and other high-dividend-paying funds have become so popular in Japan.
Broad Asset Class December 2012Flows JPY Mil
July–December 2012 Flows JPY Mil
2012 Flows JPY Mil
Total Net AssetsJPY Mil
Equity 169,840 645,994 1,527,221 1,630,944
Fixed Income 127,892 398,208 938,318 985,651
Alternative 24,427 109,301 227,530 236,106
Convertibles 17,831 63,525 96,704 100,606
Allocation 1,279 40,210 49,170 55,238
Money Market 7,213 24,656 26,891 26,894
Commodities 17 952 952 939
Asset Manager December 2012Flows JPY Mil
July–December 2012 Flows JPY Mil
2012 Flows JPY Mil
Total Net AssetsJPY Mil
Nomura AM 57,122 322,153 1,087,760 1,151,302
Daiwa AM 32,870 153,260 347,807 373,271
Nikko AM 183,009 258,284 262,440 270,849
T&D AM 25,670 128,176 130,631 130,728
Shinko AM 33,986 86,008 117,168 121,203
Exhibit 34
Highest Inflows for New Funds by Asset ClassSource: Morningstar Inc.
Exhibit 35
Highest Inflows for New Funds by Asset ManagerSource: Morningstar Inc.
No doubt about it, distributors drive fund flows in Japan.
Week- or month-long offering periods typically precede fund inceptions to drum up excitement and sales. If a major financial institution sells a fund aggressively, it can rake in more than JPY 10 billion at launch. It is unsurprising to see Nomura, Daiwa, and SMBC Nikko, three of the biggest securities companies in Japan, among the top three fund providers by inflows in 2012.
Also unsurprising is that three of the top five most popular new funds of 2012 use the word “premium” in their names. “Premium” tactics include selling call options to generate income. The practice has been adopted by many providers, including Nomura Securities and T&D.
© 2013 Morningstar. All rights reserved. The information, data, analyses, and opinions contained herein (1) are proprietary to Morningstar, Inc. and its affiliates (collectively, “Morningstar”), (2) may not be copied or redistributed, (3) do not constitute investment advice offered by Morningstar (4) are provided solely for informational purposes and therefore are not an offer to buy or sell a security, and (5) are not warranted to be accurate, complete, or timely. Morningstar shall not be responsible for any trading decisions, damages, or other losses resulting from, or related to, this information, data, analyses or opinions or their use. Past performance is no guarantee of future results.
Morningstar Fund Research | 7 March 2013, Page 27 of 39
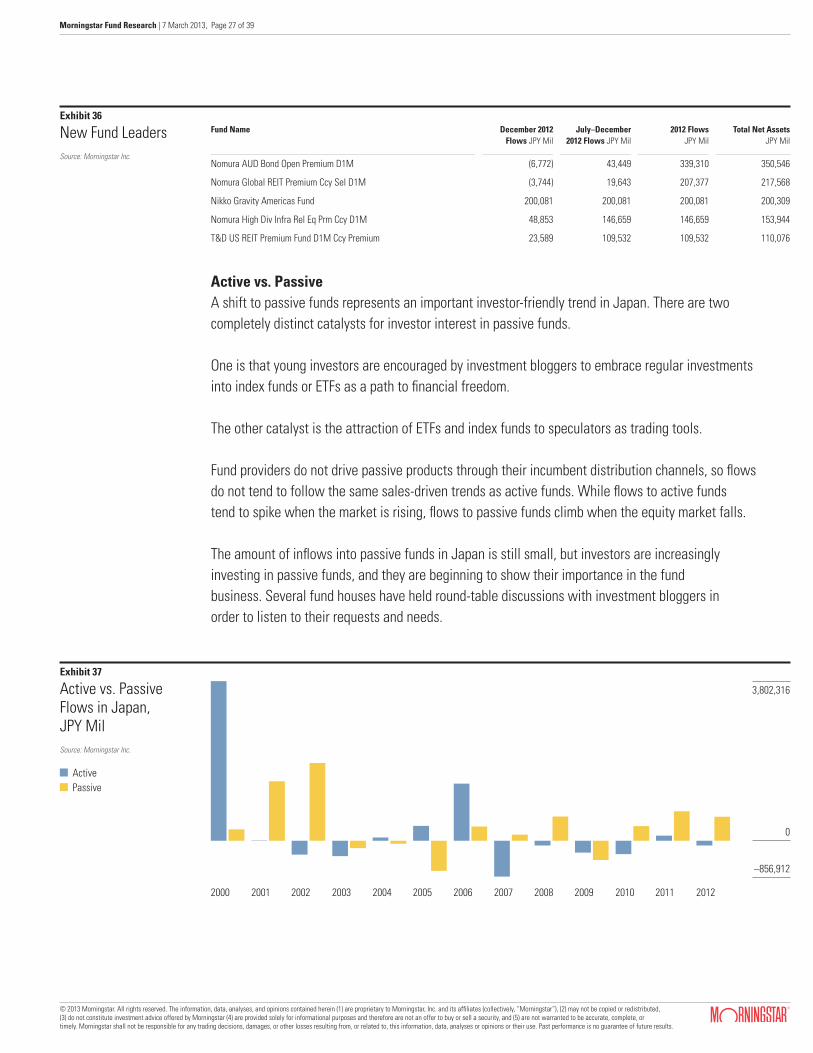
Fund Name December 2012Flows JPY Mil
July–December 2012 Flows JPY Mil
2012 FlowsJPY Mil
Total Net AssetsJPY Mil
Nomura AUD Bond Open Premium D1M (6,772) 43,449 339,310 350,546
Nomura Global REIT Premium Ccy Sel D1M (3,744) 19,643 207,377 217,568
Nikko Gravity Americas Fund 200,081 200,081 200,081 200,309
Nomura High Div Infra Rel Eq Prm Ccy D1M 48,853 146,659 146,659 153,944
T&D US REIT Premium Fund D1M Ccy Premium 23,589 109,532 109,532 110,076
Exhibit 36
New Fund LeadersSource: Morningstar Inc.
Exhibit 37
Active vs. Passive Flows in Japan, JPY MilSource: Morningstar Inc.
Active vs. PassiveA shift to passive funds represents an important investor-friendly trend in Japan. There are two completely distinct catalysts for investor interest in passive funds.
One is that young investors are encouraged by investment bloggers to embrace regular investments into index funds or ETFs as a path to financial freedom.
The other catalyst is the attraction of ETFs and index funds to speculators as trading tools.
Fund providers do not drive passive products through their incumbent distribution channels, so flows do not tend to follow the same sales-driven trends as active funds. While flows to active funds tend to spike when the market is rising, flows to passive funds climb when the equity market falls.
The amount of inflows into passive funds in Japan is still small, but investors are increasingly investing in passive funds, and they are beginning to show their importance in the fund business. Several fund houses have held round-table discussions with investment bloggers in order to listen to their requests and needs.
–856,912
0
3,802,316
Active Passive
2000 2001 2002 2003 2004 2005 2006 2007 2008 2009 2010 2011 2012

© 2013 Morningstar. All rights reserved. The information, data, analyses, and opinions contained herein (1) are proprietary to Morningstar, Inc. and its affiliates (collectively, “Morningstar”), (2) may not be copied or redistributed, (3) do not constitute investment advice offered by Morningstar (4) are provided solely for informational purposes and therefore are not an offer to buy or sell a security, and (5) are not warranted to be accurate, complete, or timely. Morningstar shall not be responsible for any trading decisions, damages, or other losses resulting from, or related to, this information, data, analyses or opinions or their use. Past performance is no guarantee of future results.
Morningstar Fund Research | 7 March 2013, Page 28 of 39
Asset Class / CategoryInvestors withdrew just over AUD 5.33 billion from the Australian managed funds industry in 2012. A clear theme emerged as the year progressed: The great Australian love affair with equities continued to fade. Domestic equities, despite strong S&P/ASX 200 returns, bore the brunt of the outflows. Paying little heed to the share market rally, investors pulled a staggering AUD 9.65 billion from Australian equity funds over the year, or 9% of beginning assets. With a fading commodities boom, investors haven’t had much faith in the weaker side of the economy taking up the slack. International equities, having shed AUD 3.75 billion in outflows, didn’t fare much better.
Australia
Broad Category Group Est. Net Flow 2012 AUD Mil
Net AssetsAUD Bil
Organic Growth Rate 2012 %
Australian Equity (9,654) 116 (9.1)
International Equity (3,760) 95 (4.4)
Australian Fixed Interest (1,048) 23 (4.7)
International Fixed Interest (673) 12 (5.8)
Fixed Interest Other 2,926 33 10.2
Multi-Sector 6,468 352 2.0
Property & Infrastructure 126 8 1.8
Alternatives 1,367 8 17.3
Other 155 7 1.3
All Long-Term (4,093) 654 (0.7)
Cash (1,243) 63 (2.0)
Exhibit 38
2012 Flows by Australian Asset ClassSource: Morningstar Inc.
Fixed-interest funds were in clear demand during the year, with investors preferring the perceived safety of the asset class. Healthy returns combined with continued inflows meant that most bond managers’ assets grew steadily. In fact, the asset class’ organic growth rate (flows divided by beginning assets) exceeded 10%.
There was, however, a noticeable shift in preferences: Diversified fixed-interest funds, garnering over AUD 2.93 billion at the expense of more focused vehicles, attracted the lion’s share of capital. Diversification was clearly at the forefront of investors’ minds as they set out to spread risk across the bond universe. Mortgage funds, however, suffered over the year, as investors withdrew almost AUD 2.5 billion.
Multisector/balanced funds took in the largest net inflows of our discrete asset classes in 2012, totaling AUD 6.46 billion, and continued to burgeon. However, this diversified asset class remains a
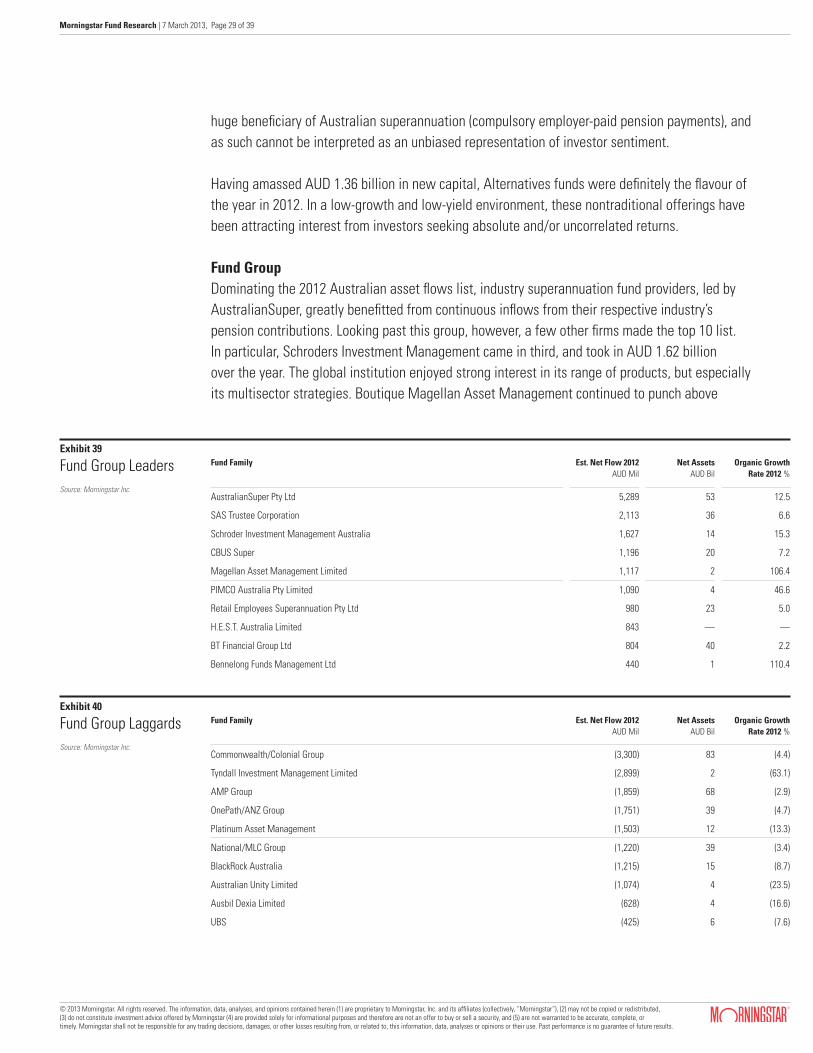
© 2013 Morningstar. All rights reserved. The information, data, analyses, and opinions contained herein (1) are proprietary to Morningstar, Inc. and its affiliates (collectively, “Morningstar”), (2) may not be copied or redistributed, (3) do not constitute investment advice offered by Morningstar (4) are provided solely for informational purposes and therefore are not an offer to buy or sell a security, and (5) are not warranted to be accurate, complete, or timely. Morningstar shall not be responsible for any trading decisions, damages, or other losses resulting from, or related to, this information, data, analyses or opinions or their use. Past performance is no guarantee of future results.
Morningstar Fund Research | 7 March 2013, Page 29 of 39
huge beneficiary of Australian superannuation (compulsory employer-paid pension payments), and as such cannot be interpreted as an unbiased representation of investor sentiment.
Having amassed AUD 1.36 billion in new capital, Alternatives funds were definitely the flavour of the year in 2012. In a low-growth and low-yield environment, these nontraditional offerings have been attracting interest from investors seeking absolute and/or uncorrelated returns.
Fund GroupDominating the 2012 Australian asset flows list, industry superannuation fund providers, led by AustralianSuper, greatly benefitted from continuous inflows from their respective industry’s pension contributions. Looking past this group, however, a few other firms made the top 10 list. In particular, Schroders Investment Management came in third, and took in AUD 1.62 billion over the year. The global institution enjoyed strong interest in its range of products, but especially its multisector strategies. Boutique Magellan Asset Management continued to punch above
Fund Family Est. Net Flow 2012 AUD Mil
Net AssetsAUD Bil
Organic Growth Rate 2012 %
AustralianSuper Pty Ltd 5,289 53 12.5
SAS Trustee Corporation 2,113 36 6.6
Schroder Investment Management Australia 1,627 14 15.3
CBUS Super 1,196 20 7.2
Magellan Asset Management Limited 1,117 2 106.4
PIMCO Australia Pty Limited 1,090 4 46.6
Retail Employees Superannuation Pty Ltd 980 23 5.0
H.E.S.T. Australia Limited 843 — —
BT Financial Group Ltd 804 40 2.2
Bennelong Funds Management Ltd 440 1 110.4
Exhibit 39
Fund Group LeadersSource: Morningstar Inc.
Fund Family Est. Net Flow 2012 AUD Mil
Net AssetsAUD Bil
Organic Growth Rate 2012 %
Commonwealth/Colonial Group (3,300) 83 (4.4)
Tyndall Investment Management Limited (2,899) 2 (63.1)
AMP Group (1,859) 68 (2.9)
OnePath/ANZ Group (1,751) 39 (4.7)
Platinum Asset Management (1,503) 12 (13.3)
National/MLC Group (1,220) 39 (3.4)
BlackRock Australia (1,215) 15 (8.7)
Australian Unity Limited (1,074) 4 (23.5)
Ausbil Dexia Limited (628) 4 (16.6)
UBS (425) 6 (7.6)
Exhibit 40
Fund Group LaggardsSource: Morningstar Inc.

© 2013 Morningstar. All rights reserved. The information, data, analyses, and opinions contained herein (1) are proprietary to Morningstar, Inc. and its affiliates (collectively, “Morningstar”), (2) may not be copied or redistributed, (3) do not constitute investment advice offered by Morningstar (4) are provided solely for informational purposes and therefore are not an offer to buy or sell a security, and (5) are not warranted to be accurate, complete, or timely. Morningstar shall not be responsible for any trading decisions, damages, or other losses resulting from, or related to, this information, data, analyses or opinions or their use. Past performance is no guarantee of future results.
Morningstar Fund Research | 7 March 2013, Page 30 of 39
its weight and attracted sizable inflows of just over AUD 1.10 billion into its global equity vehicles. Sitting comfortably in fifth place, the firm’s flagship fund has continued to shoot the lights out, and the flows have followed.
FundUnsurprisingly, industry superannuation funds, receiving a constant flow of steady capital, top our fund list. Putting this group to one side, Magellan’s Global Equity fund was the standout winner over the year. Remarkably, the fund, having launched in 2006, has amassed just over AUD 2.0 billion in flows, including more than AUD 1.0 billion in 2012 when it outpaced all other institutional and boutique products alike.
While one boutique prospered, another struggled. Platinum International, renowned investor Kerr Neilson’s flagship global equities fund, has suffered persistent outflows at the hands of impatient unitholders. The exit of over AUD 1.15 billion from the fund in 2012 seemingly conveys angst over the fund’s short- to medium-term underperformance, despite the fund’s stellar long-term results.
Morningstar Analyst RatingA clear black-and-white picture emerged in 2012, as medallists enjoyed the fruits of their labour, while non-medallists grappled with persistent outflows. Gold-, Silver-, and Bronze-rated products welcomed net inflows totalling AUD 5.46 billion over the year—Silver-rated funds attracted the lion’s share of this group’s flows with AUD 4.15 billion. In stark contrast, net flows into all other rated and non-rated products were negative. In general, medallists were in; non-medallists were out.
New FundsFor the most part, the flow of capital into new product launches was weak in 2012. AUD 970.41 million flowed into new funds over the year, a significant drop from 2011’s AUD 2.14 billion and 2010’s AUD 1.86 billion. A few key funds dominated this space—in particular, nontraditional offerings. For example, BlackRock’s newly launched Australian Equity Absolute Return fund welcomed robust inflows, as investors sought out the elusive ‘all weather’ vehicle. EQT’s fund of hedge funds MCG K2 Advisors Alternative Investment also drew in sizable flows. With few domestic equity launches, boutique Solaris Investment Management bucked the trend and kick-started a performance-fee version (zero base fee) of its Australian equity fund, which paid off with healthy flows.
Active vs. PassiveWhile we’ve observed strong inflows into the ETF market over the past few years, its AUD 6.0 billion size makes it a small fish in the Australian managed funds pond (around AUD 1.0 trillion). This means that traditional index funds remain the vehicle of choice for investors seeking passive exposure in Australia, and they’ve experienced flows more or less akin to their active counterparts, although on a much smaller scale. Global fixed-interest fund flows have however

© 2013 Morningstar. All rights reserved. The information, data, analyses, and opinions contained herein (1) are proprietary to Morningstar, Inc. and its affiliates (collectively, “Morningstar”), (2) may not be copied or redistributed, (3) do not constitute investment advice offered by Morningstar (4) are provided solely for informational purposes and therefore are not an offer to buy or sell a security, and (5) are not warranted to be accurate, complete, or timely. Morningstar shall not be responsible for any trading decisions, damages, or other losses resulting from, or related to, this information, data, analyses or opinions or their use. Past performance is no guarantee of future results.
Morningstar Fund Research | 7 March 2013, Page 31 of 39
differed markedly—while active funds took in capital of over AUD 3.0 billion over the year, passively managed funds were in negative territory, losing AUD 759.34 million. Investors were perhaps reducing exposure to the accompanying risks of international indexed strategies, which have a natural skew toward heavily indebted developed nations with very low interest- rate environments.
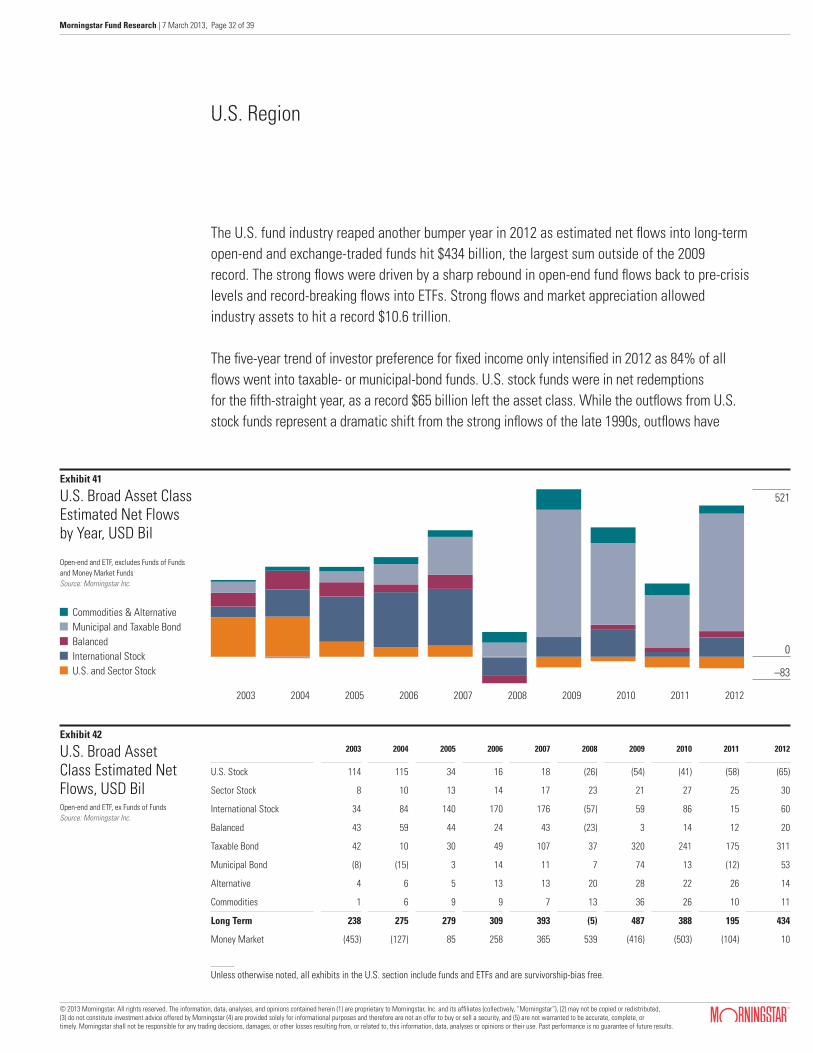
© 2013 Morningstar. All rights reserved. The information, data, analyses, and opinions contained herein (1) are proprietary to Morningstar, Inc. and its affiliates (collectively, “Morningstar”), (2) may not be copied or redistributed, (3) do not constitute investment advice offered by Morningstar (4) are provided solely for informational purposes and therefore are not an offer to buy or sell a security, and (5) are not warranted to be accurate, complete, or timely. Morningstar shall not be responsible for any trading decisions, damages, or other losses resulting from, or related to, this information, data, analyses or opinions or their use. Past performance is no guarantee of future results.
Morningstar Fund Research | 7 March 2013, Page 32 of 39
The U.S. fund industry reaped another bumper year in 2012 as estimated net flows into long-term open-end and exchange-traded funds hit $434 billion, the largest sum outside of the 2009 record. The strong flows were driven by a sharp rebound in open-end fund flows back to pre-crisis levels and record-breaking flows into ETFs. Strong flows and market appreciation allowed industry assets to hit a record $10.6 trillion.
The five-year trend of investor preference for fixed income only intensified in 2012 as 84% of all flows went into taxable- or municipal-bond funds. U.S. stock funds were in net redemptions for the fifth-straight year, as a record $65 billion left the asset class. While the outflows from U.S. stock funds represent a dramatic shift from the strong inflows of the late 1990s, outflows have
2003 2004 2005 2006 2007 2008 2009 2010 2011 2012
U.S. Stock 114 115 34 16 18 (26) (54) (41) (58) (65)
Sector Stock 8 10 13 14 17 23 21 27 25 30
International Stock 34 84 140 170 176 (57) 59 86 15 60
Balanced 43 59 44 24 43 (23) 3 14 12 20
Taxable Bond 42 10 30 49 107 37 320 241 175 311
Municipal Bond (8) (15) 3 14 11 7 74 13 (12) 53
Alternative 4 6 5 13 13 20 28 22 26 14
Commodities 1 6 9 9 7 13 36 26 10 11
Long Term 238 275 279 309 393 (5) 487 388 195 434
Money Market (453) (127) 85 258 365 539 (416) (503) (104) 10
Exhibit 42
U.S. Broad Asset Class Estimated Net Flows, USD BilOpen-end and ETF, ex Funds of Funds Source: Morningstar Inc.
Exhibit 41
U.S. Broad Asset Class Estimated Net Flows by Year, USD Bil
Open-end and ETF, excludes Funds of Funds and Money Market FundsSource: Morningstar Inc.
U.S. Region
Commodities & Alternative Municipal and Taxable Bond Balanced International Stock U.S. and Sector Stock
521
–83
20122004 2005 2006 2007 2008 2009 2010 20112003
0
Unless otherwise noted, all exhibits in the U.S. section include funds and ETFs and are survivorship-bias free.
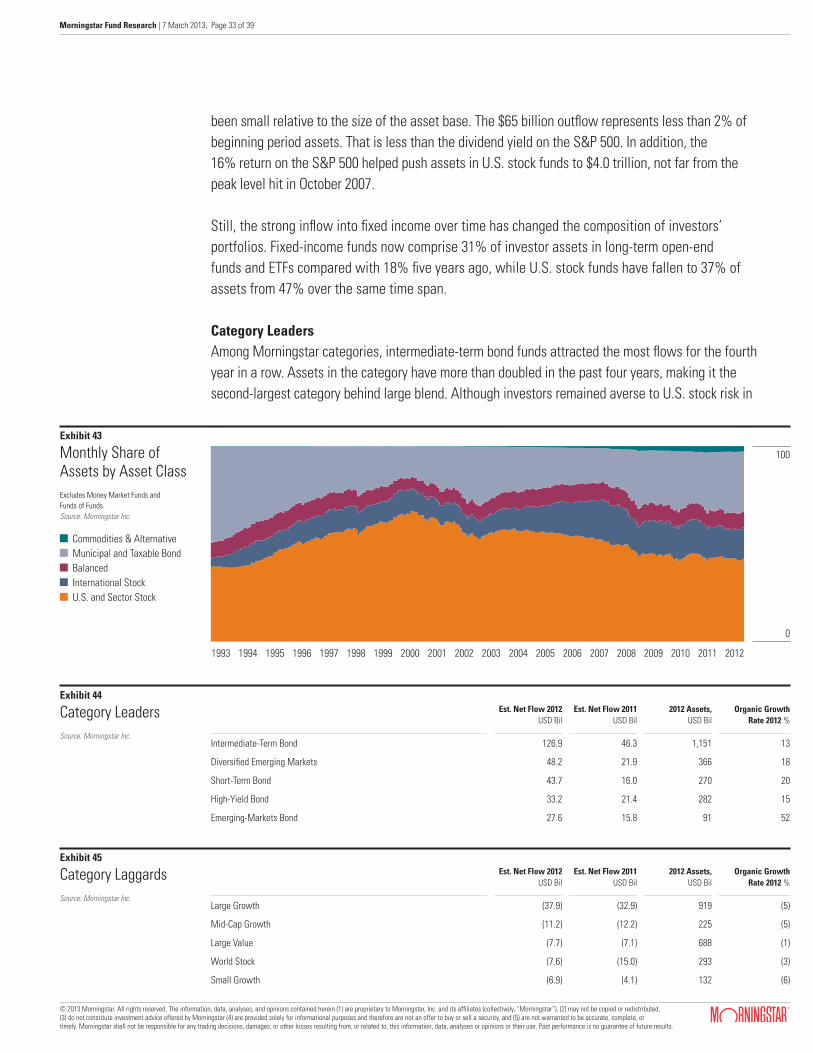
© 2013 Morningstar. All rights reserved. The information, data, analyses, and opinions contained herein (1) are proprietary to Morningstar, Inc. and its affiliates (collectively, “Morningstar”), (2) may not be copied or redistributed, (3) do not constitute investment advice offered by Morningstar (4) are provided solely for informational purposes and therefore are not an offer to buy or sell a security, and (5) are not warranted to be accurate, complete, or timely. Morningstar shall not be responsible for any trading decisions, damages, or other losses resulting from, or related to, this information, data, analyses or opinions or their use. Past performance is no guarantee of future results.
Morningstar Fund Research | 7 March 2013, Page 33 of 39
been small relative to the size of the asset base. The $65 billion outflow represents less than 2% of beginning period assets. That is less than the dividend yield on the S&P 500. In addition, the 16% return on the S&P 500 helped push assets in U.S. stock funds to $4.0 trillion, not far from the peak level hit in October 2007.
Still, the strong inflow into fixed income over time has changed the composition of investors’ portfolios. Fixed-income funds now comprise 31% of investor assets in long-term open-end funds and ETFs compared with 18% five years ago, while U.S. stock funds have fallen to 37% of assets from 47% over the same time span.
Category LeadersAmong Morningstar categories, intermediate-term bond funds attracted the most flows for the fourth year in a row. Assets in the category have more than doubled in the past four years, making it the second-largest category behind large blend. Although investors remained averse to U.S. stock risk in
Exhibit 43
Monthly Share of Assets by Asset ClassExcludes Money Market Funds and Funds of Funds. Source: Morningstar Inc.
20121993 1994 1995 1997 1998 1999 2000 2001 2002 2003 2004 2006 2007 2008 2009 2011201020051996
0
100
Commodities & Alternative Municipal and Taxable Bond Balanced International Stock U.S. and Sector Stock
Est. Net Flow 2012 USD Bil
Est. Net Flow 2011 USD Bil
2012 Assets, USD Bil
Organic Growth Rate 2012 %
Intermediate-Term Bond 126.9 46.3 1,151 13
Diversified Emerging Markets 48.2 21.9 366 18
Short-Term Bond 43.7 16.0 270 20
High-Yield Bond 33.2 21.4 282 15
Emerging-Markets Bond 27.6 15.8 91 52
Exhibit 44
Category LeadersSource: Morningstar Inc.
Est. Net Flow 2012 USD Bil
Est. Net Flow 2011 USD Bil
2012 Assets, USD Bil
Organic Growth Rate 2012 %
Large Growth (37.9) (32.9) 919 (5)
Mid-Cap Growth (11.2) (12.2) 225 (5)
Large Value (7.7) (7.1) 688 (1)
World Stock (7.6) (15.0) 293 (3)
Small Growth (6.9) (4.1) 132 (6)
Exhibit 45
Category LaggardsSource: Morningstar Inc.
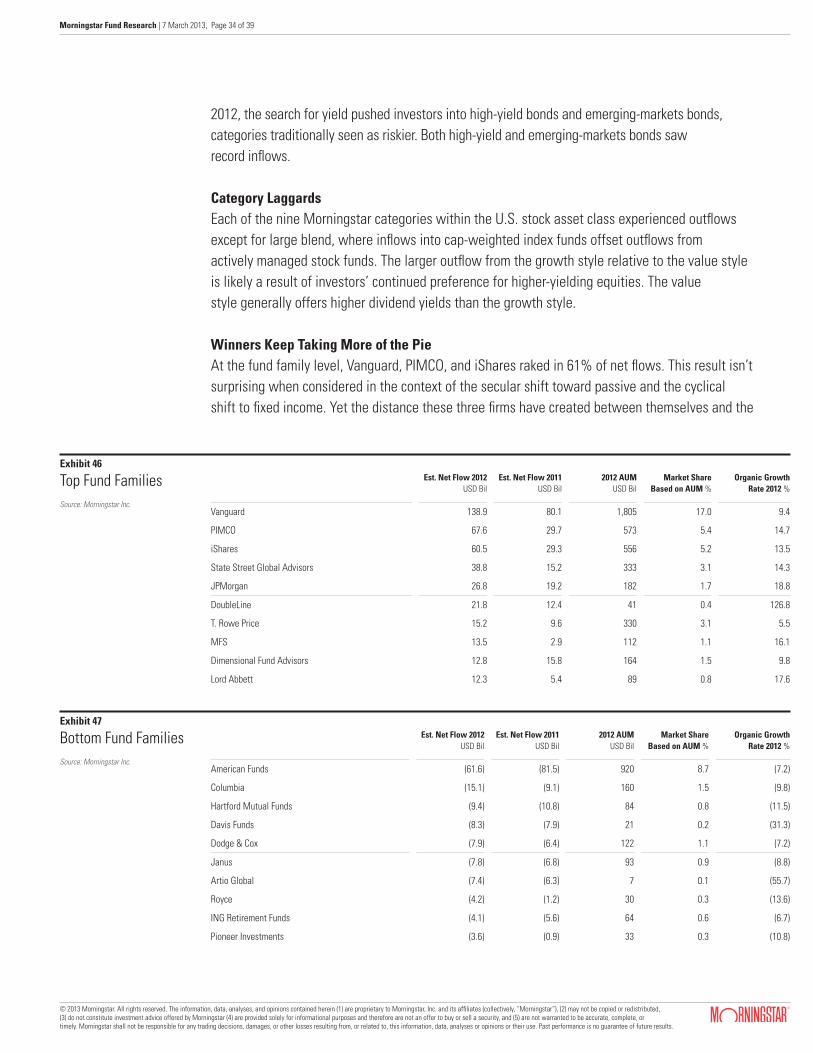
© 2013 Morningstar. All rights reserved. The information, data, analyses, and opinions contained herein (1) are proprietary to Morningstar, Inc. and its affiliates (collectively, “Morningstar”), (2) may not be copied or redistributed, (3) do not constitute investment advice offered by Morningstar (4) are provided solely for informational purposes and therefore are not an offer to buy or sell a security, and (5) are not warranted to be accurate, complete, or timely. Morningstar shall not be responsible for any trading decisions, damages, or other losses resulting from, or related to, this information, data, analyses or opinions or their use. Past performance is no guarantee of future results.
Morningstar Fund Research | 7 March 2013, Page 34 of 39
2012, the search for yield pushed investors into high-yield bonds and emerging-markets bonds, categories traditionally seen as riskier. Both high-yield and emerging-markets bonds saw record inflows.
Category LaggardsEach of the nine Morningstar categories within the U.S. stock asset class experienced outflows except for large blend, where inflows into cap-weighted index funds offset outflows from actively managed stock funds. The larger outflow from the growth style relative to the value style is likely a result of investors’ continued preference for higher-yielding equities. The value style generally offers higher dividend yields than the growth style.
Winners Keep Taking More of the PieAt the fund family level, Vanguard, PIMCO, and iShares raked in 61% of net flows. This result isn’t surprising when considered in the context of the secular shift toward passive and the cyclical shift to fixed income. Yet the distance these three firms have created between themselves and the
Est. Net Flow 2012 USD Bil
Est. Net Flow 2011 USD Bil
2012 AUM USD Bil
Market Share Based on AUM %
Organic Growth Rate 2012 %
Vanguard 138.9 80.1 1,805 17.0 9.4
PIMCO 67.6 29.7 573 5.4 14.7
iShares 60.5 29.3 556 5.2 13.5
State Street Global Advisors 38.8 15.2 333 3.1 14.3
JPMorgan 26.8 19.2 182 1.7 18.8
DoubleLine 21.8 12.4 41 0.4 126.8
T. Rowe Price 15.2 9.6 330 3.1 5.5
MFS 13.5 2.9 112 1.1 16.1
Dimensional Fund Advisors 12.8 15.8 164 1.5 9.8
Lord Abbett 12.3 5.4 89 0.8 17.6
Exhibit 46
Top Fund FamiliesSource: Morningstar Inc.
Est. Net Flow 2012 USD Bil
Est. Net Flow 2011 USD Bil
2012 AUM USD Bil
Market Share Based on AUM %
Organic Growth Rate 2012 %
American Funds (61.6) (81.5) 920 8.7 (7.2)
Columbia (15.1) (9.1) 160 1.5 (9.8)
Hartford Mutual Funds (9.4) (10.8) 84 0.8 (11.5)
Davis Funds (8.3) (7.9) 21 0.2 (31.3)
Dodge & Cox (7.9) (6.4) 122 1.1 (7.2)
Janus (7.8) (6.8) 93 0.9 (8.8)
Artio Global (7.4) (6.3) 7 0.1 (55.7)
Royce (4.2) (1.2) 30 0.3 (13.6)
ING Retirement Funds (4.1) (5.6) 64 0.6 (6.7)
Pioneer Investments (3.6) (0.9) 33 0.3 (10.8)
Exhibit 47
Bottom Fund FamiliesSource: Morningstar Inc.
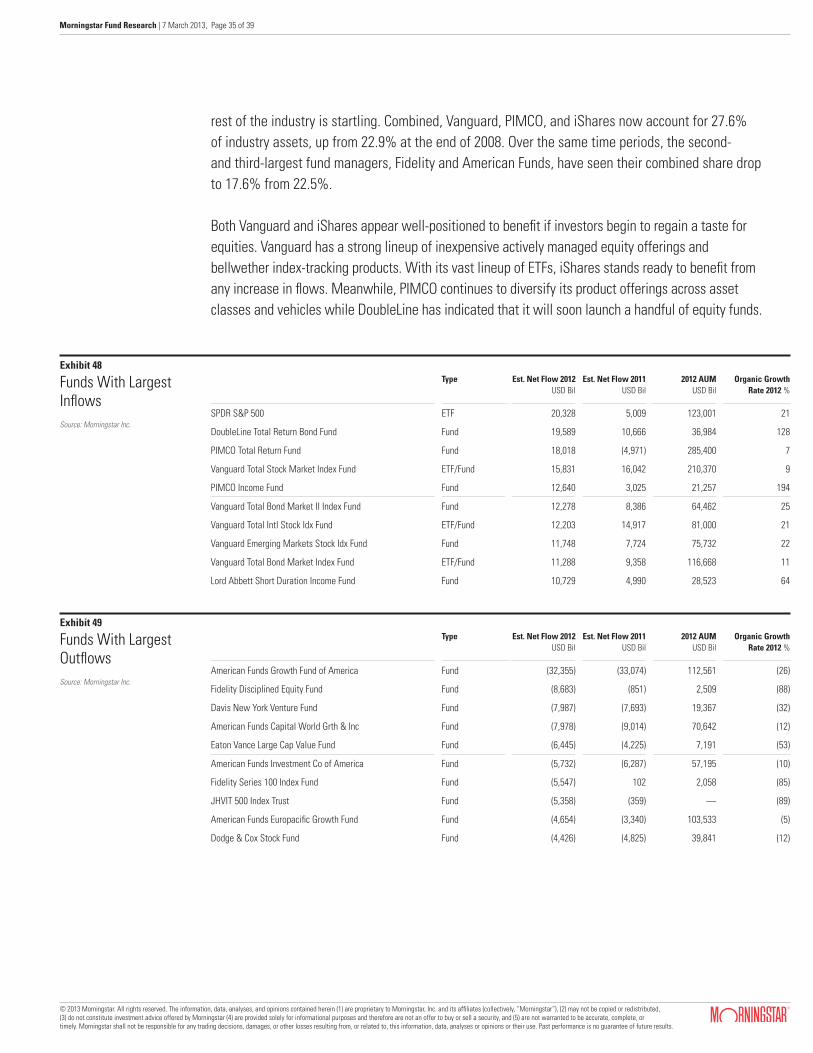
© 2013 Morningstar. All rights reserved. The information, data, analyses, and opinions contained herein (1) are proprietary to Morningstar, Inc. and its affiliates (collectively, “Morningstar”), (2) may not be copied or redistributed, (3) do not constitute investment advice offered by Morningstar (4) are provided solely for informational purposes and therefore are not an offer to buy or sell a security, and (5) are not warranted to be accurate, complete, or timely. Morningstar shall not be responsible for any trading decisions, damages, or other losses resulting from, or related to, this information, data, analyses or opinions or their use. Past performance is no guarantee of future results.
Morningstar Fund Research | 7 March 2013, Page 35 of 39
rest of the industry is startling. Combined, Vanguard, PIMCO, and iShares now account for 27.6% of industry assets, up from 22.9% at the end of 2008. Over the same time periods, the second- and third-largest fund managers, Fidelity and American Funds, have seen their combined share drop to 17.6% from 22.5%.
Both Vanguard and iShares appear well-positioned to benefit if investors begin to regain a taste for equities. Vanguard has a strong lineup of inexpensive actively managed equity offerings and bellwether index-tracking products. With its vast lineup of ETFs, iShares stands ready to benefit from any increase in flows. Meanwhile, PIMCO continues to diversify its product offerings across asset classes and vehicles while DoubleLine has indicated that it will soon launch a handful of equity funds.
Type Est. Net Flow 2012 USD Bil
Est. Net Flow 2011 USD Bil
2012 AUM USD Bil
Organic Growth Rate 2012 %
SPDR S&P 500 ETF 20,328 5,009 123,001 21
DoubleLine Total Return Bond Fund Fund 19,589 10,666 36,984 128
PIMCO Total Return Fund Fund 18,018 (4,971) 285,400 7
Vanguard Total Stock Market Index Fund ETF/Fund 15,831 16,042 210,370 9
PIMCO Income Fund Fund 12,640 3,025 21,257 194
Vanguard Total Bond Market II Index Fund Fund 12,278 8,386 64,462 25
Vanguard Total Intl Stock Idx Fund ETF/Fund 12,203 14,917 81,000 21
Vanguard Emerging Markets Stock Idx Fund Fund 11,748 7,724 75,732 22
Vanguard Total Bond Market Index Fund ETF/Fund 11,288 9,358 116,668 11
Lord Abbett Short Duration Income Fund Fund 10,729 4,990 28,523 64
Exhibit 48
Funds With Largest InflowsSource: Morningstar Inc.
Type Est. Net Flow 2012 USD Bil
Est. Net Flow 2011 USD Bil
2012 AUM USD Bil
Organic Growth Rate 2012 %
American Funds Growth Fund of America Fund (32,355) (33,074) 112,561 (26)
Fidelity Disciplined Equity Fund Fund (8,683) (851) 2,509 (88)
Davis New York Venture Fund Fund (7,987) (7,693) 19,367 (32)
American Funds Capital World Grth & Inc Fund (7,978) (9,014) 70,642 (12)
Eaton Vance Large Cap Value Fund Fund (6,445) (4,225) 7,191 (53)
American Funds Investment Co of America Fund (5,732) (6,287) 57,195 (10)
Fidelity Series 100 Index Fund Fund (5,547) 102 2,058 (85)
JHVIT 500 Index Trust Fund (5,358) (359) — (89)
American Funds Europacific Growth Fund Fund (4,654) (3,340) 103,533 (5)
Dodge & Cox Stock Fund Fund (4,426) (4,825) 39,841 (12)
Exhibit 49
Funds With Largest OutflowsSource: Morningstar Inc.
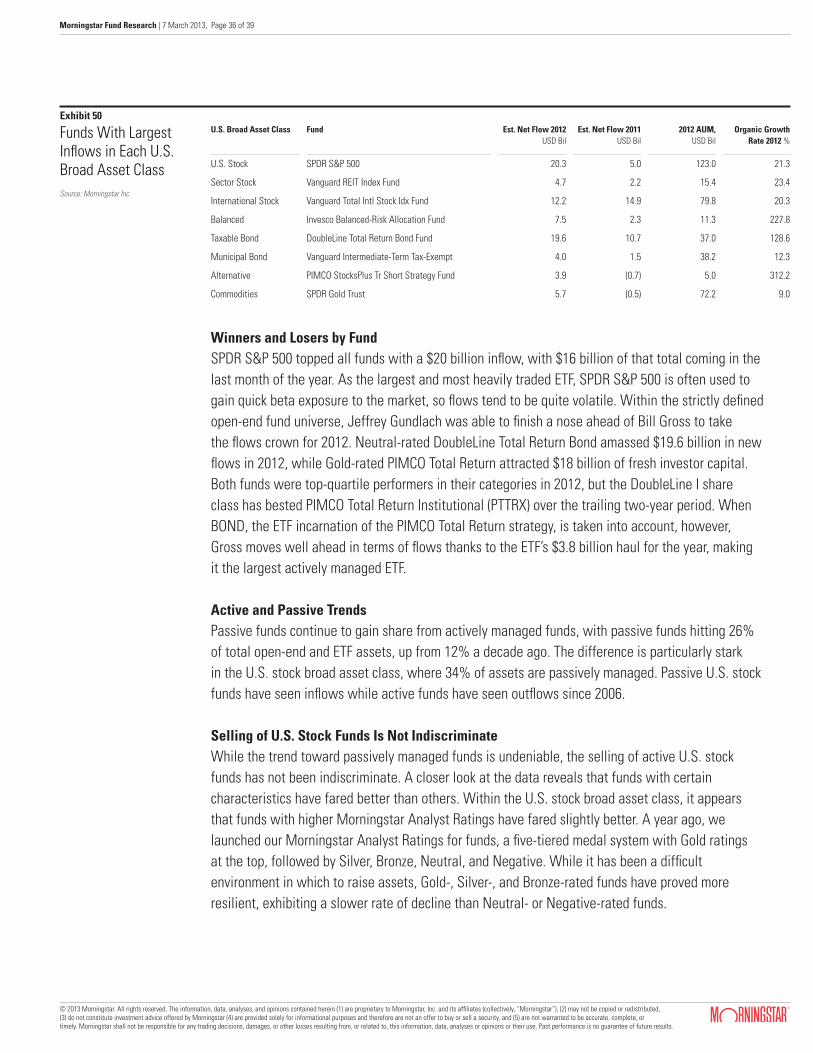
© 2013 Morningstar. All rights reserved. The information, data, analyses, and opinions contained herein (1) are proprietary to Morningstar, Inc. and its affiliates (collectively, “Morningstar”), (2) may not be copied or redistributed, (3) do not constitute investment advice offered by Morningstar (4) are provided solely for informational purposes and therefore are not an offer to buy or sell a security, and (5) are not warranted to be accurate, complete, or timely. Morningstar shall not be responsible for any trading decisions, damages, or other losses resulting from, or related to, this information, data, analyses or opinions or their use. Past performance is no guarantee of future results.
Morningstar Fund Research | 7 March 2013, Page 36 of 39
U.S. Broad Asset Class Fund Est. Net Flow 2012 USD Bil
Est. Net Flow 2011 USD Bil
2012 AUM, USD Bil
Organic Growth Rate 2012 %
U.S. Stock SPDR S&P 500 20.3 5.0 123.0 21.3
Sector Stock Vanguard REIT Index Fund 4.7 2.2 15.4 23.4
International Stock Vanguard Total Intl Stock Idx Fund 12.2 14.9 79.8 20.3
Balanced Invesco Balanced-Risk Allocation Fund 7.5 2.3 11.3 227.8
Taxable Bond DoubleLine Total Return Bond Fund 19.6 10.7 37.0 128.6
Municipal Bond Vanguard Intermediate-Term Tax-Exempt 4.0 1.5 38.2 12.3
Alternative PIMCO StocksPlus Tr Short Strategy Fund 3.9 (0.7) 5.0 312.2
Commodities SPDR Gold Trust 5.7 (0.5) 72.2 9.0
Exhibit 50
Funds With Largest Inflows in Each U.S. Broad Asset ClassSource: Morningstar Inc.
Winners and Losers by FundSPDR S&P 500 topped all funds with a $20 billion inflow, with $16 billion of that total coming in the last month of the year. As the largest and most heavily traded ETF, SPDR S&P 500 is often used to gain quick beta exposure to the market, so flows tend to be quite volatile. Within the strictly defined open-end fund universe, Jeffrey Gundlach was able to finish a nose ahead of Bill Gross to take the flows crown for 2012. Neutral-rated DoubleLine Total Return Bond amassed $19.6 billion in new flows in 2012, while Gold-rated PIMCO Total Return attracted $18 billion of fresh investor capital. Both funds were top-quartile performers in their categories in 2012, but the DoubleLine I share class has bested PIMCO Total Return Institutional (PTTRX) over the trailing two-year period. When BOND, the ETF incarnation of the PIMCO Total Return strategy, is taken into account, however, Gross moves well ahead in terms of flows thanks to the ETF’s $3.8 billion haul for the year, making it the largest actively managed ETF.
Active and Passive TrendsPassive funds continue to gain share from actively managed funds, with passive funds hitting 26% of total open-end and ETF assets, up from 12% a decade ago. The difference is particularly stark in the U.S. stock broad asset class, where 34% of assets are passively managed. Passive U.S. stock funds have seen inflows while active funds have seen outflows since 2006.
Selling of U.S. Stock Funds Is Not IndiscriminateWhile the trend toward passively managed funds is undeniable, the selling of active U.S. stock funds has not been indiscriminate. A closer look at the data reveals that funds with certain characteristics have fared better than others. Within the U.S. stock broad asset class, it appears that funds with higher Morningstar Analyst Ratings have fared slightly better. A year ago, we launched our Morningstar Analyst Ratings for funds, a five-tiered medal system with Gold ratings at the top, followed by Silver, Bronze, Neutral, and Negative. While it has been a difficult environment in which to raise assets, Gold-, Silver-, and Bronze-rated funds have proved more resilient, exhibiting a slower rate of decline than Neutral- or Negative-rated funds.

© 2013 Morningstar. All rights reserved. The information, data, analyses, and opinions contained herein (1) are proprietary to Morningstar, Inc. and its affiliates (collectively, “Morningstar”), (2) may not be copied or redistributed, (3) do not constitute investment advice offered by Morningstar (4) are provided solely for informational purposes and therefore are not an offer to buy or sell a security, and (5) are not warranted to be accurate, complete, or timely. Morningstar shall not be responsible for any trading decisions, damages, or other losses resulting from, or related to, this information, data, analyses or opinions or their use. Past performance is no guarantee of future results.
Morningstar Fund Research | 7 March 2013, Page 37 of 39
11
26
Exhibit 51
Percent of Passively Managed U.S. Open-End and ETF AssetsExcludes Money Market and Funds of Funds.Source: Morningstar Inc.
While, on average, even Gold-rated active U.S. stock funds have experienced outflows, a number of funds have had strong inflows. Exhibit 53 includes only actively managed open-end funds in the U.S. stock broad asset class. While we are not inferring causality between the Morningstar Analyst Rating and asset flows, it is not surprising that the characteristics associated with favorable Morningstar Analyst Ratings would be associated with stronger flows. Those character-istics include a strong investment process, experienced and diligent investment managers, a strong risk-adjusted performance track record, low fees, and a responsible parent.
Est. Net Flow 2012 USD Bil
Est. Net Flow 2011 USD Bil
2012 AUM USD Bil
Organic Growth Rate 2012 %
Gold (20) 441 488 (5)
Silver (6) 518 595 (1)
Bronze (37) 470 508 (8)
Neutral (52) 348 349 (15)
Negative (1) 5 5 (24)
Not Rated (47) 677 741 (7)
Exhibit 53
Non-Index U.S. Stock Flows and Assets by Morningstar Analyst RatingSource: Morningstar Inc.
–135
107
Exhibit 52
U.S. Stock Open-End and ETF Estimated Net Flow, USD BilSource: Morningstar Inc.
20122004 2005 2006 2007 2008 2009 2010 20112003
20122004 2005 2006 2007 2008 2009 2010 20112003
Active Passive
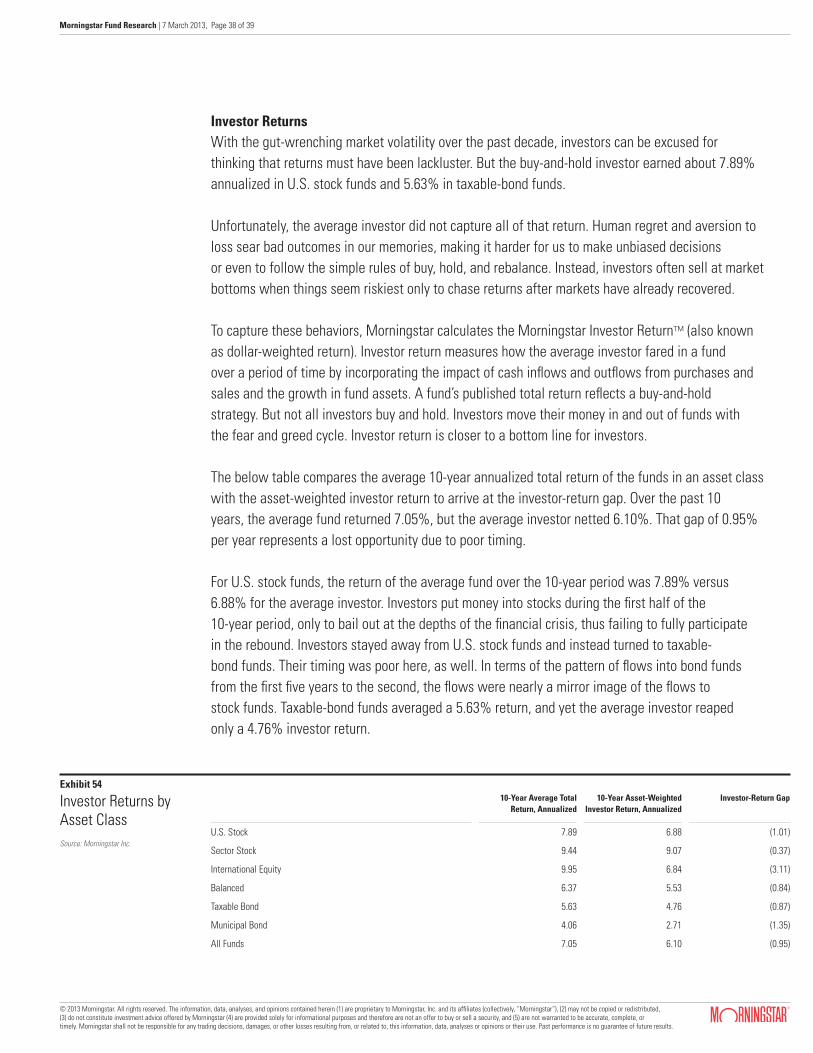
© 2013 Morningstar. All rights reserved. The information, data, analyses, and opinions contained herein (1) are proprietary to Morningstar, Inc. and its affiliates (collectively, “Morningstar”), (2) may not be copied or redistributed, (3) do not constitute investment advice offered by Morningstar (4) are provided solely for informational purposes and therefore are not an offer to buy or sell a security, and (5) are not warranted to be accurate, complete, or timely. Morningstar shall not be responsible for any trading decisions, damages, or other losses resulting from, or related to, this information, data, analyses or opinions or their use. Past performance is no guarantee of future results.
Morningstar Fund Research | 7 March 2013, Page 38 of 39
10-Year Average TotalReturn, Annualized
10-Year Asset-Weighted Investor Return, Annualized
Investor-Return Gap
U.S. Stock 7.89 6.88 (1.01)
Sector Stock 9.44 9.07 (0.37)
International Equity 9.95 6.84 (3.11)
Balanced 6.37 5.53 (0.84)
Taxable Bond 5.63 4.76 (0.87)
Municipal Bond 4.06 2.71 (1.35)
All Funds 7.05 6.10 (0.95)
Exhibit 54
Investor Returns by Asset ClassSource: Morningstar Inc.
Investor ReturnsWith the gut-wrenching market volatility over the past decade, investors can be excused for thinking that returns must have been lackluster. But the buy-and-hold investor earned about 7.89% annualized in U.S. stock funds and 5.63% in taxable-bond funds.
Unfortunately, the average investor did not capture all of that return. Human regret and aversion to loss sear bad outcomes in our memories, making it harder for us to make unbiased decisions or even to follow the simple rules of buy, hold, and rebalance. Instead, investors often sell at market bottoms when things seem riskiest only to chase returns after markets have already recovered.
To capture these behaviors, Morningstar calculates the Morningstar Investor ReturnTM (also known as dollar-weighted return). Investor return measures how the average investor fared in a fund over a period of time by incorporating the impact of cash inflows and outflows from purchases and sales and the growth in fund assets. A fund’s published total return reflects a buy-and-hold strategy. But not all investors buy and hold. Investors move their money in and out of funds with the fear and greed cycle. Investor return is closer to a bottom line for investors.
The below table compares the average 10-year annualized total return of the funds in an asset class with the asset-weighted investor return to arrive at the investor-return gap. Over the past 10 years, the average fund returned 7.05%, but the average investor netted 6.10%. That gap of 0.95% per year represents a lost opportunity due to poor timing. For U.S. stock funds, the return of the average fund over the 10-year period was 7.89% versus 6.88% for the average investor. Investors put money into stocks during the first half of the 10-year period, only to bail out at the depths of the financial crisis, thus failing to fully participate in the rebound. Investors stayed away from U.S. stock funds and instead turned to taxable- bond funds. Their timing was poor here, as well. In terms of the pattern of flows into bond funds from the first five years to the second, the flows were nearly a mirror image of the flows to stock funds. Taxable-bond funds averaged a 5.63% return, and yet the average investor reaped only a 4.76% investor return.
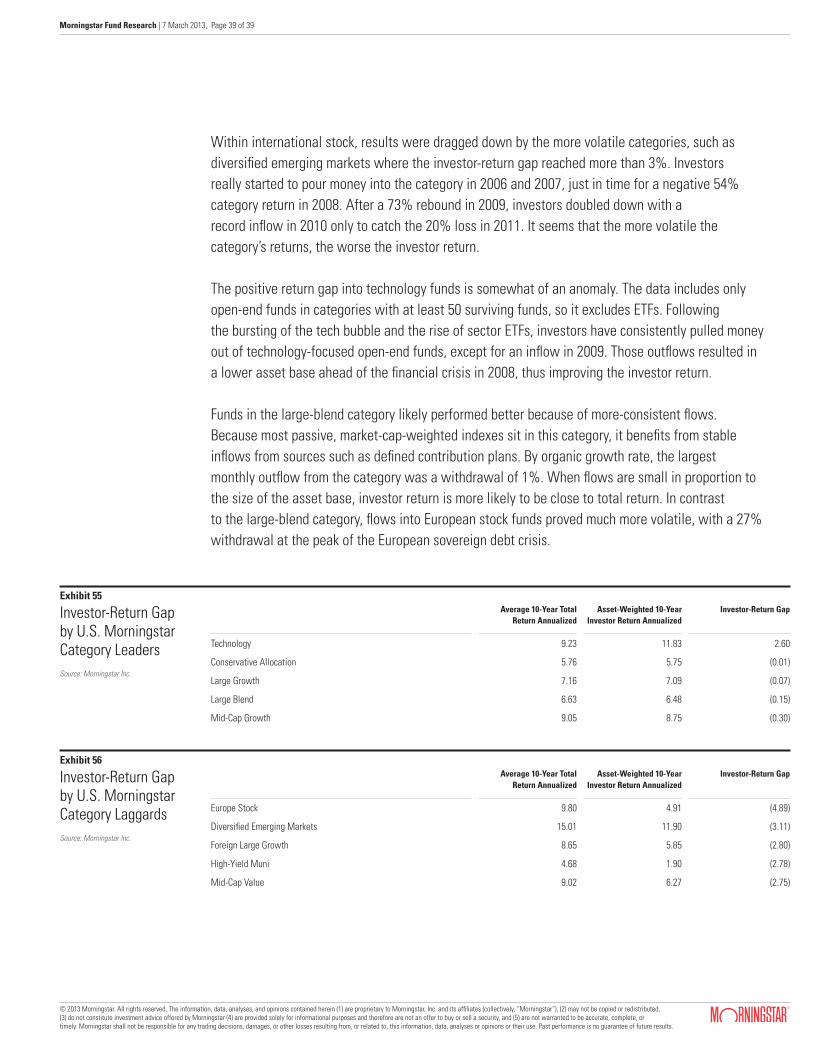
© 2013 Morningstar. All rights reserved. The information, data, analyses, and opinions contained herein (1) are proprietary to Morningstar, Inc. and its affiliates (collectively, “Morningstar”), (2) may not be copied or redistributed, (3) do not constitute investment advice offered by Morningstar (4) are provided solely for informational purposes and therefore are not an offer to buy or sell a security, and (5) are not warranted to be accurate, complete, or timely. Morningstar shall not be responsible for any trading decisions, damages, or other losses resulting from, or related to, this information, data, analyses or opinions or their use. Past performance is no guarantee of future results.
Morningstar Fund Research | 7 March 2013, Page 39 of 39
Within international stock, results were dragged down by the more volatile categories, such as diversified emerging markets where the investor-return gap reached more than 3%. Investors really started to pour money into the category in 2006 and 2007, just in time for a negative 54% category return in 2008. After a 73% rebound in 2009, investors doubled down with a record inflow in 2010 only to catch the 20% loss in 2011. It seems that the more volatile the category’s returns, the worse the investor return.
The positive return gap into technology funds is somewhat of an anomaly. The data includes only open-end funds in categories with at least 50 surviving funds, so it excludes ETFs. Following the bursting of the tech bubble and the rise of sector ETFs, investors have consistently pulled money out of technology-focused open-end funds, except for an inflow in 2009. Those outflows resulted in a lower asset base ahead of the financial crisis in 2008, thus improving the investor return.
Funds in the large-blend category likely performed better because of more-consistent flows. Because most passive, market-cap-weighted indexes sit in this category, it benefits from stable inflows from sources such as defined contribution plans. By organic growth rate, the largest monthly outflow from the category was a withdrawal of 1%. When flows are small in proportion to the size of the asset base, investor return is more likely to be close to total return. In contrast to the large-blend category, flows into European stock funds proved much more volatile, with a 27% withdrawal at the peak of the European sovereign debt crisis.
Average 10-Year Total Return Annualized
Asset-Weighted 10-Year Investor Return Annualized
Investor-Return Gap
Technology 9.23 11.83 2.60
Conservative Allocation 5.76 5.75 (0.01)
Large Growth 7.16 7.09 (0.07)
Large Blend 6.63 6.48 (0.15)
Mid-Cap Growth 9.05 8.75 (0.30)
Exhibit 55
Investor-Return Gap by U.S. Morningstar Category LeadersSource: Morningstar Inc.
Average 10-Year Total Return Annualized
Asset-Weighted 10-Year Investor Return Annualized
Investor-Return Gap
Europe Stock 9.80 4.91 (4.89)
Diversified Emerging Markets 15.01 11.90 (3.11)
Foreign Large Growth 8.65 5.85 (2.80)
High-Yield Muni 4.68 1.90 (2.78)
Mid-Cap Value 9.02 6.27 (2.75)
Exhibit 56
Investor-Return Gap by U.S. Morningstar Category LaggardsSource: Morningstar Inc.