morningstar directsm u.s. asset flows updatecorporate.morningstar.com/us/documents/commentary/usoe...
TRANSCRIPT
?
Morningstar DirectSM U.S. Asset Flows Update
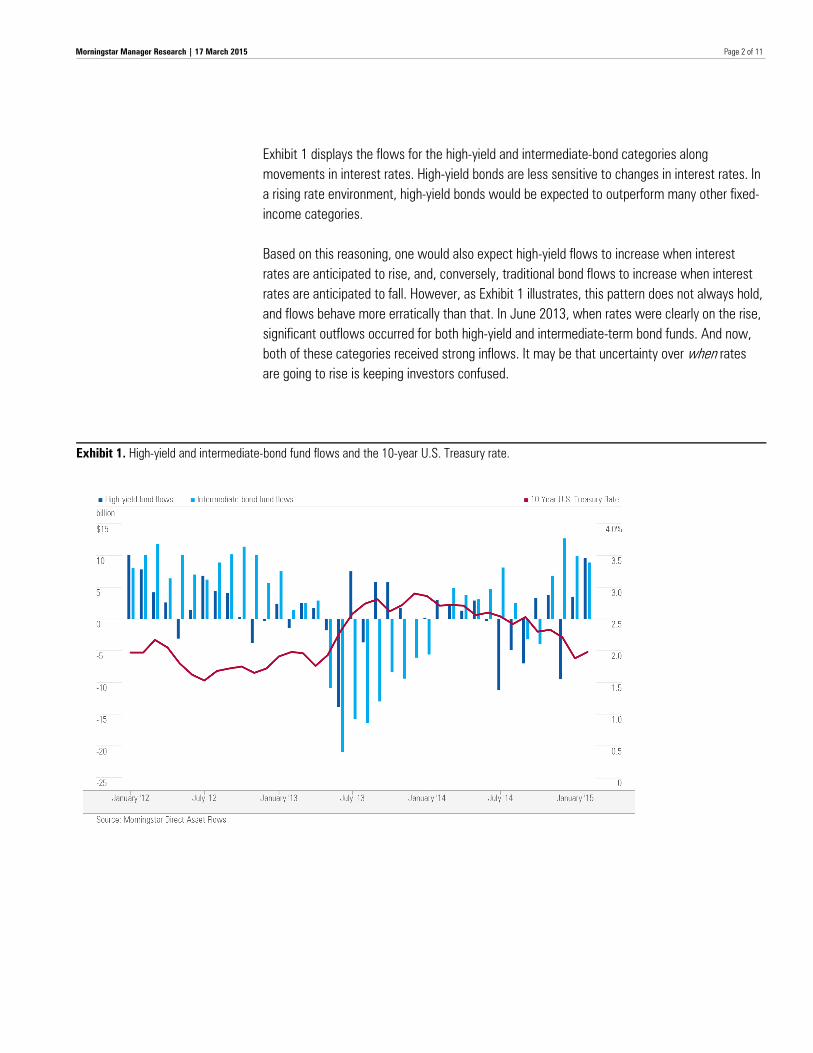
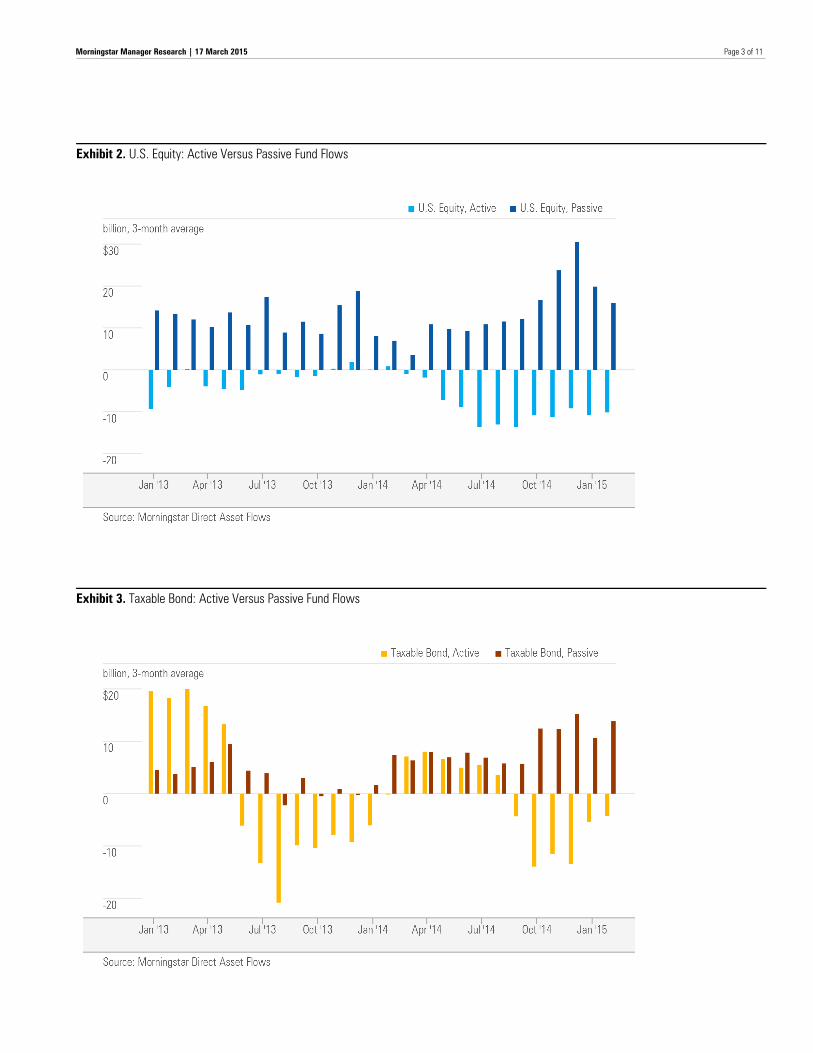
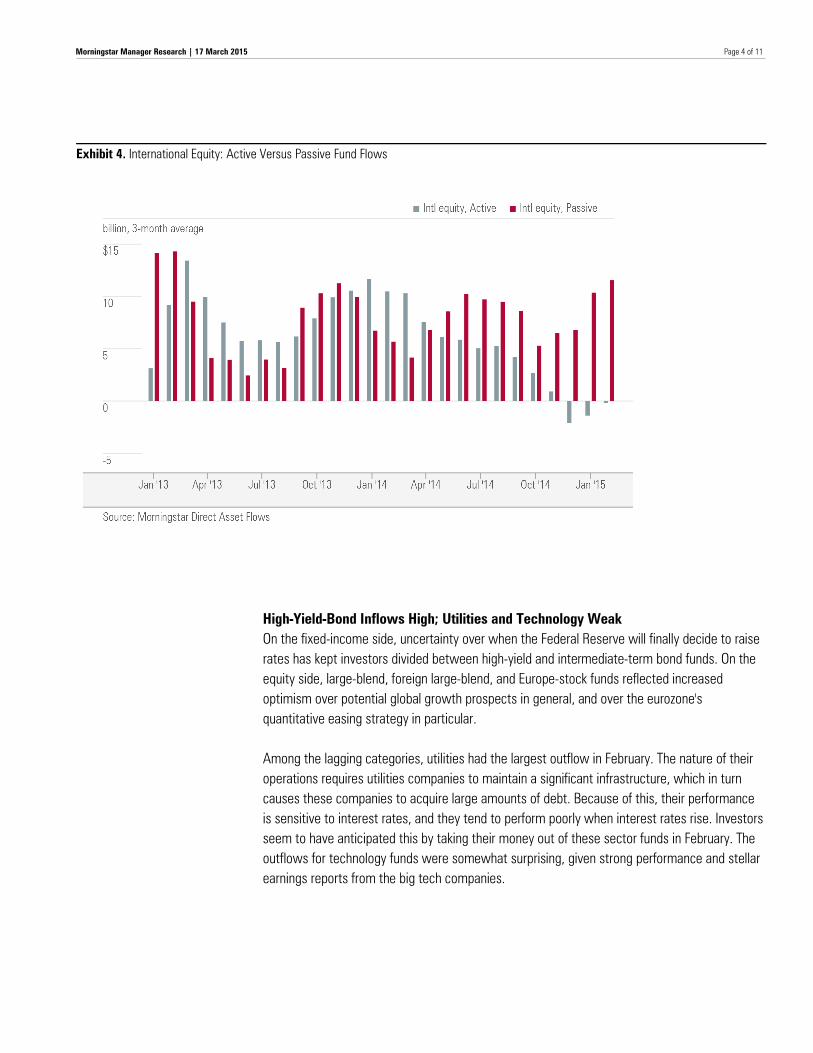
Taxable Bond and International Equity Receive Highest Flows in February The taxable bond Morningstar category group saw total estimated flows of approximately $29 billion in February, the largest single month of inflows since January 2013. The Federal Reserve started signaling that interest rates will rise this year, so last month’s heavy investment in bond funds was a little surprising. But the largest flowing bond category was high yield, which tends to do well in a rising interest-rate environment. On the international-equity front, both developed and emerging markets had a strong month. The European Central Bank’s quantitative easing program has reduced bond yields and helped to fuel a stock market rally in Europe. This, along with improving economic data, an agreement to extend Greece’s aid program, and an allayment of fears over Russia and Ukraine were the likely reasons for the strong flows. In the United States, a slew of positive economic indicators drove equity markets up, with the S&P 500 gaining 6% in February. As expected, this rally renewed investor confidence in stocks, but once again, passively managed funds reaped all the rewards. In fact, this is true not only for U.S. equity funds but for international-equity funds as well.
Active
Passive
Estimated Net Flows* $Mil
Feb 2015 1 Year Assets
Feb 2015 1 Year Assets
$Bil $Bil
U.S. Equity (9,109) (124,995) 3,766 15,083 183,410 2,408
Sector Equity 3,000 22,722 409 (2,185) 41,241 360
International Equity 3,786 36,469 1,567 16,182 108,698 769
Allocation 3,185 37,359 1,236 309 2,610 50
Taxable Bond 9,675 (16,684) 2,313 18,862 116,536 690
Municipal Bond 2,795 33,862 575 446 4,551 19
Alternative 767 9,484 158 768 4,090 46
Commodities 217 1,754 30 440 2,938 61
All Long Term 14,316 (29) 10,054 49,905 464,074 4,403
Money Market (10,465) 24,025 2,665
*Includes liquidated and merged funds.
Source: Morningstar Direct Asset Flows.
Morningstar Manager Research 17 March 2015 Data through Feb. 28, 2015 U.S. Mutual Funds and Exchange-Traded Products Alina Lamy Senior Analyst Markets Research +1 312-384-3924 [email protected]
Page 2 of 11
Morningstar Manager Research | 17 March 2015
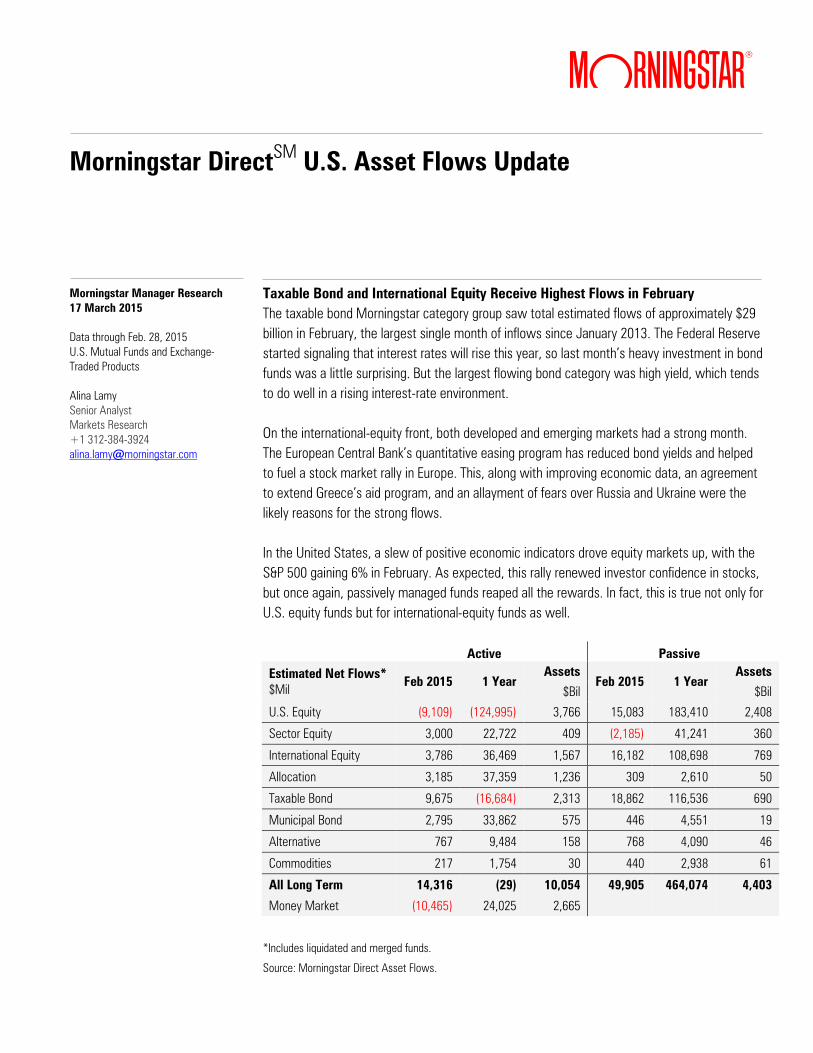
Exhibit 1 displays the flows for the high-yield and intermediate-bond categories along movements in interest rates. High-yield bonds are less sensitive to changes in interest rates. In a rising rate environment, high-yield bonds would be expected to outperform many other fixed-income categories. Based on this reasoning, one would also expect high-yield flows to increase when interest rates are anticipated to rise, and, conversely, traditional bond flows to increase when interest rates are anticipated to fall. However, as Exhibit 1 illustrates, this pattern does not always hold, and flows behave more erratically than that. In June 2013, when rates were clearly on the rise, significant outflows occurred for both high-yield and intermediate-term bond funds. And now, both of these categories received strong inflows. It may be that uncertainty over when rates are going to rise is keeping investors confused.
Exhibit 1. High-yield and intermediate-bond fund flows and the 10-year U.S. Treasury rate.
Page 3 of 11
Morningstar Manager Research | 17 March 2015
Exhibit 2. U.S. Equity: Active Versus Passive Fund Flows
Exhibit 3. Taxable Bond: Active Versus Passive Fund Flows
Page 4 of 11
Morningstar Manager Research | 17 March 2015
Exhibit 4. International Equity: Active Versus Passive Fund Flows
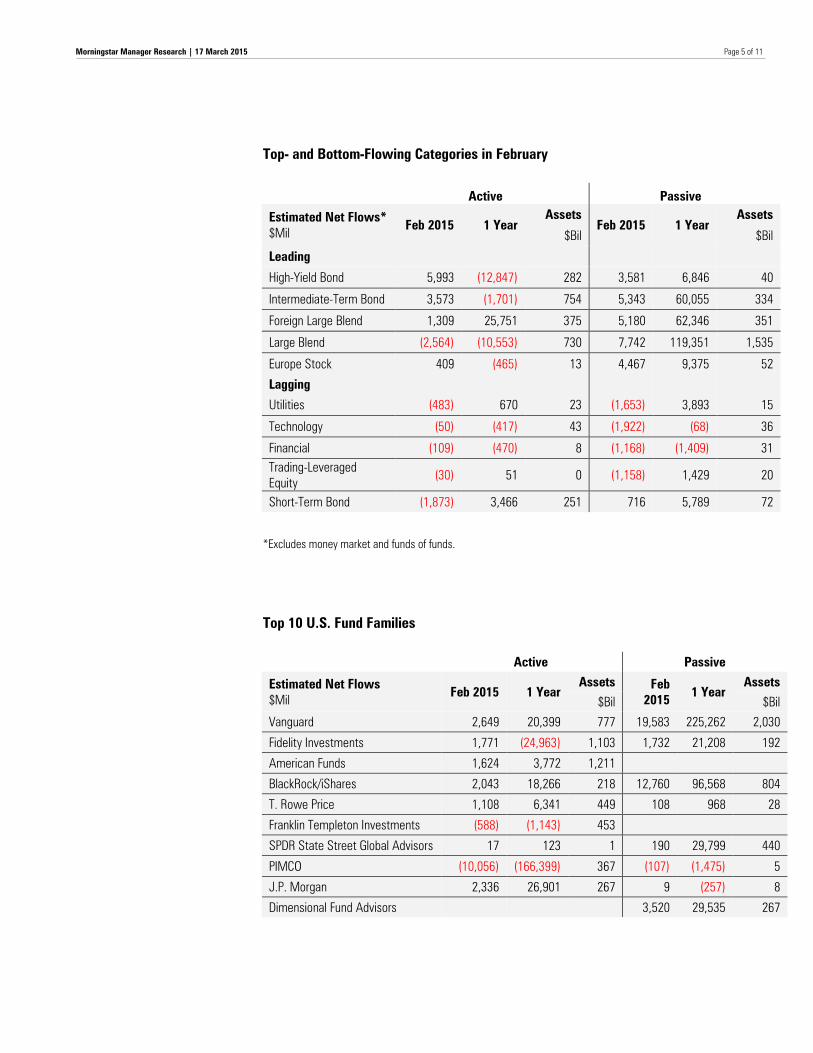
High-Yield-Bond Inflows High; Utilities and Technology Weak On the fixed-income side, uncertainty over when the Federal Reserve will finally decide to raise rates has kept investors divided between high-yield and intermediate-term bond funds. On the equity side, large-blend, foreign large-blend, and Europe-stock funds reflected increased optimism over potential global growth prospects in general, and over the eurozone's quantitative easing strategy in particular. Among the lagging categories, utilities had the largest outflow in February. The nature of their operations requires utilities companies to maintain a significant infrastructure, which in turn causes these companies to acquire large amounts of debt. Because of this, their performance is sensitive to interest rates, and they tend to perform poorly when interest rates rise. Investors seem to have anticipated this by taking their money out of these sector funds in February. The outflows for technology funds were somewhat surprising, given strong performance and stellar earnings reports from the big tech companies.
Page 5 of 11
Morningstar Manager Research | 17 March 2015
Top- and Bottom-Flowing Categories in February
Active
Passive
Estimated Net Flows* $Mil
Feb 2015 1 Year Assets
Feb 2015 1 Year Assets
$Bil $Bil
Leading
High-Yield Bond 5,993 (12,847) 282 3,581 6,846 40
Intermediate-Term Bond 3,573 (1,701) 754 5,343 60,055 334
Foreign Large Blend 1,309 25,751 375 5,180 62,346 351
Large Blend (2,564) (10,553) 730 7,742 119,351 1,535
Europe Stock 409 (465) 13 4,467 9,375 52
Lagging
Utilities (483) 670 23 (1,653) 3,893 15
Technology (50) (417) 43 (1,922) (68) 36
Financial (109) (470) 8 (1,168) (1,409) 31 Trading-Leveraged Equity
(30) 51 0 (1,158) 1,429 20
Short-Term Bond (1,873) 3,466 251 716 5,789 72
*Excludes money market and funds of funds.
Top 10 U.S. Fund Families
Active
Passive
Estimated Net Flows $Mil
Feb 2015 1 Year Assets Feb
2015 1 Year Assets
$Bil $Bil
Vanguard 2,649 20,399 777 19,583 225,262 2,030
Fidelity Investments 1,771 (24,963) 1,103 1,732 21,208 192
American Funds 1,624 3,772 1,211
BlackRock/iShares 2,043 18,266 218 12,760 96,568 804
T. Rowe Price 1,108 6,341 449 108 968 28
Franklin Templeton Investments (588) (1,143) 453
SPDR State Street Global Advisors 17 123 1 190 29,799 440
PIMCO (10,056) (166,399) 367 (107) (1,475) 5
J.P. Morgan 2,336 26,901 267 9 (257) 8
Dimensional Fund Advisors 3,520 29,535 267
Page 6 of 11
Morningstar Manager Research | 17 March 2015
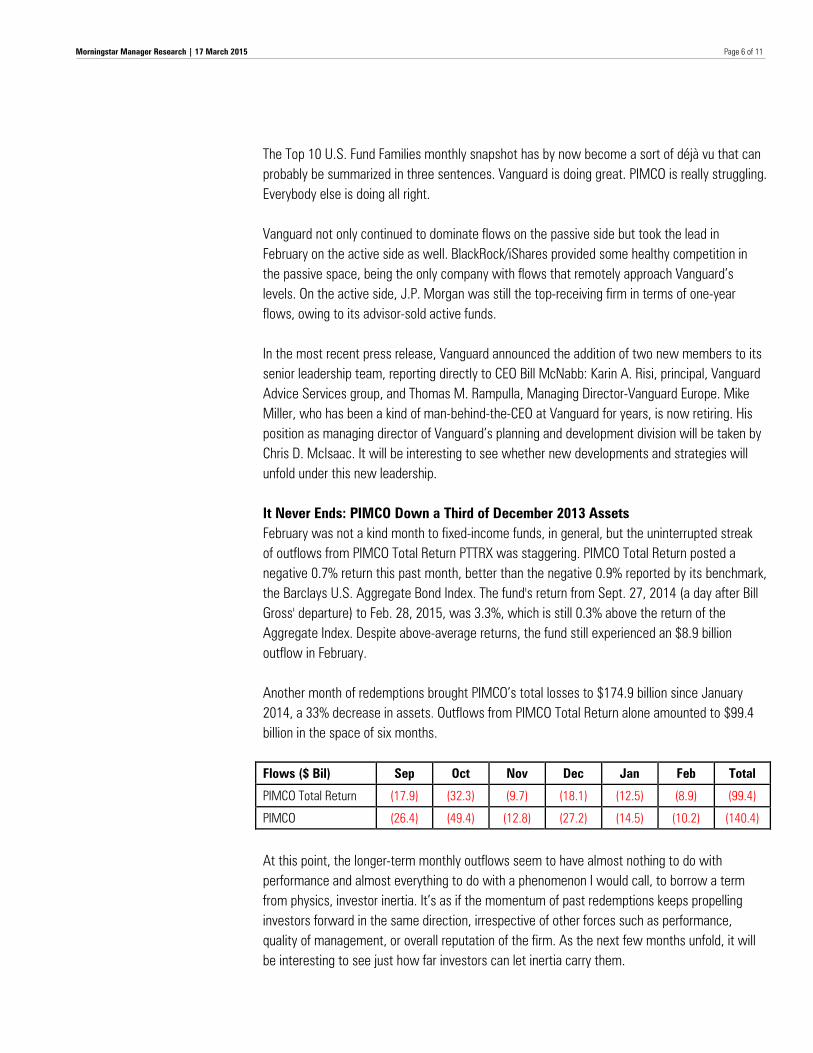
The Top 10 U.S. Fund Families monthly snapshot has by now become a sort of déjà vu that can probably be summarized in three sentences. Vanguard is doing great. PIMCO is really struggling. Everybody else is doing all right. Vanguard not only continued to dominate flows on the passive side but took the lead in February on the active side as well. BlackRock/iShares provided some healthy competition in the passive space, being the only company with flows that remotely approach Vanguard’s levels. On the active side, J.P. Morgan was still the top-receiving firm in terms of one-year flows, owing to its advisor-sold active funds. In the most recent press release, Vanguard announced the addition of two new members to its senior leadership team, reporting directly to CEO Bill McNabb: Karin A. Risi, principal, Vanguard Advice Services group, and Thomas M. Rampulla, Managing Director-Vanguard Europe. Mike Miller, who has been a kind of man-behind-the-CEO at Vanguard for years, is now retiring. His position as managing director of Vanguard’s planning and development division will be taken by Chris D. McIsaac. It will be interesting to see whether new developments and strategies will unfold under this new leadership. It Never Ends: PIMCO Down a Third of December 2013 Assets February was not a kind month to fixed-income funds, in general, but the uninterrupted streak of outflows from PIMCO Total Return PTTRX was staggering. PIMCO Total Return posted a negative 0.7% return this past month, better than the negative 0.9% reported by its benchmark, the Barclays U.S. Aggregate Bond Index. The fund's return from Sept. 27, 2014 (a day after Bill Gross' departure) to Feb. 28, 2015, was 3.3%, which is still 0.3% above the return of the Aggregate Index. Despite above-average returns, the fund still experienced an $8.9 billion outflow in February. Another month of redemptions brought PIMCO’s total losses to $174.9 billion since January 2014, a 33% decrease in assets. Outflows from PIMCO Total Return alone amounted to $99.4 billion in the space of six months. Flows ($ Bil) Sep Oct Nov Dec Jan Feb Total
PIMCO Total Return (17.9) (32.3) (9.7) (18.1) (12.5) (8.9) (99.4)
PIMCO (26.4) (49.4) (12.8) (27.2) (14.5) (10.2) (140.4)
At this point, the longer-term monthly outflows seem to have almost nothing to do with performance and almost everything to do with a phenomenon I would call, to borrow a term from physics, investor inertia. It’s as if the momentum of past redemptions keeps propelling investors forward in the same direction, irrespective of other forces such as performance, quality of management, or overall reputation of the firm. As the next few months unfold, it will be interesting to see just how far investors can let inertia carry them.
Page 7 of 11
Morningstar Manager Research | 17 March 2015
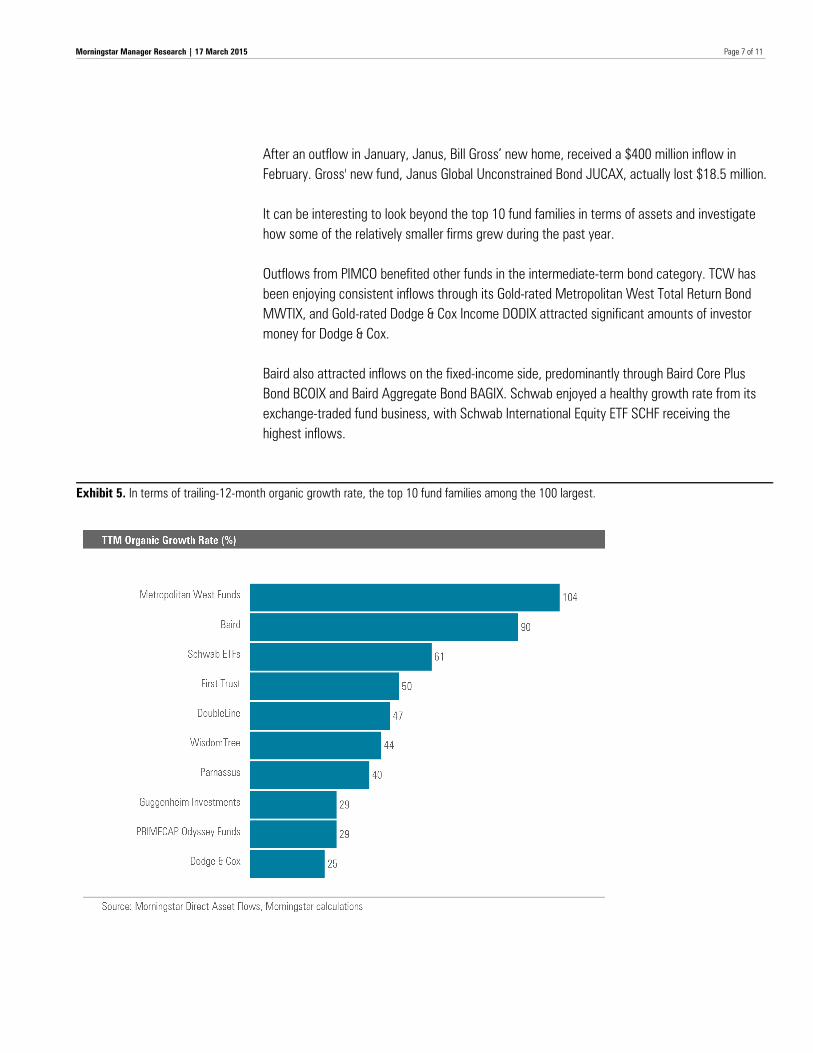
After an outflow in January, Janus, Bill Gross’ new home, received a $400 million inflow in February. Gross' new fund, Janus Global Unconstrained Bond JUCAX, actually lost $18.5 million. It can be interesting to look beyond the top 10 fund families in terms of assets and investigate how some of the relatively smaller firms grew during the past year. Outflows from PIMCO benefited other funds in the intermediate-term bond category. TCW has been enjoying consistent inflows through its Gold-rated Metropolitan West Total Return Bond MWTIX, and Gold-rated Dodge & Cox Income DODIX attracted significant amounts of investor money for Dodge & Cox. Baird also attracted inflows on the fixed-income side, predominantly through Baird Core Plus Bond BCOIX and Baird Aggregate Bond BAGIX. Schwab enjoyed a healthy growth rate from its exchange-traded fund business, with Schwab International Equity ETF SCHF receiving the highest inflows.
Exhibit 5. In terms of trailing-12-month organic growth rate, the top 10 fund families among the 100 largest.
Page 8 of 11
Morningstar Manager Research | 17 March 2015
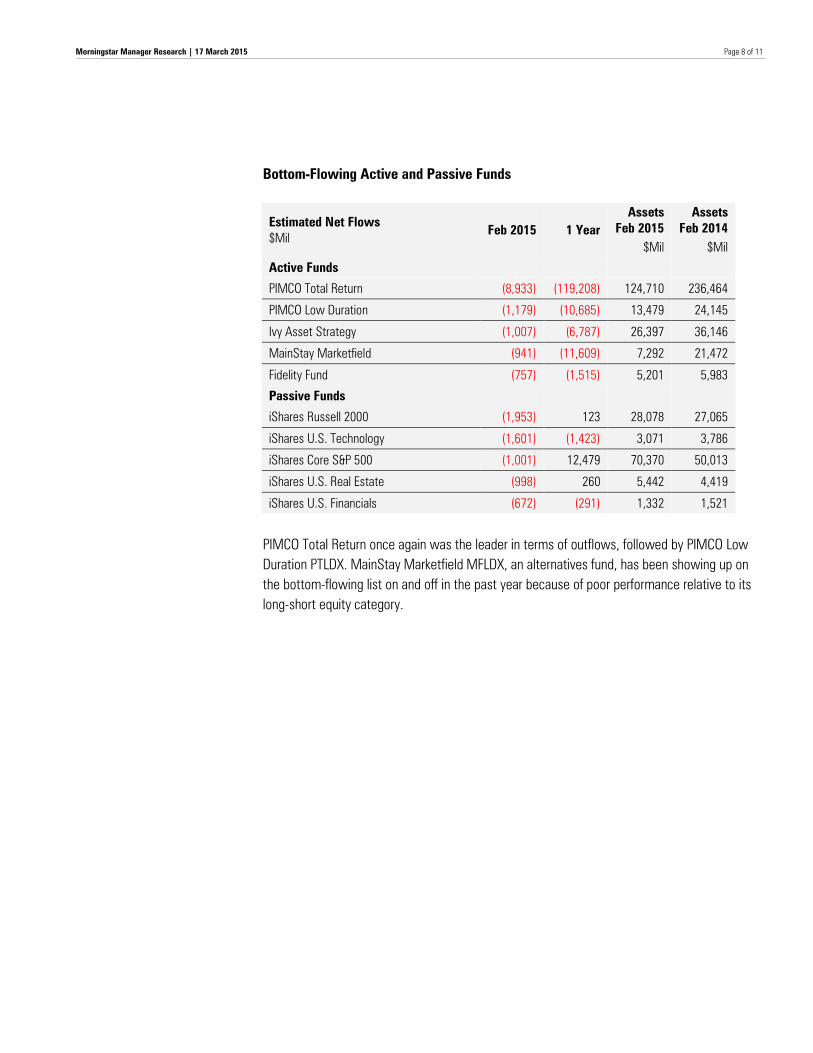
Bottom-Flowing Active and Passive Funds
Estimated Net Flows $Mil
Feb 2015 1 Year Assets
Feb 2015 Assets
Feb 2014 $Mil $Mil
Active Funds
PIMCO Total Return (8,933) (119,208) 124,710 236,464
PIMCO Low Duration (1,179) (10,685) 13,479 24,145
Ivy Asset Strategy (1,007) (6,787) 26,397 36,146
MainStay Marketfield (941) (11,609) 7,292 21,472
Fidelity Fund (757) (1,515) 5,201 5,983
Passive Funds
iShares Russell 2000 (1,953) 123 28,078 27,065
iShares U.S. Technology (1,601) (1,423) 3,071 3,786
iShares Core S&P 500 (1,001) 12,479 70,370 50,013
iShares U.S. Real Estate (998) 260 5,442 4,419
iShares U.S. Financials (672) (291) 1,332 1,521
PIMCO Total Return once again was the leader in terms of outflows, followed by PIMCO Low Duration PTLDX. MainStay Marketfield MFLDX, an alternatives fund, has been showing up on the bottom-flowing list on and off in the past year because of poor performance relative to its long-short equity category.
Page 9 of 11
Morningstar Manager Research | 17 March 2015
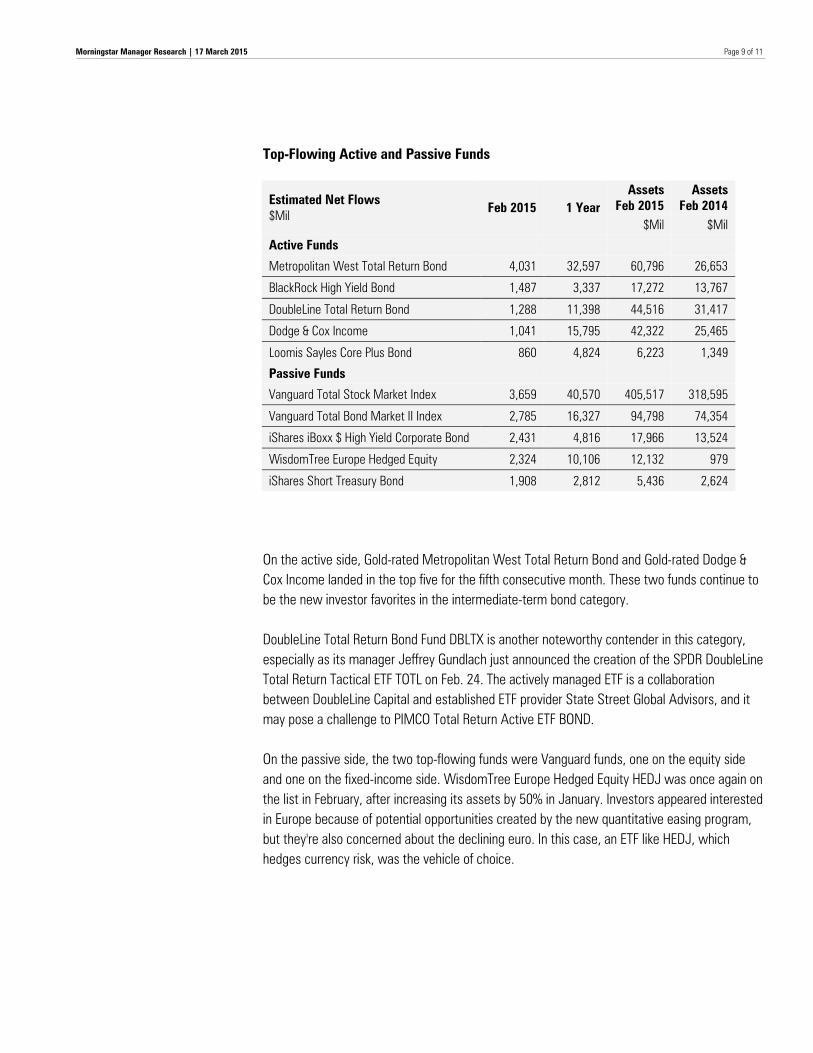
Top-Flowing Active and Passive Funds
Estimated Net Flows $Mil
Feb 2015 1 Year Assets
Feb 2015 Assets
Feb 2014 $Mil $Mil
Active Funds
Metropolitan West Total Return Bond 4,031 32,597 60,796 26,653
BlackRock High Yield Bond 1,487 3,337 17,272 13,767
DoubleLine Total Return Bond 1,288 11,398 44,516 31,417
Dodge & Cox Income 1,041 15,795 42,322 25,465
Loomis Sayles Core Plus Bond 860 4,824 6,223 1,349
Passive Funds
Vanguard Total Stock Market Index 3,659 40,570 405,517 318,595
Vanguard Total Bond Market II Index 2,785 16,327 94,798 74,354
iShares iBoxx $ High Yield Corporate Bond 2,431 4,816 17,966 13,524
WisdomTree Europe Hedged Equity 2,324 10,106 12,132 979
iShares Short Treasury Bond 1,908 2,812 5,436 2,624 On the active side, Gold-rated Metropolitan West Total Return Bond and Gold-rated Dodge & Cox Income landed in the top five for the fifth consecutive month. These two funds continue to be the new investor favorites in the intermediate-term bond category. DoubleLine Total Return Bond Fund DBLTX is another noteworthy contender in this category, especially as its manager Jeffrey Gundlach just announced the creation of the SPDR DoubleLine Total Return Tactical ETF TOTL on Feb. 24. The actively managed ETF is a collaboration between DoubleLine Capital and established ETF provider State Street Global Advisors, and it may pose a challenge to PIMCO Total Return Active ETF BOND. On the passive side, the two top-flowing funds were Vanguard funds, one on the equity side and one on the fixed-income side. WisdomTree Europe Hedged Equity HEDJ was once again on the list in February, after increasing its assets by 50% in January. Investors appeared interested in Europe because of potential opportunities created by the new quantitative easing program, but they're also concerned about the declining euro. In this case, an ETF like HEDJ, which hedges currency risk, was the vehicle of choice.

Page 10 of 11
Morningstar Manager Research | 17 March 2015
Exhibit 6. Intermediate-Term Bond Funds, Monthly Flows
Page 11 of 11
Morningstar Manager Research | 17 March 2015
Note: The figures in this report were compiled on March 10, 2015, and reflect only the funds that had reported net assets by that date. The figures in both the commentary and the extended tables are survivorship-bias-free. Also note that this report includes both mutual funds and exchange-traded funds, while past commentaries excluded ETFs. The decision to include ETFs and to split some of the data tables into active and passive groups was based on the fact that ETFs now account for a significant share of assets and flows. In addition, a large share of the flows to mutual funds during the past several years have gone to passive investments, often within retirement savings accounts. These flows may not be completely representative of incremental investment decisions. Important methodology note: Morningstar computes flows using the approach that is standard in the industry: Estimated net flow is the change in assets not explained by the performance of the fund. Our method assumes that flows occur uniformly over the course of the month. Adjustments for mergers are performed automatically. When liquidated funds are included, the final assets of the fund are counted as outflows. Reinvested dividends are not counted as inflows. We use fund-level reinvestment rates to improve accuracy in this respect. We make ad hoc adjustments for unusual corporate actions such as reverse share splits, and we overwrite our estimates with actual flows if managers are willing to provide the data to us. Please click here for a full explanation of our methodology.
?
22 West Washington Street
Chicago, IL 60602 USA
© Morningstar 2015. All Rights Reserved. The information, data, analyses and opinions presented herein do not constitute investment advice; are provided solely for informational purposes and therefore are not an offer to buy or sell a security; and are not warranted to be correct, complete or accurate. The opinions expressed are as of the date written and are subject to change without notice. Except as otherwise required by law, Morningstar shall not be responsible for any trading decisions, damages or other losses resulting from, or related to, the information, data, analyses or opinions or their use. The information contained herein is the proprietary property of Morningstar and may not be reproduced, in whole or in part, or used in any manner, without the prior written consent of Morningstar. To order reprints, call +1 312-696-6100. To license the research, call +1 312-696-6869.
Morningstar DirectSM | Publishing Date: 2015-03-11 Page 1 of 6
Fund Flows
Monthly Market Summary: US Open-end & ETF ex MM ex FoF Effective Date
02-28-2015Including merged and liquidated funds
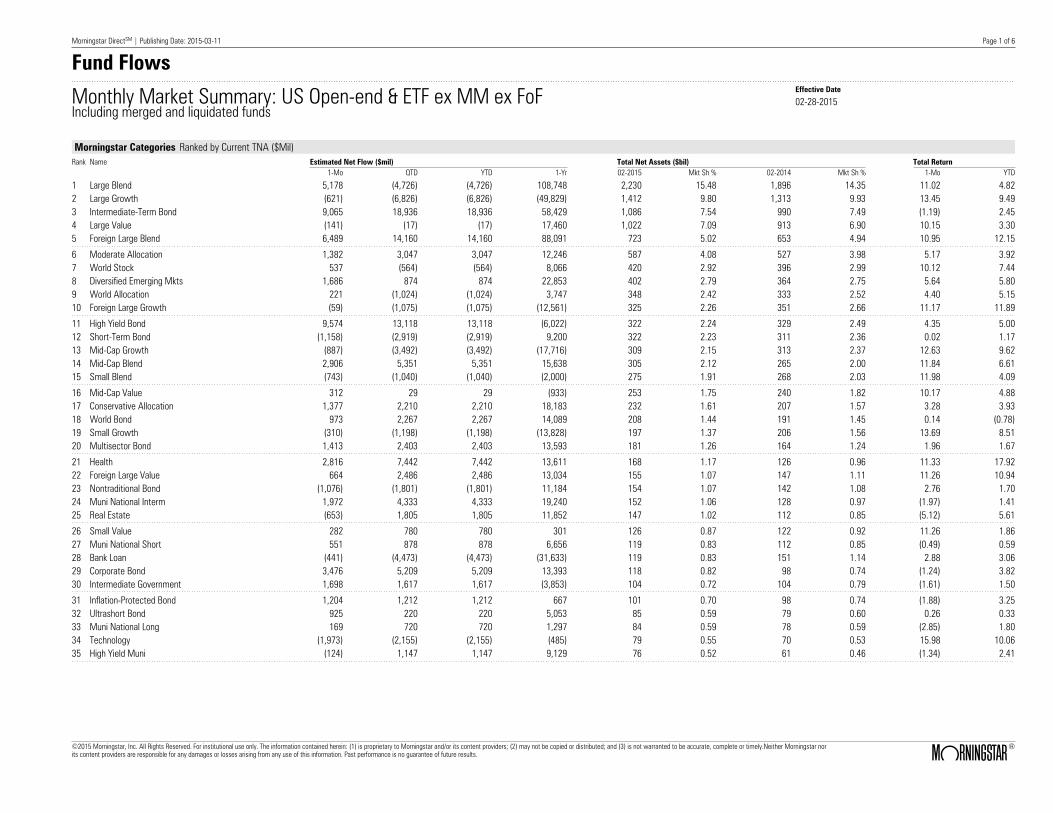
Morningstar Categories Ranked by Current TNA ($Mil)Rank Name Estimated Net Flow ($mil) Total Net Assets ($bil) Total Return
1-Mo QTD YTD 1-Yr 02-2015 Mkt Sh % 02-2014 Mkt Sh % 1-Mo YTD
1 Large Blend 5,178 (4,726) (4,726) 108,748 2,230 15.48 1,896 14.35 11.02 4.822 Large Growth (621) (6,826) (6,826) (49,829) 1,412 9.80 1,313 9.93 13.45 9.493 Intermediate-Term Bond 9,065 18,936 18,936 58,429 1,086 7.54 990 7.49 (1.19) 2.454 Large Value (141) (17) (17) 17,460 1,022 7.09 913 6.90 10.15 3.305 Foreign Large Blend 6,489 14,160 14,160 88,091 723 5.02 653 4.94 10.95 12.15
6 Moderate Allocation 1,382 3,047 3,047 12,246 587 4.08 527 3.98 5.17 3.927 World Stock 537 (564) (564) 8,066 420 2.92 396 2.99 10.12 7.448 Diversified Emerging Mkts 1,686 874 874 22,853 402 2.79 364 2.75 5.64 5.809 World Allocation 221 (1,024) (1,024) 3,747 348 2.42 333 2.52 4.40 5.1510 Foreign Large Growth (59) (1,075) (1,075) (12,561) 325 2.26 351 2.66 11.17 11.89
11 High Yield Bond 9,574 13,118 13,118 (6,022) 322 2.24 329 2.49 4.35 5.0012 Short-Term Bond (1,158) (2,919) (2,919) 9,200 322 2.23 311 2.36 0.02 1.1713 Mid-Cap Growth (887) (3,492) (3,492) (17,716) 309 2.15 313 2.37 12.63 9.6214 Mid-Cap Blend 2,906 5,351 5,351 15,638 305 2.12 265 2.00 11.84 6.6115 Small Blend (743) (1,040) (1,040) (2,000) 275 1.91 268 2.03 11.98 4.09
16 Mid-Cap Value 312 29 29 (933) 253 1.75 240 1.82 10.17 4.8817 Conservative Allocation 1,377 2,210 2,210 18,183 232 1.61 207 1.57 3.28 3.9318 World Bond 973 2,267 2,267 14,089 208 1.44 191 1.45 0.14 (0.78)19 Small Growth (310) (1,198) (1,198) (13,828) 197 1.37 206 1.56 13.69 8.5120 Multisector Bond 1,413 2,403 2,403 13,593 181 1.26 164 1.24 1.96 1.67
21 Health 2,816 7,442 7,442 13,611 168 1.17 126 0.96 11.33 17.9222 Foreign Large Value 664 2,486 2,486 13,034 155 1.07 147 1.11 11.26 10.9423 Nontraditional Bond (1,076) (1,801) (1,801) 11,184 154 1.07 142 1.08 2.76 1.7024 Muni National Interm 1,972 4,333 4,333 19,240 152 1.06 128 0.97 (1.97) 1.4125 Real Estate (653) 1,805 1,805 11,852 147 1.02 112 0.85 (5.12) 5.61
26 Small Value 282 780 780 301 126 0.87 122 0.92 11.26 1.8627 Muni National Short 551 878 878 6,656 119 0.83 112 0.85 (0.49) 0.5928 Bank Loan (441) (4,473) (4,473) (31,633) 119 0.83 151 1.14 2.88 3.0629 Corporate Bond 3,476 5,209 5,209 13,393 118 0.82 98 0.74 (1.24) 3.8230 Intermediate Government 1,698 1,617 1,617 (3,853) 104 0.72 104 0.79 (1.61) 1.50
31 Inflation-Protected Bond 1,204 1,212 1,212 667 101 0.70 98 0.74 (1.88) 3.2532 Ultrashort Bond 925 220 220 5,053 85 0.59 79 0.60 0.26 0.3333 Muni National Long 169 720 720 1,297 84 0.59 78 0.59 (2.85) 1.8034 Technology (1,973) (2,155) (2,155) (485) 79 0.55 70 0.53 15.98 10.0635 High Yield Muni (124) 1,147 1,147 9,129 76 0.52 61 0.46 (1.34) 2.41
©2015 Morningstar, Inc. All Rights Reserved. For institutional use only. The information contained herein: (1) is proprietary to Morningstar and/or its content providers; (2) may not be copied or distributed; and (3) is not warranted to be accurate, complete or timely.Neither Morningstar norits content providers are responsible for any damages or losses arising from any use of this information. Past performance is no guarantee of future results. ß
®
Morningstar DirectSM | Publishing Date: 2015-03-11 Page 2 of 6
Fund Flows
Monthly Market Summary: US Open-end & ETF ex MM ex FoF Effective Date
02-28-2015Including merged and liquidated funds
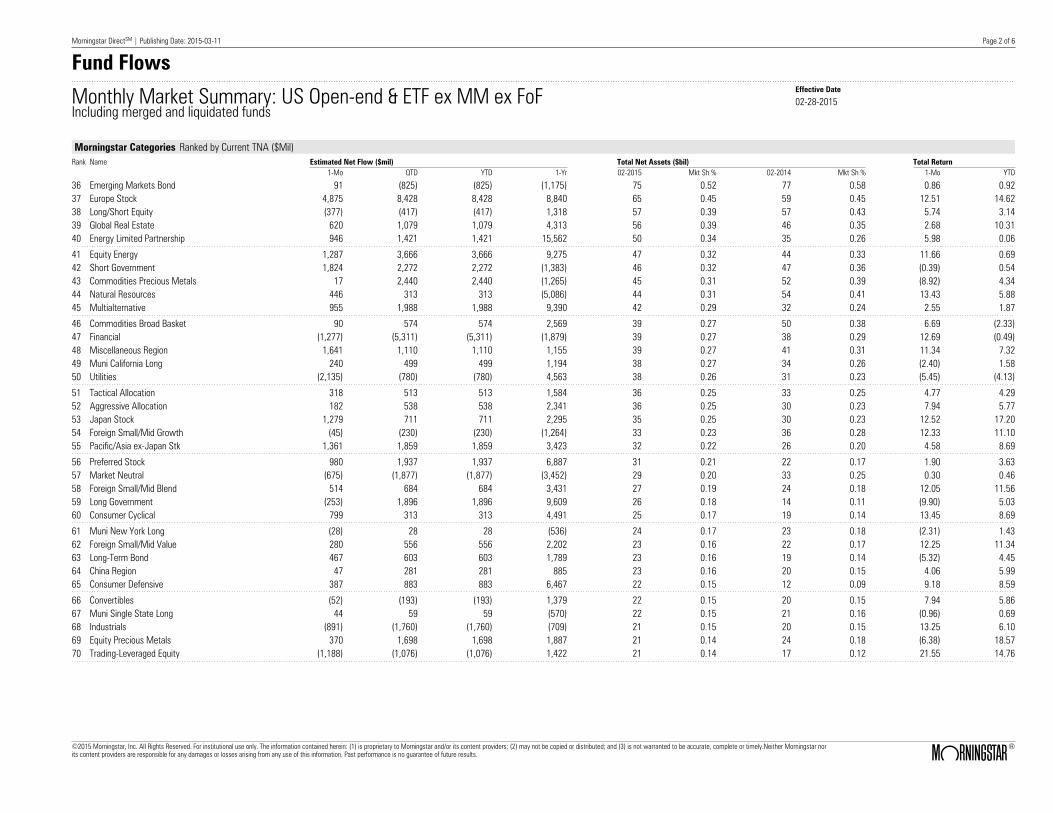
Morningstar Categories Ranked by Current TNA ($Mil)Rank Name Estimated Net Flow ($mil) Total Net Assets ($bil) Total Return
1-Mo QTD YTD 1-Yr 02-2015 Mkt Sh % 02-2014 Mkt Sh % 1-Mo YTD
36 Emerging Markets Bond 91 (825) (825) (1,175) 75 0.52 77 0.58 0.86 0.9237 Europe Stock 4,875 8,428 8,428 8,840 65 0.45 59 0.45 12.51 14.6238 Long/Short Equity (377) (417) (417) 1,318 57 0.39 57 0.43 5.74 3.1439 Global Real Estate 620 1,079 1,079 4,313 56 0.39 46 0.35 2.68 10.3140 Energy Limited Partnership 946 1,421 1,421 15,562 50 0.34 35 0.26 5.98 0.06
41 Equity Energy 1,287 3,666 3,666 9,275 47 0.32 44 0.33 11.66 0.6942 Short Government 1,824 2,272 2,272 (1,383) 46 0.32 47 0.36 (0.39) 0.5443 Commodities Precious Metals 17 2,440 2,440 (1,265) 45 0.31 52 0.39 (8.92) 4.3444 Natural Resources 446 313 313 (5,086) 44 0.31 54 0.41 13.43 5.8845 Multialternative 955 1,988 1,988 9,390 42 0.29 32 0.24 2.55 1.87
46 Commodities Broad Basket 90 574 574 2,569 39 0.27 50 0.38 6.69 (2.33)47 Financial (1,277) (5,311) (5,311) (1,879) 39 0.27 38 0.29 12.69 (0.49)48 Miscellaneous Region 1,641 1,110 1,110 1,155 39 0.27 41 0.31 11.34 7.3249 Muni California Long 240 499 499 1,194 38 0.27 34 0.26 (2.40) 1.5850 Utilities (2,135) (780) (780) 4,563 38 0.26 31 0.23 (5.45) (4.13)
51 Tactical Allocation 318 513 513 1,584 36 0.25 33 0.25 4.77 4.2952 Aggressive Allocation 182 538 538 2,341 36 0.25 30 0.23 7.94 5.7753 Japan Stock 1,279 711 711 2,295 35 0.25 30 0.23 12.52 17.2054 Foreign Small/Mid Growth (45) (230) (230) (1,264) 33 0.23 36 0.28 12.33 11.1055 Pacific/Asia ex-Japan Stk 1,361 1,859 1,859 3,423 32 0.22 26 0.20 4.58 8.69
56 Preferred Stock 980 1,937 1,937 6,887 31 0.21 22 0.17 1.90 3.6357 Market Neutral (675) (1,877) (1,877) (3,452) 29 0.20 33 0.25 0.30 0.4658 Foreign Small/Mid Blend 514 684 684 3,431 27 0.19 24 0.18 12.05 11.5659 Long Government (253) 1,896 1,896 9,609 26 0.18 14 0.11 (9.90) 5.0360 Consumer Cyclical 799 313 313 4,491 25 0.17 19 0.14 13.45 8.69
61 Muni New York Long (28) 28 28 (536) 24 0.17 23 0.18 (2.31) 1.4362 Foreign Small/Mid Value 280 556 556 2,202 23 0.16 22 0.17 12.25 11.3463 Long-Term Bond 467 603 603 1,789 23 0.16 19 0.14 (5.32) 4.4564 China Region 47 281 281 885 23 0.16 20 0.15 4.06 5.9965 Consumer Defensive 387 883 883 6,467 22 0.15 12 0.09 9.18 8.59
66 Convertibles (52) (193) (193) 1,379 22 0.15 20 0.15 7.94 5.8667 Muni Single State Long 44 59 59 (570) 22 0.15 21 0.16 (0.96) 0.6968 Industrials (891) (1,760) (1,760) (709) 21 0.15 20 0.15 13.25 6.1069 Equity Precious Metals 370 1,698 1,698 1,887 21 0.14 24 0.18 (6.38) 18.5770 Trading-Leveraged Equity (1,188) (1,076) (1,076) 1,422 21 0.14 17 0.12 21.55 14.76
©2015 Morningstar, Inc. All Rights Reserved. For institutional use only. The information contained herein: (1) is proprietary to Morningstar and/or its content providers; (2) may not be copied or distributed; and (3) is not warranted to be accurate, complete or timely.Neither Morningstar norits content providers are responsible for any damages or losses arising from any use of this information. Past performance is no guarantee of future results. ß
®
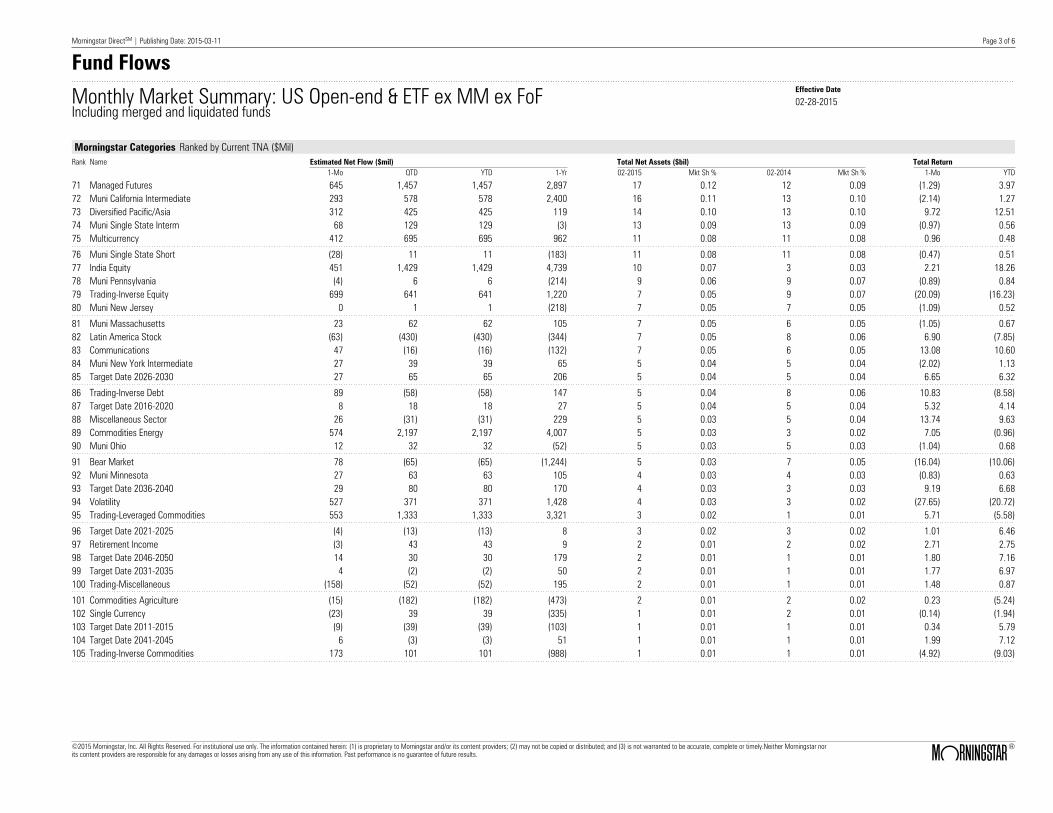
Morningstar DirectSM | Publishing Date: 2015-03-11 Page 3 of 6
Fund Flows
Monthly Market Summary: US Open-end & ETF ex MM ex FoF Effective Date
02-28-2015Including merged and liquidated funds
Morningstar Categories Ranked by Current TNA ($Mil)Rank Name Estimated Net Flow ($mil) Total Net Assets ($bil) Total Return
1-Mo QTD YTD 1-Yr 02-2015 Mkt Sh % 02-2014 Mkt Sh % 1-Mo YTD
71 Managed Futures 645 1,457 1,457 2,897 17 0.12 12 0.09 (1.29) 3.9772 Muni California Intermediate 293 578 578 2,400 16 0.11 13 0.10 (2.14) 1.2773 Diversified Pacific/Asia 312 425 425 119 14 0.10 13 0.10 9.72 12.5174 Muni Single State Interm 68 129 129 (3) 13 0.09 13 0.09 (0.97) 0.5675 Multicurrency 412 695 695 962 11 0.08 11 0.08 0.96 0.48
76 Muni Single State Short (28) 11 11 (183) 11 0.08 11 0.08 (0.47) 0.5177 India Equity 451 1,429 1,429 4,739 10 0.07 3 0.03 2.21 18.2678 Muni Pennsylvania (4) 6 6 (214) 9 0.06 9 0.07 (0.89) 0.8479 Trading-Inverse Equity 699 641 641 1,220 7 0.05 9 0.07 (20.09) (16.23)80 Muni New Jersey 0 1 1 (218) 7 0.05 7 0.05 (1.09) 0.52
81 Muni Massachusetts 23 62 62 105 7 0.05 6 0.05 (1.05) 0.6782 Latin America Stock (63) (430) (430) (344) 7 0.05 8 0.06 6.90 (7.85)83 Communications 47 (16) (16) (132) 7 0.05 6 0.05 13.08 10.6084 Muni New York Intermediate 27 39 39 65 5 0.04 5 0.04 (2.02) 1.1385 Target Date 2026-2030 27 65 65 206 5 0.04 5 0.04 6.65 6.32
86 Trading-Inverse Debt 89 (58) (58) 147 5 0.04 8 0.06 10.83 (8.58)87 Target Date 2016-2020 8 18 18 27 5 0.04 5 0.04 5.32 4.1488 Miscellaneous Sector 26 (31) (31) 229 5 0.03 5 0.04 13.74 9.6389 Commodities Energy 574 2,197 2,197 4,007 5 0.03 3 0.02 7.05 (0.96)90 Muni Ohio 12 32 32 (52) 5 0.03 5 0.03 (1.04) 0.68
91 Bear Market 78 (65) (65) (1,244) 5 0.03 7 0.05 (16.04) (10.06)92 Muni Minnesota 27 63 63 105 4 0.03 4 0.03 (0.83) 0.6393 Target Date 2036-2040 29 80 80 170 4 0.03 3 0.03 9.19 6.6894 Volatility 527 371 371 1,428 4 0.03 3 0.02 (27.65) (20.72)95 Trading-Leveraged Commodities 553 1,333 1,333 3,321 3 0.02 1 0.01 5.71 (5.58)
96 Target Date 2021-2025 (4) (13) (13) 8 3 0.02 3 0.02 1.01 6.4697 Retirement Income (3) 43 43 9 2 0.01 2 0.02 2.71 2.7598 Target Date 2046-2050 14 30 30 179 2 0.01 1 0.01 1.80 7.1699 Target Date 2031-2035 4 (2) (2) 50 2 0.01 1 0.01 1.77 6.97100 Trading-Miscellaneous (158) (52) (52) 195 2 0.01 1 0.01 1.48 0.87
101 Commodities Agriculture (15) (182) (182) (473) 2 0.01 2 0.02 0.23 (5.24)102 Single Currency (23) 39 39 (335) 1 0.01 2 0.01 (0.14) (1.94)103 Target Date 2011-2015 (9) (39) (39) (103) 1 0.01 1 0.01 0.34 5.79104 Target Date 2041-2045 6 (3) (3) 51 1 0.01 1 0.01 1.99 7.12105 Trading-Inverse Commodities 173 101 101 (988) 1 0.01 1 0.01 (4.92) (9.03)
©2015 Morningstar, Inc. All Rights Reserved. For institutional use only. The information contained herein: (1) is proprietary to Morningstar and/or its content providers; (2) may not be copied or distributed; and (3) is not warranted to be accurate, complete or timely.Neither Morningstar norits content providers are responsible for any damages or losses arising from any use of this information. Past performance is no guarantee of future results. ß
®
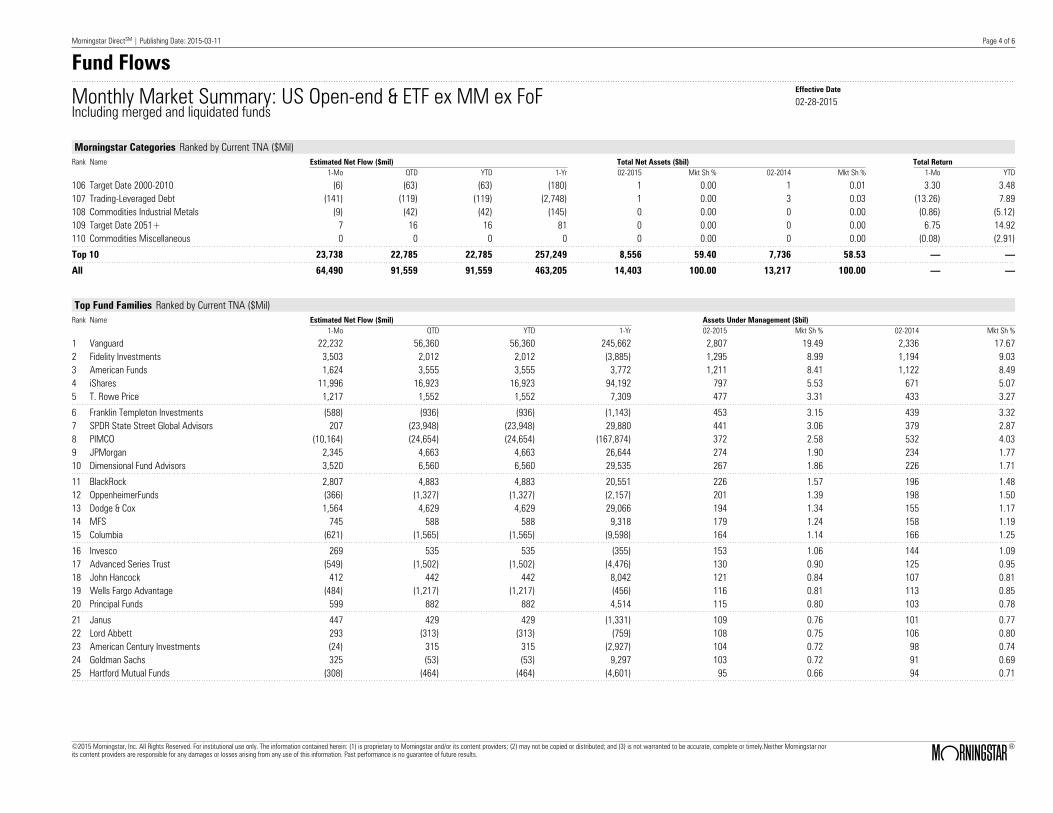
Morningstar DirectSM | Publishing Date: 2015-03-11 Page 4 of 6
Fund Flows
Monthly Market Summary: US Open-end & ETF ex MM ex FoF Effective Date
02-28-2015Including merged and liquidated funds
Morningstar Categories Ranked by Current TNA ($Mil)Rank Name Estimated Net Flow ($mil) Total Net Assets ($bil) Total Return
1-Mo QTD YTD 1-Yr 02-2015 Mkt Sh % 02-2014 Mkt Sh % 1-Mo YTD
106 Target Date 2000-2010 (6) (63) (63) (180) 1 0.00 1 0.01 3.30 3.48107 Trading-Leveraged Debt (141) (119) (119) (2,748) 1 0.00 3 0.03 (13.26) 7.89108 Commodities Industrial Metals (9) (42) (42) (145) 0 0.00 0 0.00 (0.86) (5.12)109 Target Date 2051+ 7 16 16 81 0 0.00 0 0.00 6.75 14.92110 Commodities Miscellaneous 0 0 0 0 0 0.00 0 0.00 (0.08) (2.91)
Top 10 23,738 22,785 22,785 257,249 8,556 59.40 7,736 58.53 — —
All 64,490 91,559 91,559 463,205 14,403 100.00 13,217 100.00 — —
Top Fund Families Ranked by Current TNA ($Mil)Rank Name Estimated Net Flow ($mil) Assets Under Management ($bil)
1-Mo QTD YTD 1-Yr 02-2015 Mkt Sh % 02-2014 Mkt Sh %
1 Vanguard 22,232 56,360 56,360 245,662 2,807 19.49 2,336 17.672 Fidelity Investments 3,503 2,012 2,012 (3,885) 1,295 8.99 1,194 9.033 American Funds 1,624 3,555 3,555 3,772 1,211 8.41 1,122 8.494 iShares 11,996 16,923 16,923 94,192 797 5.53 671 5.075 T. Rowe Price 1,217 1,552 1,552 7,309 477 3.31 433 3.27
6 Franklin Templeton Investments (588) (936) (936) (1,143) 453 3.15 439 3.327 SPDR State Street Global Advisors 207 (23,948) (23,948) 29,880 441 3.06 379 2.878 PIMCO (10,164) (24,654) (24,654) (167,874) 372 2.58 532 4.039 JPMorgan 2,345 4,663 4,663 26,644 274 1.90 234 1.7710 Dimensional Fund Advisors 3,520 6,560 6,560 29,535 267 1.86 226 1.71
11 BlackRock 2,807 4,883 4,883 20,551 226 1.57 196 1.4812 OppenheimerFunds (366) (1,327) (1,327) (2,157) 201 1.39 198 1.5013 Dodge & Cox 1,564 4,629 4,629 29,066 194 1.34 155 1.1714 MFS 745 588 588 9,318 179 1.24 158 1.1915 Columbia (621) (1,565) (1,565) (9,598) 164 1.14 166 1.25
16 Invesco 269 535 535 (355) 153 1.06 144 1.0917 Advanced Series Trust (549) (1,502) (1,502) (4,476) 130 0.90 125 0.9518 John Hancock 412 442 442 8,042 121 0.84 107 0.8119 Wells Fargo Advantage (484) (1,217) (1,217) (456) 116 0.81 113 0.8520 Principal Funds 599 882 882 4,514 115 0.80 103 0.78
21 Janus 447 429 429 (1,331) 109 0.76 101 0.7722 Lord Abbett 293 (313) (313) (759) 108 0.75 106 0.8023 American Century Investments (24) 315 315 (2,927) 104 0.72 98 0.7424 Goldman Sachs 325 (53) (53) 9,297 103 0.72 91 0.6925 Hartford Mutual Funds (308) (464) (464) (4,601) 95 0.66 94 0.71
©2015 Morningstar, Inc. All Rights Reserved. For institutional use only. The information contained herein: (1) is proprietary to Morningstar and/or its content providers; (2) may not be copied or distributed; and (3) is not warranted to be accurate, complete or timely.Neither Morningstar norits content providers are responsible for any damages or losses arising from any use of this information. Past performance is no guarantee of future results. ß
®

Morningstar DirectSM | Publishing Date: 2015-03-11 Page 5 of 6
Fund Flows
Monthly Market Summary: US Open-end & ETF ex MM ex FoF Effective Date
02-28-2015Including merged and liquidated funds
Top Fund Families Ranked by Current TNA ($Mil)Rank Name Estimated Net Flow ($mil) Assets Under Management ($bil)
1-Mo QTD YTD 1-Yr 02-2015 Mkt Sh % 02-2014 Mkt Sh %
26 Legg Mason 1,024 2,528 2,528 10,102 94 0.65 78 0.5927 Voya (250) (1,022) (1,022) (6,687) 93 0.64 92 0.6928 PowerShares 1,588 (397) (397) (9,535) 92 0.64 91 0.6929 SEI 372 755 755 3,519 87 0.60 78 0.5930 TIAA-CREF Mutual Funds 866 1,445 1,445 7,687 86 0.60 72 0.55
31 Harbor (284) (623) (623) (2,997) 86 0.59 87 0.6632 Oakmark (178) (462) (462) 4,603 84 0.59 76 0.5833 GMO 230 (709) (709) (318) 79 0.55 76 0.5734 Putnam 199 344 344 4,637 78 0.54 69 0.5235 Prudential Investments 1,089 2,081 2,081 5,987 78 0.54 68 0.52
36 First Eagle (247) (812) (812) 793 76 0.53 73 0.5537 MainStay (1,067) (2,221) (2,221) (11,201) 75 0.52 84 0.6438 Eaton Vance (283) (1,112) (1,112) (9,217) 72 0.50 79 0.6039 Metropolitan West Funds 4,268 9,482 9,482 33,989 70 0.48 34 0.2640 Ivy Funds (970) (1,671) (1,671) (7,040) 67 0.46 75 0.57
41 Federated 467 973 973 4,058 65 0.45 58 0.4442 Dreyfus 199 191 191 (931) 64 0.44 61 0.4643 Nuveen 160 866 866 5,452 62 0.43 54 0.4144 Natixis Funds 978 2,485 2,485 8,747 62 0.43 51 0.3945 AllianceBernstein 146 311 311 3,760 62 0.43 57 0.43
46 USAA 302 594 594 2,421 58 0.40 52 0.3947 Thornburg (819) (1,481) (1,481) (10,285) 54 0.37 63 0.4848 DoubleLine 1,607 4,688 4,688 15,048 53 0.37 36 0.2749 Northern Funds 469 1,108 1,108 1,733 52 0.36 49 0.3750 Deutsche Asset & Wealth Mngt 260 331 331 (4) 51 0.35 48 0.36
Top 10 35,892 42,087 42,087 264,092 8,395 58.28 7,565 57.24
Top 50 51,125 66,020 66,020 372,542 12,309 85.46 11,179 84.59
Other 13,365 26,029 26,029 92,851 2,094 14.54 1,973 14.93
All 64,490 92,049 92,049 465,393 14,403 100.00 13,152 99.51
©2015 Morningstar, Inc. All Rights Reserved. For institutional use only. The information contained herein: (1) is proprietary to Morningstar and/or its content providers; (2) may not be copied or distributed; and (3) is not warranted to be accurate, complete or timely.Neither Morningstar norits content providers are responsible for any damages or losses arising from any use of this information. Past performance is no guarantee of future results. ß
®
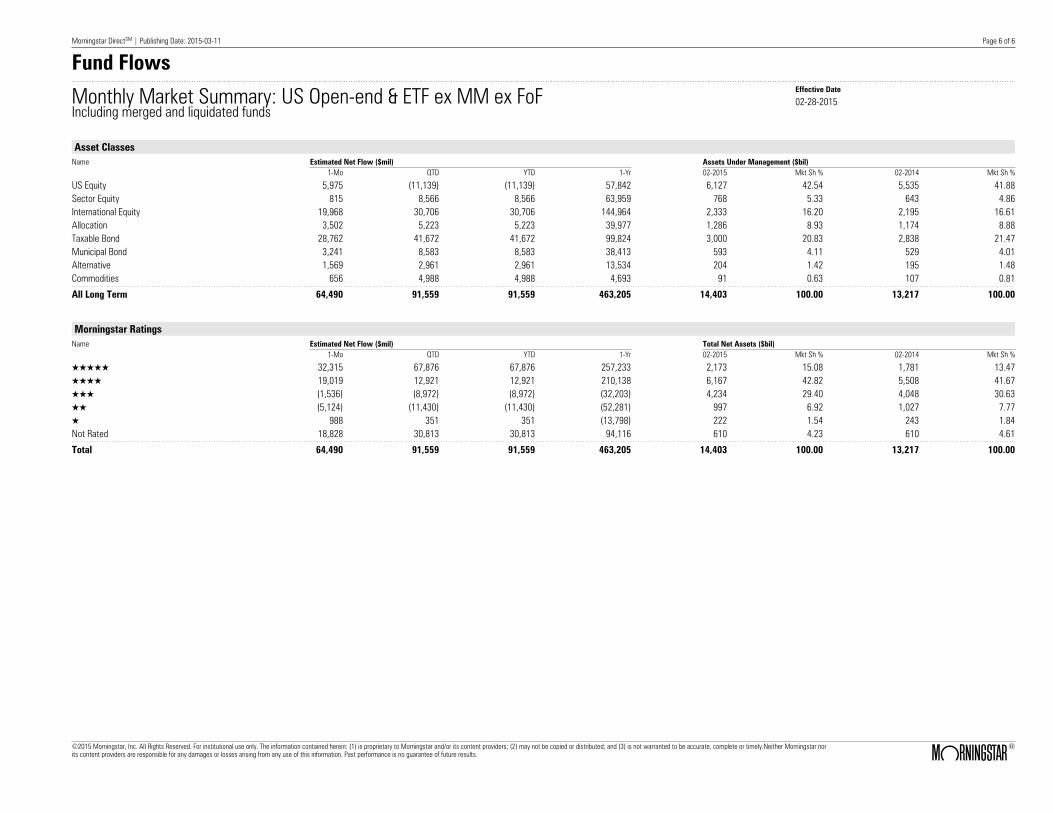
Morningstar DirectSM | Publishing Date: 2015-03-11 Page 6 of 6
Fund Flows
Monthly Market Summary: US Open-end & ETF ex MM ex FoF Effective Date
02-28-2015Including merged and liquidated funds
Asset ClassesName Estimated Net Flow ($mil) Assets Under Management ($bil)
1-Mo QTD YTD 1-Yr 02-2015 Mkt Sh % 02-2014 Mkt Sh %
US Equity 5,975 (11,139) (11,139) 57,842 6,127 42.54 5,535 41.88Sector Equity 815 8,566 8,566 63,959 768 5.33 643 4.86International Equity 19,968 30,706 30,706 144,964 2,333 16.20 2,195 16.61Allocation 3,502 5,223 5,223 39,977 1,286 8.93 1,174 8.88Taxable Bond 28,762 41,672 41,672 99,824 3,000 20.83 2,838 21.47Municipal Bond 3,241 8,583 8,583 38,413 593 4.11 529 4.01Alternative 1,569 2,961 2,961 13,534 204 1.42 195 1.48Commodities 656 4,988 4,988 4,693 91 0.63 107 0.81
All Long Term 64,490 91,559 91,559 463,205 14,403 100.00 13,217 100.00
Morningstar RatingsName Estimated Net Flow ($mil) Total Net Assets ($bil)
1-Mo QTD YTD 1-Yr 02-2015 Mkt Sh % 02-2014 Mkt Sh %
QQQQQ 32,315 67,876 67,876 257,233 2,173 15.08 1,781 13.47QQQQ 19,019 12,921 12,921 210,138 6,167 42.82 5,508 41.67QQQ (1,536) (8,972) (8,972) (32,203) 4,234 29.40 4,048 30.63QQ (5,124) (11,430) (11,430) (52,281) 997 6.92 1,027 7.77Q 988 351 351 (13,798) 222 1.54 243 1.84Not Rated 18,828 30,813 30,813 94,116 610 4.23 610 4.61
Total 64,490 91,559 91,559 463,205 14,403 100.00 13,217 100.00
©2015 Morningstar, Inc. All Rights Reserved. For institutional use only. The information contained herein: (1) is proprietary to Morningstar and/or its content providers; (2) may not be copied or distributed; and (3) is not warranted to be accurate, complete or timely.Neither Morningstar norits content providers are responsible for any damages or losses arising from any use of this information. Past performance is no guarantee of future results. ß
®