monthly temperature summary
TRANSCRIPT
August 2021 Tennessee State Climate Summary
1
August 2021 Tennessee State Climate Summary Tennessee Climate Office * East Tennessee State University
Prepared by William Tollefson and Dr. Andrew Joyner With contributions by Climate Data Representatives across the state
Monthly Temperature Summary:
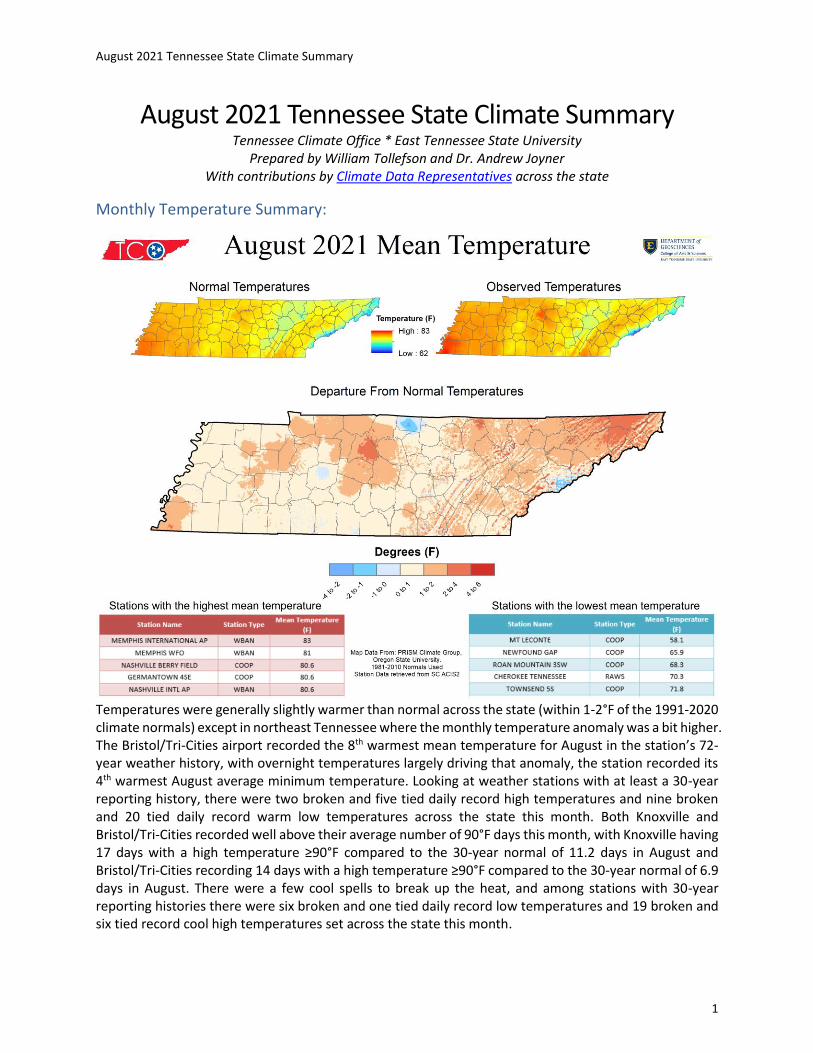
Temperatures were generally slightly warmer than normal across the state (within 1-2°F of the 1991-2020 climate normals) except in northeast Tennessee where the monthly temperature anomaly was a bit higher. The Bristol/Tri-Cities airport recorded the 8th warmest mean temperature for August in the station’s 72-year weather history, with overnight temperatures largely driving that anomaly, the station recorded its 4th warmest August average minimum temperature. Looking at weather stations with at least a 30-year reporting history, there were two broken and five tied daily record high temperatures and nine broken and 20 tied daily record warm low temperatures across the state this month. Both Knoxville and Bristol/Tri-Cities recorded well above their average number of 90°F days this month, with Knoxville having 17 days with a high temperature ≥90°F compared to the 30-year normal of 11.2 days in August and Bristol/Tri-Cities recording 14 days with a high temperature ≥90°F compared to the 30-year normal of 6.9 days in August. There were a few cool spells to break up the heat, and among stations with 30-year reporting histories there were six broken and one tied daily record low temperatures and 19 broken and six tied record cool high temperatures set across the state this month.
August 2021 Tennessee State Climate Summary
2
Monthly Precipitation Summary:
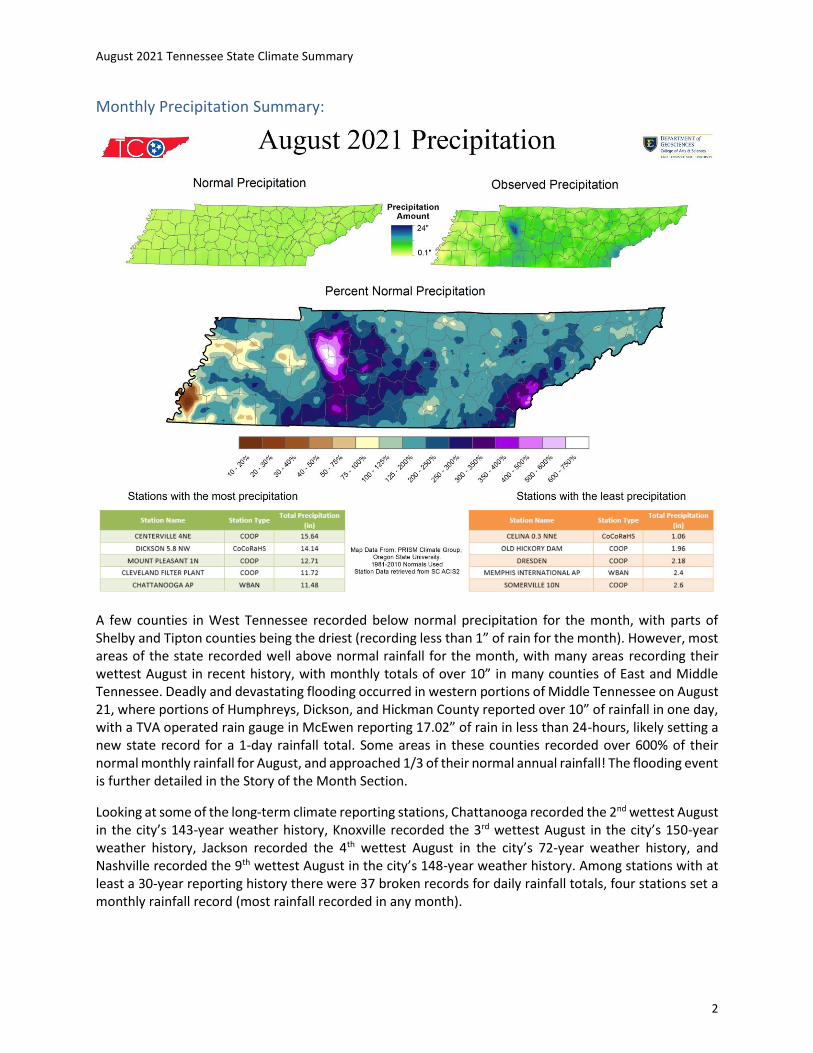
A few counties in West Tennessee recorded below normal precipitation for the month, with parts of Shelby and Tipton counties being the driest (recording less than 1” of rain for the month). However, most areas of the state recorded well above normal rainfall for the month, with many areas recording their wettest August in recent history, with monthly totals of over 10” in many counties of East and Middle Tennessee. Deadly and devastating flooding occurred in western portions of Middle Tennessee on August 21, where portions of Humphreys, Dickson, and Hickman County reported over 10” of rainfall in one day, with a TVA operated rain gauge in McEwen reporting 17.02” of rain in less than 24-hours, likely setting a new state record for a 1-day rainfall total. Some areas in these counties recorded over 600% of their normal monthly rainfall for August, and approached 1/3 of their normal annual rainfall! The flooding event is further detailed in the Story of the Month Section.
Looking at some of the long-term climate reporting stations, Chattanooga recorded the 2nd wettest August in the city’s 143-year weather history, Knoxville recorded the 3rd wettest August in the city’s 150-year weather history, Jackson recorded the 4th wettest August in the city’s 72-year weather history, and Nashville recorded the 9th wettest August in the city’s 148-year weather history. Among stations with at least a 30-year reporting history there were 37 broken records for daily rainfall totals, four stations set a monthly rainfall record (most rainfall recorded in any month).
August 2021 Tennessee State Climate Summary
3
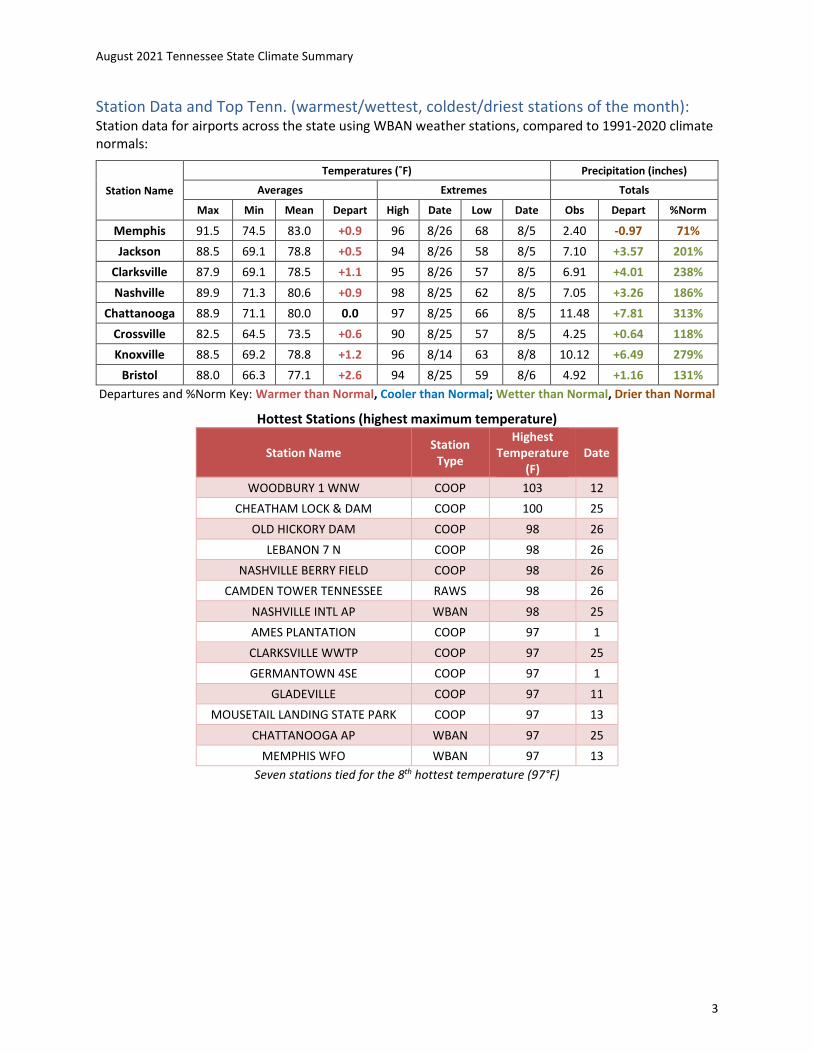
Station Data and Top Tenn. (warmest/wettest, coldest/driest stations of the month): Station data for airports across the state using WBAN weather stations, compared to 1991-2020 climate normals:
Station Name
Temperatures (˚F) Precipitation (inches)
Averages Extremes Totals
Max Min Mean Depart High Date Low Date Obs Depart %Norm
Memphis 91.5 74.5 83.0 +0.9 96 8/26 68 8/5 2.40 -0.97 71%
Jackson 88.5 69.1 78.8 +0.5 94 8/26 58 8/5 7.10 +3.57 201%
Clarksville 87.9 69.1 78.5 +1.1 95 8/26 57 8/5 6.91 +4.01 238%
Nashville 89.9 71.3 80.6 +0.9 98 8/25 62 8/5 7.05 +3.26 186%
Chattanooga 88.9 71.1 80.0 0.0 97 8/25 66 8/5 11.48 +7.81 313%
Crossville 82.5 64.5 73.5 +0.6 90 8/25 57 8/5 4.25 +0.64 118%
Knoxville 88.5 69.2 78.8 +1.2 96 8/14 63 8/8 10.12 +6.49 279%
Bristol 88.0 66.3 77.1 +2.6 94 8/25 59 8/6 4.92 +1.16 131%
Departures and %Norm Key: Warmer than Normal, Cooler than Normal; Wetter than Normal, Drier than Normal
Hottest Stations (highest maximum temperature)
Station Name Station
Type
Highest Temperature
(F) Date
WOODBURY 1 WNW COOP 103 12
CHEATHAM LOCK & DAM COOP 100 25
OLD HICKORY DAM COOP 98 26
LEBANON 7 N COOP 98 26
NASHVILLE BERRY FIELD COOP 98 26
CAMDEN TOWER TENNESSEE RAWS 98 26
NASHVILLE INTL AP WBAN 98 25
AMES PLANTATION COOP 97 1
CLARKSVILLE WWTP COOP 97 25
GERMANTOWN 4SE COOP 97 1
GLADEVILLE COOP 97 11
MOUSETAIL LANDING STATE PARK COOP 97 13
CHATTANOOGA AP WBAN 97 25
MEMPHIS WFO WBAN 97 13
Seven stations tied for the 8th hottest temperature (97°F)
August 2021 Tennessee State Climate Summary
4
Coldest Stations (lowest minimum temperature)
Station Name Station
Type Lowest
Temperature (F) Date
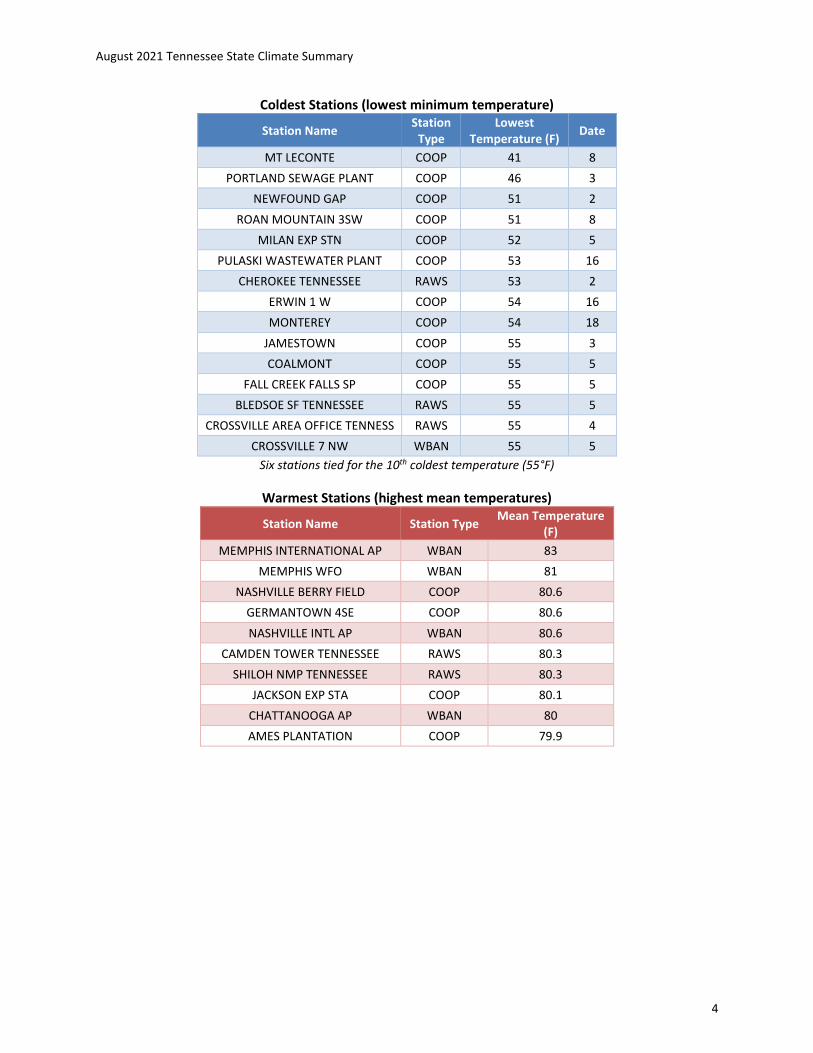
MT LECONTE COOP 41 8
PORTLAND SEWAGE PLANT COOP 46 3
NEWFOUND GAP COOP 51 2
ROAN MOUNTAIN 3SW COOP 51 8
MILAN EXP STN COOP 52 5
PULASKI WASTEWATER PLANT COOP 53 16
CHEROKEE TENNESSEE RAWS 53 2
ERWIN 1 W COOP 54 16
MONTEREY COOP 54 18
JAMESTOWN COOP 55 3
COALMONT COOP 55 5
FALL CREEK FALLS SP COOP 55 5
BLEDSOE SF TENNESSEE RAWS 55 5
CROSSVILLE AREA OFFICE TENNESS RAWS 55 4
CROSSVILLE 7 NW WBAN 55 5
Six stations tied for the 10th coldest temperature (55°F)
Warmest Stations (highest mean temperatures)
Station Name Station Type Mean Temperature
(F)
MEMPHIS INTERNATIONAL AP WBAN 83
MEMPHIS WFO WBAN 81
NASHVILLE BERRY FIELD COOP 80.6
GERMANTOWN 4SE COOP 80.6
NASHVILLE INTL AP WBAN 80.6
CAMDEN TOWER TENNESSEE RAWS 80.3
SHILOH NMP TENNESSEE RAWS 80.3
JACKSON EXP STA COOP 80.1
CHATTANOOGA AP WBAN 80
AMES PLANTATION COOP 79.9
August 2021 Tennessee State Climate Summary
5
Coolest Stations (lowest mean temperatures)
Station Name Station Type Mean Temperature
(F)
MT LECONTE COOP 58.1
NEWFOUND GAP COOP 65.9
ROAN MOUNTAIN 3SW COOP 68.3
CHEROKEE TENNESSEE RAWS 70.3
TOWNSEND 5S COOP 71.8
GATLINBURG 2 SW COOP 71.9
CROSSVILLE 7 NW WBAN 72.3
COALMONT COOP 72.7
PULASKI WASTEWATER PLANT COOP 73.1
CROSSVILLE MEMORIAL AP WBAN 73.5
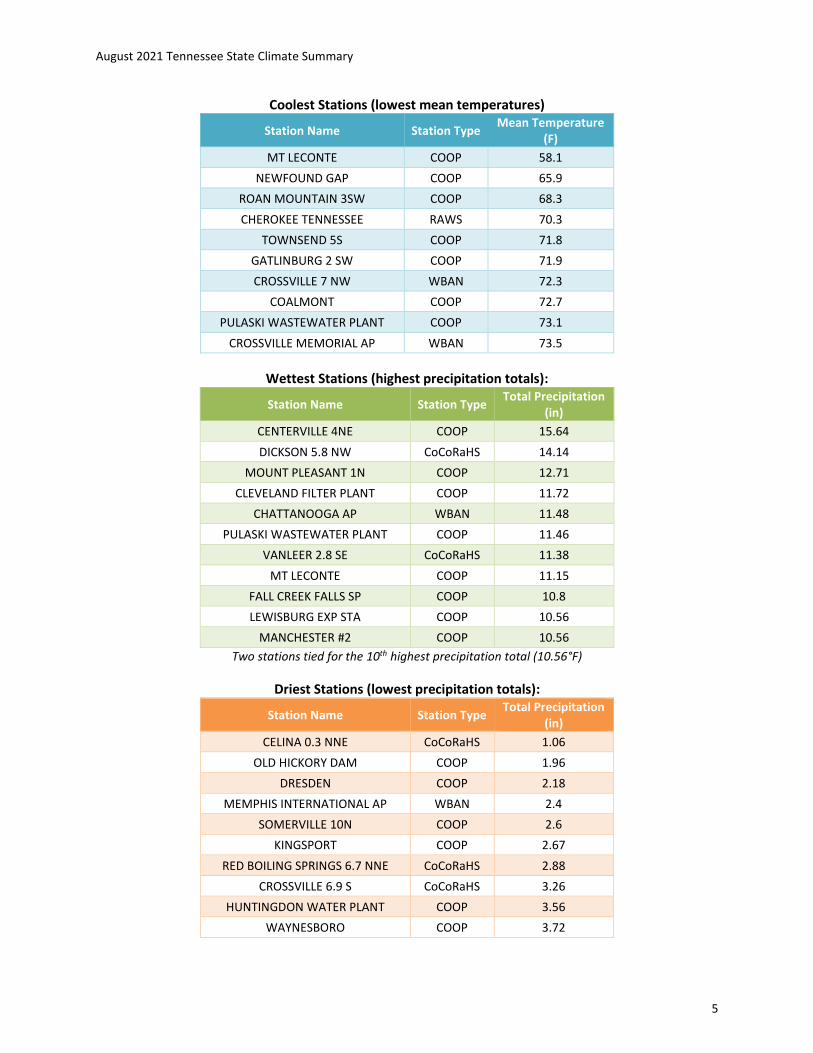
Wettest Stations (highest precipitation totals):
Station Name Station Type Total Precipitation
(in)
CENTERVILLE 4NE COOP 15.64
DICKSON 5.8 NW CoCoRaHS 14.14
MOUNT PLEASANT 1N COOP 12.71
CLEVELAND FILTER PLANT COOP 11.72
CHATTANOOGA AP WBAN 11.48
PULASKI WASTEWATER PLANT COOP 11.46
VANLEER 2.8 SE CoCoRaHS 11.38
MT LECONTE COOP 11.15
FALL CREEK FALLS SP COOP 10.8
LEWISBURG EXP STA COOP 10.56
MANCHESTER #2 COOP 10.56
Two stations tied for the 10th highest precipitation total (10.56°F)
Driest Stations (lowest precipitation totals):
Station Name Station Type Total Precipitation
(in)
CELINA 0.3 NNE CoCoRaHS 1.06
OLD HICKORY DAM COOP 1.96
DRESDEN COOP 2.18
MEMPHIS INTERNATIONAL AP WBAN 2.4
SOMERVILLE 10N COOP 2.6
KINGSPORT COOP 2.67
RED BOILING SPRINGS 6.7 NNE CoCoRaHS 2.88
CROSSVILLE 6.9 S CoCoRaHS 3.26
HUNTINGDON WATER PLANT COOP 3.56
WAYNESBORO COOP 3.72
August 2021 Tennessee State Climate Summary
6
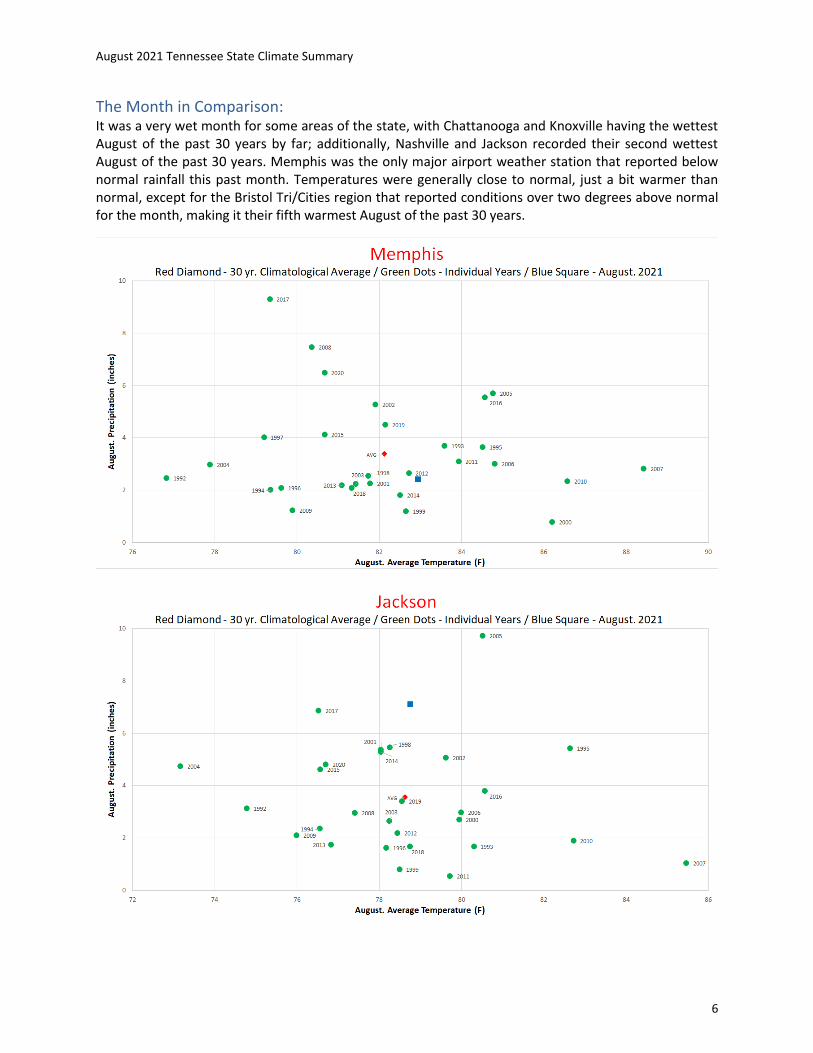
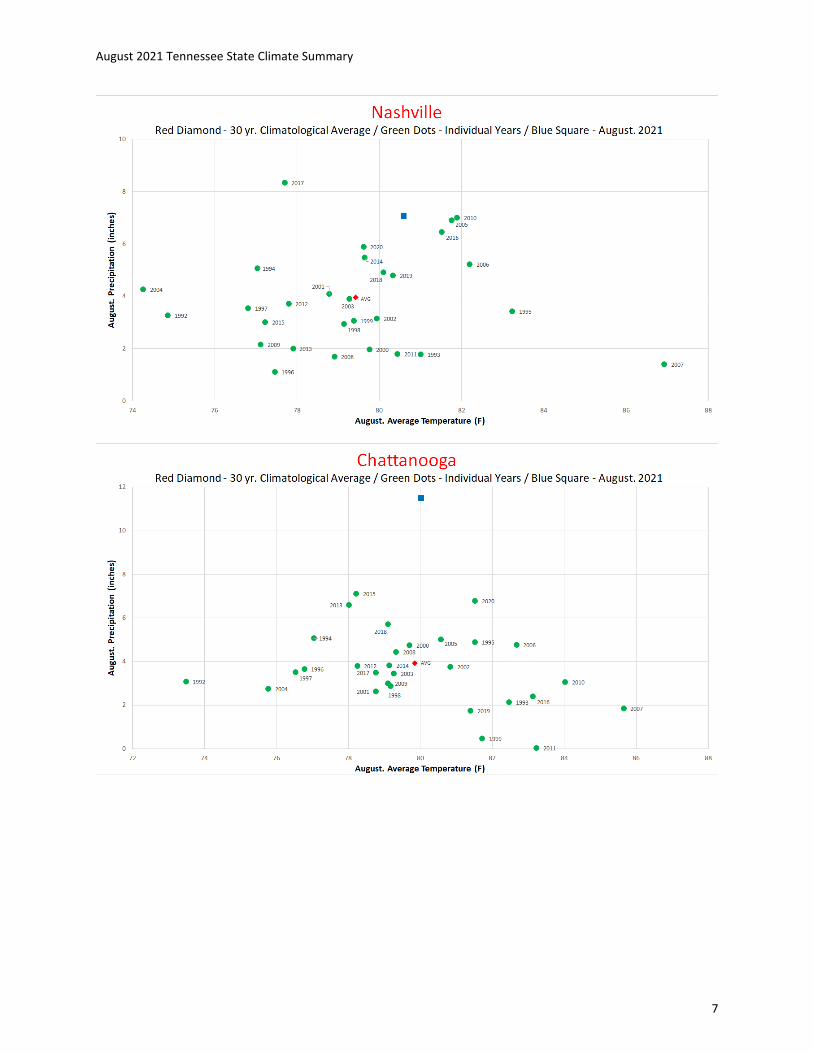
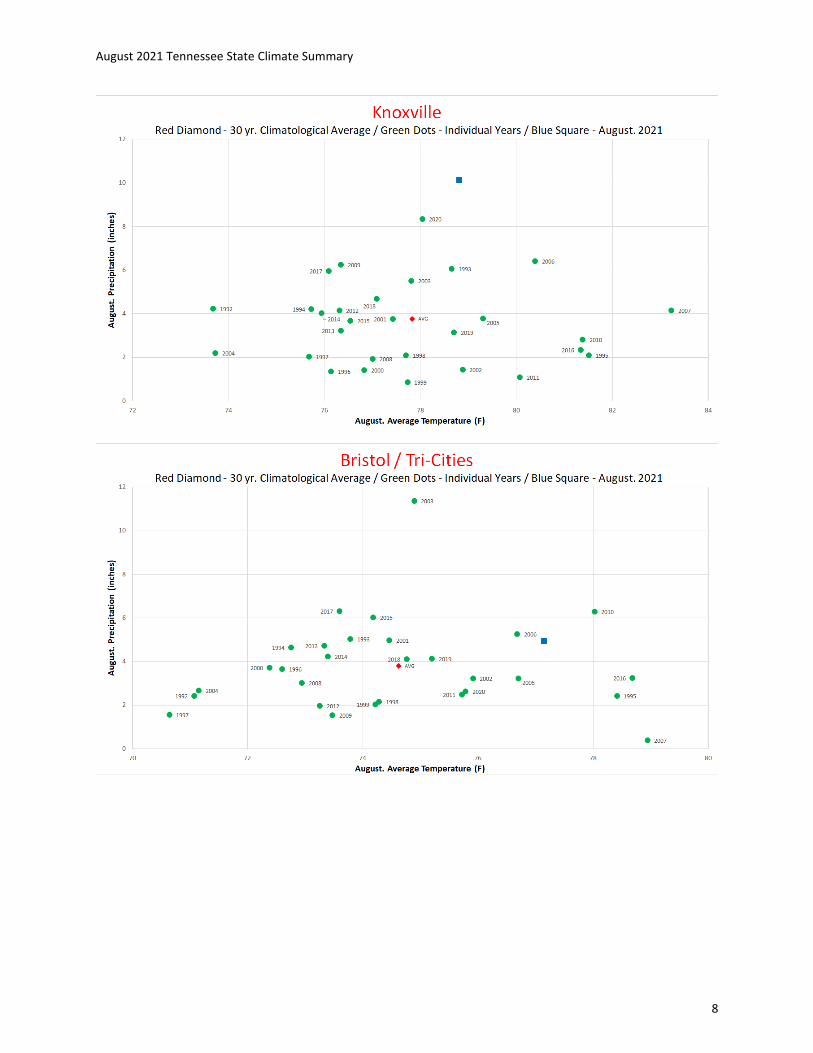
The Month in Comparison: It was a very wet month for some areas of the state, with Chattanooga and Knoxville having the wettest August of the past 30 years by far; additionally, Nashville and Jackson recorded their second wettest August of the past 30 years. Memphis was the only major airport weather station that reported below normal rainfall this past month. Temperatures were generally close to normal, just a bit warmer than normal, except for the Bristol Tri/Cities region that reported conditions over two degrees above normal for the month, making it their fifth warmest August of the past 30 years.
August 2021 Tennessee State Climate Summary
7
August 2021 Tennessee State Climate Summary
8
August 2021 Tennessee State Climate Summary
9
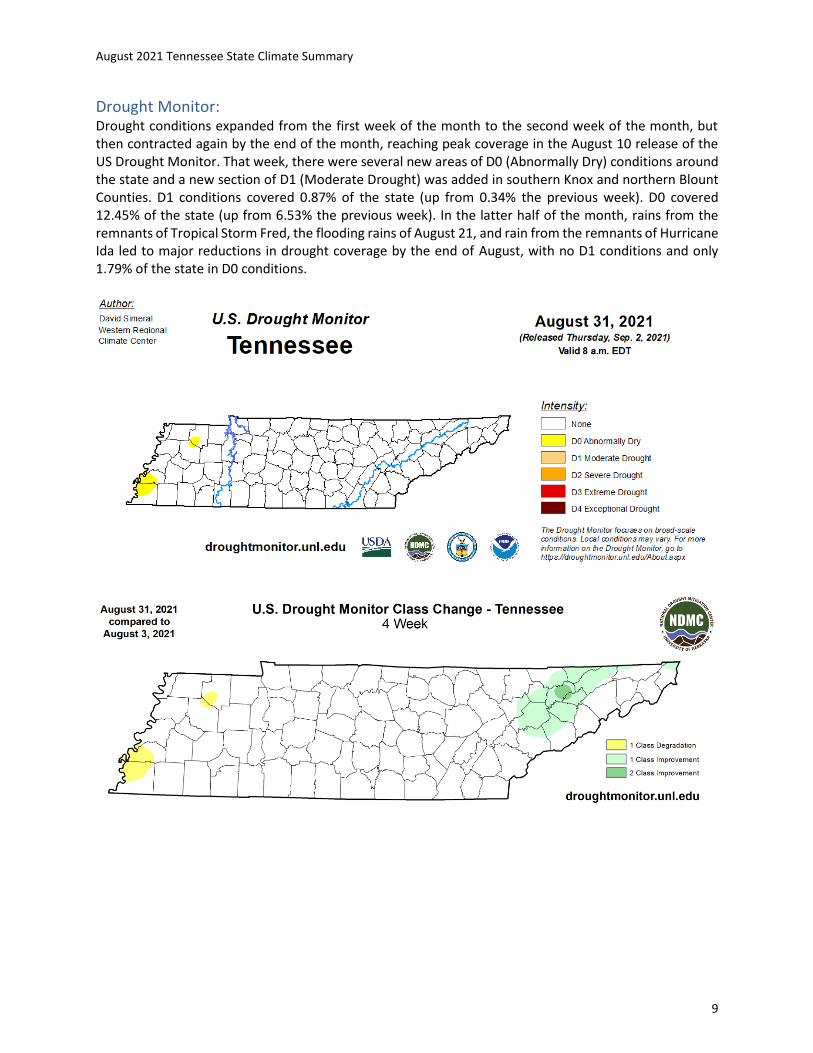
Drought Monitor: Drought conditions expanded from the first week of the month to the second week of the month, but then contracted again by the end of the month, reaching peak coverage in the August 10 release of the US Drought Monitor. That week, there were several new areas of D0 (Abnormally Dry) conditions around the state and a new section of D1 (Moderate Drought) was added in southern Knox and northern Blount Counties. D1 conditions covered 0.87% of the state (up from 0.34% the previous week). D0 covered 12.45% of the state (up from 6.53% the previous week). In the latter half of the month, rains from the remnants of Tropical Storm Fred, the flooding rains of August 21, and rain from the remnants of Hurricane Ida led to major reductions in drought coverage by the end of August, with no D1 conditions and only 1.79% of the state in D0 conditions.

August 2021 Tennessee State Climate Summary
10
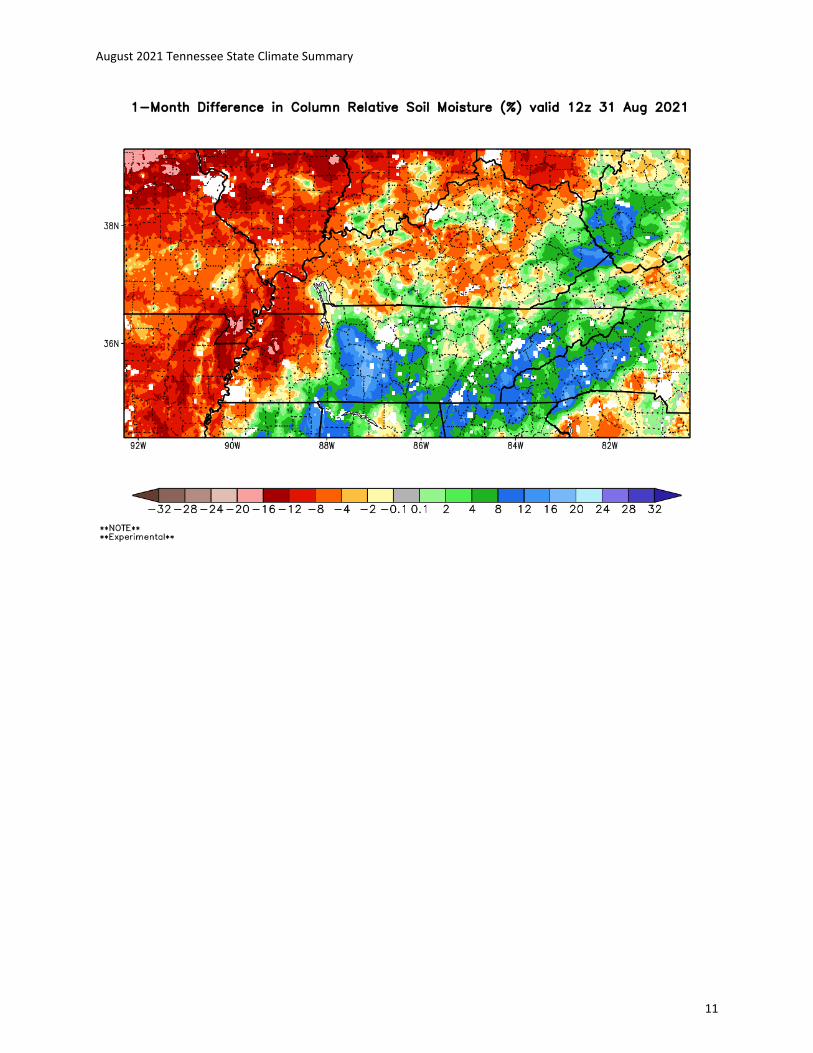
Soil Moisture: The USDA crop weather report released on August 30 reported that topsoil moisture was 3% very short, 17% short, 72% adequate and 8% surplus, and that subsoil moisture was 2% very short, 19% short, 71% adequate, and 8% surplus. However, the remnants of Hurricane Ida brought heavy rainfall to Middle and East Tennessee August 30-31, so soil moisture levels at the end of the month are likely higher than those reported on Monday (8/30). Soil moisture maps from the NASA SPoRT Land Information System show most of Tennessee with normal to above normal soil moisture percentiles, with some areas in the western portions of the state showing 0-200cm soil moisture percentiles in the below normal range (less than 30th percentile). During the month of August, soil moisture levels increased in most of Middle and East TN, while soil moisture levels decreased in most of West Tennessee.
August 2021 Tennessee State Climate Summary
11
August 2021 Tennessee State Climate Summary
12
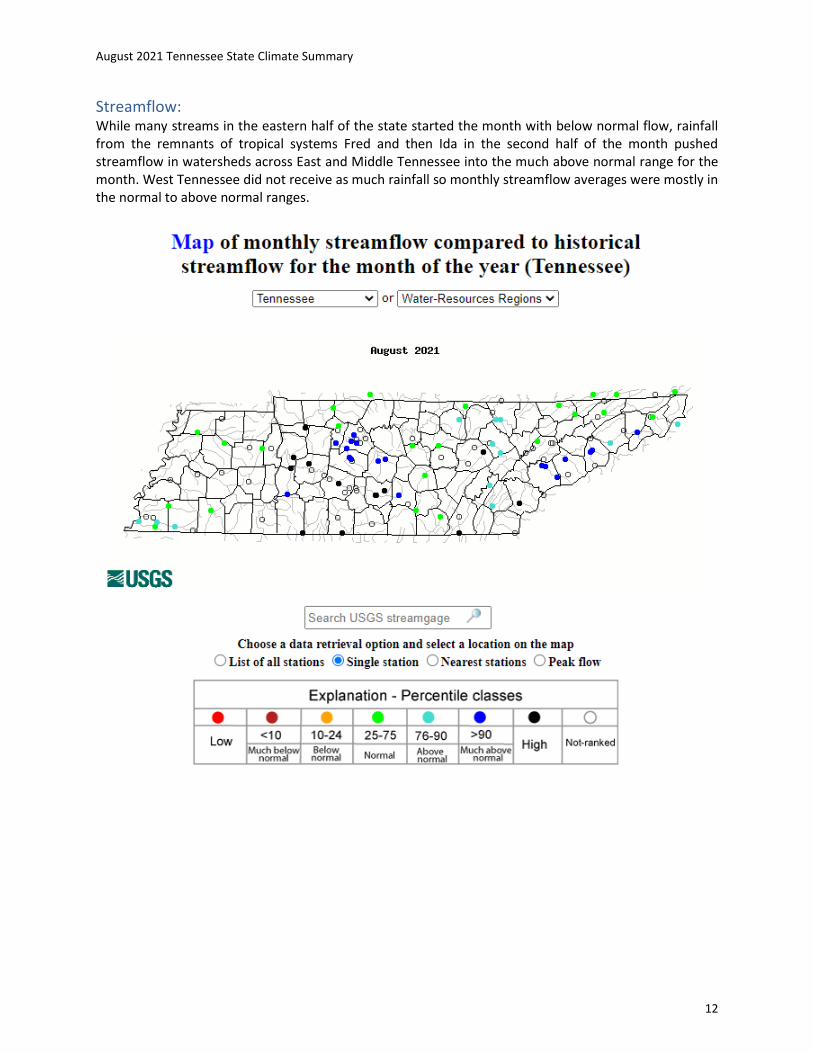
Streamflow: While many streams in the eastern half of the state started the month with below normal flow, rainfall from the remnants of tropical systems Fred and then Ida in the second half of the month pushed streamflow in watersheds across East and Middle Tennessee into the much above normal range for the month. West Tennessee did not receive as much rainfall so monthly streamflow averages were mostly in the normal to above normal ranges.
August 2021 Tennessee State Climate Summary
13
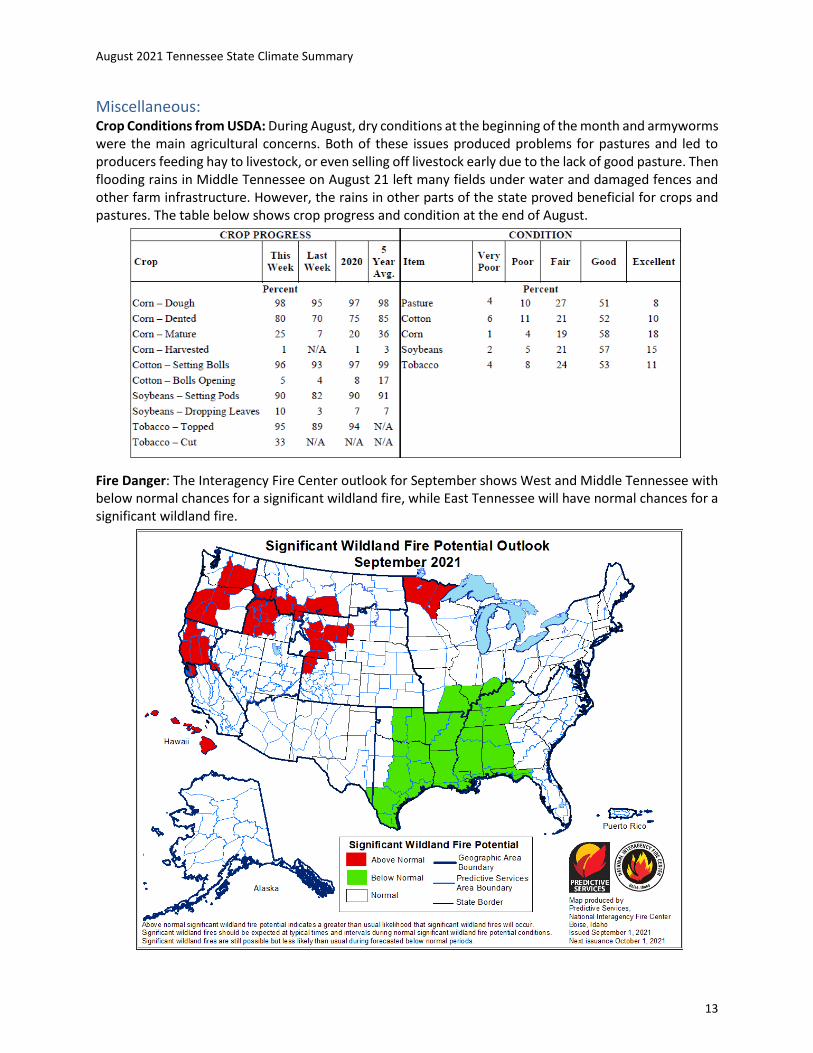
Miscellaneous: Crop Conditions from USDA: During August, dry conditions at the beginning of the month and armyworms were the main agricultural concerns. Both of these issues produced problems for pastures and led to producers feeding hay to livestock, or even selling off livestock early due to the lack of good pasture. Then flooding rains in Middle Tennessee on August 21 left many fields under water and damaged fences and other farm infrastructure. However, the rains in other parts of the state proved beneficial for crops and pastures. The table below shows crop progress and condition at the end of August.
Fire Danger: The Interagency Fire Center outlook for September shows West and Middle Tennessee with below normal chances for a significant wildland fire, while East Tennessee will have normal chances for a significant wildland fire.
August 2021 Tennessee State Climate Summary
14
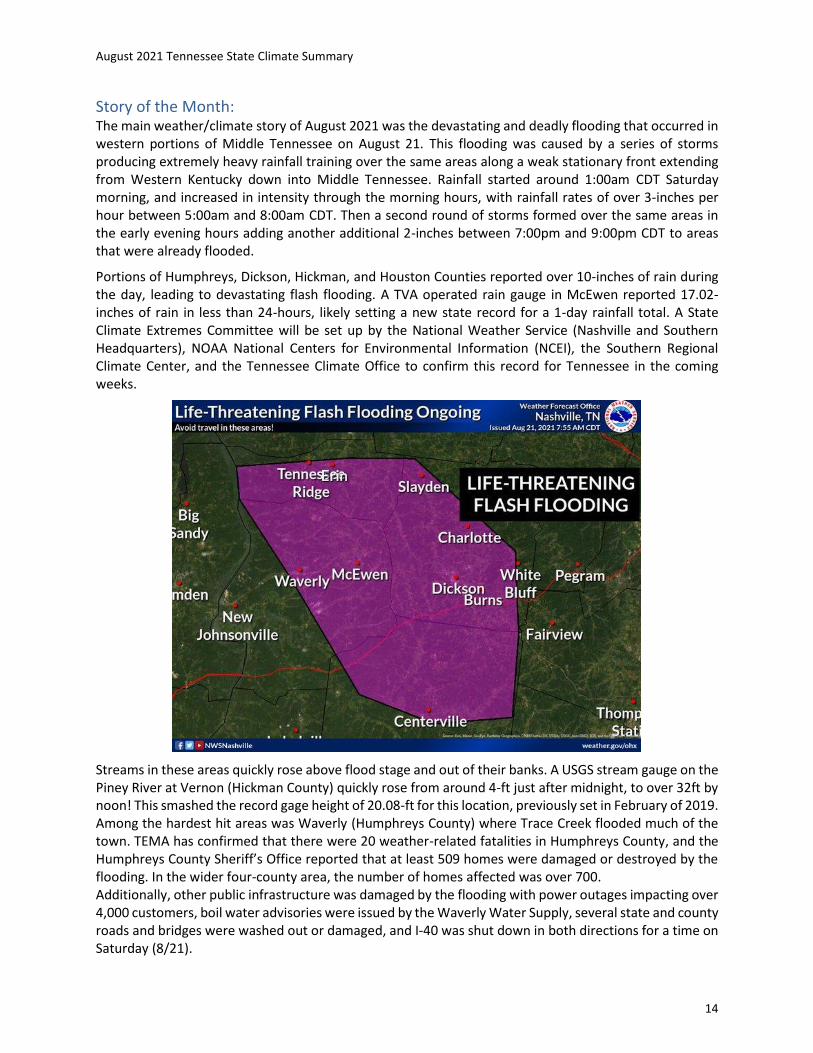
Story of the Month: The main weather/climate story of August 2021 was the devastating and deadly flooding that occurred in western portions of Middle Tennessee on August 21. This flooding was caused by a series of storms producing extremely heavy rainfall training over the same areas along a weak stationary front extending from Western Kentucky down into Middle Tennessee. Rainfall started around 1:00am CDT Saturday morning, and increased in intensity through the morning hours, with rainfall rates of over 3-inches per hour between 5:00am and 8:00am CDT. Then a second round of storms formed over the same areas in the early evening hours adding another additional 2-inches between 7:00pm and 9:00pm CDT to areas that were already flooded.
Portions of Humphreys, Dickson, Hickman, and Houston Counties reported over 10-inches of rain during the day, leading to devastating flash flooding. A TVA operated rain gauge in McEwen reported 17.02-inches of rain in less than 24-hours, likely setting a new state record for a 1-day rainfall total. A State Climate Extremes Committee will be set up by the National Weather Service (Nashville and Southern Headquarters), NOAA National Centers for Environmental Information (NCEI), the Southern Regional Climate Center, and the Tennessee Climate Office to confirm this record for Tennessee in the coming weeks.
Streams in these areas quickly rose above flood stage and out of their banks. A USGS stream gauge on the Piney River at Vernon (Hickman County) quickly rose from around 4-ft just after midnight, to over 32ft by noon! This smashed the record gage height of 20.08-ft for this location, previously set in February of 2019. Among the hardest hit areas was Waverly (Humphreys County) where Trace Creek flooded much of the town. TEMA has confirmed that there were 20 weather-related fatalities in Humphreys County, and the Humphreys County Sheriff’s Office reported that at least 509 homes were damaged or destroyed by the flooding. In the wider four-county area, the number of homes affected was over 700. Additionally, other public infrastructure was damaged by the flooding with power outages impacting over 4,000 customers, boil water advisories were issued by the Waverly Water Supply, several state and county roads and bridges were washed out or damaged, and I-40 was shut down in both directions for a time on Saturday (8/21).

August 2021 Tennessee State Climate Summary
15

August 2021 Tennessee State Climate Summary
16
August 2021 Tennessee State Climate Summary
17
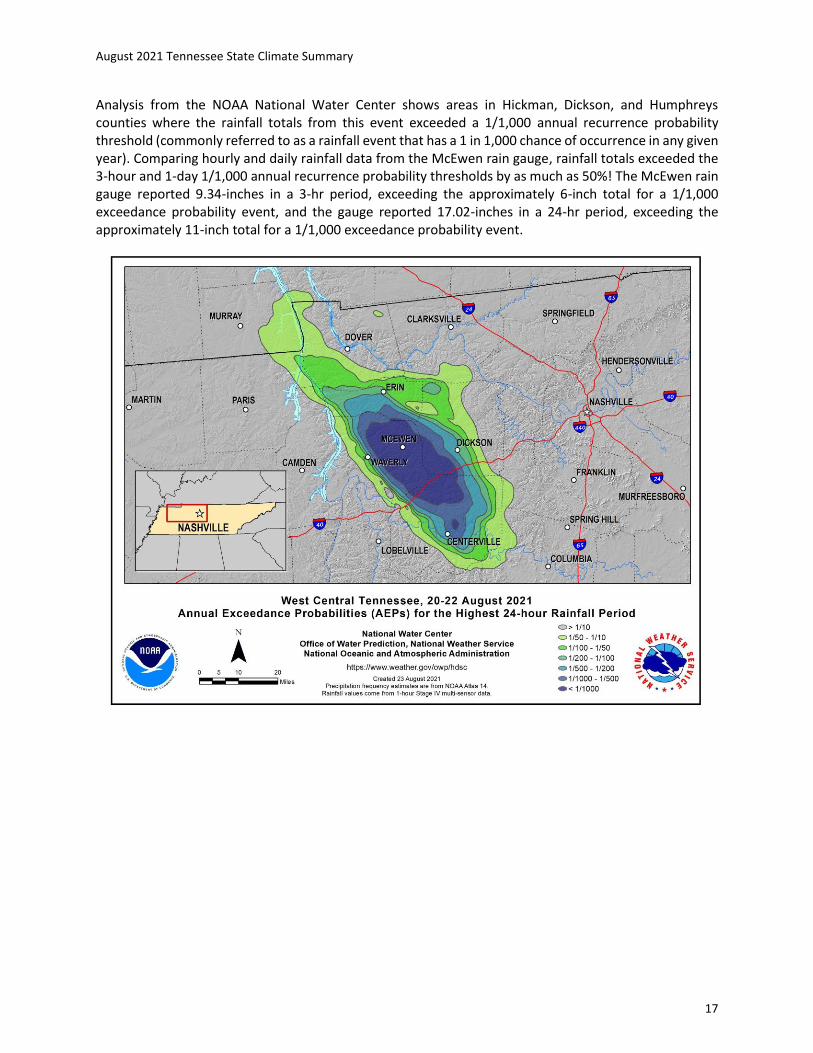
Analysis from the NOAA National Water Center shows areas in Hickman, Dickson, and Humphreys counties where the rainfall totals from this event exceeded a 1/1,000 annual recurrence probability threshold (commonly referred to as a rainfall event that has a 1 in 1,000 chance of occurrence in any given year). Comparing hourly and daily rainfall data from the McEwen rain gauge, rainfall totals exceeded the 3-hour and 1-day 1/1,000 annual recurrence probability thresholds by as much as 50%! The McEwen rain gauge reported 9.34-inches in a 3-hr period, exceeding the approximately 6-inch total for a 1/1,000 exceedance probability event, and the gauge reported 17.02-inches in a 24-hr period, exceeding the approximately 11-inch total for a 1/1,000 exceedance probability event.

August 2021 Tennessee State Climate Summary
18
Storm Reports: *Storm Reports are based on filtered NOAA Storm Prediction Center data or local NWS storm reports. Future quality control checks may change the official record of severe events, please see spc.noaa.gov for any updates.
There were eleven days in August with severe weather reports, with no tornadoes, 42 reports of severe wind damage, and 3 reports of hail 1-inch or larger in diameter.
August 7:
Wind:
Time (UTC)
Speed (mph)
Location County Lat Lon Comments
16:20 -- 5 S
MALONEYVILLE KNOX 36.01 -83.84
CORRECTS PREVIOUS TSTM WND DMG REPORT FROM 5 S
MALONEYVILLE. A FEW TREES DOWN. (MRX)
16:20 -- 1 SE
STRAWBERRY PLAINS
JEFFERSON 36.05 -83.68 A FEW TREES DOWN. (MRX)
19:57 -- 2 W
HARRISBURG SEVIER 35.86 -83.52 SEVERAL TREES DOWN. (MRX)
20:17 -- 4 NNE
GATLINBURG SEVIER 35.78 -83.47 A FEW TREES DOWN. (MRX)
Hail:
Time (UTC)
Size (in) Location County Lat Lon Comments
18:30 1.00 FALL BRANCH WASHINGTON 36.42 -82.62 (MRX)
20:35 1.00 4 SW CEDAR
CREEK COCKE 35.99 -82.96 (MRX)
August 2021 Tennessee State Climate Summary
19
August 9:
Wind:
Time (UTC)
Speed (mph)
Location County Lat Lon Comments
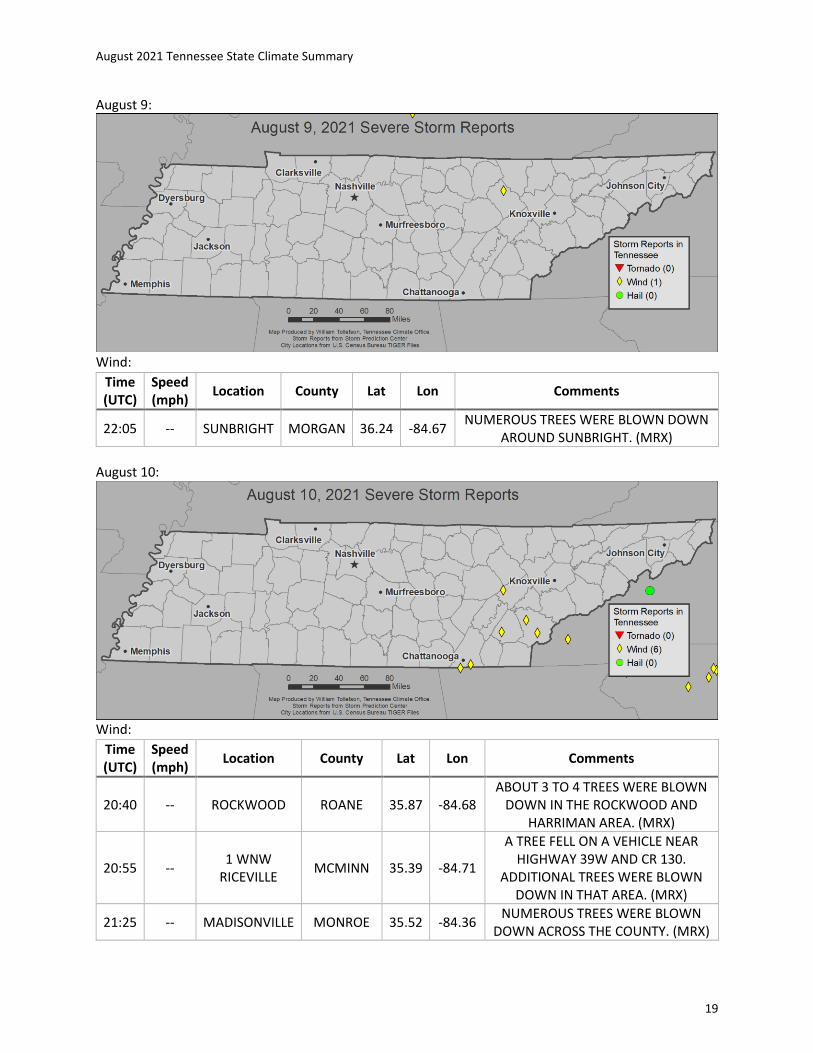
22:05 -- SUNBRIGHT MORGAN 36.24 -84.67 NUMEROUS TREES WERE BLOWN DOWN
AROUND SUNBRIGHT. (MRX)
August 10:
Wind:
Time (UTC)
Speed (mph)
Location County Lat Lon Comments
20:40 -- ROCKWOOD ROANE 35.87 -84.68 ABOUT 3 TO 4 TREES WERE BLOWN
DOWN IN THE ROCKWOOD AND HARRIMAN AREA. (MRX)
20:55 -- 1 WNW
RICEVILLE MCMINN 35.39 -84.71
A TREE FELL ON A VEHICLE NEAR HIGHWAY 39W AND CR 130.
ADDITIONAL TREES WERE BLOWN DOWN IN THAT AREA. (MRX)
21:25 -- MADISONVILLE MONROE 35.52 -84.36 NUMEROUS TREES WERE BLOWN
DOWN ACROSS THE COUNTY. (MRX)

August 2021 Tennessee State Climate Summary
20
Time (UTC)
Speed (mph)
Location County Lat Lon Comments
21:55 -- 5 E TELLICO
PLAINS MONROE 35.37 -84.21
SEVERAL TREES DOWN NEAR TELLICO PLAINS AND CITICO. (MRX)
22:33 -- 2 W EAST BRAINERD
HAMILTON 35.02 -85.15
REPORTS OF NUMEROUS TREES DOWN ACROSS SOUTHERN
PORTIONS OF THE COUNTY... EAST OF THE MAIN METRO AREA. TIME IS
ESTIMATED FROM RADAR. (MRX)
August 11:
Wind:
Time Speed (mph)
Location County Lat Lon Comments
20:15 -- 3 WSW
RUSSELLVILLE HAMBLEN 36.25 -83.25
SOCIAL MEDIA PHOTOS SHOWING A TREE BLOWN DOWN ON TWO
VEHICLES WITH NO INJURIES REPORTED. TIME IS ESTIMATED
FROM RADAR. (MRX)
20:55 -- CHARLESTON BRADLEY 35.29 -84.76
REPORTS OF 3 TO 4 TREES DOWN BLOCKING ROADWAYS IN AND
NEAR CHARLESTON. TIME IS ESTIMATED FROM RADAR. (MRX)
21:50 -- 3 WSW
ARCHVILLE POLK 35.12 -84.57
REPORTS OF TREES DOWN ACROSS THE PARKSVILLE
CAMPGROUND AREA. (MRX)
22:15 -- 8 W
DUCKTOWN POLK 35.04 -84.53
REPORT OF SEVERAL TREES DOWN IN THE PAST 20 MINUTES WITH TIME ESTIMATED FROM RADAR.
(MRX)
22:33 -- SEVIERVILLE SEVIER 35.89 -83.58 REPORT OF MULTIPLE TREES
DOWN WITH TIME ESTIMATED FROM RADAR. (MRX)

August 2021 Tennessee State Climate Summary
21
Time Speed (mph)
Location County Lat Lon Comments
23:00 -- GRAY WASHINGTON 36.41 -82.48
SOCIAL MEDIA PHOTO OF A SMALL... PARTIALLY OPEN
STRUCTURE DAMAGED NEAR GRAY ELEMENTARY SCHOOL.
(MRX)
Hail:
Time (UTC)
Size (in)
Location County Lat Lon Comments
0:16 100 3 N BELL BUCKLE
BEDFORD 35.63 -86.36 TSPOTTER REPORT OF QUARTER SIZE HAIL IN
BELL BUCKLE OFF OF LIBERTY PIKE AND BEECHWOOD ROAD. (OHX)
August 13:
Wind:
Time (UTC)
Speed (mph)
Location County Lat Lon Comments
18:10 -- 4 NNW
MURFREESBORO RUTHERFORD 35.91 -86.42
TREE DOWN AT SATINWOOD AND TWISTED OAK (OHX)
18:29 -- NOLENSVILLE WILLIAMSON 35.95 -86.65 MULTIPLE TREES DOWN IN THE
NOLENSVILLE AREA (OHX)
20:00 -- 5 SE DICKSON DICKSON 36.03 -87.31
SEVERAL TREES WERE BLOWN DOWN IN THE PORTER
COMMUNITY. A BARN WAS BLOWN DOWN. (OHX)
0:24 -- 2 SE BIRD CROSSING
SEVIER 35.89 -83.34 A FEW TREES DOWN. (MRX)
0:46 -- 3 NNW
NEWPORT COCKE 36 -83.2 MULTIPLE TREES DOWN. (MRX)
1:48 -- 1 NNE MOUNT
CARMEL HAWKINS 36.57 -82.65 MULTIPLE TREES DOWN. (MRX)
August 2021 Tennessee State Climate Summary
22
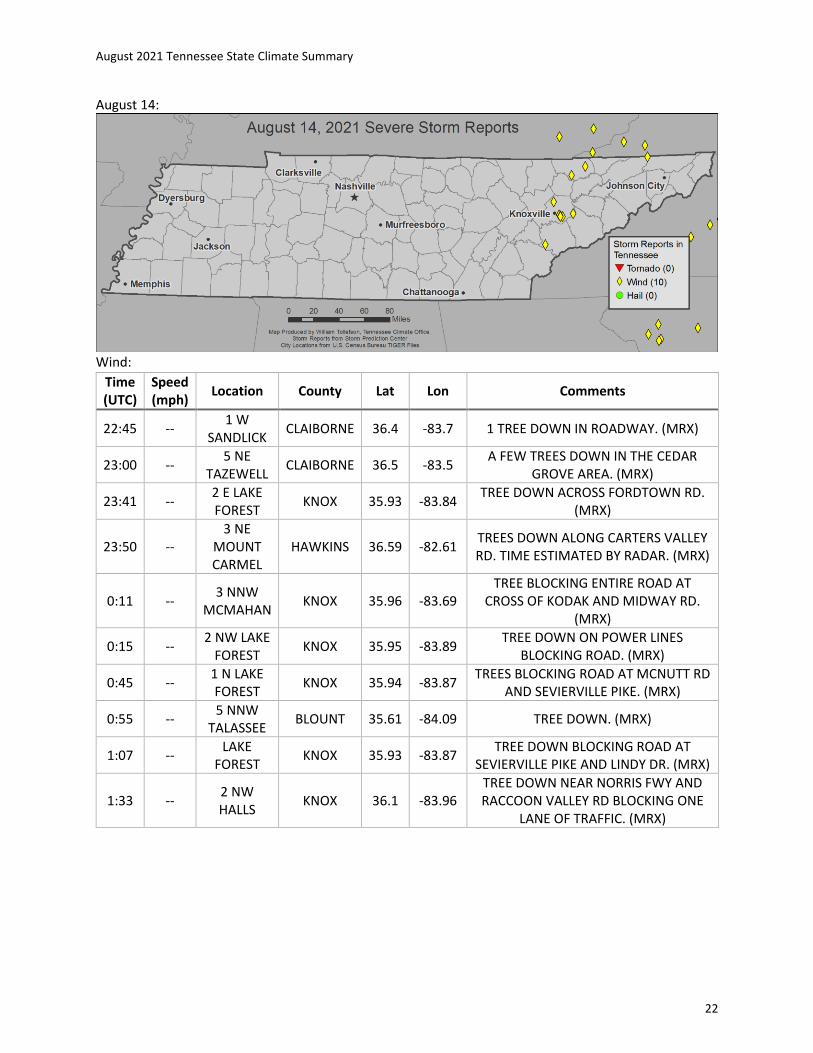
August 14:
Wind:
Time (UTC)
Speed (mph)
Location County Lat Lon Comments
22:45 -- 1 W
SANDLICK CLAIBORNE 36.4 -83.7 1 TREE DOWN IN ROADWAY. (MRX)
23:00 -- 5 NE
TAZEWELL CLAIBORNE 36.5 -83.5
A FEW TREES DOWN IN THE CEDAR GROVE AREA. (MRX)
23:41 -- 2 E LAKE FOREST
KNOX 35.93 -83.84 TREE DOWN ACROSS FORDTOWN RD.
(MRX)
23:50 -- 3 NE
MOUNT CARMEL
HAWKINS 36.59 -82.61 TREES DOWN ALONG CARTERS VALLEY RD. TIME ESTIMATED BY RADAR. (MRX)
0:11 -- 3 NNW
MCMAHAN KNOX 35.96 -83.69
TREE BLOCKING ENTIRE ROAD AT CROSS OF KODAK AND MIDWAY RD.
(MRX)
0:15 -- 2 NW LAKE
FOREST KNOX 35.95 -83.89
TREE DOWN ON POWER LINES BLOCKING ROAD. (MRX)
0:45 -- 1 N LAKE FOREST
KNOX 35.94 -83.87 TREES BLOCKING ROAD AT MCNUTT RD
AND SEVIERVILLE PIKE. (MRX)
0:55 -- 5 NNW
TALASSEE BLOUNT 35.61 -84.09 TREE DOWN. (MRX)
1:07 -- LAKE
FOREST KNOX 35.93 -83.87
TREE DOWN BLOCKING ROAD AT SEVIERVILLE PIKE AND LINDY DR. (MRX)
1:33 -- 2 NW HALLS
KNOX 36.1 -83.96 TREE DOWN NEAR NORRIS FWY AND RACCOON VALLEY RD BLOCKING ONE
LANE OF TRAFFIC. (MRX)
August 2021 Tennessee State Climate Summary
23
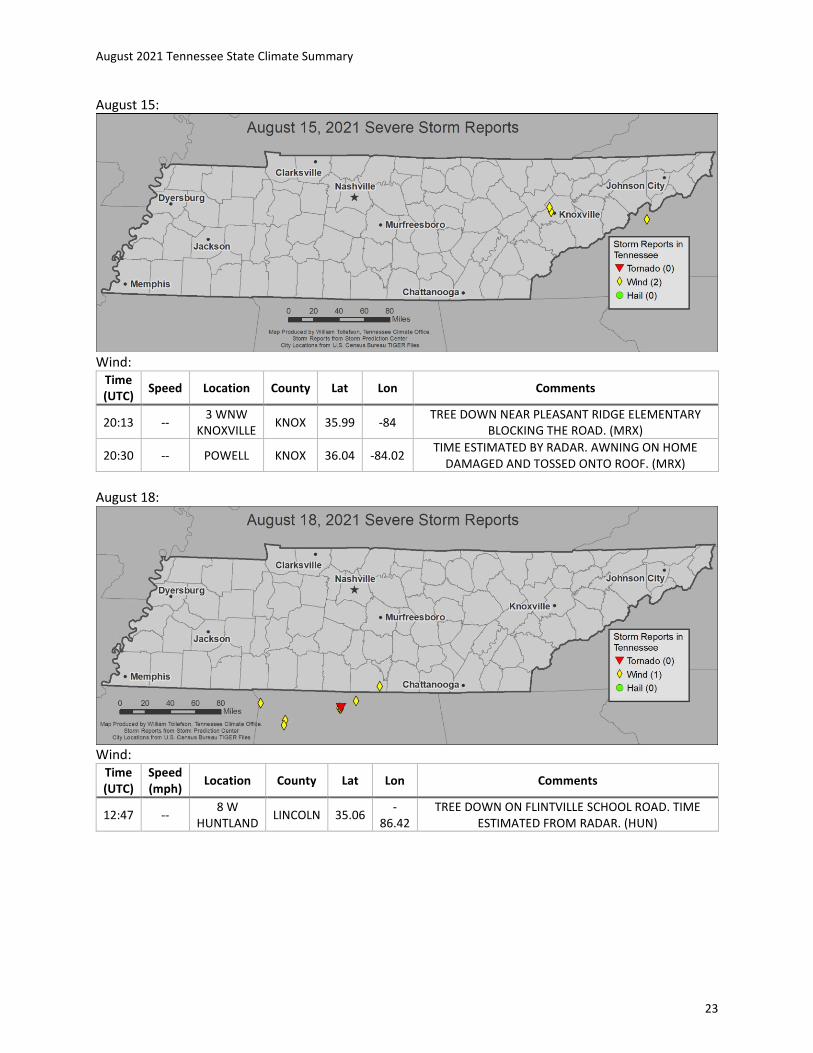
August 15:
Wind:
Time (UTC)
Speed Location County Lat Lon Comments
20:13 -- 3 WNW
KNOXVILLE KNOX 35.99 -84
TREE DOWN NEAR PLEASANT RIDGE ELEMENTARY BLOCKING THE ROAD. (MRX)
20:30 -- POWELL KNOX 36.04 -84.02 TIME ESTIMATED BY RADAR. AWNING ON HOME
DAMAGED AND TOSSED ONTO ROOF. (MRX)
August 18:
Wind:
Time (UTC)
Speed (mph)
Location County Lat Lon Comments
12:47 -- 8 W
HUNTLAND LINCOLN 35.06
-86.42
TREE DOWN ON FLINTVILLE SCHOOL ROAD. TIME ESTIMATED FROM RADAR. (HUN)

August 2021 Tennessee State Climate Summary
24
August 25:
Wind:
Time (UTC)
Speed (mph)
Location County Lat Lon Comments
20:25 -- 3 SE
POWELL KNOX 36.01 -83.99
TREE IN ROADWAY AT FREDONIA ROAD AND BLOSSOM ROAD. (MRX)
20:40 -- 2 ESE
KNOXVILLE KNOX 35.96 -83.92
TREE DOWN ON CUMBERLAND AVENUE AT HENLEY STREET. (MRX)
August 26:
Wind:
Time (UTC)
Speed (mph)
Location County Lat Lon Comments
22:47 -- 2 NNW
MORRISTOWN HAMBLEN 36.24 -83.31 LARGE TREE FELL ON A TRUCK. (MRX)
23:13 -- 4 WNW
WHITE HOUSE ROBERTSON 36.48 -86.74
TREES AND POWER LINES WERE REPORTED DOWN ON HERBERT SHANNON ROAD AND
MAXIE JONES ROAD (OHX)
0:10 -- BORDEAUX DAVIDSON 36.19 -86.83
A TREE WAS BLOWN DOWN ON KINGS LANE IN BORDEAUX. POWER LINES WERE
REPORTED DOWN IN NORTH NASHVILLE. (OHX)
August 2021 Tennessee State Climate Summary
25
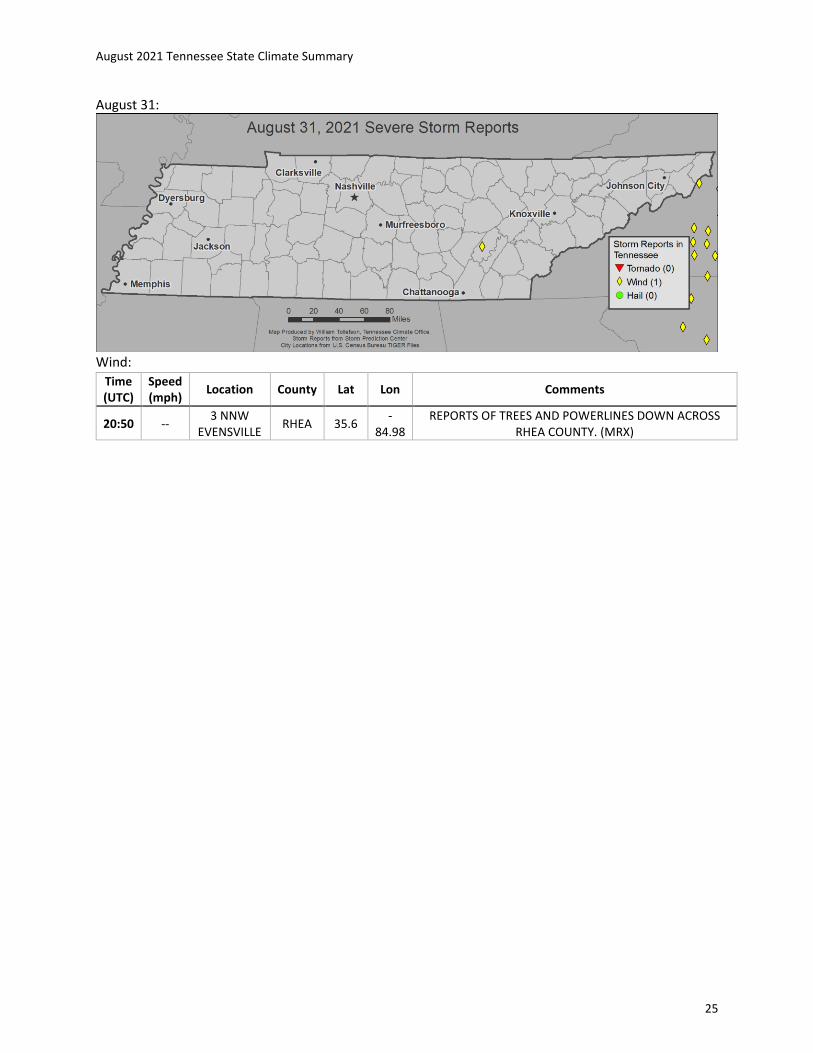
August 31:
Wind:
Time (UTC)
Speed (mph)
Location County Lat Lon Comments
20:50 -- 3 NNW
EVENSVILLE RHEA 35.6
-84.98
REPORTS OF TREES AND POWERLINES DOWN ACROSS RHEA COUNTY. (MRX)
August 2021 Tennessee State Climate Summary
26
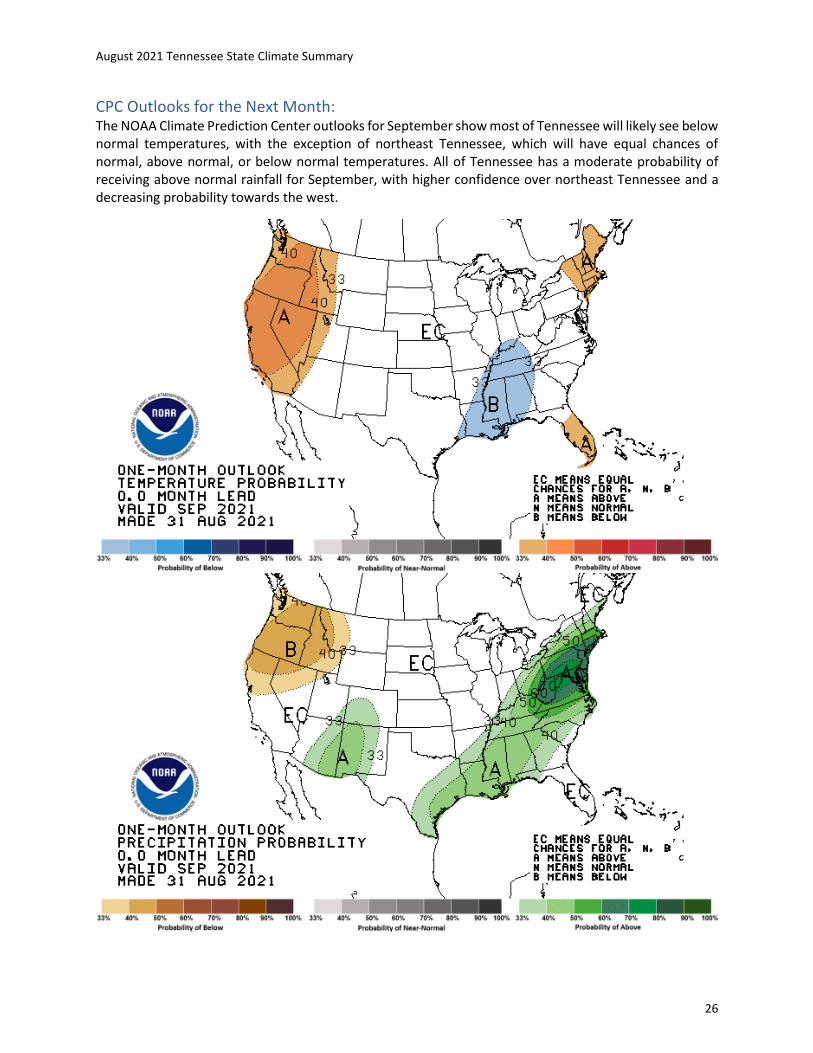
CPC Outlooks for the Next Month: The NOAA Climate Prediction Center outlooks for September show most of Tennessee will likely see below normal temperatures, with the exception of northeast Tennessee, which will have equal chances of normal, above normal, or below normal temperatures. All of Tennessee has a moderate probability of receiving above normal rainfall for September, with higher confidence over northeast Tennessee and a decreasing probability towards the west.