monthly overview - manstratais.co.za watch... · regions. farmers should continue to monitor...
TRANSCRIPT
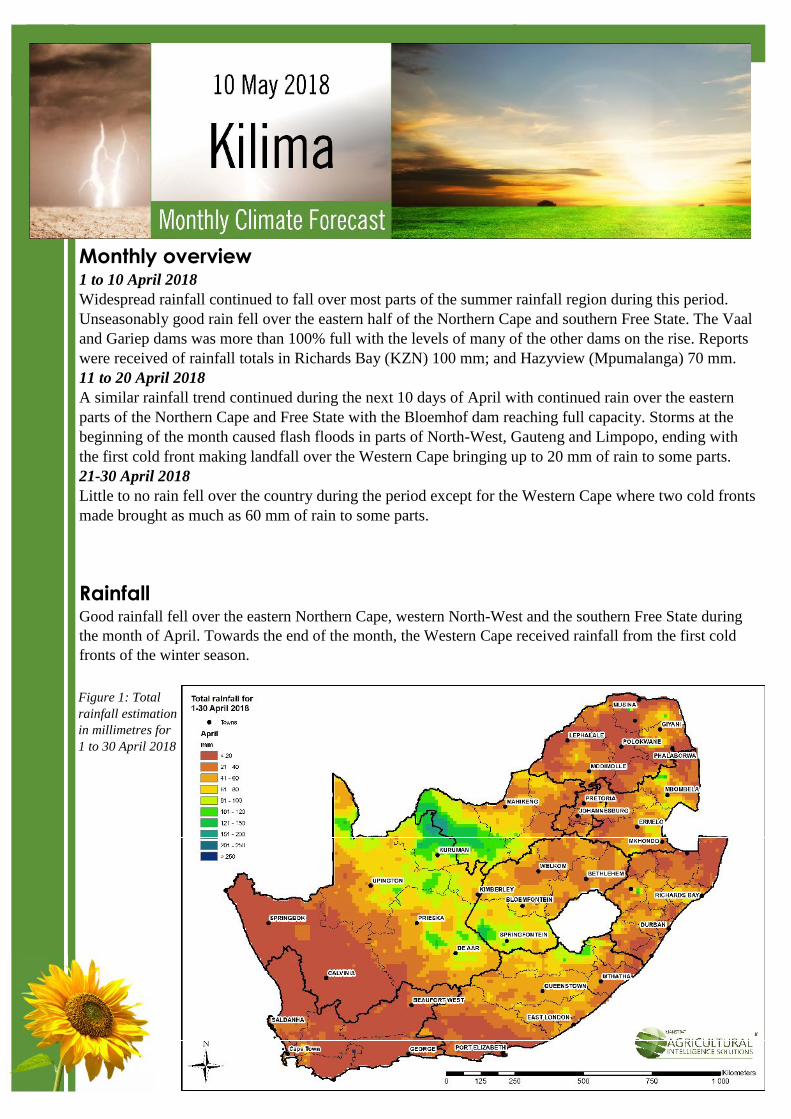
Figure 1: Totalrainfall estimationin millimetres for1 to 30 April 2018
RainfallGood rainfall fell over the eastern Northern Cape, western North-West and the southern Free State duringthe month of April. Towards the end of the month, the Western Cape received rainfall from the first coldfronts of the winter season.
Monthly overview1 to 10 April 2018Widespread rainfall continued to fall over most parts of the summer rainfall region during this period.Unseasonably good rain fell over the eastern half of the Northern Cape and southern Free State. The Vaaland Gariep dams was more than 100% full with the levels of many of the other dams on the rise. Reportswere received of rainfall totals in Richards Bay (KZN) 100 mm; and Hazyview (Mpumalanga) 70 mm.11 to 20 April 2018A similar rainfall trend continued during the next 10 days of April with continued rain over the easternparts of the Northern Cape and Free State with the Bloemhof dam reaching full capacity. Storms at thebeginning of the month caused flash floods in parts of North-West, Gauteng and Limpopo, ending withthe first cold front making landfall over the Western Cape bringing up to 20 mm of rain to some parts.21-30 April 2018Little to no rain fell over the country during the period except for the Western Cape where two cold frontsmade brought as much as 60 mm of rain to some parts.
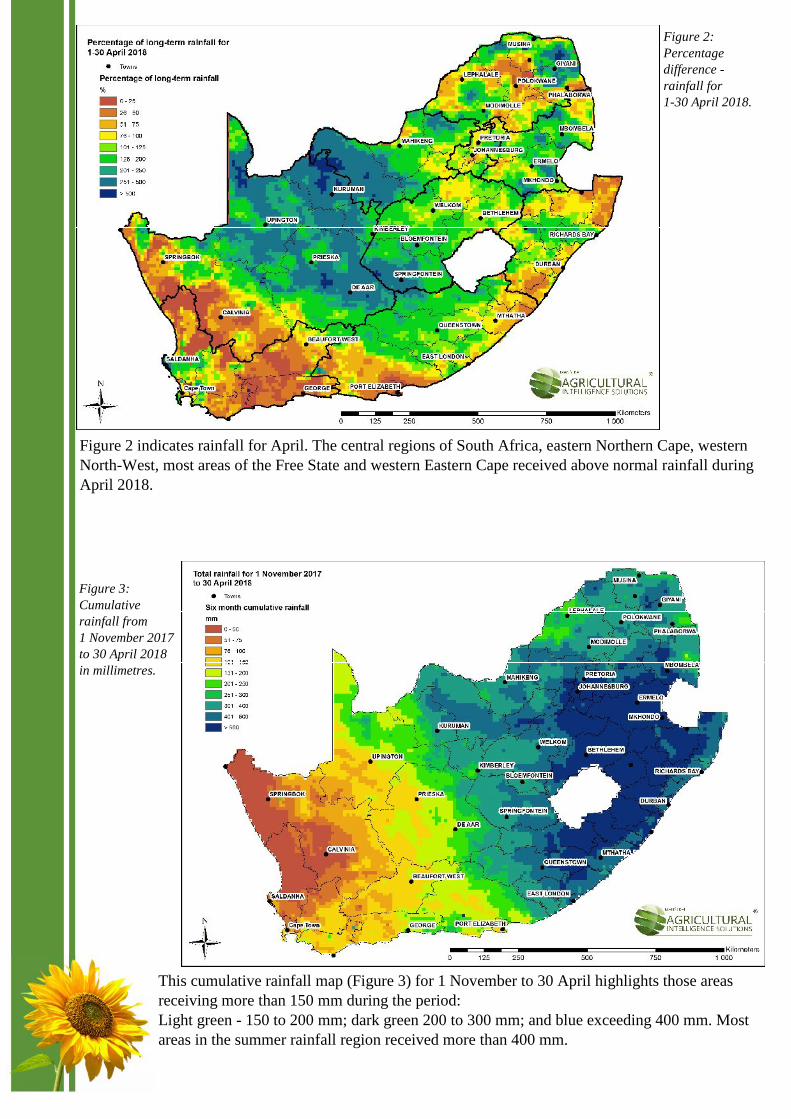
Figure 2 indicates rainfall for April. The central regions of South Africa, eastern Northern Cape, westernNorth-West, most areas of the Free State and western Eastern Cape received above normal rainfall duringApril 2018.
Figure 2:Percentagedifference -rainfall for1-30 April 2018.
Figure 3:Cumulativerainfall from1 November 2017to 30 April 2018in millimetres.
This cumulative rainfall map (Figure 3) for 1 November to 30 April highlights those areasreceiving more than 150 mm during the period:Light green - 150 to 200 mm; dark green 200 to 300 mm; and blue exceeding 400 mm. Mostareas in the summer rainfall region received more than 400 mm.
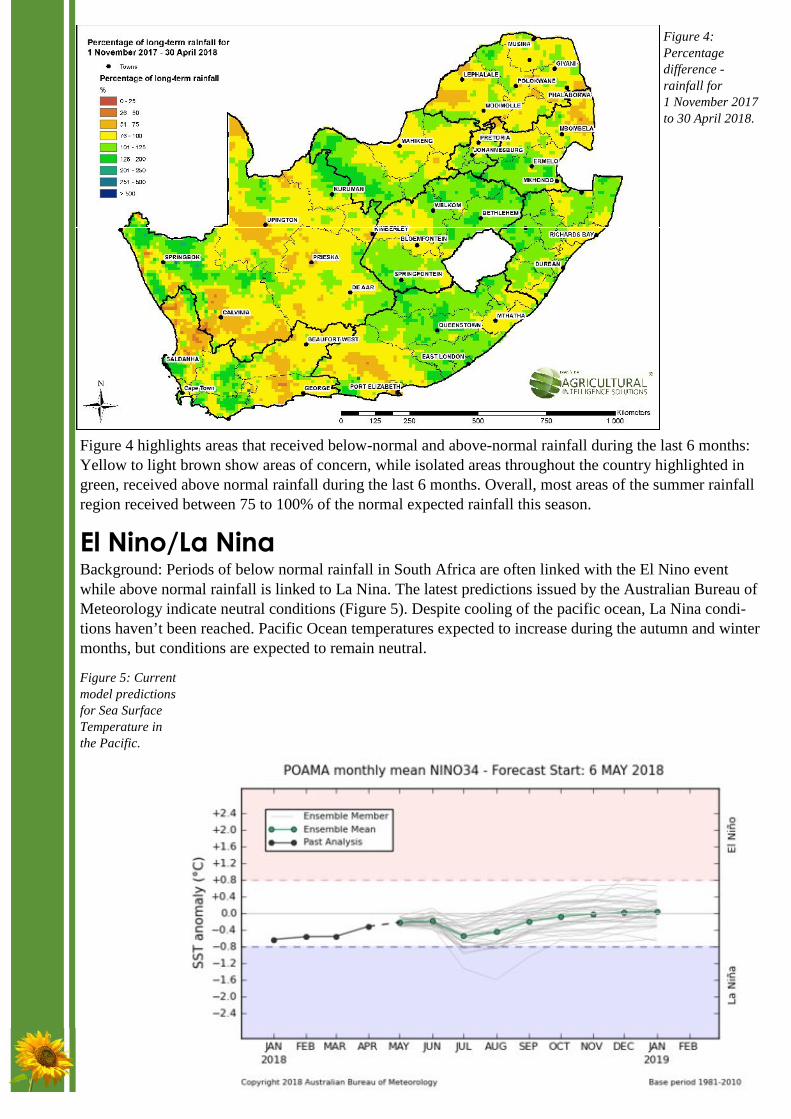
Figure 4 highlights areas that received below-normal and above-normal rainfall during the last 6 months:Yellow to light brown show areas of concern, while isolated areas throughout the country highlighted ingreen, received above normal rainfall during the last 6 months. Overall, most areas of the summer rainfallregion received between 75 to 100% of the normal expected rainfall this season.
El Nino/La NinaBackground: Periods of below normal rainfall in South Africa are often linked with the El Nino eventwhile above normal rainfall is linked to La Nina. The latest predictions issued by the Australian Bureau ofMeteorology indicate neutral conditions (Figure 5). Despite cooling of the pacific ocean, La Nina condi-tions haven’t been reached. Pacific Ocean temperatures expected to increase during the autumn and wintermonths, but conditions are expected to remain neutral.
Figure 4:Percentagedifference -rainfall for1 November 2017to 30 April 2018.
Figure 5: Currentmodel predictionsfor Sea SurfaceTemperature inthe Pacific.
NDVI
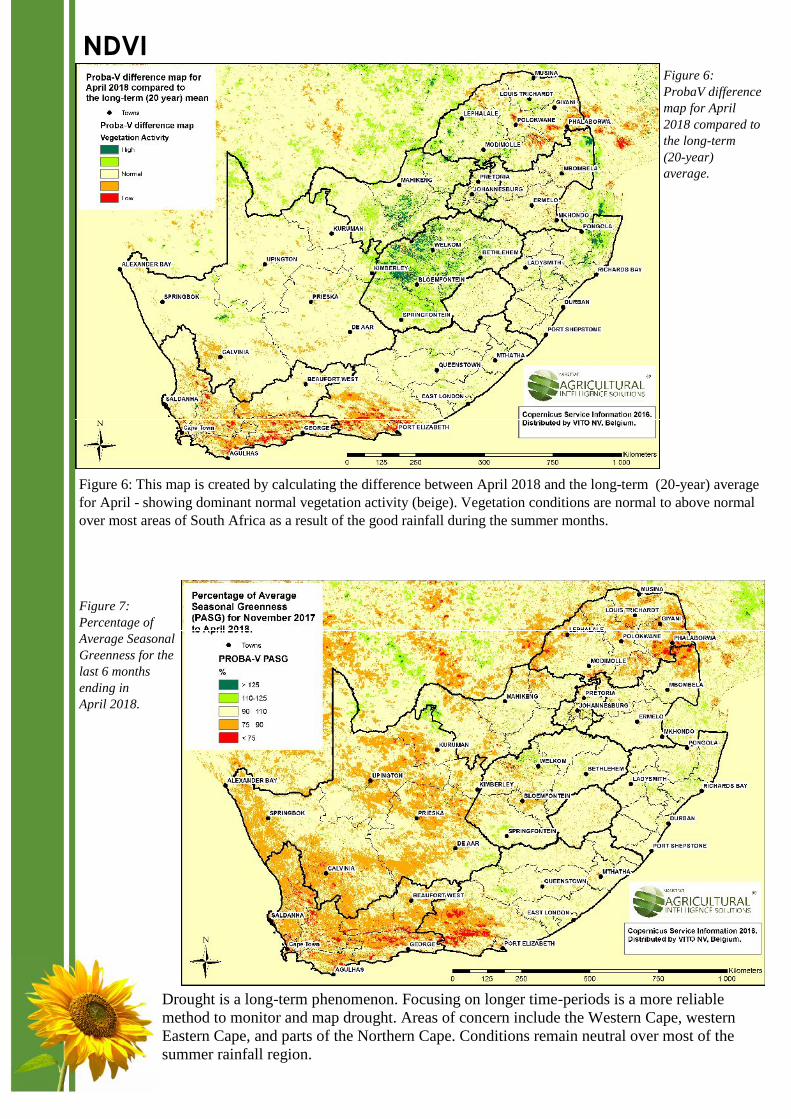
Drought is a long-term phenomenon. Focusing on longer time-periods is a more reliablemethod to monitor and map drought. Areas of concern include the Western Cape, westernEastern Cape, and parts of the Northern Cape. Conditions remain neutral over most of thesummer rainfall region.
Figure 6: This map is created by calculating the difference between April 2018 and the long-term (20-year) averagefor April - showing dominant normal vegetation activity (beige). Vegetation conditions are normal to above normalover most areas of South Africa as a result of the good rainfall during the summer months.
Figure 6:ProbaV differencemap for April2018 compared tothe long-term(20-year)average.
Figure 7:Percentage ofAverage SeasonalGreenness for thelast 6 monthsending inApril 2018.
General Discussion
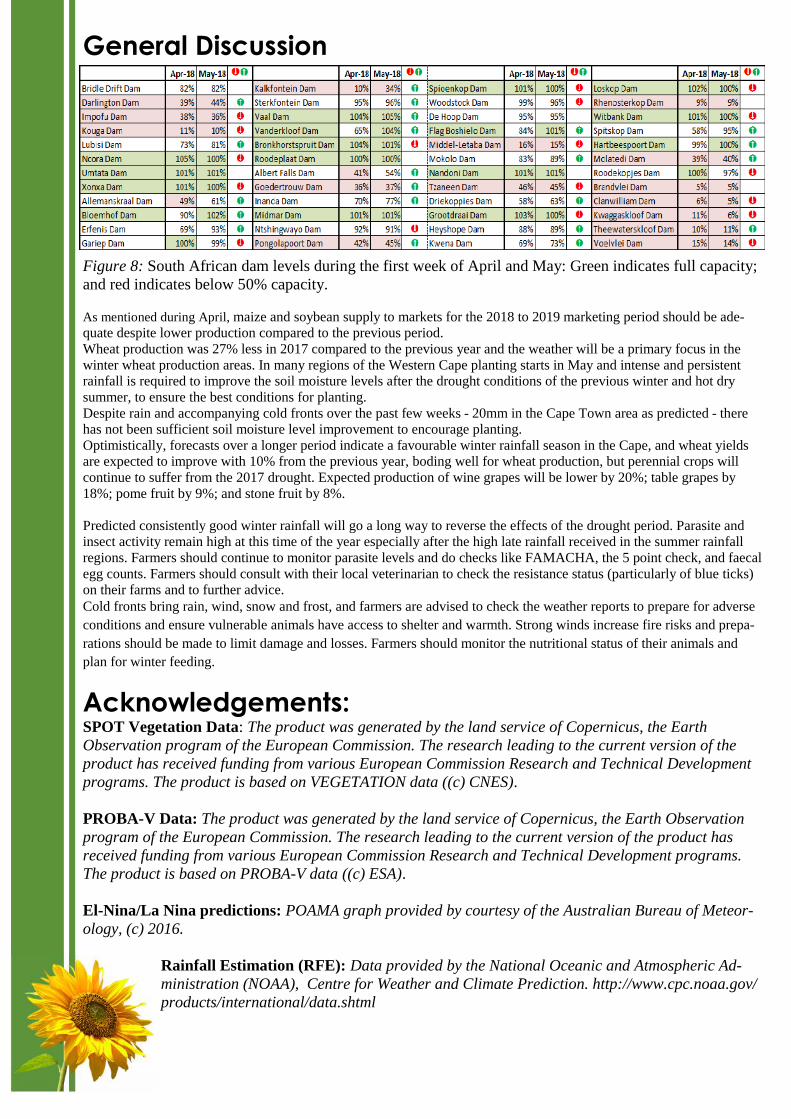
Figure 8: South African dam levels during the first week of April and May: Green indicates full capacity;and red indicates below 50% capacity.
As mentioned during April, maize and soybean supply to markets for the 2018 to 2019 marketing period should be ade-quate despite lower production compared to the previous period.Wheat production was 27% less in 2017 compared to the previous year and the weather will be a primary focus in thewinter wheat production areas. In many regions of the Western Cape planting starts in May and intense and persistentrainfall is required to improve the soil moisture levels after the drought conditions of the previous winter and hot drysummer, to ensure the best conditions for planting.Despite rain and accompanying cold fronts over the past few weeks - 20mm in the Cape Town area as predicted - therehas not been sufficient soil moisture level improvement to encourage planting.Optimistically, forecasts over a longer period indicate a favourable winter rainfall season in the Cape, and wheat yieldsare expected to improve with 10% from the previous year, boding well for wheat production, but perennial crops willcontinue to suffer from the 2017 drought. Expected production of wine grapes will be lower by 20%; table grapes by18%; pome fruit by 9%; and stone fruit by 8%.
Predicted consistently good winter rainfall will go a long way to reverse the effects of the drought period. Parasite andinsect activity remain high at this time of the year especially after the high late rainfall received in the summer rainfallregions. Farmers should continue to monitor parasite levels and do checks like FAMACHA, the 5 point check, and faecalegg counts. Farmers should consult with their local veterinarian to check the resistance status (particularly of blue ticks)on their farms and to further advice.Cold fronts bring rain, wind, snow and frost, and farmers are advised to check the weather reports to prepare for adverseconditions and ensure vulnerable animals have access to shelter and warmth. Strong winds increase fire risks and prepa-rations should be made to limit damage and losses. Farmers should monitor the nutritional status of their animals andplan for winter feeding.
Acknowledgements:SPOT Vegetation Data: The product was generated by the land service of Copernicus, the EarthObservation program of the European Commission. The research leading to the current version of theproduct has received funding from various European Commission Research and Technical Developmentprograms. The product is based on VEGETATION data ((c) CNES).
PROBA-V Data: The product was generated by the land service of Copernicus, the Earth Observationprogram of the European Commission. The research leading to the current version of the product hasreceived funding from various European Commission Research and Technical Development programs.The product is based on PROBA-V data ((c) ESA).
El-Nina/La Nina predictions: POAMA graph provided by courtesy of the Australian Bureau of Meteor-ology, (c) 2016.
Rainfall Estimation (RFE): Data provided by the National Oceanic and Atmospheric Ad-ministration (NOAA), Centre for Weather and Climate Prediction. http://www.cpc.noaa.gov/products/international/data.shtml