monnet ispat 2
TRANSCRIPT

Parnamoy Dutta Roll No. 13 PGDM (IB)
Page | 1
Monnet Ispat & Energy Limited
1. About Monnet Ispat & Energy Limited:
Balance Sheet Findings:
Particulars Schedules As On 31.3.2011 As On 31.3.2010
Sources Of Funds
Shareholders' Funds
a) Share Capital 1 643550484 544785934
b) Subscription Against Warrants 0 268825000
c) Reserves & Surplus 2 20257805529 15916860397
Total Shareholders' Funds 20901356013 16730471331
Loan Funds
a) Secured Loans 3 19328739825 12509229901
b) Unsecured Loans 4 7389865655 2440605547
Total Loan Funds 26718605480 14949835448
Deferred Tax Liability 5 1412382096 1319332994
Total 49032343589 32999639773
Application Of Funds
Fixed Assets 6
a) Gross Block 14768678754 14391293879
b) Less Depreciation 3831546879 3108123293
c) Net Block 10937131875 11283170586
Capital Work In Progress 15127362951 7212131953
26064494826 18495302539
Investments 7 5500091128 5454038748
Current Assets, Loans and Advances
a) Inventories 8 3604252692 2188050912
b) Sundry Debtors 9 1897967789 1288661376
c) Cash & Bank Balances 10 6881100455 2052422993
d) Loans & Advances 11 8534258318 5898310301
20917579254 11427445582
Less: Current Liabilities & Provisions
a) Current Liabilities 12 2372271669 1803037747
b) Provisions 13 1077549950 758317559
3449821619 2561355306
Net Current Assets 17467757635 8866090276
Misc. Expenditure
Foreign currency monetary Item translation
Difference amount 0 184208212
Total 49032343589 32999639775

Page | 2
Understanding
Number of equity shares traded in the market
increased as amalgamation of two companies
M/s Mounteverest Trading & Investment
Limited and M/s Monnet Power Limited took
place

Page | 3
Understanding
The net reserves and surplus decreased Capital
Redemption Reserve, Capital Reserve, Capital
Reconstruction Reserve, Amalgamation
Reserve and Balance transferred from P&L A/C
decreased whereas Share Premium, General
Reserve and Debenture Redemption Reserve
increased marginally.
Understanding
Majority of the secured loans were from
foreign financial institutions (ECBs) and it
increased in the current fiscal year as well.
Loans from banks showed a decrease in
percentage as was loans against non-
convertible bonds.

Page | 4
-
Understanding
The major rise in this section was that of
unsecured loans from banks which has higher
interest rate. No FCCB's were issued in this
fiscal year as well as unsecured loans from
fully convertible bonds were less.
Understanding
The deffered tax liability increased in the
present fiscal year which suggests that the
business has to pay the amount to the
government. Also the percentage increase has
been low which suggests that the company has
paid much of it taxes to the actual.

Page | 5
Schedule 6Particulars Schedules As On 31.3.2011 As On 31.3.2010 Percentage of Total (2011) Percentage of Total (2010) Increase / Decrease
Fixed Assets 6
a) Gross Block 14768678754 14391293879
b) Less Depreciation 3831546879 3108123293
c) Net Block 10937131875 11283170586
Capital Work In Progress 15127362951 7212131953
26064494826 18495302539 53.15775857 56.04698313 decrease
Notes
Particulars
As at 01.04.2010Acquired on
AmalgamationAdditions Adjustments as at 31.03.2011 As at 31.03.2011
Land & Site Development 253688145 0 1409912 0 255098057
Lease Hold Land (mining) 95003388 0 0 0 95003388
Railway Siding 181077121 0 197758 0 181274879
Building 1567423853 0 80561652 0 1647985505
Plant & Machinery 12079238480 0 293831504 8689967 12364380017
Furnitures & Fixtures 67014762 0 3193030 0 70207792
Vehicles 147848130 0 17887613 11006627 154729116
Current Year 14391293879 0 397081469 19696594 14768678754
Previuos Year 13664534313 172801400 562040854 8082688 14391293879
Gross Block
Upto the yearAcquired on
AmalgamationAdditions Adjustments as at 31.03.2011 As at 31.03.2011 As at 31.03.2011 As at 31.03.2010
0 0 0 0 0 255098057 253688145 2.33240359 2.2483764 increase
7217171 0 1563321 0 8780492 86222896 87786217 0.78835015 0.77802792 increase
13902438 0 8606415 0 22508853 158766026 167174683 1.45162395 1.48162861 decrease
219735785 0 53127524 0 272863309 1375122196 1347688068 12.572969 11.944232 increase
2801976790 0 657043735 7192345 3451828180 8912551837 9277261690 81.4889309 82.2221167 decrease
12563740 0 4413030 0 16976770 53231022 54451022 0.48670001 0.48258618 increase
52727368 0 14452796 8590889 58589275 96139841 95120761 0.87902242 0.8430322 increase
3108123292 0 739206821 15783234 3831546879 10937131875 11283170586
2395679916 1491494 716834340 5882457 3108123293 11283170586 11268854397
Increase
/
Decrease
Depreciation Net Block Percentage
of Total
2011
Percentage
of Total
2010
Understanding
Majority of the fixed assets are Plant &
Machinery. Although as a percentage of total
for the respective year it shows a decrease
while the percentage increased in the case of
Land, mining land, vehicles etc. SLM
depreciation method is used majorly except
for one plant where WDV method is followed.
The total assets of the company increased but
not as percentage of the total application of
that years fund. The company might have
focussed on other areas for application of its
funds.
Page | 6
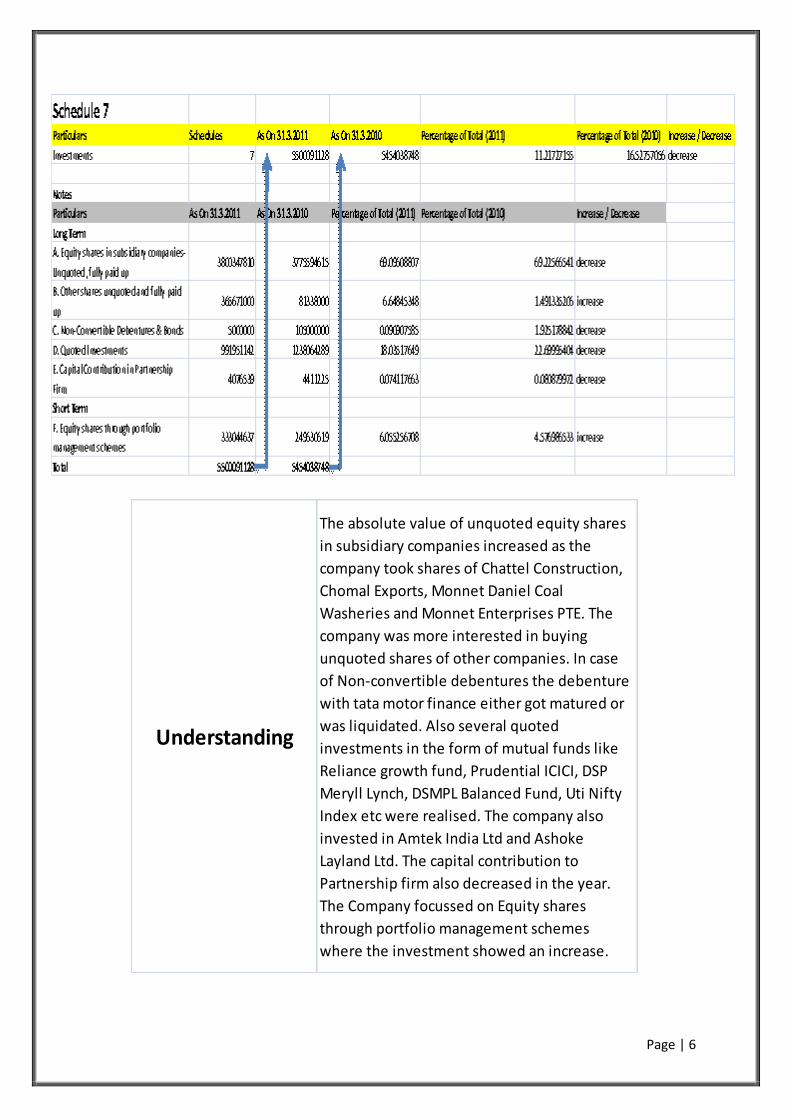
Understanding
The absolute value of unquoted equity shares
in subsidiary companies increased as the
company took shares of Chattel Construction,
Chomal Exports, Monnet Daniel Coal
Washeries and Monnet Enterprises PTE. The
company was more interested in buying
unquoted shares of other companies. In case
of Non-convertible debentures the debenture
with tata motor finance either got matured or
was liquidated. Also several quoted
investments in the form of mutual funds like
Reliance growth fund, Prudential ICICI, DSP
Meryll Lynch, DSMPL Balanced Fund, Uti Nifty
Index etc were realised. The company also
invested in Amtek India Ltd and Ashoke
Layland Ltd. The capital contribution to
Partnership firm also decreased in the year.
The Company focussed on Equity shares
through portfolio management schemes
where the investment showed an increase.
Page | 7
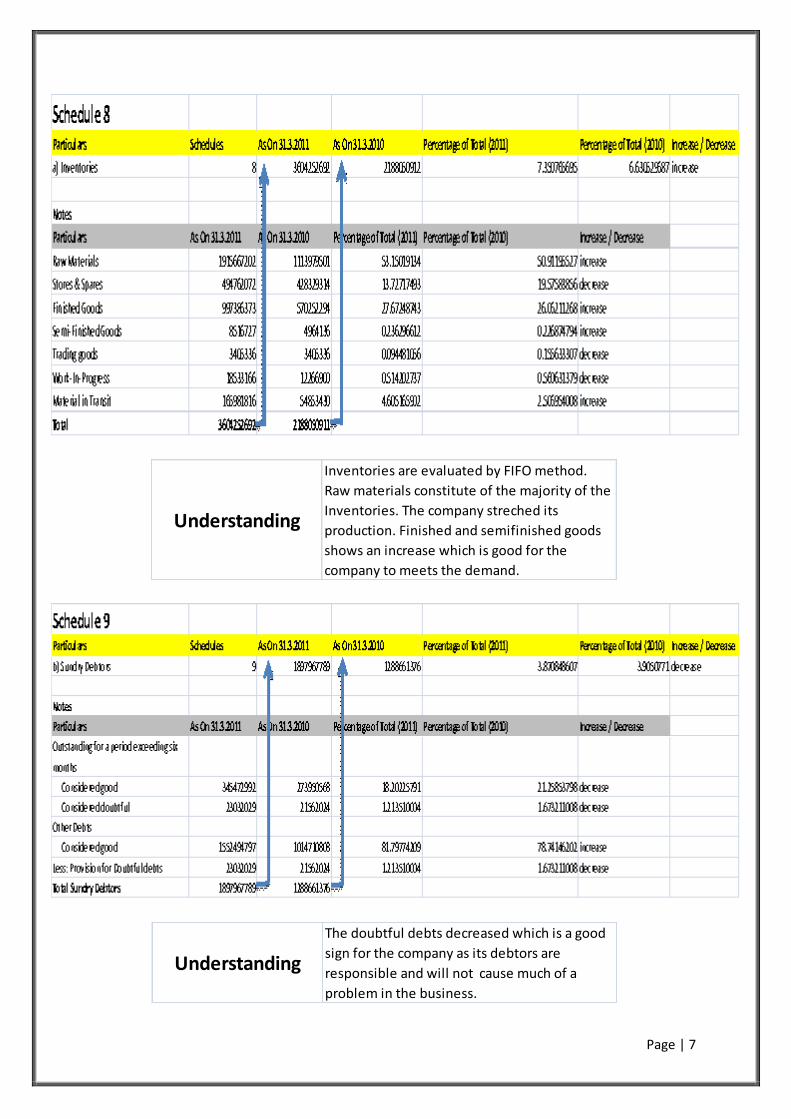
Understanding
Inventories are evaluated by FIFO method.
Raw materials constitute of the majority of the
Inventories. The company streched its
production. Finished and semifinished goods
shows an increase which is good for the
company to meets the demand.
Understanding
The doubtful debts decreased which is a good
sign for the company as its debtors are
responsible and will not cause much of a
problem in the business.

Page | 8
Understanding
The cash and bank balances of the increase by
a good margin thereby proving the good
business. The company showed more trust in
foreign banks owing to their competitve
interest rates.
Understanding
Loans to subsidiary companies increased
considerably. Also refundable amount of
money lying with the excise deptt increased.
The company also paid extra advance income
tax for tax benefits. Other prepaid expenses
also decreased.
Page | 9
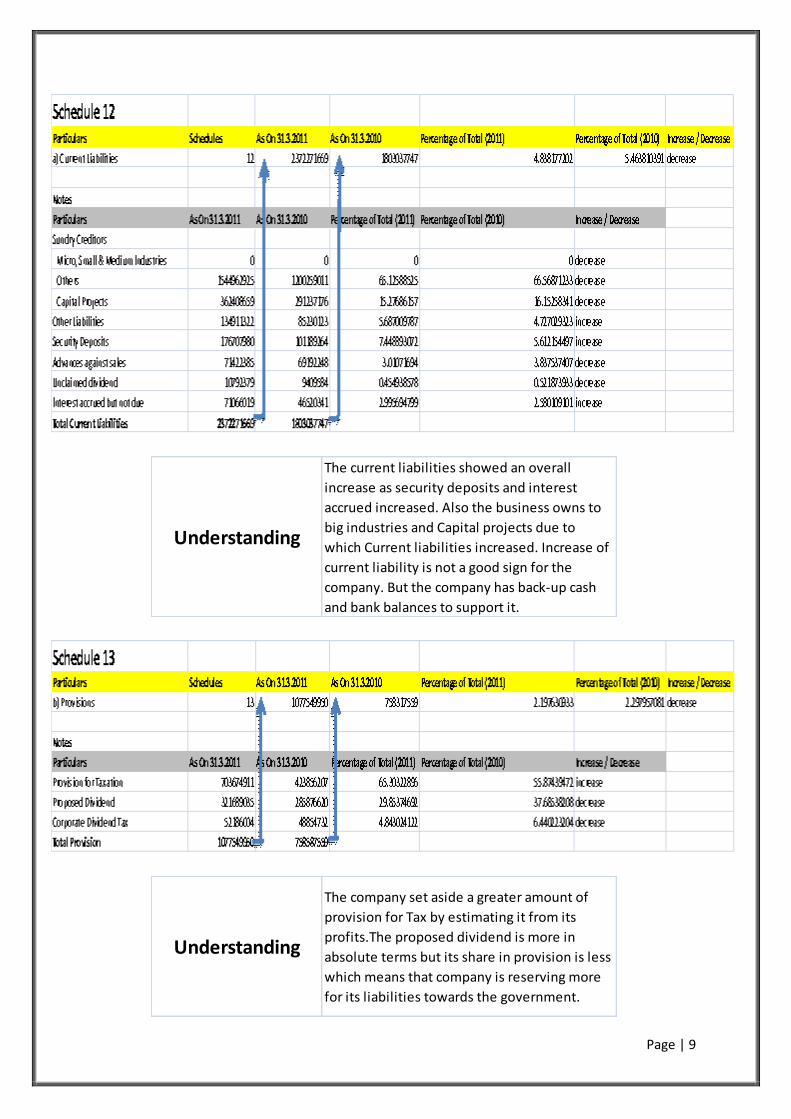
Understanding
The current liabilities showed an overall
increase as security deposits and interest
accrued increased. Also the business owns to
big industries and Capital projects due to
which Current liabilities increased. Increase of
current liability is not a good sign for the
company. But the company has back-up cash
and bank balances to support it.
Understanding
The company set aside a greater amount of
provision for Tax by estimating it from its
profits.The proposed dividend is more in
absolute terms but its share in provision is less
which means that company is reserving more
for its liabilities towards the government.

Page | 10
Profit And Loss Statement Findings:
Particulars Schedules As On 31.3.2011 As On 31.3.2010
Income
Sales 20084155462 20379388488
Less: Interdivision Transfers 3135375696 4710607998
16948779766 15668780490
Less: Excise Duty on Sales 1218286484 861828216
15730493282 14806952274
Other Income 14 293217203 317501275
Total Income 16023710485 15124453549
Expenditure
Material, Manufacturing & Others 15 13251081439 13212906242
Less: Inter division transfers 3135375696 4710607998
10115705743 8502298244
Increase/Decrease in Stocks 16 -436952935 218960854
Salaries,Wages & Amenities 17 746286380 733031378
Repair & Maintenance 18 119369656 91789072
Administrative, Selling & Other Exp 19 688147319 620835804
Financial Charges 20 437207331 927884981
Depreciation 738638106 716655305
Total Expenditure 12408401600 11811455638
Profit Before Tax 3615308885 3312997911
Current Tax/Mat Payable 722800000 547400000
Mat Credit Entitlement -19125089 -123543793
Deferred Tax Expense 93049100 179810846
Income Tax Adjustment 7008239 18287055
Total Tax Expenses 803732250 621954108
Profit After Tax 2811576635 2691043803
Balance as per last year 8067514099 6036553393
Balance b/f on Amalgamation 0 116427216
Profit available for appropiation 10879090734 8844024412
Appropriations
Transfer to general reserve 282000000 270000000
Tranfer to debenture redemption reserve 315026053 172048961
Dividend
Proposed dividend equity shares 321689035 285876620
Differential Dividend on equity shares 25030355 0
Corporate Dividend Tax 52186004 48584732
Total Appropiations 995931447 776510313
Balance carried to balance sheet 9883159287 8067514099

Page | 11
Understanding
The income due to rent and interest increased.
Profits on sale of investments and dividend
received decreased drastically. This can be
attributed lower performance of stocks in which
the company invested.
Understanding
Lesser amount of raw material and power & fuel
were consumed but as net profits increased we
might say that the manufacturing efficiency of the
plant increased

Page | 12
Understanding
The closing stock suggests that there is a increase
of stocks in godowns of the company hence it
suggests that there was positive growth in
production process.
Understanding
The increasing number of employees owing to
expansion led to an overall increase expenses on
salaries,wages and greater emphasis was given to
employee welfare

Page | 13
UnderstandingThe company put more emphasis on maintaining its
machinery for efficient performance.

Page | 14
Understanding
Marketing constitutes majority of this type of
expense. Auditors remuneration also increased
during this fiscal year. Important to note that losses
from partnership firm also reduced in the current
Fiscal Year.
Understanding
Interest paid for loans is the major expense under
this category. The total expense on this category
reduced as all the expense in individual category
reduced.