molefi nketekete, risk management in public sector
TRANSCRIPT

1
Navorsingsartikels • Research articles
Risk management in public sector construction projects: Case studies in Lesotho
Peer reviewed and revised October 2016
Abstract Construction projects are facing problems that impede their expected performance. Time, cost, quality, and competition limitations place constraints on projects. These challenges require incisive risk-management (RM) practices. This article presents the findings of a multiple case study, which determined how and why public sector construction projects are failing in terms of contemporary RM practices that appear to be lacking in Lesotho construction. The article investigates the stakeholders’ perceptions regarding risks’ likelihoods and impacts (P-Is) on three public sector construction projects. A 5-point Likert measurement scale was used to collect data for the P-I grids. The data are analysed and presented with Scatter plots. The results obtained through cross-case synthesis show that the interviewees perceive the level of risks’ P-Is on the examined construction projects to be high. Moreover, the level of RM practice is found to be inconsistent with best practices. To enhance RM practices in Lesotho, the management of public sector construction projects should promote the use of competent project managers.Keywords: Construction, Lesotho, public sector, risk man age ment,
AbstrakKonstruksieprojekte staar probleme in die gesig wat hul verwagte gedrag strem, wat deur tyds-, koste-, kwaliteits- en kompetisiebeperkinge beïn-vloed word. Hierdie uitdagings vereis in dring-ende risiko bestuurspraktyke (RB). Die doel van hierdie artikel is om die bevindinge vanuit ‘n omvattende gevallestudie navorsingsmetode aan te bied, gerig op kontemporêre RB-praktyke, wat ontoereikend blyk te wees in die geval van Lesotho konstruksieprojekte. Die ondersoek fokus op die persepsies van aandeelhouers ten
Molefi Nketekete, Fidelis Emuze & John Smallwood
Mr Molefi Nketekete, MSc (Construction Management) Graduate at the Department of Construction Management, Nelson Mandela Metropolitan University, PO Box 77000, Port Elizabeth, 6031, South Africa. Phone: +27 41 504 2790, Email: <[email protected]>
Prof. Fidelis Emuze, Associate Professor and Head, Department of Built Environment, Central University of Technology, Free State (CUT), Private Bag X20539, Bloemfontein, 9300, South Africa. Phone: +27 51 507 3089, Email: <[email protected]>
Prof. John Smallwood, Professor, Department of Con struc tion Manage ment, Nelson Mandela Metropolitan University, PO Box 77000, Port Elizabeth, 6031, South Africa. Phone: +27 41 504 2790, E-mail: <[email protected]>
The author(s) declared no conflict of interest for this title and article.
DOI: http://dx.doi.org/10.18820/24150487/as23i2.1ISSN: 1023-0564e-ISSN: 2415-0487Acta Structilia 2016 23(2): 1-24© UV/UFS

Acta Structilia 2016: 23(2)
2
opsigte van die waarskynlikheid en impak (P-Is) van risikos oor drie openbare sektor konstruksieprojekte. ‘n Vyfpunt Likertskaal-meetinstrument is gebruik vir die versameling van data vir die P-I roosters en spreidiagramme vir ontleding daarvan. Die data is ontleed en aangebied met verspreidingsgrafieke. Die resutate verkry deur kruisgevalsintese wys dat respondente die vlak van P-Is vir geselekteerde konstruksieprojekte hoog ag. Daar is ook bevind dat die omvang van RB-praktyke afwyk van internasionale praktyk, as gevolg van uitdagings binne die projekte. Ten einde RB-praktyke in Lesotho te bevorder, beveel die outeurs aan dat gesoute bestuurders vir die bestuur van openbare konstruksieprojekte aangewend word.Sleutelwoorde: Konstruksie, Lesotho, openbare sektor, risikobestuur,
1. Introduction The construction industry has embraced project management (PM), which entails risk management (RM) as one of its essential knowledge areas. According to Mahamid (2013: 45), construction projects are failing due to prevalent risks. In some instances, failures have escalated in the region of 6% to 7% of contract costs, with a 90% failure rate recorded in African projects (Egbu & Sidawi, 2011: 104; Van Olden, 2014: 46). Therefore, RM has become a crucial area in the management of projects. Smart project managers employ risk management processes (RMP) to tackle challenges that impede their goals and objectives. They continually learn about effective RM practices by collaborating with PM professionals and RM training.
The results of the study reveal that project stakeholders perceive the impacts of risks on construction projects and knowledge areas to address the deficiencies in RM practice in Lesotho. Semi-structured interviews, supplemented with a mini questionnaire across three case projects in Lesotho, were used to establish how project actors perceive the likelihoods and impacts of risks. The study also assesses how construction risks change within a project life cycle (PLC) of a public sector construction project in Lesotho.
The paucity of infrastructure in Lesotho has remained a challenge to economic growth. Least developed economies such as Lesotho are unable to fully address the infrastructural challenges and fulfil developmental mandates due to technical skills’ inadequacies (Laryea, 2010: 216; Government of Lesotho, 2013: 65). Technical skills are essential in project RM, because risk is a function of project uniqueness and the stakeholders’ experience (Nicholas & Steyn, 2011: 363). In particular, Lesotho is faced with a shortage of required infrastructure for economic growth (Ngoma, Mundia & Kaliba, 2014: 16). To address the shortage, the Government of Lesotho planned to invest in public construction projects (Government of Lesotho, 2013: iii). However, in order to realise the plan, project risks

Nketekete, Emuze & Smallwood • Risk management in public sector ...
3
must be closely managed (Schwalbe, 2011: 424). RM is necessary to mitigate cost/time overruns, and attracts potential investors into the public infrastructural projects. Investigating the practice of RM in the local public construction projects could help stakeholders re-evaluate ways to minimise losses and project failure.
2. Challenges facing the construction industryAccording to Issa, Emsley and Kirkham (2012: 1221), most of the problems encountered in infrastructural projects are due to regularly identified construction risks. A risk is an uncertain event that has a positive or adverse effect on project objectives (Enshassi & Mosa, 2008: 96; Heldman, 2005: 213; Schwalbe, 2011: 425). Taroun, Yang and Lowe (2011: 87) emphasise the well-known view that “no construction is risk-free”. However, the risk could be managed, minimised, shared, transferred or accepted.
In other words, risks are subjected to various control mechanisms in a project environment. Since projects are complicated, experience and RM knowledge are vital tools in managing them (Ameh & Odusami, 2014: 2; Nicholas & Steyn, 2011: 362-363). Table 1 indicates the problems that are unique to projects in Lesotho. These issues place emphasis on time and cost effects. Delays have been identified as major project risks in public construction projects (Mpaki, 2014a: 25; Ntsukunyane, 2015: 4). Delays are prevalent in construction in developing countries. As in other African countries, Government-related delays stifle projects’ progress in Lesotho (Agyakwa-Baah & Chileshe, 2010: 1226). Apart from their impact on advances in work, delays trigger cost overruns in construction projects (African Development Bank Group, 2011: iv; Mpaki, 2014a: 25; 2014b: 26), but employing risk management processes (RMPs) might alleviate the situation. However, Shang, Anumba, Bouchlaghem, Miles, Cen and Taylor (2005: 392) observe that RMPs are not well practised on construction projects.

Acta Structilia 2016: 23(2)
4
Table 1 Risk impact on selected major public construction projects in Lesotho
Project Risk type Causes of delays Effect on project performance
The Mpharane- Belabela Road Upgrading Project
Internal market, technical & assumption.
Insufficient road users cost recovery (about 36.5%)Project objectives were not succinct Design brief and feasibility studies were inadequateHeavy rainfall
Delays – 9 monthsCost overruns (55.3%)
The Metolong Dam Project
External & internal
Logistical challengesLabour disputesHeavy rainfalls
Delays – 1 yearCost overruns
The Tikoe Industrial Estate Project
ExternalDelayed funds Inclement weather
Delays – 1 yearCost overruns
Source: Adapted from the African Development Bank Group (2011: IV) and Mpaki (2014a: 25; 2014b: 26).
3. Risk management processes (RMPs)According to Schwalbe (2011: 433), project managers need to consider the impacts of risks on the other project management knowledge areas (PMKAs). The Project Management Institute (PMI) has recommended the use of ten knowledge areas, including integration management, scope management, time management, quality management, human resources management, communication management, procurement management, stakeholder manage-ment, cost management, and risk management (PMI, 2013: 60). However, this study uses RM as a lens to examine other relevant PMKAs that project managers must possess. Among the 10 PMKAs, only stakeholder management was not assessed in this study because of the anticipated low number of stakeholders involved in the PM functions in Lesotho. The removal of the stakeholder management KA helps avoid superficial PM perceptions. This limitation is supported by the notion that the effectiveness of a project manager depends on the ability to manage stakeholders and extensive experience gained (Bal, Bryde & Fearon, 2011: 1165).
Risk analysis and assessment have been identified as major RMP elements (Schieg, 2007: 145; Taroun et al., 2011: 87). RM helps

Nketekete, Emuze & Smallwood • Risk management in public sector ...
5
stakeholders understand the nature of projects while promoting accountability (Schwalbe, 2011: 422). RMP involves risk planning, risk identification, risk assessment (both qualitative and quantitative), risk response, risk monitoring, and control. These steps must be undertaken throughout the PLC (Schwalbe, 2011: 427). Analysing risks from a PLC perspective is important as threats change through initiation, planning and design, execution, and closeout phases of the project (Risk Management Technical Group, 2012: 2-19). The RM strategies may be different, but the objectives are the same, due to the use of the same concepts (Kululanga & Kuotcha, 2010: 337). However, the RM plan must precede the identification process so that risk profiling, risk appointments, risk reservation, and documentation can be continuous (Nicholas & Steyn, 2011: 384).
Regarding perceptions, Nicholas and Steyn (2011: 363) note that project managers are accustomed to working with tangible evidence and tend to avoid the likelihood of risks, because they find them too complex to deal with. According to Shang et al. (2005: 392), project members mostly concentrate on getting the job done and tend to avoid RM procedures. Schwalbe (2011: 422) supports this perception, with the contention that RM is a commonly overlooked element in PM. When project managers do not forget it, they appear to favour simple methods as opposed to practical methods of RM that may be complex (Forbes, Smith & Horner, 2007: 736). In fact, Hillson (2012a: 30; 2012b: 34) asserts that risk-taking culture as a critical dimension of project leadership is often overlooked, even though it moulds an active RM practice.
4. Probability and impact of risksAccording to Nicholas and Steyn (2011: 363), risk is a factor of the ‘likelihood’ of setbacks and the ‘impact’ unique to a project. These can only be minimised by an ascribed process of RM (Nicholas & Steyn, 2011: 363; Roberts, 2013: 110). Risk has a direct impact on time, which mostly contributes to cost overruns (Afshari, Khosravi, Ghorbanali, Borzabadi & Valipour, 2010: 42; Assaf & AL-Hejji, 2006: 349-350). Risk effects on the project parameters of time, cost, quality, and scope have been called a ‘quadruple constraint’ (Schwalbe, 2011: 9). In PM literature, it becomes apparent that several risks with different impacts emerged at various phases of a project. Common risks in the construction industry pertain to quality, personnel, costs, deadline, strategic decisions’ risks, as well as environmental, technical, scheduling, contractual, financial, and management matters (Schieg, 2006: 151). These risks are internal to

Acta Structilia 2016: 23(2)
6
a project. Schieg (2006: 79) identifies external risks as those related to natural occurrences, political changes, societal changes, market and sectoral trends’ shifts, legal developments, and technological changes. Moreover, these risks are termed using the acronym, PESTLE, i.e. Political, Economic, Sociocultural, Technological, Legal, and Environmental issues (Forbes, Smith & Horner, 2007: 736).
Risk identification
Revise
Risk Analysis/Assessment
Risk monitoring & controllingRisk response
Figure 1: Risk management processSource: Adapted from Nicholas & Steyn, 2011: 79-80; Schwalbe, 2011: 57-105
As indicated in Figure 1, risk identification is the first step in RMP. When a risk is known, the next step is to investigate it in terms of its likelihood of occurrence and impact. Thus, the second step is required in order to analyse the risk value (Schieg, 2006: 79). The analysis could be done through either qualitative or quantitative systems. According to Schwalbe (2011: 438-442) and Ke, Wang and Chan (2012: 678), qualitative risk analysis involves a probability-impact (P-I) matrix, risk consequence rating (RCR), and Monte Carlo analysis. Quantitative techniques include decision trees analysis, expected monetary value (EMV), risk premium, simulation, and sensitivity analysis (Taroun et al., 2011: 87; Schwalbe, 2011: 428-442). For the purposes of this article, the P-I method, concisely explained in section 4.1, was used, because it presents stakeholders’ views that are essential for prioritising project risks qualitatively (Nicholas & Steyn, 2011: 370).
4.1 The qualitative probability-impact (P-I) matrix
The P-I risk analysis model combines both qualitative and quantitative data (Nicholas & Steyn, 2011: 370; Taroun et al., 2011: 90). As an illustration, Table 2 demonstrates a simple 5x5 qualitative risk method where P x I = Priority Risk Factor (RPF). The green category where PI=0.1 to 0.6, risks require hardly any attention; yellow category where PI=0.4 to 1.0, risks require slightly more attention; the amber category

Nketekete, Emuze & Smallwood • Risk management in public sector ...
7
requires a right amount of attention, while the red category requires maximum risk attention (2.5-4.5 RPFs).
Table 2: P-I qualitative risk analysis matrix Im
pact
0.9 0.9 1.8 2.7 3.6 4.5 Very high
0.5 0.7 1.4 2.1 2.8 3.5 High 0.5 0.5 1.0 1.5 2.0 2.5 Medium 0.3 0.3 0.6 0.9 1.2 1.5 Low 0.1 0.1 0.2 0.3 0.4 0.5 Very low
1 2 3 4 5Very low Low Medium High Very high
Probability
Source: Adapted from Schwalbe (2011: 439) and Nicholas & Steyn (2011: 373)
With impact value ranging from 0.1 (low) to 0.9 (high), Table 3 demonstrates how risks impact on quality, cost and time in a project. Subjective ratings can also be expressed as numerical measures between 0 (low/negligible), 0.3 (minor), 0.5 (moderate), 0.7 (significant), 0.9 (high), and 1.0 (catastrophic) (Nicholas & Steyn, 2011: 373).
Table 3: An illustrated project risk impact values on project parameters
Impact ValueImpact
Quality performance Cost overruns (percentage)
Time delays (months)
0.1 (low) Minimal Within budget Negligible 0.3 (minor) Small 1-10% Minor slip (<1)0.5 (moderate) Moderate 10-25% Moderate slip (1-3)0.7 (significant) Significant 25-50% Significant (> 3)0.9 (high) Goals not achievable >50% Large slip
Adapted from Nicholas & Steyn (2011: 373)
5. Research methodology According to Leedy and Ormrod (2010: 136-137), qualitative strate-gies can help the researcher gain new insights into the phenomenon, develop new theories about the phenomenon, and discover the challenges within the phenomenon under investigation. Yin

Acta Structilia 2016: 23(2)
8
(2011: 6-8) points out that qualitative research represents the views and perspectives of people while offering an attractive and fruitful means of conducting research. The case study research design was adopted so as to obtain data from lived experiences of project actors to uncover RM practice in Lesotho (Yin, 2011: 307).
Based on the exploratory research questions chosen, it was decided that an inductive approach would be appropriate for gaining an understanding of complex RM issues so as to draw conclusions about the studied project patterns. According to Creswell (2007: 39), working back and forth between themes to create a complete set of ideas and engage participants, highlights the importance of an inductive process. Therefore, to explore how people experience and perceive RM in projects, a case study approach was deemed suitable for this study (Yin, 2011: 17-18).
5.1 Data analysis and interpretation of findings
A 5-point Likert scale measurement instrument was employed to capture data for qualitative P-I grids and scatter diagrams, as a case study can also produce numeric data (Yin, 2011: 224-307). The interviewees were able to express their perceptions using a 5-point Likert scale measurement, where 1=Very low, 2=Low, 3=Medium, 4=High, and 5=Very high (please see Appendix). This strategy is supported by the literature where qualitative risk analysis methods such as P-I grids include numerical values (quantitative) being matched with the ratings (qualitative) (Nicholas & Steyn, 2011: 370).
5.2 Data collection
In brief, three major public sector construction projects with contract values exceeding R100 million were purposively selected. The registration status of the main contractors was narrowed to Grade A to B. Professionals involved in each project were chosen based on their exposure to RM. The level of the RM practice provided the key criterion for the sampling strategy; hence, construction project managers, construction managers, quantity surveyors, architects, contract managers, engineers, and their respective assistants were selected as interviewees in each case. Face-to-face, semi-structured interviews were conducted and a mini questionnaire was used to examine and assess how risks’ likelihoods and impacts on the project and knowledge areas are perceived across the PLC, using a 5-point Likert measurement scale. The process is shown in Figure 2.

Nketekete, Emuze & Smallwood • Risk management in public sector ...
9
CASE STUDY METHODANALYSIS
Conclusions & Recommendations
• Literature Review• Individuals’
perceptions+
Likert Scales
• 5X5 P-1 Grids
• Scatter diagrams
Figure 2: Research process
Figure 2 shows the reviewed literature that provides the support for the research process in this multiple-case study. Questionnaire interviews were conducted among 13 project stakeholders including Project Managers, Assistant Project Managers, Architects, Principal Engineers, Mechanical and Electrical Engineers, Consultants, Quantity Surveyors and Construction Managers to capture the data by means of a Likert scale measurement instrument. The collected data were analysed using qualitative 5x5P-I risk analysis grids and scatter diagrams derived from the 5-point scale. Table 4 presents the research sample, namely 13 interviewees in the three case projects.
5.3 Limitations
As with the majority of studies, there are constraints and limitations. For instance, only eight PMI knowledge areas were selected out of the total of 10. All other PMKAs were tested against RM, which is central to the study, while stakeholder management was excluded, due to the foreseeable narrow number of stakeholders involved in the PM offices so as to avoid superficial perceptions. In addition, during the data-collection process, the second case was far from completion. Hence, there were data limitations as the closeout phase could not be investigated. Moreover, some participants did not want to be recorded when interviewed, while subcontractors did not meet the sample requirements. Despite these limitations, the findings presented in the next section show aspects of RM practice in construction that have not previously been empirically analysed in Lesotho.
6. Results and discussions
6.1 Respondents profile
The first part of the questionnaire contained questions relative to the demographic profile of the respondents, the people in the best position to report how risks’ likelihoods and impacts on the project and knowledge areas are perceived. Table 4 shows the professions of

Acta Structilia 2016: 23(2)
10
the respondents, which include architecture, project management, quantity surveying, contract management, and engineering
Table 4: Research sample
Case Interviewee PM
Ass
is. P
M
Arc
hite
ct
Prin
cipa
l Eng
.
M&
E En
g.
Con
sulta
nt
QS
Con
tract
s Mgr
.
TOTA
L
Case 1 √ √ √ √ √ 5
Case 2 √√ √ √ 4
Case 3 √ √ √√ 4
TOTAL 2 3 1 1 1 1 1 3 13
6.2 Risk probability and impact across the PLC
Question three of the questionnaire tested the opinion of respondents in terms of how likely the identified risks (environmental, financial, technical, and political) occur and what their impact was. The question elicited responses in terms of a 5-point Likert scale from 1 (very low) to 5 (very high). The findings from each case project are presented in Tables 5 to 7. The results show that the participants have different perceptions on the likelihood of risks at the initiation stage. However, at the planning and design, execution, and closeout stages, the results mostly show medium to very high risks likelihoods. Meanwhile, the impacts of these risks were perceived to be parallel to their likelihoods across the PLC. These indicate that risks likelihood and impacts were proportionally increasing as the project matured.
Table 5: Perceptions regarding project risk P-I across the PLC in Case 1
Phase / Interviewee Architect Quantity
SurveyorStructural Engineer
M&E Engineer
Contractor’s PM
Likelihood:Initiation Medium Very low Very high Very high Very lowPlanning & Design Medium Medium Very high Very high Very low
Execution Low High Very high High High Closeout High Medium Very high High Very high

Nketekete, Emuze & Smallwood • Risk management in public sector ...
11
Phase / Interviewee Architect Quantity
SurveyorStructural Engineer
M&E Engineer
Contractor’s PM
Impact:Initiation Medium Very low Very high Very high Very lowPlanning & Design Medium Medium Very high Very high Very low
Execution Low High Very high High High
Closeout High Medium Very high High Very high
In Case 2, the interviewees were unable to give their perceptions concerning the closeout stage as the project was far from completion. The respondents in this project had wide-ranging views regarding the likelihood of risks at the initiation stage. They mostly perceived that risks were rampant across the planning and design, and execution stages relative to the perceived magnitude of the project and complexities. However, the closeout stage was not covered, as the project was still at the execution stage, as highlighted in the limitations.
Table 6: Perceptions regarding project risk P-I across the PLC in Case 2
Phase / Interviewee
Contracts Manager
Project Engineer Assistant PM Consultant
Likelihood:
Initiation Very low Very low High High
Planning & Design Medium Very low High High
Execution High High Low Very high
Closeout - - -
Impact:
Initiation Very low Very low High High
Planning & Design Medium Very low Very low High
Execution High High High Very high
Closeout - - - -
Similar to Case 1, the participants generally viewed risks’ likelihoods and impact to be proportionally increasing as the project matured.

Acta Structilia 2016: 23(2)
12
Table 7: Perceptions regarding project risk P-I across the PLC in Case 3
Phase / Interviewee
Contracts Manager
Project Engineer
Contractor’s Contracts Manager
Construction manager
Likelihood:Initiation Very low Very low Very low Very lowPlanning & Design Medium Very low Medium MediumExecution High High Very high Very high Closeout Medium Very high High Medium
Impact:Initiation Very low Very low Very low Very lowPlanning & Design Medium Very low Medium Medium Execution High High Very high Very high
Closeout Medium Very high High Medium
6.3 Risk impact on the other knowledge areas (KAs)
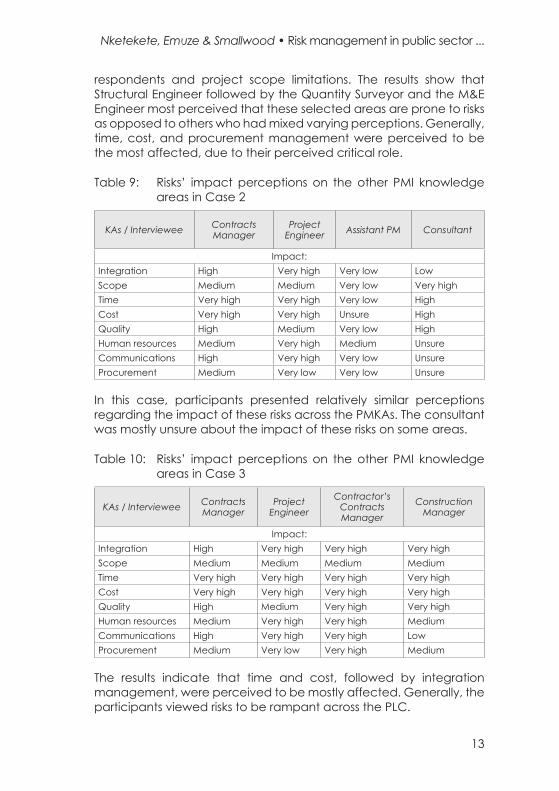
Question four of the questionnaire tested the respondents’ opinion on what impact the identified risks (environmental, financial, technical, and political) have on the eight knowledge areas (Integration, Scope, Time, Cost, Quality, Human Resources, Communications, and Procurement management) by using a 5-point Likert scale from 1 (very low) to 5 (very high). The results are shown in Tables 8 to 10.
Table 8: Risks’ impact perceptions on the other PMI knowledge areas in Case 1
KAs / Interviewee Architect Quantity
SurveyorStructural Engineer
M&E Engineer
Contractor’s PM
Impact: Integration Medium Very high Very high Very high Very highScope Very high High Very high Very high HighTime Very high Very high Very high Very high Very highCost Very high Very high Very high Very high Very highQuality Medium Very high Very high Very high LowHuman resources Low Very high Very high High LowCommunications Low Very high Very high Medium MediumProcurement Very high Very high Very high Very high Very high
Relative to how risks affect other selected PMI’s knowledge areas with the exclusion of risk management which is central to the research area and stakeholders’ management due to the anticipated
Nketekete, Emuze & Smallwood • Risk management in public sector ...
13
respondents and project scope limitations. The results show that Structural Engineer followed by the Quantity Surveyor and the M&E Engineer most perceived that these selected areas are prone to risks as opposed to others who had mixed varying perceptions. Generally, time, cost, and procurement management were perceived to be the most affected, due to their perceived critical role.
Table 9: Risks’ impact perceptions on the other PMI knowledge areas in Case 2
KAs / Interviewee Contracts Manager
Project Engineer Assistant PM Consultant
Impact: Integration High Very high Very low Low Scope Medium Medium Very low Very high Time Very high Very high Very low High Cost Very high Very high Unsure High Quality High Medium Very low High Human resources Medium Very high Medium Unsure Communications High Very high Very low Unsure Procurement Medium Very low Very low Unsure
In this case, participants presented relatively similar perceptions regar ding the impact of these risks across the PMKAs. The consultant was mostly unsure about the impact of these risks on some areas.
Table 10: Risks’ impact perceptions on the other PMI knowledge areas in Case 3
KAs / Interviewee Contracts Manager
Project Engineer
Contractor’s Contracts Manager
Construction Manager
Impact: Integration High Very high Very high Very highScope Medium Medium Medium Medium Time Very high Very high Very high Very highCost Very high Very high Very high Very highQuality High Medium Very high Very highHuman resources Medium Very high Very high Medium Communications High Very high Very high Low Procurement Medium Very low Very high Medium
The results indicate that time and cost, followed by integration management, were perceived to be mostly affected. Generally, the participants viewed risks to be rampant across the PLC.
Acta Structilia 2016: 23(2)
14
7. Case analysis and implications
7.1 Risk probability and impact across the PLC
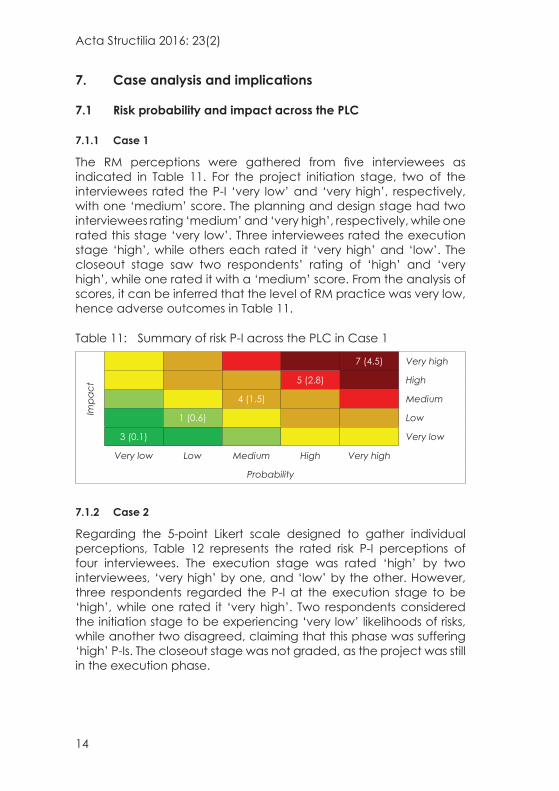
7.1.1 Case 1
The RM perceptions were gathered from five interviewees as indicated in Table 11. For the project initiation stage, two of the interviewees rated the P-I ‘very low’ and ‘very high’, respectively, with one ‘medium’ score. The planning and design stage had two interviewees rating ‘medium’ and ‘very high’, respectively, while one rated this stage ‘very low’. Three interviewees rated the execution stage ‘high’, while others each rated it ‘very high’ and ‘low’. The closeout stage saw two respondents’ rating of ‘high’ and ‘very high’, while one rated it with a ‘medium’ score. From the analysis of scores, it can be inferred that the level of RM practice was very low, hence adverse outcomes in Table 11.
Table 11: Summary of risk P-I across the PLC in Case 1
Impa
ct
7 (4.5) Very high
5 (2.8) High
4 (1.5) Medium
1 (0.6) Low
3 (0.1) Very low
Very low Low Medium High Very high
Probability
7.1.2 Case 2
Regarding the 5-point Likert scale designed to gather individual perceptions, Table 12 represents the rated risk P-I perceptions of four interviewees. The execution stage was rated ‘high’ by two interviewees, ‘very high’ by one, and ‘low’ by the other. However, three respondents regarded the P-I at the execution stage to be ‘high’, while one rated it ‘very high’. Two respondents considered the initiation stage to be experiencing ‘very low’ likelihoods of risks, while another two disagreed, claiming that this phase was suffering ‘high’ P-Is. The closeout stage was not graded, as the project was still in the execution phase.

Nketekete, Emuze & Smallwood • Risk management in public sector ...
15
Table 12: Summary of risk P-I across the PLC in Case 2
Impa
ct1 (4.5) Very high
6 (2.8) High
1 (1.5) Medium
Low
4/3(0.1) 1 (2.0) Very low
Very low Low Medium High Very high
Probability
7.1.3 Case 3
The perceptions of interviewees in Case 3 are summed up in the P-I grid (Table 13). The respondents perceive that the risks’ P-Is would be equal. Two informants indicate that ‘very high’ P-I had been experienced at the execution stage, while one understood that the closeout was experiencing similar problems across the PLC. Another two interviewees regarded the execution stage to be experiencing ‘high’ P-I, where another ‘high’ score was graded on the closeout stage by an interviewee. The four interviewees regard the initiation as the least troubled stage. Three respondents rated the planning and design stage ‘medium’, whereas one respondent rated it ‘very low’. Meanwhile, the execution stage was rated ‘high’ by two interviewees and ‘very high’ by the other two, thereby identifying it as the most troubled phase.
Table 13: Summary of risk P-I across the PLC in Case 3
Impa
ct
3 (4.5) Very high
3 (2.8) High
5 (1.5) Medium
Low
5(0.1) Very low
Very low Low Medium High Very highProbability

Acta Structilia 2016: 23(2)
16
7.2 Risk impact on the other knowledge areas (KAs)
7.2.1 Case 1
6
5
4
3
2
1
0
Major
Near major
Medium
Near minor
Minor
Integration Scope Time Cost Quality HR Comms Procurement
PERCEPTIONS OF THE IMPACT OF RISKS ON THE OTHER KAs
Figure 3: Case 1 – summarised perceptions of the impact of risks on the other KAs throughout the PLC
Figure 3 indicates how interviewees perceived the impact of risk on the other functional areas of the project. Some red dots (representing P-Is) appear to be dominant in the top tier of the diagram, implying that the project is contending with challenges according to the interviewees’ perceptions. The areas regarded to be highly affected include integration, which four respondents rated ‘very high’ and one rated it ‘medium’; scope was rated ‘very high’ by four and ‘high’ by one interviewee, while quality was rated ‘very high’ by three respondents, and time, cost and procurement were each rated ‘very high’ by all. For a project to succeed, the project management body of knowledge (PMBOK) concedes that the activities must be mapped against the nine project management knowledge areas (PMKAs) (Schwalbe, 2011: 83). The perceptions indicated that the project stakeholders did not adhere to this concept. Hence, the project succumbed to problems as a result of neglected risks.
7.2.2 Case 2
In Case 2, the project was regarded as experiencing major time and cost-related impacts by two interviewees, while one respondent perceived that other areas were severely affected, as indicated in Figure 4 (extracted from Table 9). Therefore, the respondents seemed

Nketekete, Emuze & Smallwood • Risk management in public sector ...
17
to have addressed some of the functional areas; hence, this project can be regarded as managed at a medium risk level according to the equal distribution of the red dots in Figure 4 (scatter diagram).
PERCEPTIONS OF THE IMPACT OF RISKS ON THE OTHER KAs
Major
Near major
Medium
Near minor
Minor
Integration Scope Time Cost Quality HR Comms Procurement
2.5
2
1.5
1
0.5
0
Figure 4: Case 2 – summarised perceptions of the impact of risks on the other KAs throughout the PLC
7.2.3 Case 3
In Case 3, all interviewees rated scope as ‘medium’, while time and cost were rated ‘very high’ by all interviewees, as indicated by the top tier skewed distributed red dots in Figure 5. The results show a perceived high-risk impact on the project, because there was a slight gap between those who recognized the high impact and those who were still optimistic about the challenges. There was also mention of two project areas: time and cost. These were followed by integration. Therefore, the overall impression shows a perception of high adverse impact on the project, thereby implying poor RM practice.

Acta Structilia 2016: 23(2)
18
PERCEPTIONS OF THE IMPACT OF RISKS ON THE OTHER KAs4.5
4
3.5
3
2.5
2
1.5
1
0.5
0
Major
Near major
Medium
Near minor
Minor
Integration Scope Time Cost Quality HR Comms Procurement
Figure 5: Case 3 – summarised perceptions of the impact of risks on the other KAs throughout the PLC
7.3 RM perceptions in public projects
The analysed responses indicate that, in Case 1, the interviewees were convinced that the level of RM was very low, while in Cases 2 and 3, the P-I’s perceptions on the projects were found to be medium and near medium, respectively. Therefore, when all three are aggregated, the combined score is a low level of perceived RM practice (Table 14). On average, the initiation stage earned the most ‘very low’ score across the cases, while planning and design earned ‘medium’, and execution stage scored ‘high’ and ‘very high’, as shown in Table 14. It is notable that the closeout stage was not adequately addressed, because Case 2 did not award P-I scores for this stage, as the project was still being executed. However, the results from the other two projects tend towards a ‘medium’ score. Finally, the interviewees perceived the risks’ P-Is to be ‘high’ and ‘very high’ at the execution stage. The majority of the respondents regarded the initiation stage as immune from the risks.

Nketekete, Emuze & Smallwood • Risk management in public sector ...
19
Table 14: Combined interviewees’ average score of P-I across the projects’ PLC
Project stage Very low Low Medium High Very highInitiation 63% 0% 7% 17% 13%Planning & design 32% 0% 47% 8% 13%Execution 0% 15% 0% 53% 32%Closeout 0% 0% 23% 22% 22%
Source: The researcher
8. DiscussionIn general, nearly all the interviewees in the three case projects were of the opinion that appropriate consideration of risks, their likelihoods, and impacts was lacking. The focus of attention was more on achieving the projects’ goals without paying sufficient attention to risk factors. The interviewees claim that overruns are realised at the project completion stages, while eight of them were of the opinion that inadequacies in technical information (for example, detailed specifications) are usually overlooked at the design stage. This could result in random variation orders. Employers tend to be reluctant in promoting RM culture, according to eight interviewees.
The nature of these findings is consistent with the studies of Yusuwan, Adnan and Omar (2008: 122), who contend that, despite project stakeholders’ exposure to risks, they still have confidence in old elusive concepts. Wang, Zhao, Zhang and Wang (2015: 165) affirm this scenario and argue that proper risk decisions warrant an active RM practice. For instance, variation orders cannot be avoided, as they are commonly accommodated in contracts – but first, their applications and limitations must be understood (Sunday, 2010: 102). In brief, it appears that stakeholders’ risk awareness and perceptions vis-à-vis the level of RM practice for these three projects was very low. Table 15 shows how the interviewees perceive the extent of RM about inhibiting P-Is factors in each case. Their perceptions point to a low average level of RM across the three cases.
Table 15: Summary of findings
Research element Case 1 Case 2 Case 3 Summary
RM perceptions Very low High Low Low level

Acta Structilia 2016: 23(2)
20
9. Conclusions and recommendationsThe results of this study present the underlying problems facing public sector projects regarding the dynamics of construction risks in Lesotho. This study provided insights into the impacts of risks on projects and amplified their likelihood and impact at the building stage. The findings verify the reported lack of up-to-date practice, because examined risks remain high as projects near completion. According to the findings across the three cases, the most affected project areas were time, cost, integration, quality, and procurement management. These results reflect that requisite RM skills do not exist.
Therefore, recommendations should target improved RM edu-cation and training that could influence practice. This could be accomplished through adequate training of professionals at the business and operational levels of construction management. The use of accredited institutions could be an immediate means of improving the practice of RM in Lesotho. Regular RM workshops should be encouraged in the industry.
References listAfrican Development Bank Group. 2011. Lesotho: Mpharane-Bela Bela road upgrading project – PPER. Maseru: OPEV.
Afshari, H., Khosravi, S., Ghorbanali, A., Borzabadi, M. & Valipour, M. 2010. Identification of causes of non-excusable delays of construction projects. In: Proceedings of the 2010 International Conference on E-business, Management and Economics, 28-30 December 2010. Hong Kong, China: PRC, IACSIT Press, pp. 42-46.
Agyakwa-Baah, A. & Chileshe, N. 2010. Construction professionals’ perception of risk assessment and management practices: Does length of service in construction industry matter? In: Egbu, C. (Ed.) Proceedings of the 26th Annual ARCOM Conference, 6-8 September 2010. Leeds, UK: Association of Researchers in Construction Management, pp. 1219-1228.
Ameh, O. & Odusami, K. 2014. Nigerian construction professional’s education and deficiencies in the area of project management. Journal of Construction in Developing Countries, 19(1), pp. 1-14.
Assaf, S. & AL-Hejji, S. 2006. Causes of delay in large construction projects. International Journal of Project Management, 24(4), pp. 349-357. https://doi.org/10.1016/j.ijproman.2005.11.010

Nketekete, Emuze & Smallwood • Risk management in public sector ...
21
Bal, M., Bryde, D. & Fearon, D. 2011. A model of stakeholder management strategies for sustainable construction. In: Egbu, C. & Lou, E. (Eds) Proceedings of the 27th Annual ARCOM Conference, 5-7 September 2011. Bristol, UK: Association of Researchers in Construction Management, pp. 1165-1174.
Creswell, J. 2007. Qualitative inquiry and research design: Choosing among five approaches. 2nd edition. London: Sage.
Egbu, C. & Sidawi, B. 2011. Management problems of remote construction projects and potential IT solutions: The case of the Kingdom of Saudi Arabia. Journal of Information Technology in Construction, 17, pp. 103-120.
Enshassi, A. & Mosa, J. 2008. Risk management in building projects: Owners’ perspective. The Islamic University Journal, 16(1), pp. 95-123.
Forbes, D., Smith, S.D. & Horner, M. 2007. A case-based reasoning approach for selecting risk management techniques. In: Boyd, D. (Ed.) Proceedings of the 23rd Annual ARCOM Conference, 3-5 September 2007. Belfast, UK: Association of Researchers in Construction Management, pp. 735-744.
Government of Lesotho. 2013. National strategic development plan 2012/13-2016/17: Growth and development strategic framework. Maseru: MDP.
Heldman, K. 2005. Project manager’s spotlight on risk management. Alameda, California: Harbor Light Press.
Hillson, D. 2012a. Risk management: Risky business. The Project Manager, 1(12), p. 30.
Hillson, D. 2012b. The risk doctor: Risk management or risk leadership. The Project Manager, 1(14), p. 34.
Issa, D., Emsley, M. & Kirkham, R. 2012. Reviewing risk allocation for infrastructure PFI: Between theory and practice. In: Smith, S.D. (Ed.) Proceedings of the 28th Annual ARCOM Conference, 3-5 September 2012. Edinburgh, UK: Association of Researchers in Construction Management, pp. 1219-1231.
Ke, Y., Wang, S. & Chan, A. 2012. Risk management practice in China’s public-private partnership projects. Journal of Civil Engineering and Management, 18(5), pp. 675-684. https://doi.org/10.3846/13923730.2012.723380

Acta Structilia 2016: 23(2)
22
Kululanga, G. & Kuotcha, W. 2010. Measuring project risk management process for construction contractors with statement indicators linked to numerical scores. Engineering, Construction and Architectural Management (ECAM), 17(4), pp. 336-351. https://doi.org/10.1108/09699981011056556
Laryea, S. 2010. Challenges and opportunities facing contractors in Ghana. In: Laryea, S., Leiringer, R. & Hughes, W. (Eds) Proceedings of the WABER Conference, 27-28 July 2010, Accra, Ghana: West Africa Built Environment Research, pp. 215-226.
Leedy, P.D. & Ormrod, J.E. 2010. Practical research: Planning and design. 9th edition. Saddle River, New Jersey: Pearson.
Mahamid, I. 2013. Common risks affecting time overrun in road construction projects in Palestine: Contractors’ perspective. Australian Journal of Construction Economics and Building, 12(2), pp. 45-53. https://doi.org/10.5130/ajceb.v13i2.3194
Mpaki, B. 2014a. Metolong dam water delivery delayed further. Public Eye Newspaper, 12 September, p. 25.
Mpaki, B. 2014b. Industrial estate completion pushed further back. Public Eye Newspaper 12 September, p. 26.
Ngoma, S., Mundia, M. & Kaliba, C. 2014. Benefits, constraints and risks in infrastructure development via public-private partnership in Zambia. Journal of Construction in Developing Countries, 19(1), pp. 15-33.
Nicholas, J.M. & Steyn, H. 2011. Project management for business, engineering, and technology: Principles and practice. 3rd edition. Oxford: Elsevier.
Ntsukunyane, L. 2015. Consortium ‘fleece’ government of M14m. Lesotho Times Newspaper, 5 March, p. 4.
Project Management Institute (PMI). 2013. A guide to the project management body of knowledge (PMBOK GUIDE). 5th edition. Newtown Square, Pennsylvania: PMI.
Risk Management Technical Group. 2012. Project risk management handbook: A scalable approach. Sacramento, California: Caltrans.
Roberts, P. 2013. The economist guide to project management: Getting it right and achieving lasting benefit. London: Profile Books.
Schieg, M. 2006. Risk management in construction project management. Journal of Business Economics and Management, 7(2), pp. 77-83.

Nketekete, Emuze & Smallwood • Risk management in public sector ...
23
Schieg, M. 2007. Post-mortem analysis on the analysis and evaluation of risks in construction project management. Journal of Business Economics and Management, 7(2), pp. 145-153.
Schwalbe, K. 2011. Managing information technology projects. 6th edition. Minneapolis, Minnesota: Cengage Learning.
Shang, H., Anumba, C., Bouchlaghem, D., Miles, J., Cen, M. & Taylor, M. 2005. An intelligent risk assessment system for distributed construction teams. Engineering, Construction and Architectural Management (ECAM), 12(4), pp. 391-409. https://doi.org/10.1108/09699980510608839
Sunday, O.A. 2010. Impact of variation orders on public construction projects. In: C. Egbu (Ed.) Proceedings of the 26th Annual ARCOM Conference, 6-8 September 2010, Leeds, UK: Association of Researchers in Construction Management, pp. 101-110.
Taroun, A., Yang, J. & Lowe, D. 2011. Construction risk modelling and assessment: Insights from a literature review. The Built & Human Environment Review, 4(1), pp. 87-97.
Wang, W., Zhao, J., Zhang, W. & Wang, Y. 2015. Conceptual framework for risk propensity, risk perception, and risk behaviour of construction project managers. In: A.B. Raidén & E. Aboagye-Nimo (Eds) Proceedings of the 31st Annual ARCOM Conference, 7-9 September 2015, Lincoln, UK: Association of Researchers in Construction Management, pp.165-174.
Yin, R. 2011. Qualitative research from start to finish. London: Sage.
Yusuwan, N., Adnan, H., Omar, A. & Jusoff, K. 2008. Clients’ perspectives of risk management practice in Malaysian construction industry. Journal of Politics and Law, 1(3), pp. 121-130. https://doi.org/10.5539/jpl.v1n3p121

Acta Structilia 2016: 23(2)
24
APPENDIX A: INTERVIEW SCHEDULE AND MINI QUESTIONNAIRE
1. Please tick the appropriate box below to indicate your orga-nisation and job title.
RD BDS Main Contractor Subcontractor Consultant
PM Asst. PM Contract. Man Architect Asst. Arch.
Engineer Asst. Eng. CM QS. Asst. QS.
2. General project information: (IF PM/QS/Principal Agent)
Start date: Tender amount: R
Anticipated finish date: Anticipated final cost: R
3. At each PLC stage, a. How Likely is it for these risks to occur, and b. What is their Impact? – Scale your perceptions by using a
5-point Likert scale from 1 (very low) to 5 (very high).
Probability Impact
Project phase UnsureLow............High
UnsureLow...............High
1 2 3 4 5 1 2 3 4 5
Initiation (I) U 1 2 3 4 5 U 1 2 3 4 5Planning & design (P) U 1 2 3 4 5 U 1 2 3 4 5Execution (E) U 1 2 3 4 5 U 1 2 3 4 5Closeout (C) U 1 2 3 4 5 U 1 2 3 4 5
4. At each project phase, what Impact do the risks (identified) have on the 8 knowledge areas? – Scale your perceptions by using a 5-point Likert scale from 1 (very low) to 5 (very high).
Impact
PMI knowledge area UnsureLow............................High
1 2 3 4 5Integration U 1 2 3 4 5Scope U 1 2 3 4 5Time U 1 2 3 4 5Cost U 1 2 3 4 5Quality U 1 2 3 4 5HR U 1 2 3 4 5Communications U 1 2 3 4 5Procurement U 1 2 3 4 5