molecular weight measurement of biobased furan polyamides
TRANSCRIPT

Molecular Weight Measurement of Biobased
Furan Polyamides via Non-Aqueous
Potentiometric Titration
by LaShonda T. Cureton, George Fountzoulas, and John J. La Scala
ARL-TR-6490 June 2013
Approved for public release; distribution is unlimited.

NOTICES
Disclaimers
The findings in this report are not to be construed as an official Department of the Army position unless
so designated by other authorized documents.
Citation of manufacturer’s or trade names does not constitute an official endorsement or approval of the
use thereof.
Destroy this report when it is no longer needed. Do not return it to the originator.

Army Research Laboratory Aberdeen Proving Ground, MD 21005-5069
ARL-TR-6490 June 2013
Molecular Weight Measurement of Biobased
Furan Polyamides via Non-Aqueous
Potentiometric Titration
LaShonda T. Cureton
Oakridge Institute for Science and Education
George Fountzoulas and John J. La Scala Weapons and Materials Research Directorate, ARL
Approved for public release; distribution is unlimited.

ii
REPORT DOCUMENTATION PAGE Form Approved OMB No. 0704-0188
Public reporting burden for this collection of information is estimated to average 1 hour per response, including the time for reviewing instructions, searching existing data sources, gathering and maintaining the data needed, and completing and reviewing the collection information. Send comments regarding this burden estimate or any other aspect of this collection of information, including suggestions for reducing the burden, to Department of Defense, Washington Headquarters Services, Directorate for Information Operations and Reports (0704-0188), 1215 Jefferson Davis Highway, Suite 1204, Arlington, VA 22202-4302. Respondents should be aware that notwithstanding any other provision of law, no person shall be subject to any penalty for failing to comply with a collection of information if it does not display a currently valid OMB control number.
PLEASE DO NOT RETURN YOUR FORM TO THE ABOVE ADDRESS.
1. REPORT DATE (DD-MM-YYYY)
June 2013
2. REPORT TYPE
Final
3. DATES COVERED (From - To)
July 2012 4. TITLE AND SUBTITLE
Molecular Weight Measurement of Biobased Furan Polyamides via Non-Aqueous Potentiometric Titration
5a. CONTRACT NUMBER
5b. GRANT NUMBER
5c. PROGRAM ELEMENT NUMBER
6. AUTHOR(S)
LaShonda T. Cureton,* George Fountzoulas, and John J. La Scala
5d. PROJECT NUMBER
MMB104 5e. TASK NUMBER
5f. WORK UNIT NUMBER
7. PERFORMING ORGANIZATION NAME(S) AND ADDRESS(ES)
U.S. Army Research Laboratory
ATTN: RDRL-WMM-C
Aberdeen Proving Ground, MD 21005-5069
8. PERFORMING ORGANIZATION REPORT NUMBER
ARL-TR-6490
9. SPONSORING/MONITORING AGENCY NAME(S) AND ADDRESS(ES)
10. SPONSOR/MONITOR’S ACRONYM(S)
11. SPONSOR/MONITOR'S REPORT NUMBER(S)
12. DISTRIBUTION/AVAILABILITY STATEMENT
Approved for public release; distribution is unlimited.
13. SUPPLEMENTARY NOTES
*Oakridge Institute for Science and Education , Oak Ridge Association of Universities, P.O. Box 117, Oak Ridge, TN
37831-0117
14. ABSTRACT
The U.S. Department of Defense (DOD) has increased the use of polymers due to their lightweight nature and high
performance in composite materials, body armor, and military vehicles. Unfortunately, traditional polymers are petroleum-
derived, thus creating supply chain vulnerability. The DOD is looking to replace these petroleum-based polymers with less
costly and more “eco-friendly” alternatives. This research seeks to develop furan-based polymers as biobased alternatives to
nylon, Nomex, Kevlar, and other high-performance polyamides. U.S. Army Research Laboratory researchers have synthesized
bio-/furan-based polyamides. Characterizations of these polymers are difficult because of their insolubility in most solvents.
This work examines the use of potentiometric titration to measure the concentration of amine and carboxylic acid groups to
enable measurement of the number-average molecular weight of these polymers. The method was established by conducting a
series of sample titrations using the monomers and 1,6-hexamethylenediamine; succinic acid; 2,5-furandicarboxylic acid; and
adipic acid (0.100 g) in various solvents. 15. SUBJECT TERMS
titration, biobased, furan, polyamides, monomers
16. SECURITY CLASSIFICATION OF: 17. LIMITATION OF ABSTRACT
UU
18. NUMBER OF PAGES
34
19a. NAME OF RESPONSIBLE PERSON
John J. La Scala a. REPORT
Unclassified
b. ABSTRACT
Unclassified
c. THIS PAGE
Unclassified
19b. TELEPHONE NUMBER (Include area code)
410-306-0687
Standard Form 298 (Rev. 8/98)
Prescribed by ANSI Std. Z39.18

iii
Contents
List of Figures iv
List of Tables v
1. Introduction 1
2. Materials and Experimental Procedures 5
2.1 Synthesis of Furan-Based Polyamides ............................................................................5
2.2 Potentiometric Titration ..................................................................................................5
2.3 Materials ..........................................................................................................................6
2.4 Experimental ...................................................................................................................6
2.4.1 Non-Aqueous Potentiometric Titration of Amine With Perchloric Acid,
Standard Solution in Acetic Acid, (0.1 N).......................................................................6
2.4.2 Non-Aqueous Potentiometric Titration of Acid With Potassium Hydroxide,
Standard Solution in Isopropyl Alcohol, (0.1 M) ............................................................8
2.5 Model Titration Curve for Understanding Polyamide Titrations ..................................10
2.6 Size Exclusion Chromatography (SEC) ........................................................................10
2.7 Nuclear Magnetic Spectroscopy (NMR) .......................................................................11
3. Results and Discussion 11
3.1 Amine Titration .............................................................................................................11
3.2 Acid Titration ................................................................................................................18
3.3 Discussion .....................................................................................................................21
4. Conclusions 22
5. References 23
Distribution List 25

iv
List of Figures
Figure 1. Oil consumption for the United States, China, and India. ...............................................1
Figure 2. Historical perspective of raw materials. ..........................................................................2
Figure 3. Synthetic routes for development of furan derivatives. ...................................................3
Figure 4. Synthetic route for biobased furan polyamides. ..............................................................5
Figure 5. Model titration curves for blanks and samples. .............................................................10
Figure 6. Amine titrations of the blanks. ......................................................................................13
Figure 7. Amine titrations of 1,6-hexamethylenediamine in various solvents. ............................14
Figure 8. Amine titrations of biobased furan polyamides in DMF. ..............................................17
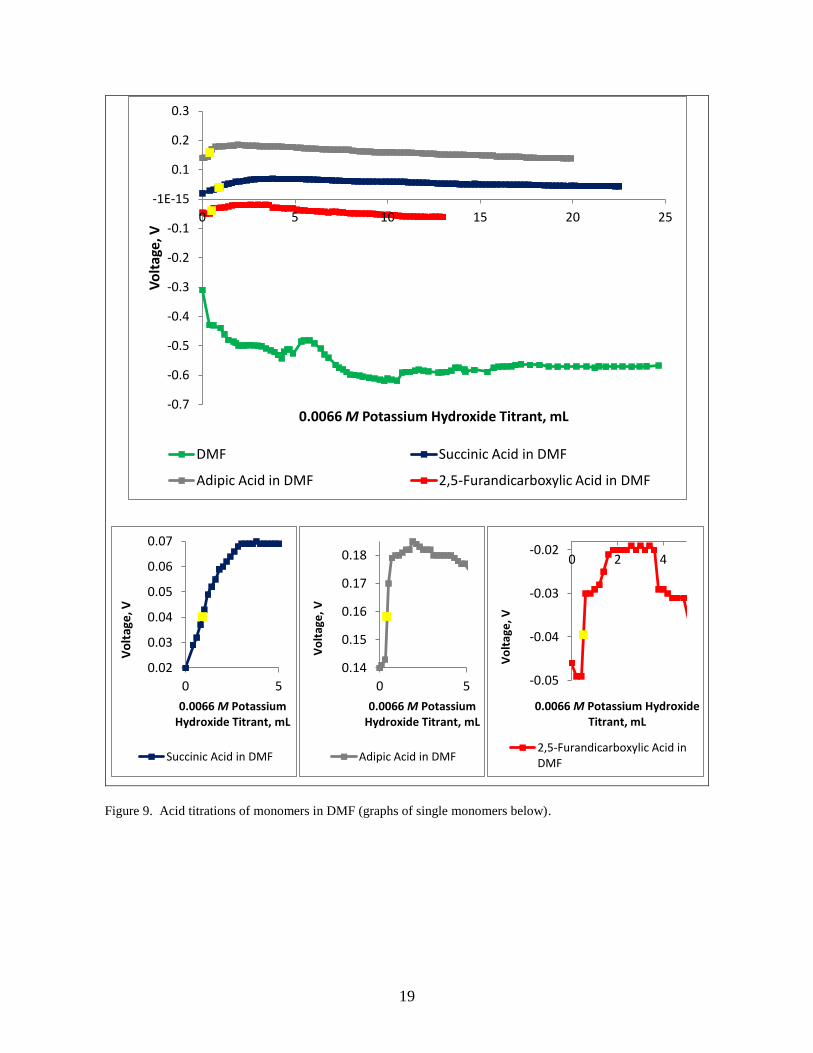
Figure 9. Acid titrations of monomers in DMF (graphs of single monomers below). .................19
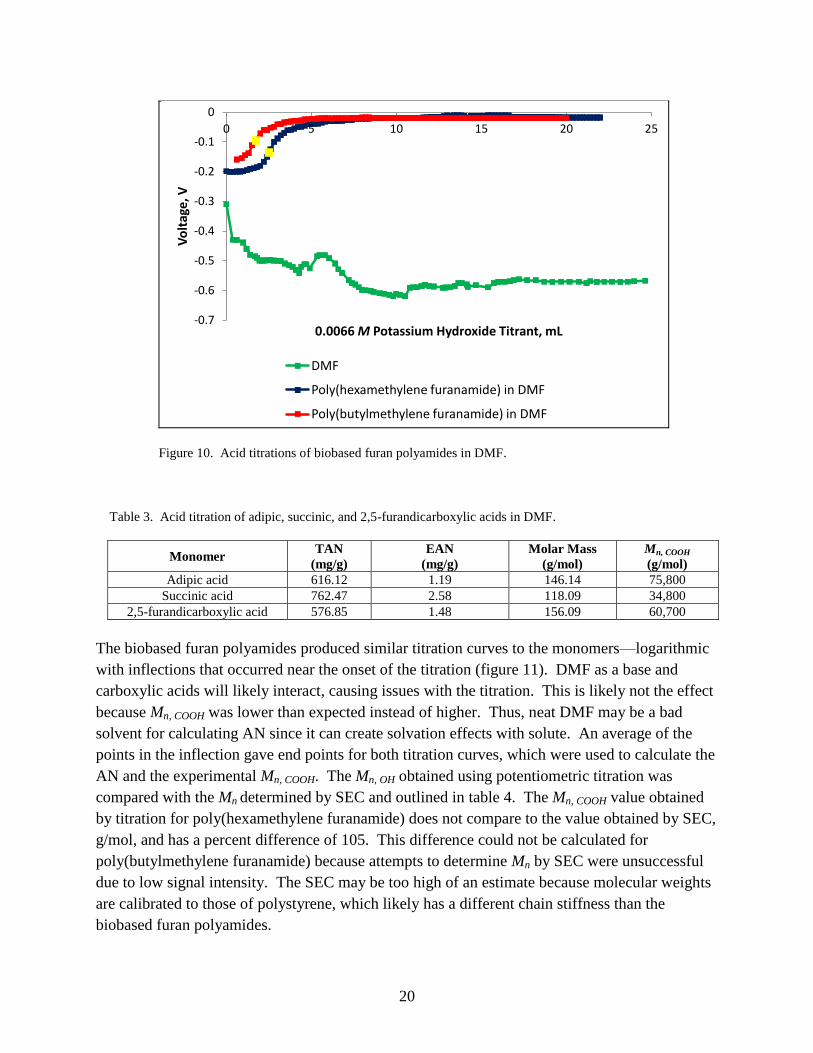
Figure 10. Acid titrations of biobased furan polyamides in DMF. ...............................................20

v
List of Tables
Table 1. Solvent properties and solubility. ...................................................................................12
Table 2. Amine titration of 1,6-hexamethylenediamine. ..............................................................16
Table 3. Acid titration of adipic, succinic, and 2,5-furandicarboxylic acids in DMF. .................20
Table 4. Acid titration of the polymers in DMF. ..........................................................................21

vi
INTENTIONALLY LEFT BLANK.

1
1. Introduction
The Department of Defense (DOD) uses high-performance composites and polymers in a host
of applications. The development of high-performance polymers and composites from
environmentally friendly resources has garnered much attention in recent years due to
environmental concerns, the unstable rise in petroleum oil prices, and, most notably, the
increased demand of petroleum (1). The increasing demand of oil is not due solely to U.S.
needs; developing industrial countries such as India and China (figure 1) have contributed
greatly (2). Several solutions have been proposed to account for the increased demand of
petroleum. One notable proposal suggests that the United States increase its own oil production
(3). However, increasing oil production would not be time and cost efficient, as it would take
around 10 years to set up new oil operations and another 20 years to obtain peak oil production.
Even at peak production, oil prices would drop only by $0.75 per barrel (3). Analysts have
predicted that around the year 2040 our petroleum-based energy economy will be phasing out
(figure 2), and it will be more economically competitive to use renewable materials than
petroleum (4). The more reasonable approach would be to reduce our dependency on petroleum
by encouraging research and manufacture of renewable resources (4).
Figure 1. Oil consumption for the United States, China, and India (2).

2
Figure 2. Historical perspective of raw materials (4).
The DOD has initiated programs and compliance requirements such as the Green Procurement
Program (5), Reduce/Eliminate Pollution for Compliant Composite Manufacturing and Repair,
and the Army Environmental Requirements and Technology Assessments. These programs are
designed to facilitate development of “green” materials and high-performance polymers and
reduce the amount of hazardous waste from the manufacturing process. To fulfill the goal of
reducing hazardous waste and producing high-performance materials from “green” materials,
any proposed green or biobased alternatives to petroleum-based materials must meet several
basic requirements before they can be used for high-performance materials and composites. The
biobased precursors must be obtainable in large quantities in a consistent quality from renewable
feedstocks, reasonably priced on the market, reactive in diverse reactions (6), and, most
important to the DOD, have properties that can be maintained in highly stressful environments,
such as solid rocket boosters or aviation and military structures (7).
Current DOD research seeks to develop biobased alternatives to nylon, Nomex, Kevlar, and
other high-performance polymers. To obtain comparable properties, we sought to develop
furan-based polyamides. Furan is a heterocyclic organic compound, consisting of a five-member
aromatic ring with four carbon atoms and one oxygen atom. Furan has been investigated in
chemistry syntheses for specialty chemicals and polymers (8, 9). Furan is an attractive
compound because it is chemically obtainable through the modification of glucose. Glucose can
be modified through a series of catalytic oxidation or hydrogenation processes to produce furan
derivatives with several functionalities (figure 3) (10). The major source of glucose is in plant
products like corn, which is an abundant renewable resource. The United States produced
approximately 320 million tons of corn from 2010 to 2011 (11), a sufficient amount to ensure the
availability of furan and many derivatives for large- and small-scale resins and polymers.

3
Figure 3. Synthetic routes for development of furan derivatives.

4
For step-growth polymers, like polyamides, end groups can consist of the reactive end group of
either or both monomers. In the case of polyamides, amine end groups will be present if an
excess of diamine is used in the polymerization, while the end groups would be carboxylic acids
if synthesized with an excess of diacid. Additionally, the polyamide can also have a mix of the
two end groups, acid and amine. This typically occurs when stoichiometry is nearly balanced or
if diffusion limitations severely reduce the polymerization rate. In all cases, the end groups can
be quantified and the number-average molecular weight, Mn, of the polymer can be determined
through titration, which is one method to quantify the end groups. Polymers such as nylon and
biobased furan polyamides are not soluble in aqueous solutions and must be titrated through a
non-aqueous potentiometric titration. Unlike aqueous titrations that use a visible indicator to
indicate the titration end point, non-aqueous titrations measure transitions in electrochemical
potential. Non-aqueous potentiometric titration can be a better measure of molecular weight than
light scattering or chromatographic methods for rigid non-random walk polymers (12). Non-
aqueous potentiometric titration has been well established in the literature and frequently used
for a host of polymers (13, 14). Considering the high level of expected rigidity for furan-based
polymers that limit the accuracy of other molecular weight measurements, it important to assess
non-aqueous potentiometric titration for molecular weight measurements of these polymers.
With non-aqueous potentiometric titration, a sample is dissolved in the non-aqueous solvent (a
polar or nonpolar solvent) and titrated with a concentrated solution of acid or base depending on
the test. The titration process is monitored via a glass and reference electrode (or a combination
electrode; a pH meter can also be used). The potential difference is plotted against the volume of
titrant, and an end point is determined from averaging the points in the inflection of the resulting
titration curve. Using a series of calculations, the Mn of a sample is determined. Non-aqueous
potentiometic titration is a relatively quick and proven technique providing more accurate results
than other methods for determining Mn through end group analysis.
This work examines the use of non-aqueous potentiometric titrations to measure the
concentration of amine and acid groups to calculate the number-average molecular weight of the
titration of biobased furan polyamides. The biobased furan polyamides that will be investigated
in this report are poly(butylmethylene furanamide) and poly(hexamethylene furanamide) in
addition to the monomers that constitute these polymers and model compounds to test the
methodology.

5
2. Materials and Experimental Procedures
2.1 Synthesis of Furan-Based Polyamides
Shown in figure 4, the biobased furan polyamides, poly(butylmethylene furanamide) and
poly(hexamethylene furanamide), were prepared through interfacial polymerization from
2,5-furandicarboxylic acid chloride (A) with varying chain-length aliphatic diamines (B), in this
case, 1,6-hexamethylene diamine or 1,4-diaminobutane. Interfacial polymerization is the process
in which the synthesis takes place in the interface between the organic phase (chloroform) and
the aqueous phase (15 wt% NaOH solution). Tetrabutylammonium bromide (TBAB) is used as
a phase transfer agent to keep the polymer in the organic phase during polymerization (15). The
entire polymerization process normally takes 15 h. The solid polymer was filtered and
thoroughly washed with water (200 mL) and acetone (100 mL). The biobased furan polyamides
were filtered and dried under vacuum at 105–120 °C.
Figure 4. Synthetic route for biobased furan polyamides.
2.2 Potentiometric Titration
A Keithley Electrometer (Model 610B) and a double-junction glass-bodied combination pH
electrode (Oakton WD-3580-04) were used to measure potential differences of various solutions.
A Hirschmann Solarus Electronic Burette was used to titrate the non-aqueous amine solutions
and a 25-mL glass burrette was used to titrate the non-aqueous acid solutions. Due to the
electrode sensitivity to the surrounding electromagnetic fields, all titrations were completed in a
chemical hood, which acted as a Faraday cage (a shield used to blocks external static and
nonstatic electric fields).
A series of non-aqueous potentiometric titrations was conducted on the monomers:
1,6-hexamethylenediamine, 1,4-diaminobutane, succinic acid, adipic acid, and
2,5-furandicarboxylic acid. Once optimized for the monomers, the potentiometric titrations were
performed on the poly(butylmethylene furanamide) and poly(hexamethylene furanamide). The
solvents used in this study were glacial acetic acid, isopropyl alcohol dimethyl sulfoxide
(DMSO), and dimethylformamide (DMF), which provide a baseline for extrapolation.
Poly(butylmethylene furanamide) and poly(hexamethylene furanamide) were dissolved in
DMFand titrated with 0.1-N perchloric acid in acetic acid and 0.1-M potassium hydroxide in
isopropyl alcohol to measure the concentration of amine and acid groups, respectively.
A B bio-based furan polyamides

6
2.3 Materials
Perchloric acid, standard solution in acetic acid (0.1 N), 1,4-diaminobutane,
1,6-hexamethylenediamine, adipic acid, succinic acid, potassium, hydrogen phthalate,
concentrated hydrochloric acid, and pH buffer solutions were purchased from Sigma-Aldrich.
DMF was purchased from Alfa Aesar. Phenolphthalein indicator was purchased from Ricca
Chemical Company. Lithium chloride was purchased from OmniPurr. The 2,5-
furandicarboxylic acid was purchased from AK Scientific Inc. Potassium hydroxide was
purchased from EMD Chemical Inc. All chemicals and reagents were used as received.
2.4 Experimental
2.4.1 Non-Aqueous Potentiometric Titration of Amine With Perchloric Acid, Standard
Solution in Acetic Acid, (0.1 N)
Amine titration measured the amount of perchloric acid (milliliters) needed to titrate a sample
amine (1 g) in solvent to an end point. The procedure used for titration of amines was from the
ASTM D 2896-05 Standard Test Method for Base Number of Petroleum Products by
Potentiometric Perchloric Acid Titration (Procedure B) (16). Titration measurements were
completed for: blank solvents, glacial acetic acid, DMSO/glacial acetic acid mixture, and DMF;
the monomer 1,6-hexamethylene diamine; and the biobased furan polyamides,
poly(butylmethylene furanamide) and poly(hexamethylene furanamide).
2.4.1.1 Potentiometric Titration of the Blank Solution
Glacial acetic acid (50 mL) was added to a 250-mL container equipped with a magnetic stirring
bar. The blank solution was titrated with 0.1-N perchloric acid solution and the potential
difference was measured and recorded. This procedure was used for the titration of
chlorobenzene, DMF, DMSO, and mixtures of glacial acetic acid with chlorobenzene, DMSO,
and DMF solvents using the same procedure.
2.4.1.2 Potentiometric Titration of the Monomer
1,6-Hexamtheylenediamine (0.06 g) was added to a 250-mL container with 50 mL of glacial
acetic acid and a magnetic stirring bar. The diamine solution was titrated to a minimum of
25 mL in increments of 0.5 mL with 0.1-N perchloric acid solution from an electronic burette,
and the potential difference was measured and recorded. The monomer (0.15 g) was also titrated
in DMF and mixtures of glacial acetic acid with chlorobenzene, DMSO, and DMF solvents using
the same procedure.
2.4.1.3 Potentiometric Titration of the Biobased Furan Polyamides
Furan polyamide, poly(hexamethylene furanamide) (0.104 g), was added to a 250-mL container
with 25 mL of DMF and a magnetic stirring bar. The diamine solution was titrated to a
minimum of 25 mL in increments of 0.2 mL with 0.1-N perchloric acid solution from an

7
electronic burette, and the potential difference was measured and recorded. This procedure was
also used for the titration of poly(butylmethylene furanamide) (0.097 g).
2.4.1.4 Equations for Nonaqueous Potentiometric Titration of Amine With Perchloric Acid
The end point of the titration can be used to calculate the experimental base number (EBN) of
the biobased furan polyamides and compared to the theoretical base number (TBN), which is the
actual number of amine end groups the polyamide should have based on the molar mass of the
monomer. ASTM D 2896-05 (16) expresses base number in terms of milligrams of potassium
hydroxide (KOH) per gram of sample. The equation for the Mn, NH2 is a variation of the EBN;
however, it does not incorporate the molar mass of the amine end group.
. (1)
Molar mass of one and two amine end groups is 16.03 g/mol and 32.06 g/mol, respectively.
, (2)
where
HClO4 solution used to titrate the sample to the end point of the titration curve, mL,
= volume (correction factor) corresponding to E for blank titration at same potential as sample,
mL,
= concentration of HClO4 solution, and
= mass of sample in solution, g.
Mn, NH2
, (3)
where
Mn, NH2 = molecular weight, g/mol,
= mass of sample in solution, g,
= volume of titrant, L,
F = volume of the blank, L, and
= concentration of titrant, mol/L.

8
2.4.2 Non-Aqueous Potentiometric Titration of Acid With Potassium Hydroxide, Standard
Solution in Isopropyl Alcohol, (0.1 M) (11)
Acid titration measured the amount of potassium hydroxide (milliliters) needed to titrate a
sample acid (1 g) in solvent to an inflection. The procedure used for titration of acid was from
ASTM D 664-11a, Procedure B (17). Tests were completed for: blank solvents, isopropyl
alcohol, and DMF; the monomer 1,6-hexamethylene diamine; and the biobased furan
polyamides, poly(butylmethylene furanamide) and poly(hexamethylene furanamide).
2.4.2.1 Standardization of the Titrant Potassium Hydroxide Solution
Deionized (DI) water (400 mL) was gently boiled for 5 min to remove CO2. Potassium
hydrogen phosphate (KHP) (0.064 g) was added to 100 mL of the cooling DI water in a glass
beaker. After the solution cooled completely, four drops of phenolphthalein indicator and a
magnetic stirring bar were added to the beaker. The KHP solution was titrated with the KOH
standard solution in increments of 0.2 mL using a glass burrette. The voltage of each increment
was recorded and the titration ended 6 mL after the end point was detected. Standardization of
the KOH standard solution was calculated using equation 4 and calculated to be 0.0066 M
(6.6 mM).
,
, (4)
and
.
2.4.2.2 Potentiometric Titration of the Blank Solution
Isopropyl alcohol (50 mL) was added to a 250-mL container equipped with a magnetic stirring
bar. The blank solution was titrated in increments of 0.2 mL with 6.6-mM KOH solution using a
glass burrette, and the potential difference was measured and recorded. This procedure was used
for the titration of DMF solvent.
2.4.2.3 Potentiometric Titration of Monomer
Adipic acid (0.1 g) was added to a 250-mL beaker containing a magnetic stirring bar and 25 mL
of isopropyl alcohol. The acid solution was titrated to a minimum of 20 mL in increments of
0.2 mL with 6.6 mM KOH solution using a glass burrette, and the potential difference was
measured and recorded. This procedure was used for the titration of monomers, succinic acid
(0.1035 g), 2,5-furandicarboxylic acid (0.1002 g), and adipic acid (0.100 g) in DMF solvent.
9
2.4.2.4 Potentiometric Titration of the Biobased Furan Polyamides
Furan polyamide, poly(hexamethylene furanamide) (0.097 g), was added to 25 mL of DMF in a
250-mL container equipped with a magnetic stirring bar. The diamine solution was titrated to a
minimum of 25 mL in increments of 0.5 mL with 6.6-mM KOH solution from a glass burrette,
and the potential difference was measured and recorded. This procedure was also used for the
titration of poly(butylmethylene furanamide) (0.103 g).
2.4.2.5 Equations for Non-Aqueous Potentiometric Titration of Acid With KOH
In the following series of equations, the end point of the titration can be used to calculate the
experimental acid number (EAN) of the biobased furan polyamides and compared to the
theoretical acid number (TAN), which is the actual number of acid end groups the polyamide
should have based on the molar mass of the monomer. ASTM D 664-11a (17) expresses the AN
in terms of milligrams of KOH per gram of sample. The equation for the Mn, OH is variation of
the EAN; however, it does not incorporate the molar mass of the acid end group, 90.04 g/mol.
. (5)
Molar mass of one and two carboxylic acid end groups are 45.02 and 90.04 g/mol, respectively.
, (6)
where
= KOH solution used to titrate the sample to the end point of the titration curve, mL,
= volume (correction factor) corresponding to E for blank titration at same potential as sample,
mL,
C = concentration of KOH solution, and
= mass of sample, g.
Mn,COOH
, (7)
where
Mn, COOH = molecular weight,
= mass of sample, g,
= volume of titrant, L,
F = volume (correction factor) of the blank, L, and
= concentration of titrant, mol/L.

10
2.5 Model Titration Curve for Understanding Polyamide Titrations
Figure 5 exemplifies titration curves that can be produced in this study. There are two cases that
can be present in this study, calculating the base number (BN) or the acid number (AN) of a
sample with a correction factor or without a correction factor. The correction factor is the
adjustment made to the calculation of the samples to account for deviations in the sample
solution. A blank solution is titrated to an inflection where the end point is determined; the end
point, F, is the correction factor. If the blank does produce an inflection, then F = 0. If the blank
does have an inflection, F is used as a correction factor in the BN, the AN, or the Mn
calculations. E is the end point determined from the volume needed to titrate a sample to an
inflection.
Figure 5. Model titration curves for blanks and samples.
2.6 Size Exclusion Chromatography (SEC)
The SEC system used in this study was a Waters system composed of a Waters 717 plus
Autosampler held at 40 °C, Waters 510 Pump, and Waters 410 Refractive Index Detector held at
40 °C. Two columns (300 × 7.6 mm) held at 40 °C were used to separate molecular weights:
Phenogel 5μ 104 Å and Phenogel 5μ 500Å. The solvent used was helium-purged DMF with LiCl
salt at 0.06 M, pumped at 1 mL/min. The relative molecular weights of the polyamides were
determined by calibration with polystyrene narrow molecular weight standards. There was a mix
of four standards in DMF with 0.06 M LiCL: 51,000, 20,400, 5050, and 580 amu. Standard
580 amu had to be rejected from calculations due to blockage by the solvent front. Because this
Sample end point (volume);E = 11.25
Sample end point (volume);E = 7.80
Blank has no Inflection;
F = 0
Blank end point (volume);F = 2.00
0.0
0.1
0.2
0.3
0.4
0.5
0.6
0.7
0.8
0 5 10 15 20 25
Vo
ltag
e, V
0.1 N Titrant, mL
Titration of Sample #1 Titration of Sample #2
Titration of Blank #1 Titration of Blank #2

11
molecular weight is far outside the desired molecular weights for the polyamides, there was little
concern with rejecting this standard. This standard mix was injected (50 μL) every four
unknown injections and then compared. Results were satisfactory for the analysis (R2= 0.998).
The furan polyamide samples were prepared by dissolving them in DMF with LiCl salt and then
filtering them using PTFE syringe filters. All sample concentrations were approximately 1 g/L.
Injection volume was 50 μL.
2.7 Nuclear Magnetic Spectroscopy (NMR)
1H NMR spectra were obtained using a Bruker 600-MHz spectrometer at 25 °C. Spectra for the
monomers were obtained in a 0.1%–0.5% deuterated methanol solution and the polymers were
obtained in a 0.1%–0.5% deuterated DMF solution.
3. Results and Discussion
ASTM D 2896-05 (16) and D 664-11a (17) were standard test methods for measuring the BN
and AN, respectively, of petroleum products. In this work, procedure B of the standards were
used as a reference for conducting the titration experiments toward calculating BN and AN for
the biobased furan polyamides to obtain molecular weight. While procedure A produced
reasonably reproducible and repeatable titration curves in non-aqueous solvents, procedure B
was used because a lower sample size, a maximum of 10 g as opposed to 20 g, could be used.
The sample size used in these titrations afforded higher sample concentrations because less
solvent was used in procedure B, i.e., 60 mL as opposed to 120 mL in procedure A. Otherwise,
both procedures are the same—the titrant (0.1 N HClO4), titration solvent (chlorobenzene), and
instrumental setup.
The titration curves represent potentiometric titrations of amine followed by titrations of acid.
For both sets of potentiometric titrations, titrations of solvent blanks were performed and the
measurements were used as correction factors in the calculation of the BN and AN of the furan
nylon samples. The BN/AN of the monomers was measured to establish a proof of concept of
the standard test methods. The titration curves of the solvent blanks, monomers, and the
subsequent polymers are shown in figures 5–12. The curves were examined for an inflection in
which an end point can be determined. The inflection is indicating the smallest amount of titrant
added that is sufficient to fully neutralize the analyte.
3.1 Amine Titration
The biobased furan polyamides are not soluble in chlorobenze (table 1), which is the solvent of
choice in ASTM D 2896-05 for BN potentiometric titration. Therefore, a goal of this
experimental work was to identify solvents that dissolve the polymer and allow for accurate
molecular weight measurement through potentiometric titration. A series of solvent blank

12
titrations were conducted in glacial acetic acid, chlorobenzene, DMF, DMSO, and mixtures of
glacial acetic acid with chlorobenzene, DMSO, and DMF. The 0.1-N perchloric acid in acetic
acid solution, a strong acidic solution, was used as the titrant. The blanks were measured to
ensure that the solvent in the solution used did not contribute to the overall titration
measurements. Glacial acetic, particularly, was used per ASTM D2896-05 to help improve
solubility of the basic samples in non-aqueous solvents and is a commonly used titration solvent
to provide distinct potential curves with clear end points (18).
Table 1. Solvent properties and solubility.
Solvent
Dielectric
Constant, ε,
(19)
Type of Solvent 1,6-HMDA Adipic Acid Polyamide
Chlorobenzene 5.62 Nonpolar + — —
Acetic acid 6.20 Polar protic + + —
Isopropyl
alcohol 20.18 Polar protic + + —
DMF 38.25 Polar aprotic + + +
DMSO 47.24 Polar aprotic + + +
Notes: + = soluble at RT; — = insoluble at RT.
The titrations showed differing potential curves, as illustrated in figure 6. Glacial acetic acid
reflected a steady positive potential with no inflection. This could be related to the subtle change
in pH as it relates to the titrant and the blank solution. Acetic acid has a pH of 2.4 and perchloric
acid in glacial acetic acid has a pH of <1, which means there a very small change in the pH and
thus a small change in potential difference to be observed. Similarly, the titration curves of
chlorobenzene and DMSO increased within the first 1 to 2 mL and then leveled off to a
consistent voltage at 25 mL. However, for DMF, the titration curve was logarithmic, yielding a
negative potential. Table 1 lists the solvent properties of the solvents in this study; there are
major differences in polarity and the dielectric properties of DMF and acetic acid. Two
situations could be taking place in the titration of DMF blank: (1) hydrolysis by the presence of
a strong acid (perchloric acid) to form formic acid and dimethylamine (20) or (2) the lack of
solvation of the anions in solution. In the first case, the pH difference would not be significant
enough to invoke a potential difference. However, no indication of hydrolysis took place. The
lack of solvation would be due to the difference in the dielectric constants. During titration, the
ions are not solvated to initiate a potential difference. Using DMF as solvent for dissolving the
polymers would affect potential difference (a negative value) when titrating with the strong acid.

13
Figure 6. Amine titrations of the blanks.
Titrations were also done on solvent mixtures with glacial acetic acid to establish a thorough
evaluation of the blanks and solvent interactions. Chlorobenzene/glacial acetic acid mixture was
very inhomogeneous, as the solvents are of different polarities (table 1). Despite the
inhomogeneuity, through the titration, the titration curve had a consistent voltage (0.55999 V)
lying between glacial acetic acid and chlorobenzene blanks. DMSO/glacial acetic acid mixture
produced a logarithmic curve with a 0.75-mL (0.09-V) end point before the curve leveled off.
This inflection was used as F (correction factor) in all calculations using the DMSO/glacial
acetic acid blank. The DMF/glacial acetic acid mixture displayed a titration curve different from
that of the DMF blank. The curve was positive and closely resembles glacial acetic acid of a
lower voltage measurement. Titration of the mixtures showed consistent results; they all fell
between glacial acetic acid and the solvent with no inflection other than DMSO/glacial acetic
acid.
The TBN of 1,6-hexamethylenediamine is 275.90 mg/g, as determined by equation 2, and the
molar mass of the monomer is 116.2 g/mol. These values were compared to the EBN
determined by equation 3 and the Mn, NH2 calculated using equation 4 in the various solvents. Figure 7 shows the titration of 1,6-hexamethylenediamine monomer in various solvents. For
these samples, inflections were observed and the end points are indicated by a yellow mark at the
center of the inflection of the titration curves.
-0.7
-0.5
-0.3
-0.1
0.1
0.3
0.5
0.7
0 5 10 15 20 25
Vo
ltag
e, V
0.1 N Perchloric Acid Titrant, mL
Glacial Acetic Acid Chlorobenzene and Glacial Acetic Acid
Chlorobenzene DMSO and Glacial Acetic Acid
DMSO DMF and Glacial Acetic Acid
DMF
End point of DMSO/glacial
acetic acid (volume); E = 0.75

14
Figure 7. Amine titrations of 1,6-hexamethylenediamine in various solvents.
Titration of the monomer in glacial acetic acid showed a distinct sigmoidal curve with an end
point at 11.25 mL. The EBN and Mn, NH2 for the monomer in glacial acetic acid were calculated
without using the glacial acetic acid blank as a correction factor (F in equations 2 and 3) because
the titration curve of the glacial acetic acid blank was a linear plot with no inflection and
overlays the monomer titration curve.
Not as distinctly defined as the monomer/glacial acetic acid titration, the titration of the
monomer in DMSO/glacial acetic acid mixture had a broad sigmoidal curve with an end point at
7.80 mL. The EBN and the Mn, NH2 for the monomer in DMSO/glacial acetic acid mixture were calculated two ways. The first calculation was done using the blank as a correction factor
because a minor inflection was shown in the DMSO/glacial acetic acid blank (around 0–0.15 V),
and it is important to adjust the calculation. The second was done without using the correction
factor to determine whether the variation would be a significant factor in calculating the EBN
and the Mn, NH2or whether using the correction factor provides a more accurate measurement.
-0.2
-0.1
0.0
0.1
0.2
0.3
0.4
0.5
0.6
0.7
0 5 10 15 20 25
Vo
ltag
e, V
0.1 N Perchloric Acid Titrant, mL
1,6-hexamethylenediamine in Glacial Acetic Acid
1,6-hexamethylenediamine in Chlorobenzene and Glacial Acetic Acid
1,6-hexamethylenediamine in DMSO and Glacial Acetic Acid
1,6-hexamethylenediamine in DMF and Glacial Acetic Acid
1,6-hexamethylenediamine in DMF
End point #2 of monomer in
chlorobenzene/glacial acetic
acid (volume); E = 12.41
End point #1 of monomer in
chlorobenzene/glacial acetic
acid (volume); E = 7.89
15
Titration of 1,6-hexamethylenediamine monomer was also conducted in chlorobenzene/glacial
acetic acid and DMF/glacial acetic acid mixtures. In chlorobenzene/glacial acetic acid mixture,
two inflections were observed, indicative of the inhomogeneuity and the preference of the
monomer solubility in glacial acetic acid. Based on the solution properties observed at
6.75–8.0 mL, the first inflection is likely that of the emulsion, in which monomer/glacial acetic
acid solution is unequally dispersed. The second inflection is a keen reflection of the monomer
titration in glacial acetic acid, as it is very close to that of the monomer glacial acetic acid
titration. Here, solid precipitation from the solution is observed at 11.09 and 12.24 mL; the
needle on the voltmeter “jumped,” which likely signaled the onset of inflection.
Titration of 1,6-hexamethylenediamine were also done in DMF/glacial acetic acid mixture and in
DMF. The titration curve for 1,6-hexamethylenediamine in DMF/glacial acetic acid exhibited a
broad sigmoidal curve like the DMSO/glacial acetic acid result, but with a higher end point at
10.10 mL. Opposite this result, titration in DMF yielded a completely different curve from the
previous solvents (figure 7). The curve tapers down to negative potential values, resulting in a
negative sigmoidal curve. It is important to acknowledge that 1,6-hexamethylenediamine was
only slightly soluble in DMF, and the monomer only showed solubility after approximately
4.0 mL of titrant was added to the DMF solution. This insolubility would be one reason why no
inflection is observed while the curve is positive. It is likely that only until the monomer is
soluble in acetic acid that a change in potential is observed, though not enough to shift the curve
in the positive direction. The results further confirm that the lack of solvation of the ion pairs in
DMF solution will affect the potential difference (a negative value) when titrating with the strong
acid. Since DMF was used without a co-solvent like glacial acetic acid, negative potential values
(below 0 V) would be observed during the titration. Despite solubility, another notion for this
observation is that DMF is a polar aprotic solvent with a moderate dielectric constant and will
likely have no solvating power for dissociating –NH2 anions formed in solution. Regardless of
this fact, an end point for the titration was observed at about 13 mL (and –0.02 V), and EBN and
the Mn, NH were calculated without using the blank as a correction factor. It is wise to conclude
the titration of the polymers in DMF will likely yield negative potential values creating
analogous titration curves to the blank and monomer in DMF.
The data from these amine titrations are outlined in table 2. Titration of 1,6-hexamethylenediamine in glacial acetic acid mixture yielded an EBN of 224 mg/g and a Mn, NH2 of 143 g/mol. Similar to
these results, the second end point from the titration of 1,6-hexamethylenediamine in
chlorobenzene/glacial acetic acid mixture yielded an EBN of 278 mg/g, which is closer to the
TBN (275.90 mg/g) than all of the values obtained from the other titrations. Also, the Mn, NH2 (115 g/mol) calculated from this titration is within 1% error of the known molecular weight of
1,6-hexamethylenediamine. From the latter results, it is likely the titration was another attempt
at titrating 1,6-hexamethylenediamine in glacial acetic acid. Upon addition of 0.1-N perchloric
acid in acetic acid, the monomer was becoming more soluble in glacial acetic acid and the
amount of chlorobenzene had less of an effect on the solution properties (i.e., emulsion
16
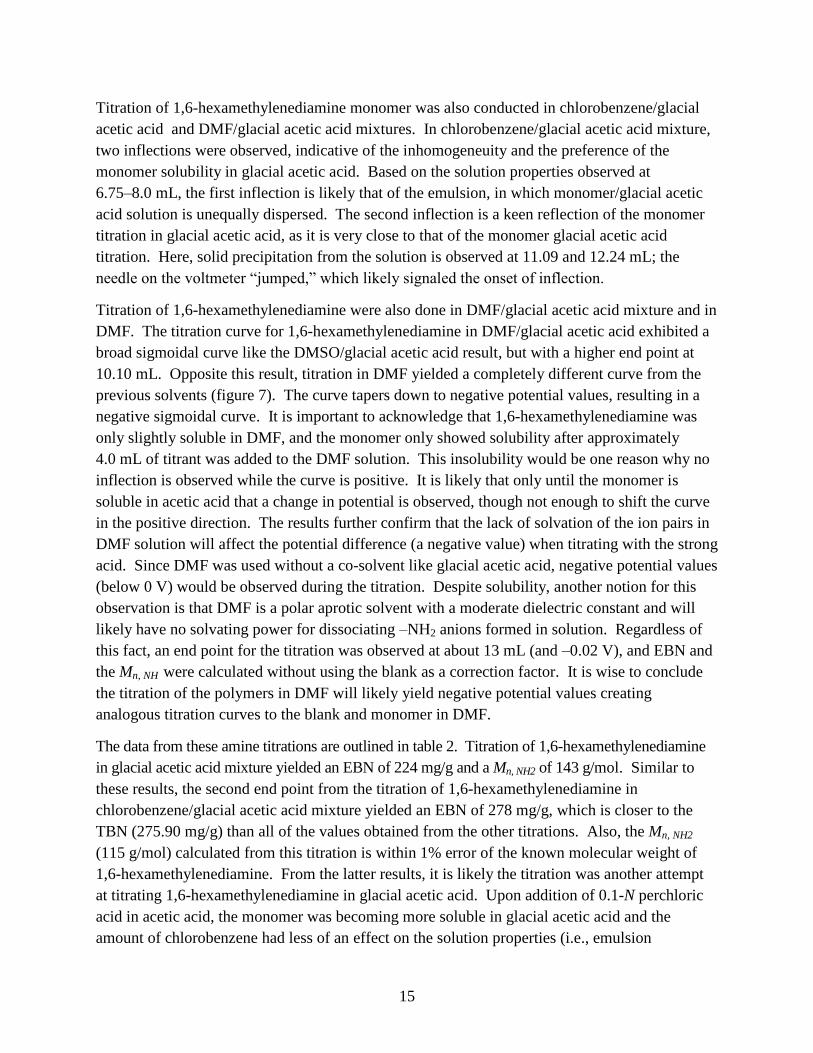
formation). Again, the first end point of this titration is an obvious titration of the dispersed monomer and glacial acetic acid solution, which is why the percent errors for EBN and Mn, NH2
are highest for the solvent/glacial acetic acid mixture titrations.
Table 2. Amine titration of 1,6-hexamethylenediamine.
Solvent EBN
(mg/g) % Error
Mn, NH2
(g/mol) % Error
Glacial acetic acid 224 19 143 23
DMSO/glacial acetic acid — — — — with F (correction factor) 155 44 207 78
without F (correction factor) 204 26 157 35
Chlorobenzene/glacial acetic acid — — — — End point no. 1 177 36 181 56
End point no. 2 278 1 115 1
DMF/glacial acetic acid 230 17 139 20
DMF 142 48 225 94
The 1,6-hexamethylenediamine in DMSO/glacial acetic acid and DMF/glacial acetic acid
mixtures produced similar results, as indicated by their nearly identical sigmodial curves. Using
the blank DMSO/glacial acetic acid mixture as an F (correction factor) did not help improve the
calculation of the EBN and the Mn, NH2; in fact, use of the correction factor made the percent error
significantly higher. In this case, the inflection identified is not an actual representation of the
blank titration.
The last result is the monomer in DMF titration. This titration resulted in a 142-mg/g EBN,
which is a 48% error of the TBN. Additionally, calculation of the Mn, NH2 produced a value twice
the molecular weight of 1,6-hexamethylenediamine. These results indicate that DMF is not an
ideal solvent to use for amine of titration.
Titration of 1,6-hexamethylenediamine in glacial acetic acid is a perfect example of the kind of
titration curve the monomers and polymers should produce. The curve is sigmoidal and
produces an inflection, which can be used to calculate EBN and Mn, NH2. In addition, the titration
of the blank shows no inflection and would not be required for correction. In this case, glacial
acetic acid would be an ideal solvent to use for the titration of the polymers; however, the
polymers in this study were soluble only in DMSO and DMF. Initial attempts to measure the
EBN and Mn, NH2 of the polymer in DMSO/glacial acetic acid mixture yielded curves that
resembled the blank solution with no inflection, which could be an attributed to the insolubility
of the polymer in glacial acetic acid. Therefore, these titrations were aborted and the amine
titrations of the polymers were conducted in DMF. Titrations were not conducted in DMSO
since titrations of the monomers in DMF suggest there would be no change in the titration
results.

17
As expected, DMF influences the titration results observed in the titration of the polymers
(figure 8). Both polymer titrations yield negative logarithmic curves with no inflection. They do
show, however, an apparent change in the slope, which could be an indication of a change in the
pH. Again, it is important to note the poor solvating power of DMF toward the polyamide in
solution. In addition, these polymers could have a low concentration of amine end groups, which
suggests the molecular weights of the polymers are greater than the size of oligomers (a
molecule that has a few monomer units). However, the data for these titrations are inconclusive
and cannot be accurately described because there is no confidence in the titration of the
1,6-hexamethylenediamine monomer previously discussed.
Figure 8. Amine titrations of biobased furan polyamides in DMF.
-0.4
-0.3
-0.2
-0.1
0
0.1
0.2
0.3
0.4
0.5
0 5 10 15 20 25Vo
ltag
e, V
0.1 N Perchloric Acid Titrant, mL
DMF
Poly(hexamethylene furanamide) in DMF
Poly(butylmethylene furanamide in DMF
18
3.2 Acid Titration
The biobased furan polyamides are not soluble in isopropyl alcohol (table 1), which is the
solvent of choice in ASTM D 664-11a for AN potentiometric titration. Therefore, a goal of this
experimental work was to identify solvents that dissolve the polymer and allow for accurate
molecular weight measurement through potentiometric titration.
The non-aqueous potentiometric titration of acid showed different results than the amine
titrations. Titrations of the isopropyl alcohol blank and adipic acid are shown in figure 9.
Isopropyl alcohol produced a titration curve with an increasing voltage from zero over the course
of the titration and no inflection. There is no significant change in the pH of the blank, and the
titrants are essentially equivalent throughout the titration. Adipic acid monomer in isopropyl
alcohol was titrated in the acid titration. This plot was a sigmoidal curve that started at positive
values but then descended to negative values with an end point at 10.5 mL. Based on this end
point determined from the adipic acid titration in isopropyl alcohol, the EAN (31 mg/g) is
significantly lower than the TAN (616.12 g/mol), and the Mn, COOH (2990 g/mol) is significantly
higher than the known molar mass.
Because the polymers were insoluble in isopropyl alcohol, adipic acid was titrated in DMF
(figure 9), a solvent in which the polymers are soluble (table 1). By comparison, the titration
curves were completely different from that of adipic acid in isopropyl alcohol and in DMF
(figure 10) and produced EAN (1.19 mg/g) and Mn, COOH (75,800 g/mol) that are again severely
different from expected values. It is expected that titration in the different solvents would
produce different titration curves as the dielectric constants and the solvent properties between
DMF and isopropyl alcohol are different; however, there is no simple answer as to why titration
in these solvents produce EAN and Mn, OH values that are considerably incomparable.
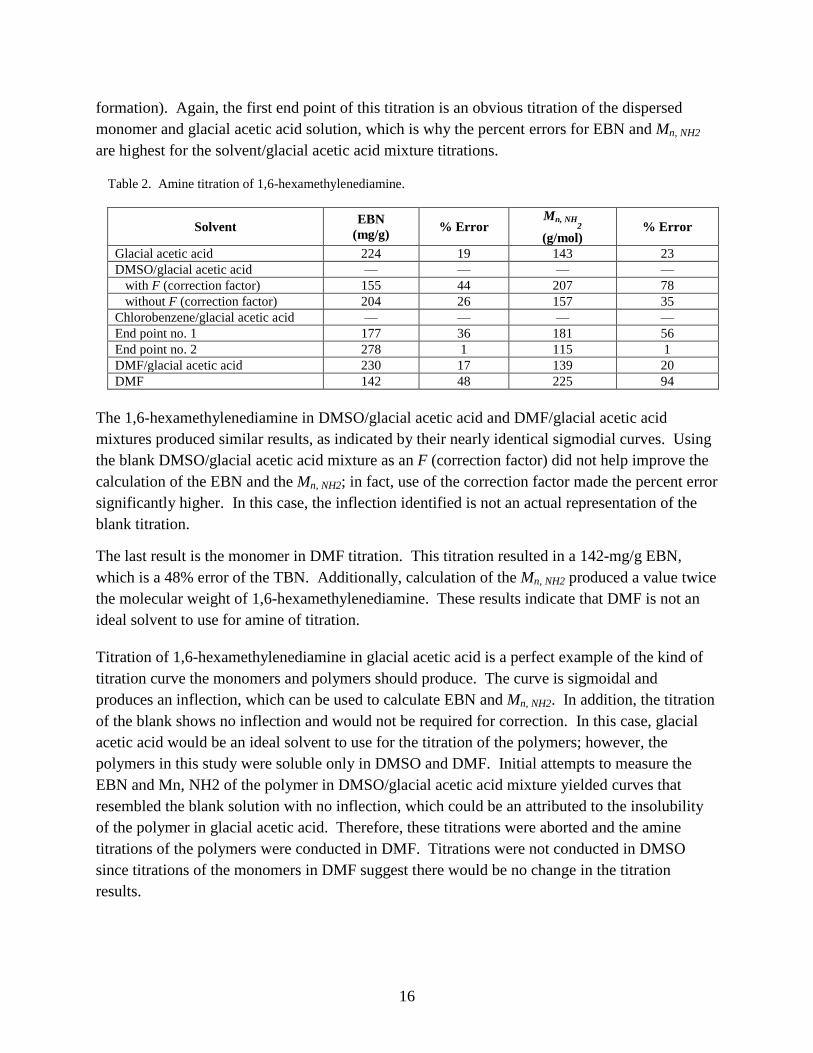
Titrations of other monomers, succinic and 2,5-furandicarboxylic acids in DMF, produced
similar titration curves: logarithmic with ill-defined inflections, as with the adipic acid in DMF
(figure 9). At the beginning of the titration, the curve ascended for a short time before leveling
off. An end point was determined by taking an average of the points in the inflection of the
curve. Using the end point, the TAN, EAN, and the molecular weights of the monomers were
determined by equations 5–7; the data is outlined in table 3. Thus, acid titration of adipic,
succinic, and 2,5-furandicarboxylic acids in DMF proved to be unsuccessful in obtaining
comparable results. The differences between the EANs were more than two orders of magnitude
too low, and the Mn, OH calculated for these monomers were orders of magnitude higher than the
known molar mass.
19
Figure 9. Acid titrations of monomers in DMF (graphs of single monomers below).
-0.7
-0.6
-0.5
-0.4
-0.3
-0.2
-0.1
-1E-15
0.1
0.2
0.3
0 5 10 15 20 25
Vo
ltag
e, V
0.0066 M Potassium Hydroxide Titrant, mL
DMF Succinic Acid in DMF
Adipic Acid in DMF 2,5-Furandicarboxylic Acid in DMF
0.02
0.03
0.04
0.05
0.06
0.07
0 5
Vo
ltag
e, V
0.0066 M Potassium Hydroxide Titrant, mL
Succinic Acid in DMF
0.14
0.15
0.16
0.17
0.18
0 5
Vo
ltag
e, V
0.0066 M Potassium Hydroxide Titrant, mL
Adipic Acid in DMF
-0.05
-0.04
-0.03
-0.020 2 4
Vo
ltag
e, V
0.0066 M Potassium Hydroxide Titrant, mL
2,5-Furandicarboxylic Acid in DMF
20
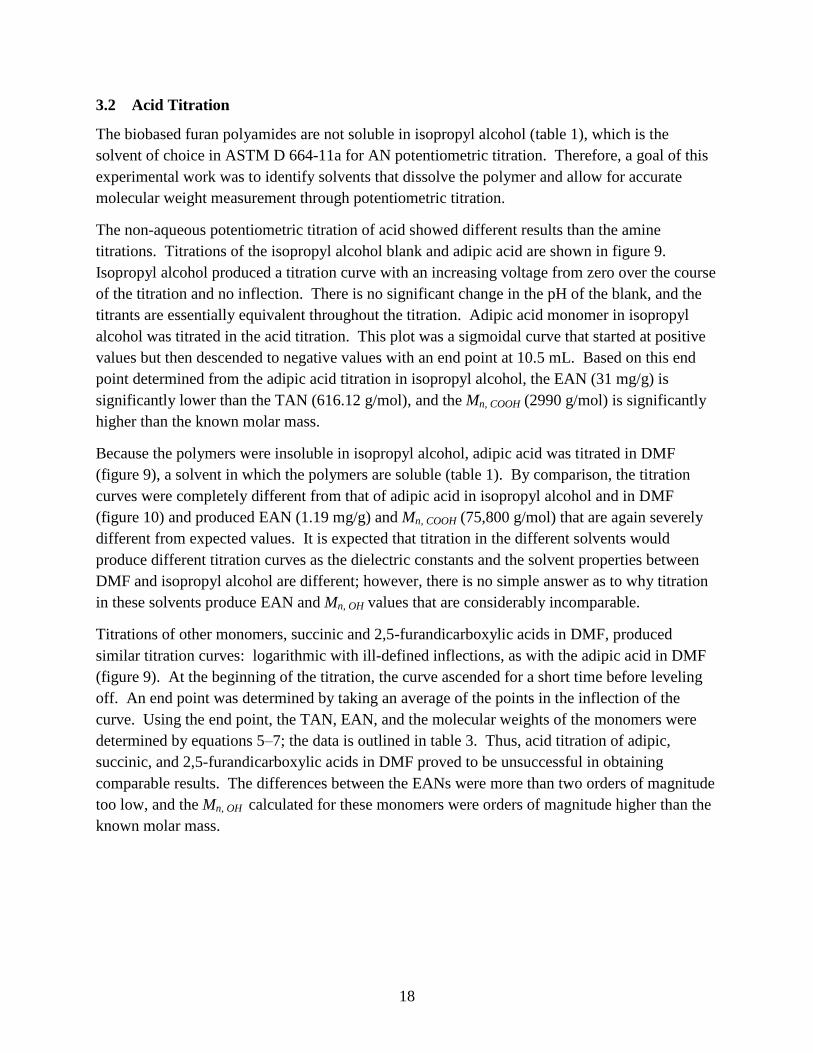
Figure 10. Acid titrations of biobased furan polyamides in DMF.
Table 3. Acid titration of adipic, succinic, and 2,5-furandicarboxylic acids in DMF.
Monomer TAN
(mg/g)
EAN
(mg/g)
Molar Mass
(g/mol)
Mn, COOH (g/mol)
Adipic acid 616.12 1.19 146.14 75,800
Succinic acid 762.47 2.58 118.09 34,800
2,5-furandicarboxylic acid 576.85 1.48 156.09 60,700
The biobased furan polyamides produced similar titration curves to the monomers—logarithmic
with inflections that occurred near the onset of the titration (figure 11). DMF as a base and
carboxylic acids will likely interact, causing issues with the titration. This is likely not the effect
because Mn, COOH was lower than expected instead of higher. Thus, neat DMF may be a bad
solvent for calculating AN since it can create solvation effects with solute. An average of the
points in the inflection gave end points for both titration curves, which were used to calculate the
AN and the experimental Mn, COOH. The Mn, OH obtained using potentiometric titration was
compared with the Mn determined by SEC and outlined in table 4. The Mn, COOH value obtained
by titration for poly(hexamethylene furanamide) does not compare to the value obtained by SEC,
g/mol, and has a percent difference of 105. This difference could not be calculated for
poly(butylmethylene furanamide) because attempts to determine Mn by SEC were unsuccessful
due to low signal intensity. The SEC may be too high of an estimate because molecular weights
are calibrated to those of polystyrene, which likely has a different chain stiffness than the
biobased furan polyamides.
-0.7
-0.6
-0.5
-0.4
-0.3
-0.2
-0.1
0
0 5 10 15 20 25
Vo
ltag
e, V
0.0066 M Potassium Hydroxide Titrant, mL
DMF
Poly(hexamethylene furanamide) in DMF
Poly(butylmethylene furanamide) in DMF

21
Table 4. Acid titration of the polymers in DMF.
Polymer AN
(mg/g)
Mn, COOH (g/mol)
Mn (g/mol) by SEC % Difference
Poly(hexamethylene
furanamide) 5.02 12,000 39,000 105
Poly(butylmethylene
furanamide) 0.0051 17,900
Undetermined; estimated
Mw of 100,000 —
In addition to SEC data, attempts to quantify amine end groups via NMR were unsuccessful, as
the NMR trace showed no visible intensity of amine end groups in the spectrum. This
observation is consistent with the attempts to determine amine end group by titration.
According to Ibieta et al. (14), to accurately determine molecular weight of a polymer via
potentiometric titration, Mn, titration, the molecular weight of all end groups present in the
polymer must be calculated and incorporated into equation 8.
. (9)
Because Mn, NH2 of both polymers could not be obtained from potentiometric titration, a less
accurate measure of Mn, titration is determined. Thus, there is confidence with Mn, SEC simply
because the Mn, COOH gives a value nearly half the amount of the Mn, SEC. This would also prove
that non-aqueous potentiometric titration was useful in calculating Mn to a limited extent of
confidence.
3.3 Discussion
Non-aqueous potentiometic titration can provide more accurate end group analysis than
conventional methods that employ indicators, especially if a pH meter is used. According to the
ASTM standards, the non-aqueous potentiometic titration setup included a voltmeter and a pH
meter. There were a few variances to the setup and method employed in this work; for instance,
the voltmeter used in the experiment was not digital and had little to no resistance to other the
electromagnetic fields in the room (i.e., the air conditioner). The voltmeter did not have a pH
meter attached; therefore, the pH was not monitored throughout the titration process. Amine
titration of 1,6-hexamethylenediamine in various solvents proved that tracking pH would have
provided a better understanding of the solvent effects encouraging the shift in the titration curve,
particularly while using DMF as a solvent. Additionally, no Faraday cage was used in the
experimental setup, so the titrations were conducted inside the chemical hood. The voltmeter
was still sensitive to electromagnetic fields (i.e., the air conditioner) and other movements
around the chemical hood, which caused the needle on the voltmeter to fluctuate, making it
difficult to precisely read the measurements.

22
4. Conclusions
The ASTM standards used chlorobenzene (amine titration) and toluene, isopropyl alcohol, and
chloroform (acid titration) as the solvent. Since the biobased furan polyamides were not soluble
in these solvents, DMF was one of the few potential solvents. The limited solubility made it
difficult to predict the results of the titration curve compared to the results in the ASTM
standard. Also, DMF is not an ideal solvent for the titration procedure to produce accurate
measurements of the monomers and the polyamides. Based on the amine titration curve
produced from the 1,6-hexamethylenediamine monomer, if the polymers were soluble in glacial
acetic acid, the Mn, NH2 of the polymers could have been determined, affording an accurate
measure of the Mn, titration. Similarly, the solvent conditions used in the acid titrations did not
allow for accurate measurements of both the monomers and polyamides, despite calculating a
molecular weight value that was 105% different from the value calculated through SEC.

23
5. References
1. U.S. Environmental Protection Agency. http://www.epa.gov/wastes/nonhaz/industrial
/special/oil/ (accessed 9 July 2012).
2. The Energy Collective. http://theenergycollective.com/josephromm/28967/quenching-our
-thirst-oil-growing-global-oil-demand-harms-us-security-and-economy (accessed 9 July
2012).
3. U.S. Energy Information Administration. http://www.eia.gov/oiaf/servicerpt/anwr
/introduction.html (accessed 9 July 2012).
4. Lichtenthaler, F. W.; Peters, S. Carbohydrates as Green Raw Materials for the Chemical
Industry. C. R. Chemie 2004, 7, 65–90.
5. Department of Defense Green Procurement Program (GPP); No. 851-04, U.S. Department of
Defense, August 2004. www.wbdg.org/pdfs/dod_gpp_082704.pdf (accessed 9 July 2012).
6. Norton, A. Furan Resins. Ind. Eng. Chem. 1948, 2, 236–238.
7. U.S. Department of Defense Home Page. http://www.defense.gov/contracts/contract
.aspx?contractid=4606 (accessed 9 July 2012).
8. Lucian, L. A.; Argyropoulos, D. S.; Adamopoulos, L.; Gaspar, A. R. Chemicals and Energy
From Biomass: A Review. In Materials, Chemicals, and Energy from Forest Biomass, ACS
Symposium Series 954; Argyropoulos, D. S. Ed.; ACS Books: Washington, DC, 2007;
pp 2–30.
9. Lichtenthaler, F. W. Industrial Chemicals From Carbohydrate Feedstocks: Current Status
and Challenges Ahead. In Production of Fuels, Specialty Chemicals and Biobased Products
From Agro-Industrial Wastes and Surplus; Fava, F., Carepa, P., Eds.; INCA: Venezia, Italy,
2008; pp 230–253.
10. Tong, X.; Ma, Y.; Li, Y. Biomass Into Chemicals: Conversion of Sugars to Furan
Derivatives by Catalytic Processes. APCATA 2010, 385, 1–3.
11. United States Department of Agriculture. http://www.nass.usda.gov/Statistics_by_Subject
/index.php (accessed 9 July 2012).
12. Sandler, S. R.; Karo, W.; Bonesteel, J.; Pearce, E. M. Polymer Synthesis and
Characterization: A Laboratory Manual; Academic Press: San Diego, 1998; pp 163–172.
13. Wnuk, A. J.; Davidson, T. F.; McGrath, J. E. Journal of Applied Polymer Science: Applied
Polymer Symposium 1978, 34, 89–101.

24
14. Ibieta, J. B.; Kalika, D. S.; Penn, L. S. Journal of Polymer Science, Part A: Polymer
Chemistry 1998, 36 (8), 1309–1316.
15. Odian, G. Principles of Polymerization, 4th ed.; John Wiley & Sons, Inc.: New Jersey,
2004; p 97.
16. ASTM D 2896-05. Standard Test Method for Base Number of Petroleum Products by
Potentiometric Perchloric Acid Titration (Procedure B) 2005.
17. ASTM D 664-11a. Standard Test Method for Acid Number of Petroleum Products by
Potentiometric Titration (Procedure B) 2011.
18. Felgner, A. Titration in Nonaqueous Media. AnaltyiX by Sigma-Aldrich 2009, 9 (2),
21–22.
19. Lide, D. R., Ed.; CRC Handbook of Chemistry and Physics, 75th ed.; CRC Press: Boca
Raton, FL, 1994; pp 8–66.
20. Carey, F. A.; Sundberg, R. J. Structural Effects on Stability and Reactivity. In Advanced
Organic Chemistry Part A: Structure and Mechanisms; 5th ed., Springer: New York, 2007;
p 362.

NO. OF
COPIES ORGANIZATION
25
1 DEFENSE TECHNICAL
(PDF) INFORMATION CTR
DTIC OCA
1 DIRECTOR
(PDF) US ARMY RESEARCH LAB
IMAL HRA
1 DIRECTOR
(PDF) US ARMY RESEARCH LAB
RDRL CIO LL
1 GOVT PRINTG OFC
(PDF) A MALHOTRA
1 RDRL WMM C
(PDF) J LA SCALA

26
INTENTIONALLY LEFT BLANK.