dioxin and furan inventories national and regional ... and furan... · sprep waigani convention...
TRANSCRIPT
SPREP Waigan i Convent ion Handbook
DIOXIN AND FURAN INVENTORIES National and Regional Emissions of PCDD/PCDF
United Nations Environment Programme
This electronic document is included as a resource. If you use or quote this reference please acknowledge and give credit to the original authors.
Document starts on the next page.
REFERENCE LIBRARY Document Cover Page

UNITED NATIONSENVIRONMENT PROGRAMME
DIOXIN AND FURAN INVENTORIESNational and Regional Emissions of PCDD/PCDF
May 1999
Prepared by UNEP ChemicalsGeneva, Switzerland
INTER-ORGANIZATION PROGRAMME FOR THE SOUND MANAGEMENT OF CHEMICALSIOMC A cooperative agreement among UNEP, ILO, FAO, WHO, UNIDO, UNITAR and OECD

The publication is intended to serve as the first guide on available dioxin and furan inventoriesestablished for countries or regions. The information contained in this report was taken fromthe published scientific literature, from government reports as well as from the Internet andthrough personal communication. While the information provided is believed to be accurate,UNEP disclaims any responsibility for possible inaccuracies or omissions and consequenceswhich may flow from them. Neither UNEP nor any individual involved in the preparation ofthis report shall be liable for any injury, loss, damage or prejudice of any kind that may becaused by any persons who have acted based on their understanding of the information con-tained in this publication.
The designation employed and the presentation material in this report do not imply any expres-sion of any opinion whatsoever on the part of the United Nations or UNEP concerning the legalstatus of any country, territory, city or area or any of its authorities, or concerning any delimita-tion of its frontiers or boundaries. Any views expressed in the document do not necessarilyreflect the views of UNEP.
This publication was developed under contract with Dr. Heidelore Fiedler, Universityof Bayreuth, Germany.
On the cover: The countries in red have established dioxin and furan inventories.
This publication is produced within the framework of the Inter-OrganizationProgramme for the Sound Management of Chemicals (IOMC)
The Inter-Organization Programme for the Sound Management of Chemicals(IOMC), was established in 1995 by UNEP, ILO, FAO, WHO, UNIDO and OECD(Participating Organizations), following recommendations made by the 1992 UNConference on Environment and Development to strengthen cooperation andincrease coordination in the field of chemical safety. In January 1998, UNITARformally joined the IOMC as a Participating Organization. The purpose of theIOMC is to promote coordination of the policies and activities pursued by theParticipating Organizations, jointly or separately, to achieve the sound man-agement of chemicals in relation to human health and the environment.
Material in this publication may be freely quoted or reprinted, but acknowledgement isrequested together with a reference to the document number. A copy of the publicationcontaining the quotation or reprint should be sent to UNEP Chemicals.
Copies of this report are available from:
UNEP Chemicals11-13 chemin des Anémones
CH-1219 Châtelaine (Geneva), SwitzerlandTel.: +41 22 / 917 8170Fax: +41 22 / 979 3460
e-mail: [email protected]
May 1999
UNEP CHEMICALS
UNITED NATIONSENVIRONMENT PROGRAMME
DIOXIN AND FURAN INVENTORIES
National and Regional Emissions of PCDD/PCDF
Prepared by UNEP ChemicalsGeneva, Switzerland
May 1999
Preface
In its decision 19/13 C of February 7, 1997 on Persistent Organic Pollutants(POPs), the Governing Council of UNEP requested the Executive Director ofUNEP to convene an Intergovernmental Negotiating Committee with amandate:
1. to prepare an international legally binding instrument for implementinginternational action on twelve specified POPs; and
2. to establish an expert group for the development of science-basedcriteria and a procedure for identifying additional POPs as candidates forfuture international action.
With this mandate to facilitate a convention on reduction and elimination ofreleases of POPs, UNEP Chemicals initiated several activities to help thecountries to prepare for the negotiations of the convention. As one of theseimmediate actions, UNEP Chemicals will “…assist countries in theidentification of national sources of dioxin and furan releases by promotingaccess to the information on available sources of these compounds…”.
Polychlorinated dibenzo-p-dioxins and polychlorinated dibenzofurans(PCDD/PCDF) are environmental contaminants detectable in almost allcompartments of the global ecosystem in trace amounts. PCDD/PCDF havenever been produced intentionally and have never served any usefulpurpose unlike other POPs, e.g. polychlorinated biphenyls (PCB) or DDT.PCDD/PCDF are formed as unwanted by-products in many industrial andcombustion processes. Consequently, it is impossible eliminate dioxins andfurans by prohibition of production and use. Indirect measures have to betaken to reduce the emissions of PCDD/PCDF into the environment and tominimize human exposure. Such work can be done successfully only if thesources of PCDD and PCDF are identified and quantified. Only then cantechnologies and measures be put in place to minimize or eliminate thesesources.
Conducting inventories is an essential step in implementing an internationalinstrument on POPs. Besides the fact that there is little information availableregarding POPs produced as byproducts, technical assistance is needed formany developing countries to establish dioxin inventories. At the secondsession of the Intergovernmental Negotiating Committee for an InternationalLegally Binding Instrument on POPs it was requested that the Secretariatgather and synthesize national inventory information.
Present knowledge about sources of PCDD and PCDF is based onexperiences from a few industrialized countries of the Northern Hemisphere.This report is a first step towards filling the knowledge gap on existing dioxinand furan inventories. The report summarizes the information on releases ofPCDD/PCDF from known sources available for far from the publishedscientific literature, from government reports, and based on personalcommunication.
UNEP is fully aware that further intensified efforts are needed to betteridentify and quantify sources of dioxin and furan emissions before a globaldioxin inventory will be available. The information compiled here should helpcountries to establish their own dioxin inventories as asked in the decisionsadopted by UNEP’s Governing Council.
Klaus TöpferExecutive DirectorUnited Nations EnvironmentProgram

Dioxin and Furan Inventories i
UNEP Chemicals May 1999
DIOXIN AND FURAN INVENTORIESNational and Regional Emissions of PCDD/PCDF
Table of Contents
Page
PrefaceTable of Contents iTable of Tables ivTable of Figures viiAcronyms viii
0 Summary 10.1 General 10.2 Dioxin and Furan Inventories 2
1 Purpose of the Study 6
2 Content of This Report 7
3 Background Information on Toxicity of PCDD/PCDF 83.1 Toxicity of PCDD/PCDF and Risk Assessment 8
3.1.1 IARC Evaluation of Human and Animal Carcinogenicity Data 93.1.2 Toxicity Equivalency Factors (TEF) 10
3.2 Exposure Data 10
4 Background Information on Sources of PCDD/PCDF 124.1 Primary Sources of Dioxins 12
4.1.1 Industrial-Chemical Processes 124.1.2 Thermal Processes 13
4.2 Secondary Sources of PCDD/PCDF = Reservoirs 15
5 Technical Abatement Technologies 18
6 Legislative and Regulatory Measures 196.1 Tolerable Daily Intake (WHO) 196.2 Indirect Measures 196.3 Direct Measures 20
6.3.1 Chemicals 206.3.2 Regulations on Incineration and Combustion 20
6.4 Further Regulations 216.5 Guidelines for Soil and Milk 22
6.5.1 Soil 22
ii Dioxin and Furan Inventories
May 1999 UNEP Chemicals
6.5.2 Milk and Milk Products 23
Page
7 Methods to Establish Dioxin Inventories 25
8 European Dioxin Inventories 278.1 Austria 278.2 Belgium 278.3 Czech Republic and Slovak Republic 328.4 Denmark 338.5 France 348.6 Germany 35
8.6.1 Federal Republic of Germany 358.6.2 Hamburg 42
8.7 Hungary 448.8 Slovak Republic 458.9 Sweden 468.10 Switzerland 478.11 The Netherlands 488.12 United Kingdom 49
8.12.1 Emissions to Air 498.12.2 Emissions to Water and Land 52
8.13 European Emission Inventory 548.13.1 Emissions to Air 558.13.2 PCDD/PCDF Releases to Water and Residues 598.13.3 Conclusions 59
8.14 European Atmospheric Emission Inventory 61
9 Dioxin Inventories from the American Continents 669.1 Canada 669.2 United States of America 699.3 Others 73
10 Dioxin Inventories in Asia and the Pacific 7410.1 Australia 7410.2 Japan 7710.3 New Zealand 7910.4 South Korea 79
11 Global Emission Inventory 80
12 Conclusions from National Emission Inventories 82
13 References 88
Dioxin and Furan Inventories iii
UNEP Chemicals May 1999
Page
Appendix A: 91
Appendix B: Dioxin and Furan Profile Information – UNEP Chemical’s Survey 93B.1 General 93B.2 Countries with Qualitative Data 94
B.2.1 Armenia 94B.2.2 Burkina Faso 94B.2.3 Cameroon 94B.2.4 China 95B.2.5 Costa Rica 95B.2.6 Guinée 95B.2.7 Ireland 95B.2.8 Lebanon 95B.2.9 Madagascar 95B.2.10 Niger 95B.2.11 Vietnam 96
B.3 Countries with Quantitative Data 96B.3.1 Croatia 96B.3.2 Finland 97B.3.3 Germany 98B.3.4 Norway 99B.3.5 Sweden 100

iv Dioxin and Furan Inventories
May 1999 UNEP Chemicals
Table of Tables
Page
Table 1: PCDD/PCDF concentrations in chemical products 13
Table 2. PCDD/PCDF trends in emissions from municipal solid waste incineration 14
Table 3: PCDD/PCDF combustion sources 14
Table 4: PCDD/PCDF in residues from municipal solid waste incineration 15
Table 5: PCDD/PCDF in sewage sludge and compost 15
Table 6: PCDD/PCDF reservoirs in Hamburg; reference year 1992 16
Table 7: PCDD/PCDF reservoirs in the soil of Hamburg 16
Table 8: Hamburg: Reservoirs in landfills and contaminated areas 17
Table 9: Limit values of PCDD/PCDF as given by the Chemicals Law 20
Table 10: Soil guideline concentrations 23
Table 11: Recommendation values and action levels for PCDD/PCDF in milk and milkproducts 24
Table 12: PCDD/PCDF emissions in Austria; reference year 1994 27
Table 13: Belgium: PCDD/PCDF emissions to air; reference years 1985-1995 28
Table 14: Belgium: PCDD/PCDF emissions to water; reference years 1985-1995 29
Table 15: Belgium: PCDD/PCDF emissions to air, land, and wastes for the three Regionsby sectors (decreasing importance) 30
Table 16: Belgium: Summarizing table - PCDD/PCDF emissions to air, water, and wastefor the three Regions; reference years 1985-1995 32
Table 17: PCDD/PCDF emission estimates combined for the Czech Republic andthe Slovak Republic 32
Table 18: Sources of PCDD/PCDF in Denmark; reference year 1995 34
Table 19: France: PCDD/PCDF emissions to air; reference year 1997 35
Table 20: Trends of PCDD/PCDF emissions in Germany 36
Table 21: Germany: PCDD/PCDF emissions from iron steel industries and foundries;reference year 1994 37
Table 22: Germany: PCDD/PCDF emissions from non-ferrous metal and aluminumproduction; reference year 1994 37
Table 23: Germany: PCDD/PCDF emissions from secondary zinc production;reference year 1994 38
Table 24: Germany: Summary of PCDD/PCDF emissions from ferrous and non-ferrousmetal industries; reference year 1994 38
Table 25: Germany: PCDD/PCDF emissions from power plants and other industrialcombustion plants; reference year 1994 39
Table 26: Germany: PCDD/PCDF emissions from waste incineration plants;reference year 1994 40
Dioxin and Furan Inventories v
UNEP Chemicals May 1999
Page
Table 27: Germany: PCDD/PCDF emissions from road transport; reference year 1994 40
Table 28: Germany: PCDD/PCDF emissions from production of mineral materials andother production processes; reference year 1994 41
Table 29: PCDD/PCDF emissions to the air from combustion sources in Hamburg 44
Table 30: PCDD/PCDF emission inventory for Hungary 45
Table 31: Slovak Republic: PCDD/PCDF emissions into air; reference year 1993 46
Table 32: Sweden: Preliminary estimates of PCDD/PCDF emissions from various sourcesin Sweden during 1990 and 1993 47
Table 33: Switzerland: PCDD/PCDF emissions into air 48
Table 34: Estimated annual PCDD/PCDF emissions into the air for the Netherlands 49
Table 35: United Kingdom: Estimated emissions of PCDD/PCDF to the atmosphere forthe reference years 1993 and 1997 51
Table 36: United Kingdom: PCDD/PCDF releases to land and water; reference year 1996 53
Table 37: National data: PCDD/PCDF Air Emissions in the European Community 57
Table 38: PCDD/PCDF air emissions in the European Community – Comparison of resultsfrom national reports and LUA re-estimate; reference years 1993-1995 58
Table 39: PCDD/PCDF air emissions in the European Community – Most importantsources for reference years 1993-1995, LUA re-estimate 59
Table 40: Classification of countries into three groups to assign emission factors 61
Table 41: Region-specific default emission factors for PCDD/PCDF 63
Table 42: PCDD/PCDF emissions to air in 1990m for 38 European countries 64
Table 43: 38 European countries: PCDD/PCDF emissions in 1990 by country 65
Table 44: Aggregated PCDD/PCDF emissions; reference year 1990 65
Table 45: Canada: PCDD/PCDF releases to the atmosphere for three different years 68
Table 46: Canada: PCDD/PCDF in effluents 68
Table 47: Canada: PCDD/PCDF in soil 69
Table 48: Canada: PCDD/PCDF releases in products 69
Table 49: Canada: Summary of PCDD/PCDF releases to all media 69
Table 50: USA: PCDD/PCDF inventory to the air; reference year 1995 72
Table 51: USA: PCDD/PCDF emissions to water, land and products; reference year 1995- Central estimates 73
Table 52: Australia: PCDD/PCDF emission estimates 75
Table 53: Japan: PCDD/PCDF annual emissions from known sources 77
Table 54: Time trend of PCDD/PCDF emissions from MSWI in Japan and prediction forthe future 78
Table 55: Japan: PCDD/PCDF emissions to air – New estimates 78
Table 56: Climate zones and average total fluxes of PCDD/PCDF to each zone 80

vi Dioxin and Furan Inventories
May 1999 UNEP Chemicals
Page
Table 57: Emission factors, global production rates, average emissions, and90 % confidence level for major PCDD/PCDF sources; reference year 1990 81
Table 58: Global PCDD/PCDF emission inventory to air from known sources; basedon existing national inventories; reference year 1995 83
Table 59: PCDD/PCDF emissions per sector and country. Reference yearapproximately 1995 85
Table 60: PCDD/PCDF emissions per sector and country in percent of the total annualemission 85
Table A 1: International Toxicity Equivalency Factors (I-TEFs) for PCDD/PCDF 93
Table A 2: WHO Toxicity Equivalency Factors (WHO-TEFs) for PCDD/PCDF 93
Table A 3: Toxicity Equivalency Factors (TEFs) for non-ortho and mono-orthosubstituted PCB 94
Table B 1: Dioxin and furan sources information received at UNEP Chemicals 95
Table B 2: Croatia: Estimated PCDD/PCDF releases into air 98
Table B 3: Finland: Estimated annual PCDD/PCDF releases into air 99
Table B 4: Germany: PCDD/PCDF releases as summarized by UBA 100
Table B 5: Norway: PCDD/PCDF emissions to air 101
Table B 6: Sweden: PCDD/PCDF releases to air, water and wastes or products;reference year 1993 102
Table of Figures
Page
Figure 1: PCDD/PCDF annual fluxes into air; reference year 1995 2
Figure 2: Percentage contribution per sector and country to the overall PCDD/PCDFair emission inventory; reference year 1995 4
Figure 3: PCDD/PCDF annual fluxes into air; reference year: 1995 82

Dioxin and Furan Inventories vii
UNEP Chemicals May 1999
Acronyms
2,4,5-T 2,4,5-Trichloroacetic acidAhR Aryl hydrocarbon receptorBC British ColumbiaBw Body weightCR Confidence ratingd.m. Dry matterEDC Ethylene dichlorideEPA Environmental Protection AgencyEU European Union (Member States: Austria, Belgium, Denmark, Finland,
France, Germany, Greece, Ireland, Italy, Luxembourg, The Netherlands,Portugal, Spain, Sweden, United Kingdom)
FAO Food and Agricultural OrganizationHCl Hydrochloric acid, hydrogen chlorideI-TEQ International Toxic EquivalentsIARC International Agency for Research on CancerIFCS International Forum on Chemical SafetyIOMC Inter-Organization Programme for the Sound Management of ChemicalsIPCS International Programme on Chemical SafetyKoc Partition coefficient: octanol/carbonKow Partition coefficient: octanol/waterM(S)WI Municipal (solid) waste incinerationMW MegawattN-TEQ Nordic Toxic Equivalents (scheme adopted by the Scandinavian countries)NATO/CCMS North Atlantic Treaty Organization/Challenges of Changes in Modern
SocietyND Not determinedONT OntarioPCB Polychlorinated biphenylsPCDD Polychlorinated dibenzo-p-dioxinsPCDF Polychlorinated dibenzofuransPCN Polychlorinated naphthalenesPCP PentachlorophenolPCT Polychlorinated terphenylsPOPs Persistent Organic PollutantsPVC Polyvinyl chloridet Ton (metric)TCDD Tetrachlorodibenzo-p-dioxinTDI Tolerable Daily IntakeTEF Toxicity Equivalency FactorTEQ Toxicity EquivalentTJ Terajoule (1012 Joule)UNEP United Nations Environment ProgrammeVC(M) Vinyl chloride (monomer)WHO World Health Organization
viii Dioxin and Furan Inventories
May 1999 UNEP Chemicals
Unitsmg Milligram 10-3 gµg Microgram 10-6 gng Nanogram 10-9 gpg Picogram 10-12 gfg Femtogram 10-15 g

Dioxin and Furan Inventories 1
UNEP Chemicals May 1999
DIOXIN AND FURAN INVENTORIES
NATIONAL AND REGIONAL EMISSIONS OF PCDD/PCDF
0 SUMMARY
In its decision 19/13 C of 7 February 1997, the Governing Council of UNEP * requested theExecutive Director of UNEP to convene an Intergovernmental Negotiating Committee with a man-date to prepare an international legally binding instrument for implementing international actionon twelve specified POPs, and to establish an expert group for the development of science-based criteria and a procedure for identifying additional POPs as candidates for futureinternational action. With this mandate to facilitate a convention on reduction and elimination ofreleases of POPs, UNEP Chemicals initiated several activities to help the countries to prepare forthe negotiations of the convention. As one of these immediate actions UNEP Chemicals will“…assist countries in the identification of national sources of dioxin/furan releases by promotingaccess to the information on available sources of dioxins/furans…”.
0.1 General
Polychlorinated dibenzo-p-dioxins and polychlorinated dibenzofurans (PCDD/PCDF) have neverbeen produced intentionally but are unwanted byproducts of many chemical industrial processesand of all combustion processes. Almost all possible 210 congeners are released from thesesources and, due to chemical, physical, and biological stability and long-range transport, areubiquitous and have been detected in all environmental compartments. Due to the persistence ofthe 2,3,7,8-substituted congeners and the lipophilicity of these compounds, PCDD/PCDFaccumulate in fatty tissues and in carbon-rich matrices such as soils and sediments.
PCDD/PCDF exhibit biological effects commonly associated with chlorinated organic chemicals.Dioxin exposures are associated with an increased risk of severe skin lesions, altered liver func-tion and lipid metabolism, general weakness associated with drastic weight loss, changes inactivity of various liver enzymes, depression of the immune system, and endocrine and nervoussystem abnormalities. 2,3,7,8-Cl4DD is a potent teratogenic and fetotoxic chemical in animalsand a potent promoter in rat liver carcinogenesis; it also causes cancers of the liver and otherorgans in animals
In 1997, the International Agency for Research on Cancer (IARC) classified the most toxic con-gener of the PCDD/PCDF as a Group 1 compound as carcinogenic to humans. All other 2,3,7,8-substituted PCDD/PCDF were classified as non-carcinogenic to humans (Group 3).
In May 1998, the World Health Organization (WHO) evaluated the risks which dioxins may causeto health. In Bilthoven 1990, WHO experts established a tolerable daily intake of 10 pg TCDD/kgbw. Since then, new epidemiological data have emerged, especially on neurotoxicological devel-opment and the endocrine system. Finally, WHO agreed on a new tolerable daily intake (TDI) of1 to 4 picogram per kilogram body weight and day. The experts however recognized that subtle * United Nations Environment Programme
2 Dioxin and Furan Inventories
May 1999 UNEP Chemicals
effects occur in the general population in developed countries at background levels of 2 to 6 pico-grams per kilogram body weight and day. They therefore recommended that: every effort shouldbe made to reduce exposure to the lowest possible level and the range established for 2,3,7,8-Cl4DD should be applied to a TEQ including the 17 2,3,7,8-substituted PCDD and PCDF as wellas the coplanar and mono-ortho substituted PCB (WHO 1998).
For the risk assessment of complex mixtures of PCDD/PCDF, Toxicity Equivalency Factors(TEFs) were established. They were developed to rank the toxicity of the 17 individual 2,3,7,8-substituted congeners in relation to the toxicity of 2,3,7,8-Cl4DD based on the evidence that thereis a common, receptor-mediated mechanism of action for these compounds. Although there existlimitations of the approach due to a number of simplifications, TEFs allows conversion of quanti-tative analytical data for individual PCDD/PCDF congeners into a single Toxic Equivalent (TEQ),and thus order of magnitude estimates of toxicity.
0.2 Dioxin and Furan Inventories
In this report, initial findings obtained from national inventories of releases of polychlorinateddibenzo-p-dioxins and polychlorinated dibenzofurans (PCDD/PCDF) are presented and evalu-ated. Most countries have estimated PCDD/PCDF emissions to air and only a few findings areavailable for emissions to water and soil.
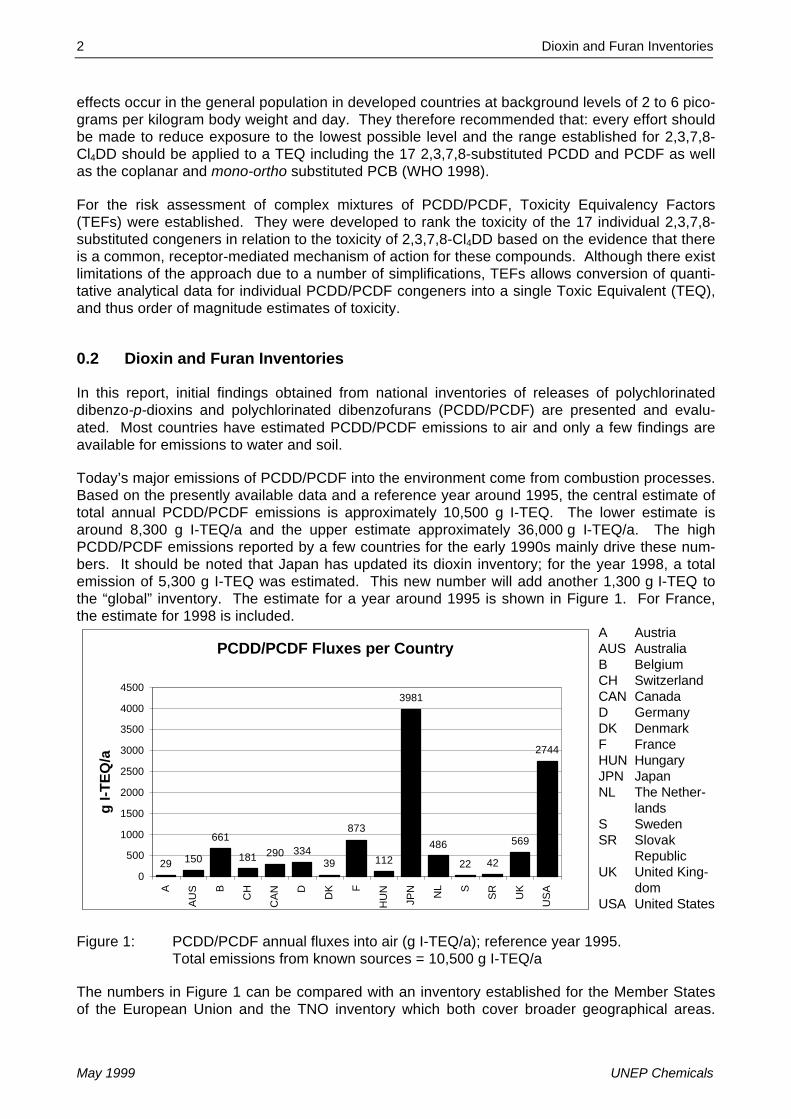
Today’s major emissions of PCDD/PCDF into the environment come from combustion processes.Based on the presently available data and a reference year around 1995, the central estimate oftotal annual PCDD/PCDF emissions is approximately 10,500 g I-TEQ. The lower estimate isaround 8,300 g I-TEQ/a and the upper estimate approximately 36,000 g I-TEQ/a. The highPCDD/PCDF emissions reported by a few countries for the early 1990s mainly drive these num-bers. It should be noted that Japan has updated its dioxin inventory; for the year 1998, a totalemission of 5,300 g I-TEQ was estimated. This new number will add another 1,300 g I-TEQ tothe “global” inventory. The estimate for a year around 1995 is shown in Figure 1. For France,the estimate for 1998 is included.
PCDD/PCDF Fluxes per Country
29 150
661
181 290 33439
873
112
3981
486
22 42
569
2744
0
500
1000
1500
2000
2500
3000
3500
4000
4500
A
AUS B
CH
CAN
D DK F
HU
N
JPN NL S
SR UK
USA
g I-T
EQ/a
A AustriaAUS AustraliaB BelgiumCH SwitzerlandCAN CanadaD GermanyDK DenmarkF FranceHUN HungaryJPN JapanNL The Nether-
landsS SwedenSR Slovak
RepublicUK United King-
domUSA United States
Figure 1: PCDD/PCDF annual fluxes into air (g I-TEQ/a); reference year 1995.Total emissions from known sources = 10,500 g I-TEQ/a
The numbers in Figure 1 can be compared with an inventory established for the Member Statesof the European Union and the TNO inventory which both cover broader geographical areas.

Dioxin and Furan Inventories 3
UNEP Chemicals May 1999
The EU report covers 17 countries and estimates approximately 5,800 g I-TEQ/a to be emittedfrom known sources. However, the authors assume a large margin of uncertainty and cannotexclude an upper estimate of approximately 20,000 g I-TEQ being released into the air from the17 European countries.
The TNO study is less specific to PCDD/PCDF sources and estimates an annual release of1,300 g I-TEQ for the reference year 1990. Finally, based on relatively few assumptions and nodetailed evaluation of emission inventories, Brzuzy and Hites estimate a global PCDD/PCDFrelease of 50,000 g I-TEQ/a.
To compare the most important emission sources from national inventories, the PCDD/PCDFsources were categorized into nine major sectors which are listed below:
Iron and Steel: Iron and steel plants including foundries, sinter and coke plants(as in many countries, coke is exclusively produced for use insteel plants)
Non-ferrous Metals: Primary and secondary plants for the generation of copper, alu-minum, zinc, lead
Power Plants: Fuelled with coal, gas, crude oil, wood
Industrial Combustion Plants: Industrial units fuelled with coal, gas, crude oil, sewage sludge,and biomass for use on-site
Small Combustion Units: Mostly domestic stoves and chimneys fired with coal, oil, and gas
Waste Incineration: Includes incineration of municipal solid waste, hazardous waste,sewage sludge, hospital waste, waste wood, and crematoria
Road Transport: Passenger cars, busses, trucks run on leaded or unleaded gaso-line or Diesel
Mineral Products Production: Generation of cement, lime, glass, brick, etc.
Others: Shredder plants, asphalt mixing, drying of green fodder, woodchips, chemical industry, accidental fires and prescribed burnings
The percentage share of the above sectors within a country is illustrated in Figure 2. It can beseen that the sector of waste incineration as defined above is still the major emitter in manycountries. Exceptions are Austria, Australia, and Germany for the reference year 1995. For the“global” inventory based on these fifteen countries the share of the waste incineration is almost50 % (see right bar in Figure 2).
In absolute numbers, the main part of PCDD/PCDF emissions from the sector of waste incinera-tion is due to the municipal waste incinerators located in Japan. This source sector alone isresponsible for almost 40 % of the total PCDD/PCDF inventory to air from identified sources sofar. On the other hand, in countries with stringent regulation of PCDD/PCDF emissions frommunicipal and hazardous waste incineration, e.g. the member states of the European Union thatstarted legislation in the early 1990, incineration of waste is a minor contributor to any nationalinventory.

4 Dioxin and Furan Inventories
May 1999 UNEP Chemicals
0%
10%
20%
30%
40%
50%
60%
70%
80%
90%
100%
A
AUS B
CH
CAN D
DK F
HU
N
JPN NL S
SR UK
USA
Glo
bal
OthersMineral Prod.Road TranspWaste Incin.Small Comb.Ind. Comb. PlPower PlNon-ferr. MetIron/Steel
Figure 2: Percentage contribution per sector and country to the overall PCDD/PCDF airemission inventory; reference year 1995
The present situation of PCDD/PCDF inventories in terms of geographic coverage and method-ology can be summarized as follows:
• The present number of national PCDD/PCDF emission inventories is very small (15 based onnational data).
• Almost exclusively, the existing inventories only address PCD/PCDF emissions to air. Theremay be considerable amounts of dioxins and furans being contained in reservoirs containing“old” chemicals such as 2,4,5-trichlorophenoxy acetic acid (2,4,5-T), pentachlorophenol usedfor wood treatment, polychlorinated biphenyls (PCB) used in transformers and capacitors.Other reservoirs include landfills/dumps, contaminated soils, and sediments.
• Most data is available for countries from Western Europe and Northern America. However,the inventory for the United States is still in a draft stage. From Asia, there is only oneinventory for Japan, which covers a few source categories, and the estimate for emissionsfrom waste incinerators from South Korea. From the Southern hemisphere, so far, onlyAustralia has estimated annual emissions based on emission factors from the literature.From Africa, Central and Southern America, there are no data at all.
• Some countries have based their inventories on emission factors generated outside the owncountry. For some sources, there are no emission factors determined, e.g. open garbageburning, landfill fires, etc.
From the existing inventories the following conclusions can be drawn:
• Amongst the source sectors, the best coverage exists for municipal solid waste incinerationfor both stack emission measurements and activity rates. As this sector undergoes the mostdramatic changes in technology, emission factors and PCDD/PCDF emissions change rap-
Dioxin and Furan Inventories 5
UNEP Chemicals May 1999
idly. As a consequence, strong downward trends are recognized in countries with moderntechnology or rigid legislation.
• The sector of hazardous waste incineration is relatively homogeneous and does not present amajor source in any country.
• There is only limited information available from the iron and steel-producing sector. SomeEuropean countries have identified this sector as the major contributor to national dioxininventories. The United States and Canada are aware of these sources, but so far, not a sin-gle measurement was performed. Here, generation of reliable data is urgently required.
• From the few examples on dioxin and furan emissions to water and land or with products itcan be concluded that emissions to water only cover wastewaters from the pulp and paperindustry. Contamination in products largely is limited to pentachlorophenol (PCP) and thePCDF in polychlorinated biphenyls (PCB) are being ignored.
• For some countries, the inventory should be updated to improve estimates of the presentsituation, especially when more stringent regulation has been established.
• Presently there exist no harmonized methods on generating and evaluating data for nationalPCDD/PCDF inventories. In addition, the coverage of sources varies from country to country.Some countries such as the United Kingdom and the United States include releases ofPCDD/PCDF to landfills and land to a certain extent. Some countries give ranges of lowerand upper estimates whereas other countries use mean/median values to calculate theannual dioxin emissions for a given source. Harmonization of data acquisition and evaluationis an obvious need and will help in comparing national dioxin and furan inventories.
• Finally, harmonization of protocols for sampling stack emissions, water, soil, etc. and for ana-lyzing these samples is highly recommended.
The present report should only be seen as a snapshot on PCDD/PCDF emissions and estimatesof total releases of these compounds into the environment. The major sectors of PCDD/PCDFreleases into the air have been identified. Nevertheless, PCDD/PCDF sources may exist whichhave not yet been identified or quantified, especially in geographic areas with no data.Nevertheless it has to be taken in mind that emission factors established in industrializedcountries cannot be assumed to be representative for industries in less developed countries.
Presently, the coverage is not sufficient to estimate global emissions of PCDD/PCDF. There areseveral efforts underway to identify dioxin sources in parts of the world where so far, there is noinformation available. In addition, existing inventories will be updated, as it is obvious thatmeasures were taken by many countries to reduce emissions of PCDD/PCDF into theenvironment. For some industrialized countries in Europe and North America, strong downwardtrends have been observed during the last years. Implementation of dioxin abatement tech-nologies in industrial sectors and advanced combustion technology will help to reinforce suchtrends.

6 Dioxin and Furan Inventories
May 1999 UNEP Chemicals
1 PURPOSE OF THE STUDY
The Governing Council of the United Nations Environment Programme (UNEP), in its decision18/32 of May 25, 1995, invited international organizations (IOMC, IPCS, IFCS) to develop recom-mendations and information on international action for twelve persistent organic pollutants(POPs). In June 1996, sufficient evidence was achieved for IFCS (Intergovernmental Forum onChemical Safety) to recommend a global action plan on POPs. In its decision 19/13 C of 7February 1997, the Governing Council of UNEP requested the Executive Director of UNEP toconvene an Intergovernmental Negotiating Committee (INC) with a mandate
1) To prepare an international legally binding instrument for implementing international actioninitially beginning with the twelve specified POPs and
2) To establish an expert group for the development of science-based criteria and a procedurefor identifying additional POPs as candidates for future international action.
With this mandate to develop a convention on reduction and elimination of releases of POPs,UNEP Chemicals, initiated under the direction of UNEP’s Executive Director, Dr. Klaus Töpfer,several activities to help the countries to prepare for the negotiations of the convention. Amongthe immediate actions, UNEP Chemicals will
“…assist countries in the identification of national sources of dioxin/furan releases by promotingaccess to the information on available sources of dioxins/furans…”.
This report summarizes findings in dioxin research and technology and is a first attempt tocompile national emission inventories for polychlorinated dibenzo-p-dioxins and polychlorinateddibenzofurans (PCDD/PCDF). The information compiled here will help countries to establish theirown dioxin inventories as asked in the decisions adopted by the Governing Council (GC) at its19th Session (19/13C).
For this study, most information is taken directly from the original reports of a given country orfrom summarizing reports without harmonization or classification of e.g. source categories orindustrial processes. This makes the present findings somewhat heterogeneous in terms ofsource categories. Further complication to compare dioxin inventories is due to the fact that theestimates are given for different reference years and thus, data cannot be compared directly. Inaddition, countries took different approaches to generate their estimates. This report will beupdated, as more information will become available. At a later stage, emission factors can beincluded as well as comparative evaluations.

Dioxin and Furan Inventories 7
UNEP Chemicals May 1999
2 CONTENT OF THIS REPORT
In order to establish a dioxin inventory, some general information on this class of compounds isneeded to give a rationale for such inventory. Thus, the report starts with “BackgroundInformation on Toxicity of PCDD/PCDF” in Section 3 to give a brief summary on the present stateof knowledge in toxicology and the classification of polychlorinated dibenzo-p-dioxins anddibenzofurans in terms of carcinogenicity. It also addresses the recommendation of WHO for atolerable daily intake (TDI) for humans which is the starting point for actions taken to reduceexposure of humans towards dioxins and furans.
Findings on sources and emissions of dioxins and furans are given in Chapter 4 “BackgroundInformation on Sources of PCDD/PCDF” summarized from the literature and experiences mostlyfrom industrialized countries. Chapter 5 briefly addresses technical abatement technologies thatwhere successfully applied in order to reduce emissions of PCDD/PCDF into the environment.Most of the technologies referenced here attempt to minimize emissions into air. The methodol-ogy how the national inventories were generated is given in Chapter 6.
In the early 1990s, many industrialized countries initiated national emission inventories. As aconsequence, countries commissioned national research institutes or agencies to identify andquantify PCDD/PCDF emissions from known sources. For some countries, updates of the origi-nal inventories were performed. National PCDD/PCDF emission inventories were established formost European countries: these are summarized in Chapter 8 “European Dioxin Inventories”. Adetailed regional dioxin mass balance is available for the city of Hamburg, Germany, which pub-lished a report where almost all sources of PCDD/PCDF could be quantified; the results are givenin section 8.6.2. So far, only the European Commission undertook efforts to quantify dioxin emis-sions for a multitude of countries using the same methodological approach when it launched aproject to establish a dioxin emission inventory. The results are shown in section 8.12.2. As partof the UN ECE LRTAP protocol, TNO published a report on emissions of heavy metals andorganic pollutants for the reference year 1990 (UBA 1997). The dioxin-related results aresummarized in Chapter 8.14.
Outside Europe, there are only two national emission inventories available from the Americas,namely for Canada and the United States of America. Both inventories are still in a draft stageand not finalized. The results are summarized in Chapter 9 “Dioxin Inventories from theAmerican Continents“. The inventories for Australia and Japan are presented in Chapter 10“Dioxin Inventories in Asia and the Pacific”.
In most cases, information was compiled on a nation-wide basis. However, for some areas, onlyone source category has been addressed so far, e.g. for Korea where only the sector of munici-pal solid waste incineration was investigated (see Section 10.4).
Attempts for a global dioxin emission inventory were undertaken by Ron Hites and coworkerswho based their emission estimates on deposition measurements from samples collected all overthe globe (see Chapter 11).
The responses on questionnaires sent by UNEP Chemicals to the POPs focal points in 1997 aresummarized in Appendix B. For three countries new quantitative information was given whichwas not found in the published literature and thus not contained in the main part of the report(Chapters 1-13). On the other hand, there exist estimates on emissions of PCDD/PCDF fromidentified sources in the publications that were not addressed in the questionnaires.
8 Dioxin and Furan Inventories
May 1999 UNEP Chemicals
3 BACKGROUND INFORMATION ON TOXICITY OF PCDD/PCDF
Polychlorinated dibenzo-p-dioxins (PCDD) and polychlorinated dibenzofurans (PCDF) are envi-ronmental contaminants detectable in almost all compartments of the global ecosystem in traceamounts. These compound classes in particular have caused major environmental concern. Incontrast to other chemicals of environmental concern such as polychlorinated biphenyls (PCB),polychlorinated naphthalenes (PCN), and polychlorinated pesticides like DDT, pentachlorophenol(PCP) or others, PCDD/PCDF never were produced intentionally. They are formed as by-prod-ucts of numerous industrial activities and all combustion processes (Fiedler et al. 1990).
The term “dioxins“ † refers to 75 congeners of polychlorinated dibenzo-p-dioxins (PCDD) and 135congeners of polychlorinated dibenzofurans (PCDF). Amongst these 210 compounds, 17 con-geners can have chlorine atoms at least in the positions 2, 3, 7, an 8 of the parent molecule.These 17 2,3,7,8-substituted congeners are toxic to many laboratory animals, resistant towardschemical, biological, and physical attack, and thus many accumulate in the environment and inorganisms, such as animals and humans. The 2,3,7,8-TCDD (2,3,7,8-Cl4DD) also named“Seveso-dioxin“ is considered to be the most toxic man-made compound. Besides the anthropicsources, an enzyme-mediated formation of PCDD and PCDF from 2,4,5- and 3,4,5-trichlo-rophenol has been demonstrated in vitro (Öberg et al. 1990, Wagner et al. 1990).
First risk assessments only focused on the most toxic congener, the 2,3,7,8-tetrachlorodibenzo-p-dioxin (2,3,7,8-Cl4DD = 2,3,7,8-TCDD). Soon it was recognized, though, that all PCDD/PCDFsubstituted at least in position 2, 3, 7, or 8 are highly toxic and thus, major contributors to theoverall toxicity of the dioxin mixture. In addition, despite the complex composition of manyPCDD/PCDF containing “sources“, only congeners with substitutions in the lateral positions of thearomatic ring, namely the carbon atoms 2, 3, 7, and 8, persist in the environment and accumulatein food-chains.
Almost all 210 individual congeners have been identified in emissions from thermal and industrialprocesses and consequently PCDD/PCDF are found as mixtures of individual congeners in envi-ronmental matrices such as soil, sediment, air, and plants and lower animals. PCDD/PCDF, par-ticularly the higher chlorinated, are poorly soluble in water, have a low volatility, and adsorbstrongly to particles and surfaces (high KOC). Thus, PCDD/PCDF can hardly be identified in waterand are immobile in soils. Especially, the 2,3,7,8-chlorine substituted PCDD/PCDF are extremelystable in the environment and bioaccumulate in fatty tissues (high KOW) of animals and humans.
3.1 Toxicity of PCDD/PCDF and Risk Assessment
PCDD and PCDF produce a spectrum of toxic effects in animals; however, most information isavailable on 2,3,7,8-Cl4DD (TCDD) only. Most toxicity data on TCDD result from high dose oralexposures to animals. There is a wide range of difference in sensitivity to PCDD lethality in ani-mals. The signs and symptoms of poisoning with chemicals contaminated with TCDD in humansare similar to those observed in animals. Dioxin exposures to humans are associated with anincreased risk of severe skin lesions (chloracne and hyperpigmentation), altered liver functionand lipid metabolism, general weakness associated with drastic weight loss, changes in activity of † In this report, where the term “dioxin” or “dioxins and furans” is used alone, it should be interpreted as
including all polychlorinated dibenzo-p-dioxins and polychlorinated dibenzofurans, unless specificallystated otherwise.

Dioxin and Furan Inventories 9
UNEP Chemicals May 1999
various liver enzymes, depression of the immune system, and endocrine and nervous systemabnormalities. 2,3,7,8-TCDD is a potent teratogenic and fetotoxic chemical in animals and apotent promoter in rat liver carcinogenesis. TCDD also causes cancers of the liver and otherorgans in animals (see below).
3.1.1 IARC Evaluation of Human and Animal Carcinogenicity Data
The most important epidemiological studies for the evaluation of 2,3,7,8-Tetrachlorodibenzo-p-dioxin (2,3,7,8-Cl4DD or 2,3,7,8-TCDD) are four cohort studies of herbicide producers (one eachin the United States and the Netherlands, two in Germany). These studies involve the highestexposures to 2,3,7,8- Cl4DD. The cohort of residents in a contaminated area from Seveso, Italyis well known, but the exposures at Seveso were lower and the follow-up shorter than those inthe industrial settings. Most of the four industrial cohorts include analyses of sub-cohorts consid-ered to have the highest exposure and/or longest latency. Overall, the strongest evidence for thecarcinogenicity of 2,3,7,8-Cl4DD is for all cancers combined, rather than for any specific site. Onthe basis of these studies, the International Agency for Research on Cancer (IARC) concludedthat there is limited evidence in humans for the carcinogenicity of 2,3,7,8-Cl4DD. There was in-adequate evidence in humans for the carcinogenicity of PCDD other than 2,3,7,8- Cl4DD.
For PCDF, two incidents, each involving about 2,000 cases occurred in which people wereexposed to sufficient PCB and PCDF to produce symptoms (Yucheng and Yusho accidents).Fatal liver disease is 2-3 times more frequent than national rates in both cohorts. In the Yushocohort from Japan, at 22 years of follow-up, there is a three-fold excess of liver cancer mortalityin men, which was already detectable and even higher at 15 years of follow-up. In the Yuchengcohort, Taiwan, after 12 years of follow-up, there is no excess of liver cancer mortality. Basedupon these data, IARC concluded that there is inadequate evidence in humans for the carcino-genicity of PCDF.
PCDD: In a number of experiments with rats and mice in which 2,3,7,8-Cl4DD was administered,increases in the incidence of liver tumors were consistently found in both males and females. Inaddition, tumors were increased at several other sites in rats, mice and Syrian hamsters, butthese effects were dependent upon the species, sex and route of administration of 2,3,7,8-Cl4DD. Although the doses resulting in increased tumor incidence in rodents are extremely low,they are very close to doses that are toxic in the same species. These data led to the conclusionthat there is sufficient evidence in experimental animals for the carcinogenicity of 2,3,7,8- Cl4DD.Evaluation of much smaller databases led to the conclusion that there is limited evidence inexperimental animals for the carcinogenicity of a mixture of 1,2,3,6,7,8- and 1,2,3,7,8,9-Cl6DDand that there was inadequate evidence for the carcinogenicity in experimental animals of 2,7-Cl2DD, 1,2,3,7,8-Cl5DD and 1,2,3,4,6,7,8,-Cl6DD.
PCDF: There are no long-term carcinogenicity studies on PCDF, but some tumor promotionstudies were evaluated in which rats and mice were exposed to some of the congeners followingshort duration exposure to known carcinogens. It was concluded that there is inadequate evi-dence in experimental animals for the carcinogenicity of 2,3,7,8-Cl4DF, but there is limited evi-dence in experimental animals for the carcinogenicity of 2,3,4,7,8-Cl5DF and 1,2,3,4,7,8-Cl6DD.
The toxicity of 2,3,7,8-Cl4DD segregates with the cytosolic aryl (aromatic) hydrocarbon receptor(AhR), and the relative toxicities of other PCDD and PCDF congeners is associated with theirability to bind to the receptor, which occurs in all rodent and human tissues. The AhR bindingaffinities of 2,3,7,8-Cl4DF, 1,2,3,7,8- and 2,3,4,7,8-Cl5DF are in the same order of magnitude asthat observed for 2,3,7,8-Cl4DD. PCDD with at least three lateral chlorine atoms bind with someaffinity to the AhR. Current evidence is that most, if not all, biological effects of 2,3,7,8-Cl4DD

10 Dioxin and Furan Inventories
May 1999 UNEP Chemicals
and other PCDD arise from an initial high affinity interaction with the AhR and it appears that thebiochemical and toxicological consequences of PCDF exposure are the result of a similar modeof action. The limited carcinogenicity data available for congeners other than 2,3,7,8-Cl4DD indi-cate that carcinogenic potency is also proportional to AhR affinity. Based on this evidence, allPCDD and PCDF are concluded to act through a similar mechanism and require an initial bindingto the AhR. Binding of 2,3,7,8-Cl4DD to the AhR results in transcriptional activation of a batteryof 2,3,7,8-Cl4DD-responsive genes, but currently no responsive gene has been proven to have adefinitive role in its mechanism of carcinogenesis.
Overall evaluation
Taking all of the evidence into consideration, the following evaluations were made by IARC (IARC1997):• 2,3,7,8-Tetrachlorodibenzo-p-dioxin (2,3,7,8-Cl4DD) is carcinogenic to humans (Group 1).• Other polychlorinated dibenzo-p-dioxins are not classifiable as to their carcinogenicity to
humans (Group 3).• Dibenzo-p-dioxin is not classifiable as to its carcinogenicity to humans (Group 3).• Polychlorinated dibenzofurans are not classifiable as to their carcinogenicity to humans
(Group 3).
3.1.2 Toxicity Equivalency Factors (TEF)
Many regulatory agencies have developed so-called Toxicity Equivalency Factors (TEF) for riskassessment of complex mixtures of PCDD/PCDF (Kutz et al. 1990). The TEF are based onacute toxicity values from in vivo and in vitro studies. This approach is based on the evidencethat there is a common, receptor-mediated mechanism of action for these compounds. However,the TEF approach has its limitations due to a number of simplifications. Although the scientificbasis cannot be considered as solid, the TEF approach has been developed as an administrativetool and allows to convert quantitative analytical data for individual PCDD/PCDF congeners into asingle Toxic Equivalent (TEQ). TEF particularly aid in expressing cumulative toxicities of complexPCDD/PCDF mixtures as one single TEQ value. Today, almost all literature data are reported inI-TEQ.
It should be noted that TEF are interim values and administrative tools. They are based on pres-ent state of knowledge and should be revised as new data gets available. Today’s most com-monly applied TEFs were established by a NATO/CCMS Working Group on Dioxins and RelatedCompounds as International Toxicity Equivalency Factors (I-TEF) (NATO/CCMS 1988a). How-ever, in 1997, a WHO/IPCS working group re-evaluated the I-TEFs and established a newscheme. The two schemes are found in Appendix A. The re-evaluation concluded to includenon-ortho and mono-ortho-substituted polychlorinated biphenyls (PCB) into the TEF scheme fordioxin-like toxicity as well.
3.2 Exposure Data
Human exposure to background contamination with PCDD/PCDF is possible via several routes:• Inhalation of air and intake of particles from air• Ingestion of contaminated soil• Dermal absorption• Food consumption

Dioxin and Furan Inventories 11
UNEP Chemicals May 1999
In 1990, a WHO working group concluded that 90 % of the daily dioxin intake (from backgroundcontamination) results from ingestion. Especially, foodstuffs of animal origin are responsible forthe daily intake of approximately 2 pg TEQ/(kg bw·d). All other foodstuffs, especially the „non-fatty“ ones, are of minor importance in terms of PCDD/PCDF intake. They are either of plant ori-gin or do not have a high potential for bioaccumulation of lipophilic compounds. Due to manymeasures to reduce emissions of PCDD/PCDF into the environment, reduction of PCDD/PCDFcontamination in food was observed. As a consequence, the daily intake via food decreased.Whereas in Germany in 1991, the average daily intake was 127.3 pg TEQ/d, the present dailyintake for an average German adult is estimated to 69.6 pg TEQ/d. The strongest decline wasobserved for fish. In 1991, fish contributed for ca. 30 % of the daily intake (same percentage asfor dairy and meat products): today only 10 % of the daily intake is due to fish.
Although no adverse health effects could be causally linked so far with background exposures ofPCDD/PCDF in human milk, for reasons of preventive health care, the relatively high exposure ofbreast-fed infants must still be considered a matter of concern. Analyses of more than 1,000individual human milk samples from nursing mothers in North-Rhine Westphalia (Germany)revealed that the mean PCDD/PCDF concentration decreased from 34 pg I-TEQ/g milkfat in1989 to 14.2 pg I-TEQ/g milkfat in 1996. Despite this decline of 60 %, the PCDD/PCDF dailyintake for babies is 68 pg I-TEQ/kg bw·d), which is almost 70-fold above the TDI of 1 pg TEQ/(kgbw·d) for an adult.
In May 1998, WHO evaluated the risks which dioxins may cause to health. During a previousmeeting in Bilthoven 1990, WHO experts established a tolerable daily intake of 10 pg TCDD/kgbw. Since then, new epidemiological data has emerged, especially on neurotoxicological devel-opment and the endocrine system. Finally, WHO agreed on a new tolerable daily intake (TDI) of1 to 4 picogram per kilogram body weight and day. The experts however, recognized that subtleeffects occur in the general population in developed countries at background levels of 2 to 6 pico-grams per kilogram body weight and day. They therefore recommended that every effort shouldbe made to reduce exposure to the lowest possible level. In addition, the range established for2,3,7,8-Cl4DD should be applied to a TEQ including the seventeen 2,3,7,8-substituted PCDD andPCDF as well as the coplanar and mono-ortho substituted PCB (WHO 1998, van Leeuwen andYounes 1998).

12 Dioxin and Furan Inventories
May 1999 UNEP Chemicals
4 BACKGROUND INFORMATION ON SOURCES OF PCDD/PCDF
Since the first overview on formation and sources of PCDD/PCDF was published in 1980 (Espo-sito et al. 1980), several updates are available in the international literature. The findings can besummarized as follows (Hutzinger and Fiedler 1993):
• PCDD/PCDF were never produced intentionally but occur as trace contaminants in a varietyof industrial and thermal processes.
• Due to their chemical, physical and biological stability PCDD/PCDF are able to remain in theenvironment for long times. As a consequence dioxins from so-called "primary sources"(once formed in industrial or combustion processes) can be transferred to other matrices andenter the environment. Such "secondary" sources are sewage sludge/biosludge, compost, orcontaminated areas (e.g. Kieselrot in Germany).
• Enzymatic reactions can dimerize chlorophenols to PCDD/PCDF. However, compared tochemical-industrial and combustion sources, biological formation seems to be negligible.
4.1 Primary Sources of Dioxins
4.1.1 Industrial-Chemical Processes
Primary sources of environmental contamination with PCDD/PCDF in the past were due to pro-duction and use of chloroorganic chemicals, including the pulp and paper industry. In wet-chemi-cal processes the propensity to generate PCDD/PCDF during synthesis of chemical compoundsdecreases in the following order:
Chlorophenols > Chlorobenzenes > Aliphatic chlorinated compounds > Inorganicchlorinated compounds
Factors favorable for the formation of PCDD/PCDF are high temperatures, alkaline media, pres-ence of UV-light, and presence of radicals in the reaction mixture/chemical process (Hutzingerand Fiedler 1991, 1993). An overview on dioxin concentrations in chemicals is given in Table 1.As can be seen the concentrations can vary by several orders of magnitude.

Dioxin and Furan Inventories 13
UNEP Chemicals May 1999
Table 1: PCDD/PCDF concentrations in chemical products
Substance Concentrationµg I-TEQ/kg
PCP up to 2,320PCP-Na up to 450PCB - Clophen A 30 11PCB - Clophen A 60 2,1792,4,6-Trichlorophenol 680Trichlorobenzene 0.023p-Chloranil (old) 376o-Chloranil (old) 63Hostaperm Violet RL 1.2Violet 23 19Blue 106 56
Changes in the industrial processes have resulted in reduction of PCDD/PCDF concentrations inthe products: e.g. an estimate for Germany says that until 1990 about 105 g I-TEQ have beenintroduced through use of the dye pigment Violet 23 (chloranil produced by old process as inter-mediate). Application of a new process via hydroquinone will reduce the annual input to about3 g I-TEQ (BGA/UBA 1993).
Emissions of PCDD/PCDF into the environment via water and to soils occur from kraft pulp andpaper mills. The US-EPA inventory estimates annual emissions from kraft pulp and paper mills inthe range of 20 g I-TEQ. In addition, PCDD/PCDF were detected in the final product (pulp,paper) as well as in the pulp and paper sludges. With advanced bleaching technology, thePCDD/PCDF contamination in effluents, products, and sludges was reduced.
In Germany there exist exclusively sulfite mills, which presently do not use molecular chlorine.Dioxin levels detected in German pulp were below 0.1 ng TEQ/kg d.m. (BGA/UBA 1993). Theanalysis of imported sulfate (Kraft) pulps gave concentrations in the range between 0.2 and1.3 ng TEQ/kg d.m. Presently the import of Kraft pulps to Germany stands at three million tons,so that the total import of dioxins via Kraft pulp is between 0.6 and 3.9 g I-TEQ. Dioxin levels inpaper products from fresh fibers generally are less than 1 ng TEQ/kg d.m. In recycling paper,however, average dioxin concentrations are between 5 to 10 ng TEQ/kg.
As a consequence, products containing any of the above mentioned chemicals are contaminatedwith PCDD/PCF as well. Amongst these, wood treated with pentachlorophenol (PCP) or otherchlorinated preservatives as well as PCB-based electric fluids are amongst those with the highestcontaminations. Other PCP-treated materials include textiles, leather goods, and cork products.
4.1.2 Thermal Processes
Whereas in the past, the chemical industry and to a lesser extent the pulp and paper industrywere considered to be the main source of dioxins and also the cause of today's contaminatedsites in many industrialized countries, today’s dioxin input is mainly due to thermal processes.There is still a considerable focus on waste incineration but based on the requirements for dioxinreduction in stack gases set by several national authorities, the importance of this source cate-gory has declined during the last years. Examples can be seen especially in the European emis-sion inventories. For example, in Germany the annual input from municipal solid waste incinera-

14 Dioxin and Furan Inventories
May 1999 UNEP Chemicals
tion (MSWI) via exhaust gases of about 400 g TEQ per year in 1988/89 was reduced to less than4 g TEQ since 1997.
Table 2. PCDD/PCDF trends in emissions from municipal solid waste incineration (MSWI)
Concentration (ng I-TEQ/m³) Flux (mg I-TEQ/h)MSWI of the 1970s 50 5MSWI around 1990 5 0.5Modern MSWI 0.1 0.01
The process by which PCDD/PCDF are formed during incineration are not completely understoodnor agreed upon. Three possibilities have been proposed to explain the presence of dioxins andfurans in incinerator emissions (NATO/CCMS 1988b):
• PCDD/PCDF are already present in the incoming waste - in Germany representative meas-urements gave about 50 ng I-TEQ/kg waste - and are incompletely destroyed or transformedduring combustion. Not relevant for modern MSWIs.
• PCDD/PCDF furans are produced from related chlorinated precursors (= pre-dioxins) such asPCB, chlorinated phenols and chlorinated benzenes.
• PCDD/PCDF are formed via de novo synthesis. This is, they are formed from the pyrolysis ofchemically unrelated compounds such as polyvinyl chloride (PVC) or other chlorocarbons,and/or the burning of non-chlorinated organic matter such as polystyrene, cellulose, lignin,coal, and particulate carbon in the presence of chlorine-donors.
From the knowledge gained from MSWIs it can be concluded that PCDD/PCDF can be formed inother thermal processes in which chlorine-containing substances are burnt together with carbonand a suitable catalyst (preferably copper) at temperatures above 300 °C in the presence ofexcess air or oxygen. Preferentially dioxin formation takes place in the zone when combustiongases cool down from about 450 °C to 250 °C (de novo synthesis) and not in the combustionchamber. Possible sources of the chlorine input are PVC residues as well as chloroparaffins inwaste oils and inorganic chlorine.
An overview on combustion sources known to generate and to emit PCDD/PCDF is shown inTable 3. It should be mentioned that PCDD/PCDF are not only found in the stack gases but alsoin the solid residues from any combustion process, e.g. bottom ashes, slags, and fly ash. Typicalconcentrations for solid residues from waste incineration are given in Table 4. With advancedtechnology and better burn-out of the ashes and slags (characterized by a low content on organiccarbon), the PCDD/PCDF concentrations declined (Fiedler 1996b).
Table 3: PCDD/PCDF combustion sources
Stationary sourcesWaste incineration: Municipal solid waste, clinical, hazardous waste, sewage sludgeSteel industry: Steel mills, sintering plants, hot-strip millsRecycling plants: Non-ferrous metals (melting, foundry; Al, Cu, Pb, Zn, Sn),Energy production: Fossil fuel power plants, wood combustion, landfill gasDiffuse sourcesTraffic: AutomobilesHome heating: Coal, oil, gas, woodAccidents: PCB fires, fires in buildings, forest fires, volcanic eruptions)
Dioxin and Furan Inventories 15
UNEP Chemicals May 1999
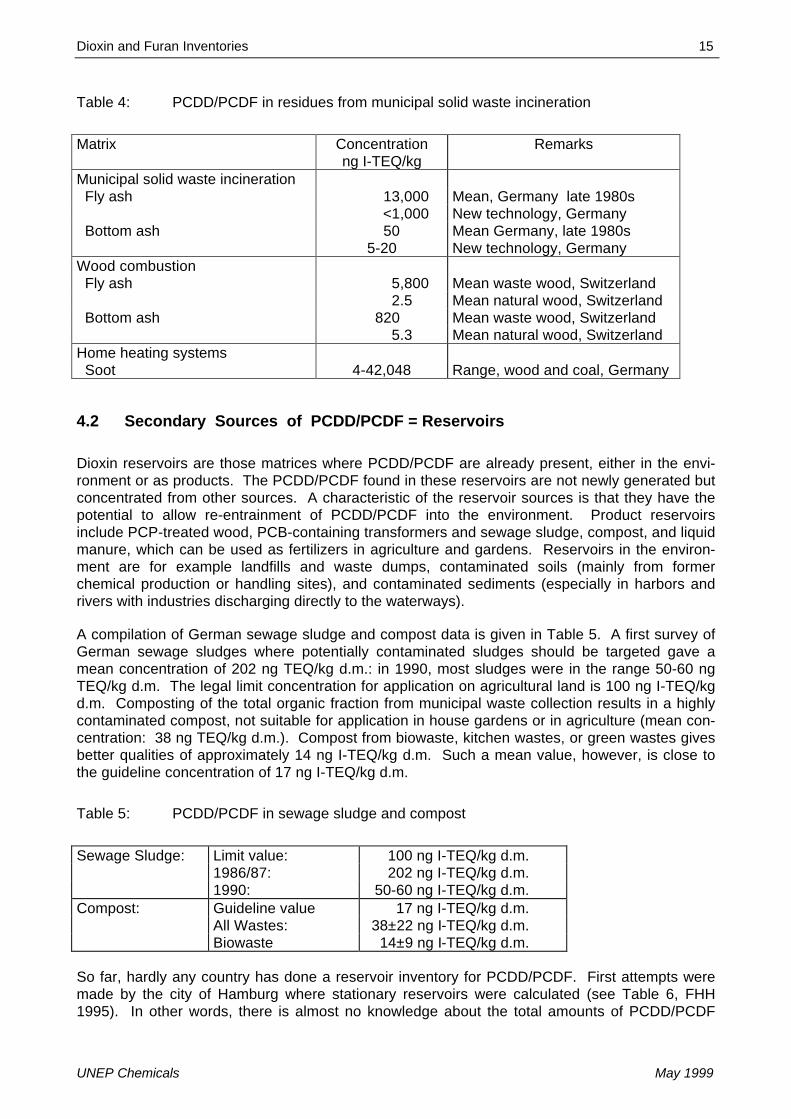
Table 4: PCDD/PCDF in residues from municipal solid waste incineration
Matrix Concentrationng I-TEQ/kg
Remarks
Municipal solid waste incineration Fly ash 13,000 Mean, Germany late 1980s
<1,000 New technology, Germany Bottom ash 50 Mean Germany, late 1980s
5-20 New technology, GermanyWood combustion Fly ash 5,800 Mean waste wood, Switzerland
2.5 Mean natural wood, Switzerland Bottom ash 820 Mean waste wood, Switzerland
5.3 Mean natural wood, SwitzerlandHome heating systems Soot 4-42,048 Range, wood and coal, Germany
4.2 Secondary Sources of PCDD/PCDF = Reservoirs
Dioxin reservoirs are those matrices where PCDD/PCDF are already present, either in the envi-ronment or as products. The PCDD/PCDF found in these reservoirs are not newly generated butconcentrated from other sources. A characteristic of the reservoir sources is that they have thepotential to allow re-entrainment of PCDD/PCDF into the environment. Product reservoirsinclude PCP-treated wood, PCB-containing transformers and sewage sludge, compost, and liquidmanure, which can be used as fertilizers in agriculture and gardens. Reservoirs in the environ-ment are for example landfills and waste dumps, contaminated soils (mainly from formerchemical production or handling sites), and contaminated sediments (especially in harbors andrivers with industries discharging directly to the waterways).
A compilation of German sewage sludge and compost data is given in Table 5. A first survey ofGerman sewage sludges where potentially contaminated sludges should be targeted gave amean concentration of 202 ng TEQ/kg d.m.: in 1990, most sludges were in the range 50-60 ngTEQ/kg d.m. The legal limit concentration for application on agricultural land is 100 ng I-TEQ/kgd.m. Composting of the total organic fraction from municipal waste collection results in a highlycontaminated compost, not suitable for application in house gardens or in agriculture (mean con-centration: 38 ng TEQ/kg d.m.). Compost from biowaste, kitchen wastes, or green wastes givesbetter qualities of approximately 14 ng I-TEQ/kg d.m. Such a mean value, however, is close tothe guideline concentration of 17 ng I-TEQ/kg d.m.
Table 5: PCDD/PCDF in sewage sludge and compost
Sewage Sludge: Limit value: 100 ng I-TEQ/kg d.m.1986/87: 202 ng I-TEQ/kg d.m.1990: 50-60 ng I-TEQ/kg d.m.
Compost: Guideline value 17 ng I-TEQ/kg d.m.All Wastes: 38±22 ng I-TEQ/kg d.m.Biowaste 14±9 ng I-TEQ/kg d.m.
So far, hardly any country has done a reservoir inventory for PCDD/PCDF. First attempts weremade by the city of Hamburg where stationary reservoirs were calculated (see Table 6, FHH1995). In other words, there is almost no knowledge about the total amounts of PCDD/PCDF

16 Dioxin and Furan Inventories
May 1999 UNEP Chemicals
present in sinks such as sediments of harbors, rivers, lakes, and oceans, landfills or contami-nated soils from (chemical) production sites. Reference is given within the country reports whendata are available.
Table 6: PCDD/PCDF reservoirs in Hamburg; reference year 1992
Compartment Reservoir (g I-TEQ) Percentage of TotalSoil (without landfills and contaminated areas) 4,340 68.7 %Sediments of the river Elbe and the harbor 1,980 31.3 %Water of the river Elbe and the harbor 1.1 <0.01 %Air 0.04 <<0.01 %Vegetation 1 <0.01 %Total 6,322 100 %
The PCDD/PCDF concentrations in the soil of Hamburg were found to be similar to those in otherGerman cities. Levels above average were detected in an industrially impacted area in thesouth-east of Hamburg, on so-called ”Spülflächen“, where excavated sediments from the riverElbe were placed and other areas naturally flooded by the river Elbe. To calculate the dioxinreservoir present in the soil of Hamburg, the total area was split into use categories as shown inTable 7.
Table 7: PCDD/PCDF reservoirs in the soil of Hamburg
Unit Area (km2) Reservoir (g I-TEQ)Total area of Hamburg (without surface waters) 695 4340Agricultural or horticultural use 200 690
Pasture / Grassland (Inside embankment) 50 60Arable land (Inside embankment) 101 420Gardens 49 210
Recreational areas, including forests 123 140Forest 43 60Lawn, parks, cemeteries 58 65Sport fields / Surface soils 4 4Children playgrounds 3 3Areas under natural protection 15 8
Areas impacted by industrial emissions 69 190Industrial areas 60 180Open areas along streets 9 10
Other areas 239 330Areas flooded in the past 31 2830Areas on outside of embankments 11 960Pasture / Grassland (Outside embankment) 9 760Arable land (Outside embankment) 2 200Spülfelder/Areas filled with sediments 20 1660Bille-Siedlung (residential area) 0.3 210Lower layers of walkways and sport fields 33 160Sport fields 2 20Roads 33 140
The PCDD/PCDF reservoir from Table 7 was calculated by multiplying the size of a given usepattern with the dioxin-relevant depth for agricultural (30 cm), garden (10 cm), horticultural

Dioxin and Furan Inventories 17
UNEP Chemicals May 1999
(20 cm) and other uses of soil (5 cm for litter in forest; 10 cm for forest soils and sports fields)with soil densities representative for the use pattern and typical PCDD/PCDF concentrations. Atotal dioxin reservoir of 4.3 kg I-TEQ was calculated to be present in the soils of Hamburg (Table7). The Hamburg inventory contains the „Spülflächen“ but not the landfills and contaminatedareas.
Other reservoirs include the former use of PCDD/PCDF-contaminated products such as 2,4,5-T(2,4,5-trichlorophenoxyacetic acid), polychlorinated biphenyls (PCB), and pentachlorophenol/-phenate (PCP/PCP-Na). Although there are estimates of the total amount of these compoundsproduced for various purposes, it seems impossible to deduce from these numbers a quantitativeimpact of PCDD/PCDF to the environment or humans (Fiedler 1995). Within the city of Hamburg,the dioxin reservoir in abandoned waste dumps and former production sites is summarized inTable 8.
Table 8: Hamburg: Reservoirs in landfills and contaminated areas
Location g I-TEQMoorfleeter Brack 1,400Landfill Georgswerder 270,000Landfill Müggenburger Straße 100,000Dump Brümmer 360Landfill Neuhöfer Straße No estimate possible on present data basisOchsenwerder Landscheideweg RemediatedFormer Production SitesBoehringer production site 6,000
It should be noted that similar contaminations were found or can be expected in many other loca-tions. As an example, She and Hagenmaier (1994) found almost 4,000 ng I-TEQ/kg in thesludges from a former chloralkali plant using graphite electrodes. However, so far, no quantifica-tion is available.
Although these reservoirs may be highly contaminated with PCDD/PCDF, the chemical-physicalproperties of these compounds imply that dioxins and furans will stay absorbed to organic carbonof soils or other particles. On the other hand, mobilization can occur in the presence of lipophilicsolvents (⇒ leaching into deeper layers of soils and/or groundwater) or in cases of erosion orrun-off by rain from topsoil (⇒ translocation into the neighborhood). Experience has shown thatPCDD/PCDF transport due to soil erosion and run-off does not play a major role for environ-mental contamination and human exposure (Fiedler 1995).

18 Dioxin and Furan Inventories
May 1999 UNEP Chemicals
5 TECHNICAL ABATEMENT TECHNOLOGIES
As with any other pollutants, reduction of PCDD/PCDF emissions from production facilities intothe environment can be achieved in two ways: primary and secondary measures. Primarymeasures include steps which prevent formation of the pollutants; secondary measures removethe pollutants from entering the environment. Primary measures include:• Substitution of substances or additives entering the production process• Modification of the operation of the plant (for example: good combustion conditions such as
the three T’s = time, temperature, turbulence)• Changes of the design of the plant.
Normally, these measures are applied first to prevent formation of unwanted byproducts. How-ever, to comply with legal requirements, e.g. the limit value of 0.1 ng I-TEQ/m³ for waste incin-erators as set by many European countries, additional measures have to be taken to meet thelimit value. Such secondary measures were first developed for waste incinerators. Thus, mostexperiences with abatement technologies are available for municipal solid waste incineration.Technologies developed can be applied individually or in various combinations (It should benoted that compliance with a dioxin limit value is not the only critical number for combustionplants and the technologies developed very often also reduce emissions of other pollutants).Three techniques are capable of reducing dioxin concentrations to the limit value of 0.1 ngI-TEQ/m³ (Fiedler 1998):• Adsorption of PCDD/PCDF on active carbon or coke• Dry scrubbers with lime + active carbon followed by fabric filter• Selective catalytic reduction (SCR) using a TiO2-DENOX catalyst.
For further details and experiences from European countries, see LUA (1997). Chapters 8.6.1and 8.12.2 discuss abatement technologies that were applied in Germany and the EuropeanUnion as well. Such information was compiled to explain trends in PCDD/PCDF emissions withina country or to show potentials for further reduction.

Dioxin and Furan Inventories 19
UNEP Chemicals May 1999
6 LEGISLATIVE AND REGULATORY MEASURES
This chapter briefly addresses legislation and regulation of polychlorinated dibenzo-p-dioxins andpolychlorinated dibenzofurans (PCDD/PCDF). In the various countries, steps have been under-taken to reduce formation of PCDD/PCDF in industrial and combustion processes or to reduceemissions of these compounds from the various sources. All efforts aim to minimize exposuresof the environment and humans to PCDD/PCDF. There are several options for such action andmost of them have been used in the past: legally binding instruments, guidelines and recom-mendations. In addition, industries have committed to changes in processes, to use cleanerinput materials or to set maximum concentrations of PCDD/PCDF for their materials.
6.1 Tolerable Daily Intake (WHO)
Scientists today agree that the major pathway of human exposure to PCDD/PCDF accounting for>95 % of the human intake is via ingestion of food. Uptake of water and soil (toddlers!),inhalation, and dermal contact are of minor concern.
In May 1998, WHO evaluated the risks which dioxins may cause to health. Previously, in 1990,WHO experts had established a tolerable daily intake (TDI) of 10 pg TCDD/kg bw whichsubsequently was adopted by many countries. Since then, new epidemiological data haveemerged, especially on neurotoxicological development and the endocrine system. Finally, WHOexperts agreed on a new TDI of 1 to 4 picogram per kilogram body weight per day based on newscientific evidence. The experts however recognized that subtle effects occur in the generalpopulation in developed countries at background levels of 2 to 6 picograms per kilogram bodyweight and day. Therefore, WHO recommended that every effort should be made to reduceexposure to the lowest possible level. In addition, the range established for 2,3,7,8-Cl4DD shouldbe applied to a TEQ including the 17 2,3,7,8-substituted PCDD and PCDF as well as thecoplanar and mono-ortho substituted PCB (WHO 1998).
6.2 Indirect Measures
As polychlorinated dibenzo-p-dioxins and polychlorinated dibenzofurans have never been pro-duced intentionally on an industrial scale or for any commercial application, the production ofPCDD/PCDF cannot be prohibited or phased out by law. Therefore, indirect measures havebeen taken to reduce new inputs of PCDD/PCDF into the environment. The first laws addressedthe ban of chemicals known to be contaminated with PCDD/PCDF (ppb to ppm-range I-TEQ): Asa consequence most industrialized countries banned the production and use of polychlorinatedbiphenyls (PCB) and pentachlorophenol (PCP). Whereas PCB is banned in most industrializedcountries, PCP is still being produced and used outside the European Union.

20 Dioxin and Furan Inventories
May 1999 UNEP Chemicals
6.3 Direct Measures
6.3.1 Chemicals
In Germany, the First Ordinance on the Prohibition of Certain Chemicals has set stringent limitvalues for eight PCDD/PCDF in substances, preparations and articles placed on the market. Thisregulation was amended in 1994 and 1996 (ChemVerbotsV 1996) and the present ordinancesets limit values for all seventeen 2,3,7,8-chlorine substituted congeners as well as for eight ofthe lower brominated 2,3,7,8-bromine substituted dibenzo-p-dioxins and dibenzofurans,PBDD/PBDF). According to the law, substances, preparations and/or articles are not allowed tobe placed on the market:• if the sum of the concentrations of the congeners listed in column 1 under No. 1 of column 1
(Table 9) exceeds a value of 1 µg/kg, or• if the sum of the concentrations of the congeners listed in column 1 under Nos. 1 and 2
exceeds a value of 5 µg/kg, or• if the sum of the concentrations of the congeners listed in column 1 under Nos. 1, 2 and 3
(= all congeners substituted in 2,3,7,8-position), exceeds a value of 100 µg/kg.
Table 9: Limit values of PCDD/PCDF as given by the Chemicals LawNote: the concentrations given in Table 9 are absolute values, not I-TEQ!
Congeners Maximum ConcentrationsNo. 1 2,3,7,8-Cl4DD, 1,2,3,7,8-Cl5DD, 2,3,7,8-Cl4DF,
2,3,4,7,8-Cl5DFSum of congeners under No. 1:1µg/kg
No. 2 1,2,3,4,7,8-Cl6DD, 1,2,3,7,8,9-Cl6DD, 1,2,3,6,7,8-Cl6DD, 1,2,3,7,8-Cl5DF, 1,2,3,4,7,8-Cl6DF,1,2,3,7,8,9-Cl6DF, 1,2,3,6,7,8-Cl6DF, 2,3,4,6,7,8-Cl6DF
Sum of congeners under Nos. 1and 2: 5 µg/kg
No 3 1,2,3,4,6,7,8-Cl7DD, 1,2,3,4,6,7,8,9-Cl8DD,1,2,3,4,6,7,8-Cl7DF, 1,2,3,4,7,8,9-Cl7DF,1,2,3,4,6,7,8,9-Cl8DF
Sum of congeners under Nos. 1,2 and 3: <100 µg/kg
Similar regulations exist in the United States where in the Toxic Substances Control Act; maxi-mum permissible concentrations for 2,3,7,8-TCDD were set.
6.3.2 Regulations on Incineration and Combustion
As incineration of wastes was considered to be a major source of PCDD/PCDF emissions intothe environment, legally binding concentrations for stack emissions have been established inseveral countries. Whereas first regulations only included a requirement to minimizePCDD/PCDF emissions by applying Best Available Techniques (BAT), countries have movedtowards defined limit values. Very often, these laws also include requirements on sampling,analysis and reporting methods. In general, new incinerators have to comply immediately withthese limits. For existing incinerators there are transient times between three and six years tocomply with regulations.
A legally binding limit value of 0.1 ng I-TEQ/m³ for PCDD/PCDF is asked for hazardous wasteincinerators by Directive 94/67/EC. Within two years, the member states of the European Unionhave to translate the requirements of this directive into national law. It can be assumed that
Dioxin and Furan Inventories 21
UNEP Chemicals May 1999
today, all 15 member States have such legislation in place. Countries like Austria, Belgium, Ger-many, Finland, France, Italy, the Netherlands, and Sweden went beyond this requirement andincluded municipal waste incinerators, sewage sludge and hospital waste incinerators into theirnational laws. The remaining countries have the 0.1 ng I-TEQ/m³ limit as a guideline concentra-tion.
In the USA, there is a limit value of 0.2 ng TEQ/m³ for new municipal and of 0.15 ng I-TEQ/m³ fornew hazardous waste incinerators.
In its new law, Japan took a tiered approach: new incinerators with a capacity greater than 4 t/hhave to comply with a limit concentration of 0.1 ng I-TEQ/m³ (12 % O2) whereas the limits forMSWI <2 t/h and MSWIs with a capacity between 2-4 t/h are 5 ng I-TEQ/m³ and 1 ng I-TEQ/m³,respectively.
Some countries have issued additional laws:
Austria: a limit value of 0.4 ng I-TEQ/m³ was set for sinter plants built after 1 January 2001(Austria 1997a). For iron and steel plants, there is a limit value of 0.25 ng I-TEQ/m³ until 31December 2005. Limit value of 0.1 ng I-TEQ/m³ from 1 January 2006. For electric arc furnacesand induction ovens the limit is at 0.4 ng I-TEQ/m³. For existing plants, the latest date to complywith is five years after publication of the law (Austria 1997b).
Germany: in 1997, a dioxin limit value of 0.1 ng I-TEQ/m³ and a minimum temperature of 850 °Cfor crematories was set by law (27th BImSchV 1997).
Canada: a guideline concentration of 0.5 ng TEQ/m³ was set for municipal waste, hazardouswaste and clinical waste incinerators (CCME 1989 and 1992, respectively)
Japan: electric furnaces used for metal smelters are controlled through the Air Pollution ControlLaw with 0.5 ng I-TEQ/m³ for newly established furnaces and 1 ng I-TEQ/m³ for existing ones.
6.4 Further Regulations
To stop the entry of dioxins and furans into the environment from use of so-called scavengers(e.g. dichloroethane or dibromoethane) as additives in leaded gasoline, a ban of the use opf suchscavengers was implemented in 1992 in Germany (19th BImSchV 1992).
It is known that sewage sludge is contaminated with PCDD/PCDF. To reduce input ofPCDD/PCDF through application of sewage sludge, Germany established a limit value of 100 ngI-TQ/kg dry matter for sewage sludges used as fertilizer in agriculture, horticulture or forestry((AbfKlärV 1992). In addition, the law sets a freight limit for 5 tons of dry matter of sewagesludge per hectare once within three years. Application of sewage sludge on pasture is forbid-den by law.
Similarly, Austria established maximum concentration of 50 ng I-TEQ/kg in fertilizers, soil addi-tives, culture substrates, and plant additives. In addition, products containing 20-50 ng TEQ/kghave to be labeled with a warning sign “Attention contains dioxins/furans“ (forbidden for use onchildren’s playgrounds). Culture substrates are not allowed to contain more than 20 ng TEQ/kg(Austria 1994). In addition, the States of Oberösterreich (o.Ö.) and Niederösterreich (N.Ö.) pub-lished ordinances with a limit value of 100 ng I-TEQ/kg d.m. for sewage sludge.

22 Dioxin and Furan Inventories
May 1999 UNEP Chemicals
6.5 Guidelines for Soil and Milk
Guidelines and recommendations have been established for sensitive uses such as soil and dairyproducts. The proposed measures and guidelines are recommendations for action but they arenot legally binding. Nevertheless, they are a basis for political decisions to protect human healthand the environment. In some cases, e.g. accidents such as a fire at a plastic store, theserecommendations for actions were used for decision making.
6.5.1 Soil
The guideline concentrations established by Germany, the Netherlands, and Sweden are com-piled in Table 10.
In Germany, the first report of the Joint [Dioxin] Working Group was published in 1992 and con-tained the reference values and recommended action for agricultural and horticultural land uses(Table 10, BLAG 1992):• For preventive reasons and as a long-term objective, the dioxin concentrations of soil used
for agricultural purposes should be reduced to below 5 ng TEQ per kg;• Cultivation of foodstuffs is not restricted in the case where the soil contains 5-40 ng per kg.
However, critical land uses, e.g. grazing management, should be avoided if increased dioxinlevels were found in foodstuffs grown on such soils;
• Limitations on the cultivation of certain feedstuffs and foodstuffs might be necessary if thedioxin contamination were above 40 ng TEQ per kg soil. However, unlimited cultivation isallowed for plants with minimum dioxin transfer, e.g. corn.
Guideline values were established for measures to be taken on children’s playgrounds and inresidential areas:• Remediation of contaminated soil is required in playgrounds if the soil contains more than
100 ng TEQ per kg. Remediation means sealing, decontamination or exchange of soil;• In residential areas, such action should be taken if the soil is contaminated with more than
1,000 ng TEQ per kg;• In industrial areas, the limit value was set to 10,000 ng TEQ per kg.
The recommendations have been translated into governmental decrees in a number of Länder(Federal States in Germany).
In 1988, the Netherlands published a guideline for classification and remediation of soil (LeidraadBodemsanering 1988). Since its revision in 1994, there is a guideline level for PCDD/PCDF of1 ng I-TEQ/kg d.m. for agricultural use and of 10 ng I-TEQ/kg d.m. for dairy farming.
In Sweden, there is a guideline concentration of 10 ng I-TEQ/kg d.m. for sensitive uses and of250 ng I-TEQ/kg d.m. for less sensitive uses.

Dioxin and Furan Inventories 23
UNEP Chemicals May 1999
Table 10: Soil guideline concentrations (Concentrations in ng I-TEQ/kg d.m.)
Germany< 5 Target concentration
5-40 Control of products if dioxin transfer>100 Soil exchange on children playgrounds
>1 000 Soil exchange in residential areas>10 000 Soil exchange independent of the location
The Netherlands1 Agricultural farming
10 Dairy farmingSweden
10 Sensitive uses250 Non-sensitive uses
6.5.2 Milk and Milk Products
Germany, Ireland, The Netherlands, and the United Kingdom established guidelines forPCDD/PCDF concentrations and recommendations in milk. The guideline concentrations aresummarized in Table 11.
For Germany, the second report of the Joint Working Group contained guidelines and maximumvalues for milk and dairy products together with recommendations for action (BLAG 1993).The limit values as given in Table 11 were derived as follows:• based on a TDI (total daily intake) value of 10 pg 2,3,7,8-TCDD/kg body weight and day, the
maximum dioxin concentration in milk should not exceed 5.0 pg TEQ/g milk fat. Thus, milkand dairy products should not be out on the market if the dioxin contamination exceeds thisvalue. However, from the existing data it is obvious, that a limit value of 5 pg TEQ/g milk fatwould cut off only a few cases of extreme contamination, this limit value was considered notto have any consequences at all and would not improve the consumer’s situation;
• to reduce the human impact via consumption of dairy products, a limit value of 3 pg TEQ/g fatwas set. If such concentration were exceeded, the dioxin source should be identified andemission reducing measures taken. Moreover, it was recommended that direct supply to theconsumer be stopped for milk and dairy products containing more than 3 pg TEQ/g fat; and
• finally, an orientation value of 0.9 pg TEQ/g milk fat, based on the principle of precaution, wasset. This concentration was derived from a TDI of 1 pg TEQ/kg body weight and day. Thevalue of 0.9 pg TEQ/g milk fat can only be regarded as target value to be achieved as thedata from Germany and other European countries showed that more than 50 % of all dioxinconcentrations in milk would exceed this value. To reach this target, it is necessary to furtherreduce the dioxin release into the environment.
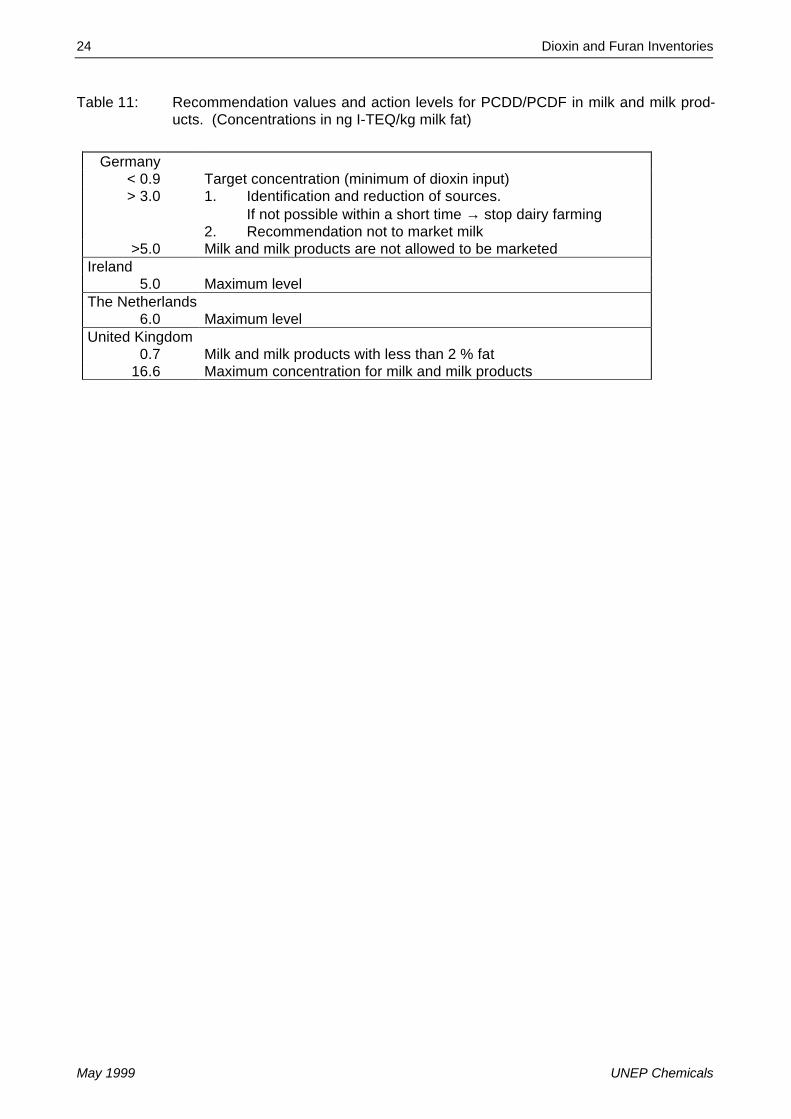
24 Dioxin and Furan Inventories
May 1999 UNEP Chemicals
Table 11: Recommendation values and action levels for PCDD/PCDF in milk and milk prod-ucts. (Concentrations in ng I-TEQ/kg milk fat)
Germany< 0.9 Target concentration (minimum of dioxin input)> 3.0 1. Identification and reduction of sources.
If not possible within a short time → stop dairy farming2. Recommendation not to market milk
>5.0 Milk and milk products are not allowed to be marketedIreland
5.0 Maximum levelThe Netherlands
6.0 Maximum levelUnited Kingdom
0.7 Milk and milk products with less than 2 % fat16.6 Maximum concentration for milk and milk products

Dioxin and Furan Inventories 25
UNEP Chemicals May 1999
7 METHODS TO ESTABLISH DIOXIN INVENTORIES
The data on emissions of dioxins and furans, more precisely polychlorinated dibenzo-p-dioxinsand polychlorinated dibenzofurans (PCDD/PCDF), compiled in this report are based on a multi-tude of sources. This variety is also reflected in the depth of the information available. For somecountries (e.g. Canada, Denmark, the Netherlands, Belgium, Australia, and Germany) full reportswere available given in-depth information on generation of data and aggregation. Unfortunately,some reports are only available in the original language (e.g. Belgium, the Netherlands). Some-times, the emission inventories (or the most recent updates) were taken from references found inthe scientific literature (e.g. Korea and the United Kingdom). In such cases, less backgroundinformation is available on how data were generated and how extrapolation to a nationwide basiswas performed. The information for Austria and France was found in the Internet on thehomepage of the Environmental Agency. Extracts of national emission inventories were providedby the Czech Republic (data together with the Slovak Republic), Hungary, and the SlovakRepublic. Very often not more than the “pure” data were available. For two countries, USA andSweden, the national emission inventories are still in a draft stage. Nevertheless, the USA hasdistributed several hundred pages of background information (including an electronic database)of the draft report. In addition, data are based on personal communications as some reports arenot yet finished, e.g. Sweden.
In this report, concentrations of dioxins and furans are given in International Toxicity Equivalents(TEQ) using the International Toxicity Equivalency Factors (I-TEF) as established by theNATO/CCMS Working Group on Dioxins and Related Compounds in 1988 (NATO/CCMS 1988a)(the list of the I-TEFs is Appendix A).
Most authors used the same approach to calculate the annual emission from a given source:
Emission of source = Emission factor x “Activity rate” (1)
Or
Emission of source = Concentration in emission x· Operational hours (2)
The PCDD/PCDF emission per year is given in grams TEQ per year. According to equation (1),the annual flux is calculated by multiplying the release of PCDD/PCDF (e.g. in µg I-TEQ) per unitof feed material processed or produced (e.g. ton or liter) with the amount of feed material proc-essed or produced (ton per year). A second method – equation (2) – calculates the annual emis-sion of a source by multiplying the measured emissions (e.g. in ng I-TEQ/m³) with the operationalhours per year.
In order to make a source emission estimate, information is required for
a) Representative dioxin measurements for a given source. In many cases, these estimates arevery uncertain as emissions are deduced from a few test results only and extrapolated to anation-wide basis. In other cases there are no data existing and thus, either numbers from theliterature were taken or emissions derived from similar processes.
b) The total amount of feed material processed or produced. Very often, there is a high degreeof certainty for such information, e.g. all fields of waste disposal, paper and pulp production,fuel consumed, etc.
26 Dioxin and Furan Inventories
May 1999 UNEP Chemicals
A second approach to calculate annual PCDD/PCDF emissions is to multiply measured concen-trations with annual operational hours of a plant and the total volume of exhaust gases emitted.
Presently, there exist no harmonized methods how to generate and how to evaluatePCDD/PCDF inventories. As a consequence, some countries use lower and upper ranges toreport the data whereas other countries report mean or median values.
Further differences occur in the way domestic and external data are handled: e.g. the UnitedStates did not take into account emission data from foreign countries or the non-peer-reviewedliterature (e.g. from other agencies). Considering the information contained in these datasources would have helped to address uncertainties in the estimates and fill data gaps forrelease estimates. Other countries, like Australia, almost completely rely on foreign data toestablish the national emission inventory.
All PCDDD/PCDF inventories compiled in this report attempt to quantify emissions to the air. Afew countries such as the United Kingdom, Canada, Sweden include releases to water andland/landfills or with products. The United Kingdom, the Netherlands and the United States to acertain extent also include releases from reservoirs, e.g. PCP in wood.

Dioxin and Furan Inventories 27
UNEP Chemicals May 1999
8 EUROPEAN DIOXIN INVENTORIES
8.1 Austria
In Austria, it is estimated that a total of 28.7 g I-TEQ was emitted from known sources in the year1994 (UBAVIE 1996). The emissions of the various sectors are summarized in Table 12. Thesector of non-industrial combustion plants emits 16.7 g I-TEQ corresponding to 58 % of the totalemissions. About 92 % of the dioxin emissions are produced from combustion of fuel-wood. Therelative contribution from residential plants amounts to more than 49 % of the PCDD/PCDF emis-sions of this sector.
Table 12: PCDD/PCDF emissions in Austria. Fluxes in g I-TEQ/a, reference year 1994(UBAVIE 1996)
Source Category (g I-TEQ/a)Combustion in energy and transformation industries 0Non-industrial combustion plants 16.67Combustion in manufacturing industry 1.50Production processes 10.360Road transport 0Waste treatment and disposal 0.179Nature 0.024Total 28.733
8.2 Belgium
A study prepared by De Fré and Wevers (1995) describes the trends of dioxin emissions for thethree regions in Belgium in the period 1985-1995. In 1990 it was agreed to reduce the flux ofdangerous substances to the sea via air, water, and waste by the following means:
• Emission reductions of all persistent, toxic, and bioaccumulating substances from allanthropic sources into the marine environment as agreed in the London Declaration. Beforethe year 2000, all discharges of these substances are to be decreased below levels that areharmful to man and environment.
• A significant reduction of 50 % or more of the influx via rivers and estuaria between 1985 and1995 and of all atmospheric emissions by 1995 or at the latest by 1999 should be achieved.
• A decrease of discharge via all pathways of 70 % or more between 1985 and 1995 for thosesubstances that form a major threat to the marine environment, and at least for dioxins, mer-cury, cadmium, and lead, provided that the Best Available Technology, or other technologieswhich generate limited amounts of waste enable such reductions.
The Belgium emission inventory of PCDD/PCDF was compiled in 1995 and summarizes informa-tion on dioxin releases to air and waters for 15 sectors (De Fré and Wewers 1995). The emissioninventory estimates are based on measurements available in Belgium and on emission factors
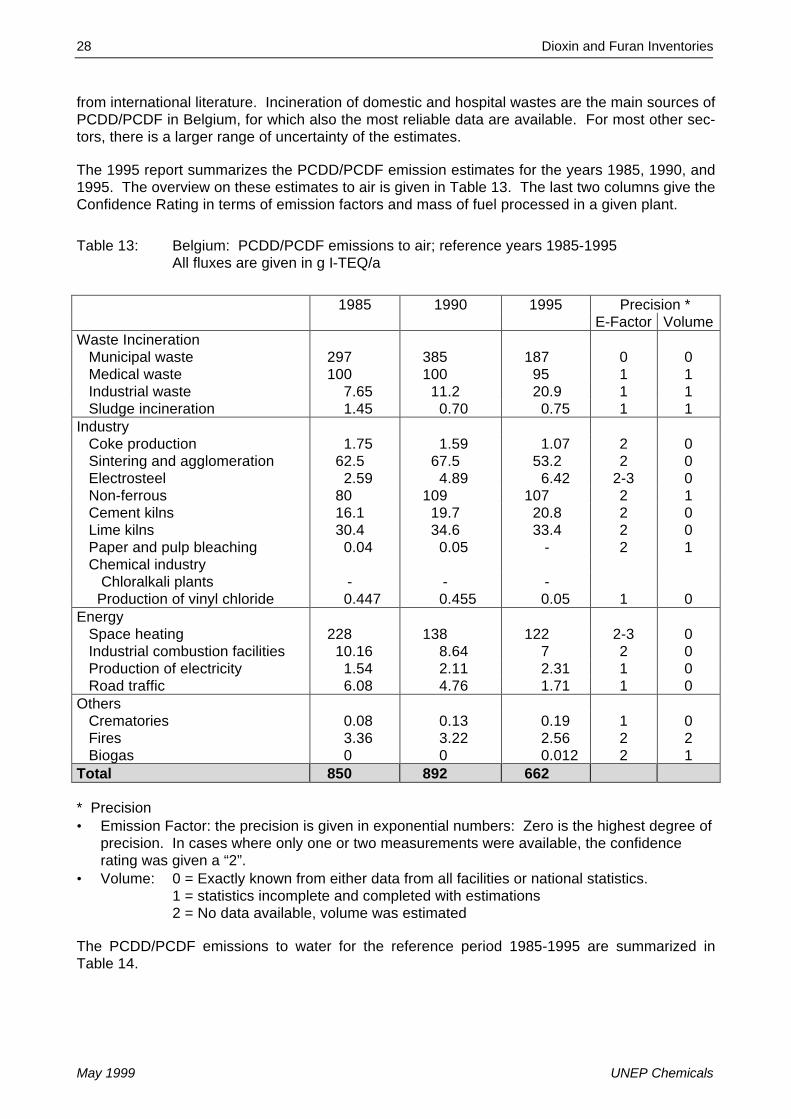
28 Dioxin and Furan Inventories
May 1999 UNEP Chemicals
from international literature. Incineration of domestic and hospital wastes are the main sources ofPCDD/PCDF in Belgium, for which also the most reliable data are available. For most other sec-tors, there is a larger range of uncertainty of the estimates.
The 1995 report summarizes the PCDD/PCDF emission estimates for the years 1985, 1990, and1995. The overview on these estimates to air is given in Table 13. The last two columns give theConfidence Rating in terms of emission factors and mass of fuel processed in a given plant.
Table 13: Belgium: PCDD/PCDF emissions to air; reference years 1985-1995All fluxes are given in g I-TEQ/a
1985 1990 1995 Precision *E-Factor Volume
Waste IncinerationMunicipal waste 297 385 187 0 0Medical waste 100 100 95 1 1Industrial waste 7.65 11.2 20.9 1 1Sludge incineration 1.45 0.70 0.75 1 1
IndustryCoke production 1.75 1.59 1.07 2 0Sintering and agglomeration 62.5 67.5 53.2 2 0Electrosteel 2.59 4.89 6.42 2-3 0Non-ferrous 80 109 107 2 1Cement kilns 16.1 19.7 20.8 2 0Lime kilns 30.4 34.6 33.4 2 0Paper and pulp bleaching 0.04 0.05 - 2 1Chemical industry Chloralkali plants - - - Production of vinyl chloride 0.447 0.455 0.05 1 0
EnergySpace heating 228 138 122 2-3 0Industrial combustion facilities 10.16 8.64 7 2 0Production of electricity 1.54 2.11 2.31 1 0Road traffic 6.08 4.76 1.71 1 0
OthersCrematories 0.08 0.13 0.19 1 0Fires 3.36 3.22 2.56 2 2Biogas 0 0 0.012 2 1
Total 850 892 662
* Precision• Emission Factor: the precision is given in exponential numbers: Zero is the highest degree of
precision. In cases where only one or two measurements were available, the confidencerating was given a “2”.
• Volume: 0 = Exactly known from either data from all facilities or national statistics.1 = statistics incomplete and completed with estimations2 = No data available, volume was estimated
The PCDD/PCDF emissions to water for the reference period 1985-1995 are summarized inTable 14.
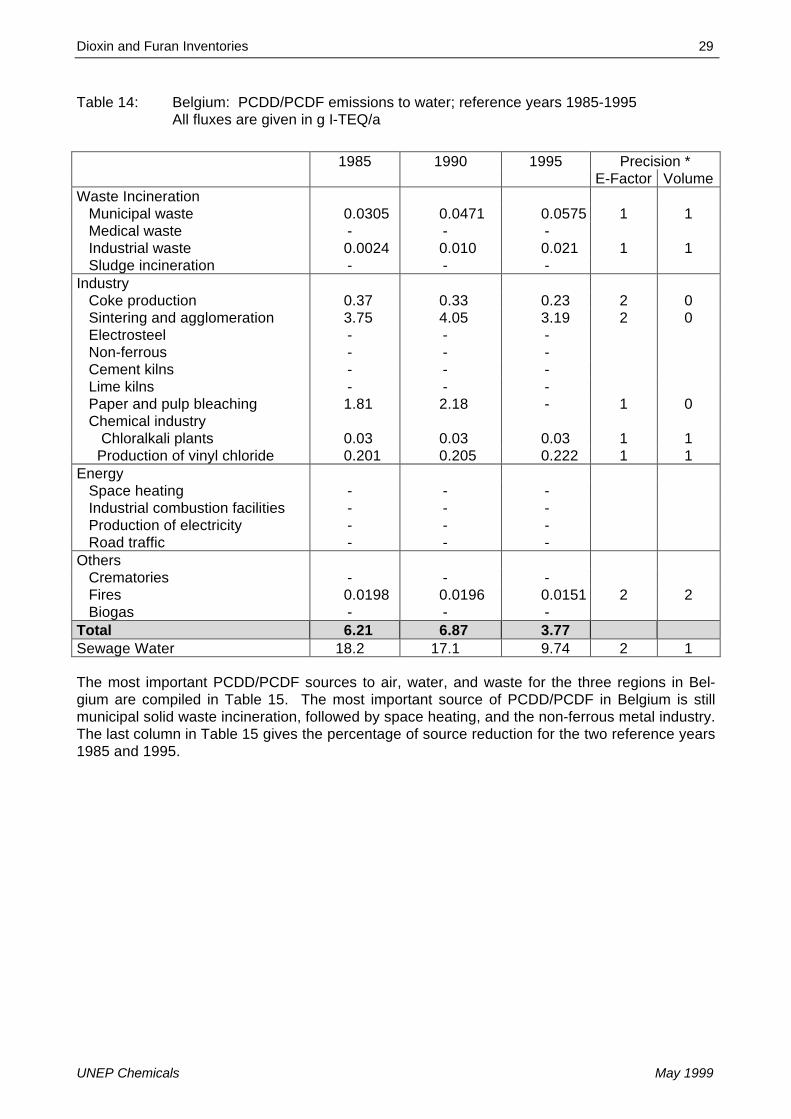
Dioxin and Furan Inventories 29
UNEP Chemicals May 1999
Table 14: Belgium: PCDD/PCDF emissions to water; reference years 1985-1995All fluxes are given in g I-TEQ/a
1985 1990 1995 Precision *E-Factor Volume
Waste IncinerationMunicipal waste 0.0305 0.0471 0.0575 1 1Medical waste - - -Industrial waste 0.0024 0.010 0.021 1 1Sludge incineration - - -
IndustryCoke production 0.37 0.33 0.23 2 0Sintering and agglomeration 3.75 4.05 3.19 2 0Electrosteel - - -Non-ferrous - - -Cement kilns - - -Lime kilns - - -Paper and pulp bleaching 1.81 2.18 - 1 0Chemical industry Chloralkali plants 0.03 0.03 0.03 1 1 Production of vinyl chloride 0.201 0.205 0.222 1 1
EnergySpace heating - - -Industrial combustion facilities - - -Production of electricity - - -Road traffic - - -
OthersCrematories - - -Fires 0.0198 0.0196 0.0151 2 2Biogas - - -
Total 6.21 6.87 3.77Sewage Water 18.2 17.1 9.74 2 1
The most important PCDD/PCDF sources to air, water, and waste for the three regions in Bel-gium are compiled in Table 15. The most important source of PCDD/PCDF in Belgium is stillmunicipal solid waste incineration, followed by space heating, and the non-ferrous metal industry.The last column in Table 15 gives the percentage of source reduction for the two reference years1985 and 1995.
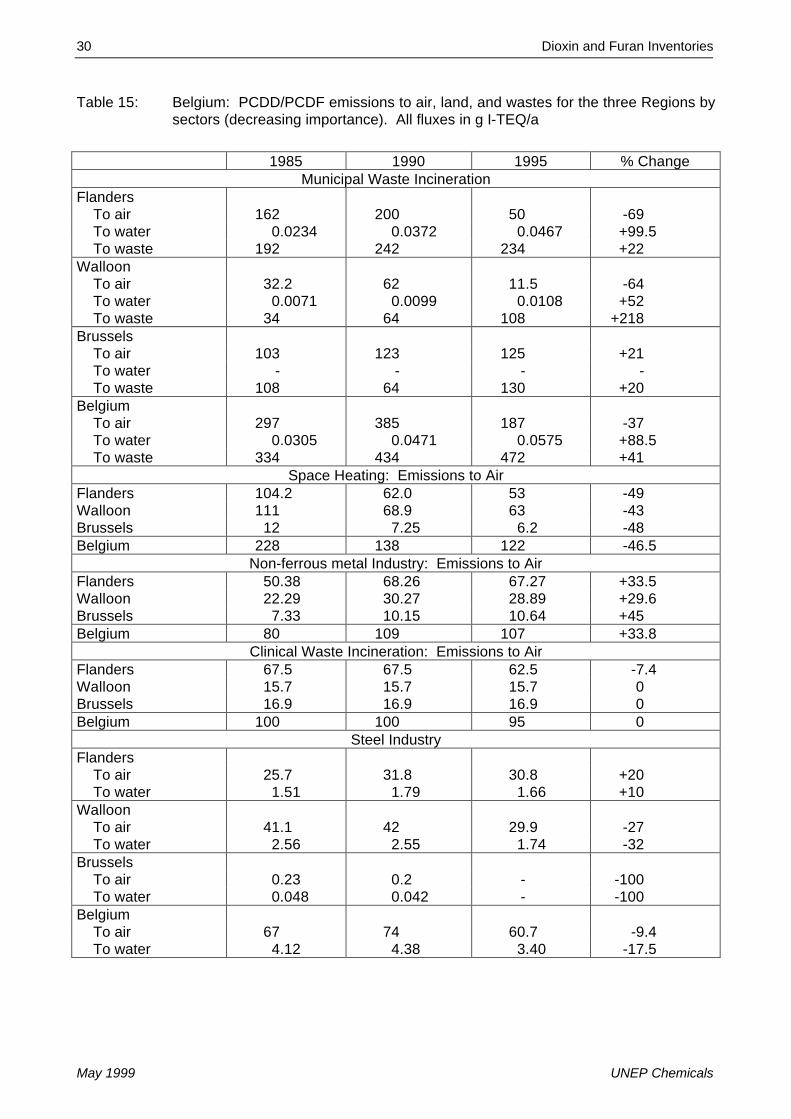
30 Dioxin and Furan Inventories
May 1999 UNEP Chemicals
Table 15: Belgium: PCDD/PCDF emissions to air, land, and wastes for the three Regions bysectors (decreasing importance). All fluxes in g I-TEQ/a
1985 1990 1995 % ChangeMunicipal Waste Incineration
Flanders To air 162 200 50 -69 To water 0.0234 0.0372 0.0467 +99.5 To waste 192 242 234 +22Walloon To air 32.2 62 11.5 -64 To water 0.0071 0.0099 0.0108 +52 To waste 34 64 108 +218Brussels To air 103 123 125 +21 To water - - - - To waste 108 64 130 +20Belgium To air 297 385 187 -37 To water 0.0305 0.0471 0.0575 +88.5 To waste 334 434 472 +41
Space Heating: Emissions to AirFlanders 104.2 62.0 53 -49Walloon 111 68.9 63 -43Brussels 12 7.25 6.2 -48Belgium 228 138 122 -46.5
Non-ferrous metal Industry: Emissions to AirFlanders 50.38 68.26 67.27 +33.5Walloon 22.29 30.27 28.89 +29.6Brussels 7.33 10.15 10.64 +45Belgium 80 109 107 +33.8
Clinical Waste Incineration: Emissions to AirFlanders 67.5 67.5 62.5 -7.4Walloon 15.7 15.7 15.7 0Brussels 16.9 16.9 16.9 0Belgium 100 100 95 0
Steel IndustryFlanders To air 25.7 31.8 30.8 +20 To water 1.51 1.79 1.66 +10Walloon To air 41.1 42 29.9 -27 To water 2.56 2.55 1.74 -32Brussels To air 0.23 0.2 - -100 To water 0.048 0.042 - -100Belgium To air 67 74 60.7 -9.4 To water 4.12 4.38 3.40 -17.5

Dioxin and Furan Inventories 31
UNEP Chemicals May 1999
Table 15 (continued)
1985 1990 1995 % ChangeIncineration of Industrial Waste
Flanders To air 0.36 5.76 +4,761 To water 0.0001 0.008 +19,900 To waste 0.007 0.064 +3,271Walloon To air 0.09 0.09 0.09 0 To water - - - - To waste - - - -Brussels To air 7.2 5.34 3.31 -54 To water 0.0023 0.0017 0.001 -56.5 To waste 0.135 0.1 0.062 -54Belgium To air 7.65 11.2 20.9 +173 To water 0.0024 0.010 0.021 +775 To waste 0.142 0.164 0.298 +110
Cement Kilns: Emissions to AirFlanders 0.5 0.60 0.60 +20Walloon 15.6 19.1 20.2 +29Belgium 16.1 19.7 20.8 +29
Lime Kilns: Emissions to AirWalloon 30.4 34.6 33.4 +9.9Belgium 30.4 34.6 33.4 +9.9(margins) (10.5-49.7) (11.9-56.5) (11.5-54.5)
A summary of all PCDD/PCDF emissions by regions is shown in Table 16. It can be seen thatthe overall reduction of PCDD/PCDF for air emissions was 22 % from 1985 to 1995. This meansthat the goal of a 70 % reduction was not achieved. The major reason for such result is that in1985 only a few dioxin sources were identified, and by 1995, many additional sources werediscovered, e.g. the sectors of the metal industry and the non-ferrous metal industry. In addition,it takes several years until measures for emission reductions are fully implemented. For exam-ple, once all municipal solid waste incinerators in Belgium will comply with legal requirements, theemissions from this source will be reduced to 0.95 g I-TEQ/a, which represents a drop of 99.7 %from the 1985 emissions.
In the report from Belgium it was found that only a limited number of sources were identified thathave emissions to water. Generally, the emission factors for these sources were much lowerthan those to air and waste emissions. Nevertheless, the PCDD/PCDF concentrations in munici-pal sewage sludges from Belgium indicate dioxin emissions from household and industrial waste-waters probably cause higher emissions into surface waters than the primary sources shown inTable 14.

32 Dioxin and Furan Inventories
May 1999 UNEP Chemicals
Table 16: Belgium: Summarizing table - PCDD/PCDF emissions to air, water, and waste forthe three Regions; reference years 1985-1995. All fluxes in g I-TEQ/a
1985 1990 1995 % ReductionFlanders To air 425 448 291 31.5 To water 1.58 1.88 1.78 +12.7 To waste 201 251 243 +21Walloon To air 277 281 208 25 To water 4.58 4.95 1.99 56.5 To waste 38.3 68.3 112 +192Brussels To air 148 164 163 +10 To water 0.05 0.045 0.002 96 To waste 108 128 130 +20Belgium To air 850 892 662 22 To water 6.21 6.87 3.77 39 To waste 347 447 485 +40
8.3 Czech Republic and Slovak Republic
Estimated PCDD/PCDF emissions for the Czech and the Slovak Republics combined (formerCzechoslovakia) were calculated in 1993 and 1995 (Holoubek et al. 1993, Parma et al. 1995).First semi-quantitative estimates of POPs emissions in the Czech Republic and the SlovakRepublic were determined to 30.25 g I-TEQ/a
Table 17: PCDD/PCDF emission estimates combined for the Czech Republic and the SlovakRepublic. Concentrations in g I-TEQ/a
Source Emission Estimate (g I-TEQ/a)Residential fuel combustion
Anthracite 0.81Brown coal 11.35
Grey iron foundries 0.74Municipal waste incinerators
Czech Republic 3.6Slovak Republic 6.00
Industrial waste incinerators 7.68Incineration of waste oil Input and output parameters unknownSewage sludge incineration Combusted amount unknownIncineration of hospital waste unknown

Dioxin and Furan Inventories 33
UNEP Chemicals May 1999
8.4 Denmark
The 1997 Working Document ”Dioxins, Sources, Levels and Exposures in Denmark“ (Ministry ofEnvironment and Energy 1997) gives an update of an earlier report published in Danish languagein 1995. The total PCDD/PCDF emissions to the atmosphere in 1995 from all known sourceswere estimated at about 50 g I-TEQ. Municipal solid waste incineration is the largest atmosphericdioxin source with an emission of 20 g I-TEQ/a. The other main pollution sources are incinerationof hospital clinical wastes/healthcare risk wastes with an air emission of 5 g I-TEQ, and a steelreclamation plant with an annual air emission of 7.5 g I-TEQ. Based on the limited data Danishdioxin emissions seem to be decreasing.
The present inventory does not include Greenland and the Faroe islands. The Ministry ofEnvironment and Energy plans for a broader dioxin study to be performed in the year 2001,which then will also evaluate the situation in these two areas.
The main sources (2 g I-TEQ/a) of soil pollution by dioxins are application of sewage sludge andcompost to agricultural land. Most dioxin residues are found in fly ash from coal firing.
The new data is mainly based on very few measurements (spot tests) of a few items, such aswood stoves, biofuels, sewage sludge, and textiles. Based on the available data, it is concludedthat dioxin emissions to the Danish environment from known sources are lower than reportedearlier. The total Danish dioxin emission to the atmosphere in 1991 from all known sources wasestimated to about 100 g N-TEQ. The corresponding figure for 1995 was less than 50 g I-TEQ.For the purpose of a dioxin inventory, the difference in applying Nordic TEFs (N-TEFs) or theInternational TEFs (I-TEFs) is negligible as the two schemes differ only in a single congener: Inthe N-TEF scheme 1,2,3,7,8-Cl5DF is given a TEF of 0.01 whereas in the I-TEF scheme a valueof 0.05 is assigned to this specific congener. So far, there is no source identified where this con-gener plays an important role.

34 Dioxin and Furan Inventories
May 1999 UNEP Chemicals
Table 18: Sources of PCDD/PCDF in Denmark; reference year 1995 (Ministry ofEnvironment and Energy 1997)
Emission to (g I-TEQ/a)Activity/ Process Air Water Soil Waste/Residue TotalChemical industry - - - - -Paper and pulp industry - - - - -Asphalt-mixing industries 0.1 - - - 0.1Steel and metal industry- steel reclamation- shredder plants- cable scrap burning
7.50.13
---
---
34?-
42?
0.13Cement industry 0.08-1.5 - - - 0.08-1.5Fossil fuels- pit coal- other
2-
--
--
40-
42-
Burning biofuels- straw- woods
0.07-6.60.25
--
--
--
0.7-6.60.25
Wood stoves 1.1 - - - 1.1Heating of houses, gas oil 0.02 - - - 0.02Building, landfill, vehicle fires ? - - - ?Municipal solid waste 20 - - 100 120Incineration of hospital/healthcare risk waste
5 - - - 5
Incineration of hazardous waste- hazardous waste+waste oil- waste oil (district heating)
0.230.038
--
--
1.0-
1.230.038
Emission from crematoria 0.16 0.16Sewage sludge- sludge landfilled- sludge amended to soil- sludge incinerated
--
0.072
--
0.108
-1.1-
0. 19-
0.036
0.191.1
0.22Compost - - 1-5 - 1-5Traffic 0.2 - - - 0.2Textile products - 0.08 - - 0.08Air deposition - - 120 - 120
8.5 France
The French Ministry of Regional and National Development and the Environment together withthe national Environment Agency (ADEME) has initiated a study to identify and quantify emis-sions of PCDD/PCDF into air. Preliminary results from a limited number of sources quantified sofar are available via the internet (Adème 1999). The summary of annual emissions from thesesources for the reference year 1997 is displayed in Table 19. The major source identified inFrance is municipal waste incineration, which contributes to 400 g I-TEQ annually according tosources of Adème whereas CITEPA (Centre interprofessionel technique d’études de la pollutionatmosphérique) estimates 510 g I-TEQ annually. These emissions represent 30-40 % of the totalinventory.

Dioxin and Furan Inventories 35
UNEP Chemicals May 1999
Table 19: France: PCDD/PCDF emissions to air; reference year 1997 (Adème 1999)Numbers in italics are estimates from Centre interprofessionel technique d’étudesde la pollution atmosphérique (CITEPA)
Sector Emission per Year(I-TEQ/a)
Municipal solid waste incinerators 400 510Industrial/hazardous waste incinerators 2Industrial combustion processes. Combustion of
• Wood 4• Coal 9• Fossil fuels 10
Metallurgical processes• Iron melting 220-2200 (400)• Iron and steel foundries 1.2-80 (20)• Secondary aluminum 10• Secondary copper 10• Secondary zinc 7
Traffic (automobiles) 1-5
8.6 Germany
8.6.1 Federal Republic of Germany
In 1997, the Environmental Agency (UBA) published a PCDD/PCDF emission inventory for Ger-many (Johnke 1997) with past and future trends (Table 20).
In the 1980s, total emissions in the Federal Republic of Germany ranged from 1 kg I-TEQ/a to2 kg I-TEQ/a. Since the early 1990s, a continuing decrease in dioxin emissions was observed.Whereas in the beginning of the 1990s, total emissions of PCDD/PCDF were still estimated atmore than 1,000 g I-TEQ/a, the estimate for 1994/95 was around 300 g I-TEQ/a. It is expectedthat dioxin emissions will again decrease considerably to values markedly lower than 70 gI-TEQ/a by the year 2000
A dramatic decrease was observed for waste incinerators since the beginning of the 1990s.Whereas the central estimate for PCDD/PCDF emissions was 400 g I-TEQ for the year 1989/90,retrofitting of existing plants, closure of a few older plants and building of some new MSWIsreduced the dioxin emission by approximately 90 % in the year 1994/95. From 1997, when allexisting MSWI have to comply with the emission limit value of 0.1 ng I-TEQ/m³ (17th BImSchV1990), it can be assumed that the total dioxin emissions from all municipal solid waste incinera-tors in Germany are less than 4 g I-TEQ/a. Based on an average emission concentration of0.015 ng I-TEQ/m³ and an overall capacity of 15.9 Mio. t/a, total emissions from MSWI will be1.3 g I-TEQ/a or approximately 2 % of the total inventory (less than 70 g I-TEQ/a) (Johnke 1997,1998).
As a result of the requirements of the 17th BImSchV, which stipulates an emission limit value of0.1 ng TEQ/m³, marked reductions have been obtained in dioxin emissions from wasteincinerators. For 1998 - following the retrofitting of all existing plants - a total flux of less than 4 gI-TEQ/a was estimated (based on a stack concentration of 0.05 ng TEQ/m³ and an overall capac-ity of 13.6 mio. t/a). It is estimated that waste incineration’s share of total dioxin emissions by the

36 Dioxin and Furan Inventories
May 1999 UNEP Chemicals
year 2000 (based on the value of 0.015 ng TEQ/m³, overall capacity of 15.9 Mio. t/a) will amountto around 2 % (1.3 g/a of a total of <70 g/a).
Table 20: Trends of PCDD/PCDF emissions in Germany (Johnke 1998). Fluxes in g I-TEQ/a
1989/90 1994/95 Estimate 1999/2000Waste Incineration 400 32 <<4 (<2)Metal production and processing, total 750 220 <40
Secondary aluminum 25 18 <1Smelting plants in foundries 3 2 <2Sintering plants 575 158 <20Steel - Oxygen plants 5 4 <3Steel - Electro 30 5 <2Others 112 33 <12
Power Plants 5 3 <3Industrial and Commercial Boilers 20 15 <10Other Thermal Industrial Processes 1 <1 <1Crematories 4 2 <1Traffic 10 4 <1Domestic Furnaces 20 15 10Total 1210 291 <<70
A more detailed description of the situation in Germany is given in a report by the IFEU Institute(1998). On behalf of the Federal Environmental Agency (UBA), the Ifeu-Institute calculated totalemissions of PCDD/PCDF and polycyclic aromatic hydrocarbons emitted from German sourcesfor the reference year 1994 (Ifeu 1998). Here, the results for PCDD/PCDF will be summarized.The goals of the study were:• Identification of relevant sources• Determination of emissions factors for each source• Total emissions for the reference year 1994• Identification of state-of-the-art technology for POPs emission reduction• Quantification of emission reduction potential
For the reference year 1994, the emissions from the ferrous and non-ferrous metal industrieswere the major contributors to the total dioxin emissions for Germany (see Table 21).
The category named iron, steel industries and foundries includes sinter plants, steel ovens, andsteel works and coke plants (as in Germany the total coke production is used by the steel works).Measured PCDD/PCDF emissions below 0.1 ng I-TEQ/m³ are available from one coke plant.However, it was considered that this one plant is not representative of the majority of existingplants in Germany. Thus, for the inventory a 7.5-fold higher emission was assumed. For sinterplants, there are two emission streams to quantify; dedusting of the sinter band and of the hall.
In Germany, approximately 20 % of the total raw steel production is from electro-steel. Scrapmaterials can be 100 % of the input to these plants.

Dioxin and Furan Inventories 37
UNEP Chemicals May 1999
Table 21: Germany: PCDD/PCDF emissions from iron steel industries and foundries; refer-ence year 1994 (Ifeu 1998)
Source Category Emission Factorµg I-TEQ/TJ coke
µg I-TEQ/t material, resp.
Activity RateTJ coke/a,t/a, resp.
Fluxg I-TEQ/a
Iron and steel and foundriesCoke plantsSinter plants
Dedusting of sinter bandsDedusting of indoor environments
Steel plantsCowpersIndoor environments
Oxygen steel worksPrimary emissionsSecondary emissions
Electro-steel plantsIron and steel foundries
Cold air cupolasHot air cupolasElectric arc and induction furnaces
8.65
6.0000.59
0.0210.0054
0.48
1.110.200.032
347095
2551275625512756
2992300029923000 t/a
8940941 t/a
7704741464954
903651
1813.00
168153
15.10.790.630.163.72
4.331.180.850.300.029
In Germany, there are no plants for production of primary aluminum, lead, and zinc productionplants (LUA 1997, Ifeu 1998). For the secondary aluminum production, aluminum scrap, chips,and other Al-containing materials are melted in the presence of a salt mixture. Relatively broadranges of PCDD/PCDF emissions were measured in plants for drying of Al chips (0.10-3.8 ngI-TEQ/m³) as well as in rotary kilns (0.014-11.6 ng I-TEQ/m³). From the differences observed, itwas assumed that the chlorine content of the input materials might play a role for thePCDD/PCDF concentrations. The generation of both primary as well as of secondary copperinvolves several steps. Very low concentrations were measured for stone converters. ThePCDD/PCDF emissions from anode ovens used for the generation of secondary copper were twoorders of magnitude higher.
Secondary zinc can be recycled from fly ashes of steel works, residues, and sludges. Remeltingplants for zinc gave relatively low concentrations around 0.1 ng I-TEQ/m³; hot briquetting plantsgave mean concentrations of 10.8 and 38.3 ng I-TEQ/m³, respectively.
Table 22: Germany: PCDD/PCDF emissions from non-ferrous metal and aluminum produc-tion; reference year 1994 (Ifeu 1998)
Source Category Emission Factorµg I-TEQ/t
Activity Ratet/a
Fluxg I-TEQ/a
Non-ferrous metal and aluminum productionSecondary aluminum production
Chips dryingRotary ovensHearth ovens
Prim. and sec. Copper productionFluidized melting ovens (prim.)Stone converters (prim.)Anode ovens (prim. +sec.)
9.7650.5
1.51
0.00500.00803.57
251701402721100680
253000253000592000
49.722.9
2.4620.3
0.1626.8
0.00130.00202.11

38 Dioxin and Furan Inventories
May 1999 UNEP Chemicals
Blast furnaces (sec.)Scrap metal converter (sec.)Melting plants and foundries (prim. + sec.)
27.121.9
4.81
339000339000
1683290
9.197.438.10
Table 23: Germany: PCDD/PCDF emissions from secondary zinc production; reference year1994 (Ifeu 1998)
Source Category Emission Factorµg I-TEQ/t
Activity Ratet zinc/a
Fluxg I-TEQ/a
Secondary zinc productionRolling millHot briquettingZinc remelting
175521
0.29
600006000060000
41.810.531.3
0.017
The total emissions from the production of iron, steel, and non-ferrous metals producedPCDD/PCDF emissions of almost 280 g I-TEQ in the year 1994 (see Table 24).
Table 24: Germany: Summary of PCDD/PCDF emissions from ferrous and non-ferrousmetal industries; reference year 1994
Source Category Annual Emissiong I-TEQ/a
Iron and steelAluminum productionCopper productionSecondary zinc production
18122.926.841.8
Total 272.5
The category of combustion plants includes power plants, industrial combustion plants fired withlignite, brown coal, wood or crude oil. Measured data are available for power plants fueled withvarious kinds of coal: no data are available for plants fueled with crude oil. For the inventory, theemission factors from the respective power plants were applied. For all plants, the measuredstack emissions were far below 0.1 ng I-TEQ/m³. Under industrial combustion plants, plantsbetween 1 MW and 50 MW are summarized. Generally, they produce steam or process heat viahot water. There are a few data available for such units fired with lignite and brown coal.PCDD/PCDF emissions from wood combustion plants were studied intensively. Whereas com-bustion of untreated wood generates low PCDD/PCDF emission independently of the type ofcombustor used, combustion of waste wood with halogen-organic coatings may have a potentialof generating high PCDD/PCDF emissions. Wood treated with wood preservatives have to becombusted in incinerators complying with the 0.1 ng I-TEQ/m³ limit value of the German regula-tion for any type of waste incineration plants (17th BImSchV 1990).
Small combustion units comprise a very heterogeneous group of units in terms of type of ovens,firing techniques, and fuels. All units have to comply with the 1st Amendment to the GermanImmission Law (1st BImSchV) and are smaller than <1 MW. The contribution of these sources tothe PCDD/PCDF inventory has been under discussion for many years. Ifeu (1998) estimates thetotal emissions from these sources to 7.13 g I-TEQ for the reference year 1994.
Co-combustion of PVC-containing materials and waste wood in such small units will dramaticallyincrease the annual flux. Launhard (1996) estimates that the additional contribution is in therange of 22 g I-TEQ annually for co-combustion of waste wood (46 PJ) and 42 g I-TEQ/a for co-combustion of PVC-containing materials (7 PJ).

Dioxin and Furan Inventories 39
UNEP Chemicals May 1999
Table 25: Germany: PCDD/PCDF emissions from power plants and other industrial com-bustion plants; reference year 1994 (Ifeu 1998)
Source Category Emission Factormg TEQ/TJ
Activity RateTJ/a
Fluxg I-TEQ/a
Power plantsLigniteBrown coalCrude oil (heavy)Crude oil (light)
0.0040.00020.00040.0005
12495371517285
7011525746
5.345.000.300.030.01
Industrial combustion plantsLigniteLignite cokeBrown coalBrown coal cokeBrown coal briquetteWoodCrude oil (heavy)Crude oil (light)
0.0050.0050.0040.0120.0120.270.00040.0005
365516200174199770
197716655
7914208875166420
6.151.831.000.800.020.202.140.080.08
In Germany, municipal solid waste is incinerated without special pre-treatment and burnt ongrates. Hazardous waste incinerators are rotary kilns operated between 800 and 1,200 °C: theoff-gases pass an afterburner with temperatures between 1,200 and 1,400 °C. Common types ofsewage sludge incinerators are fluidized bed or multi-hearth furnaces. Conventional burning ofhospital waste was performed in small units and in batches. As most of the old plants could notcomply with the requirements of the 17th BImSchV, they were closed in the early 1990s.
With the implementation of the 17th BImSchV in 1990 setting a legal limit concentration of 0.1 ngI-TEQ/m³ for waste incineration in Germany, a downward trend for PCDD/PCDF emissions wasobserved. Today, all MSWI and HWI comply with this requirement. Whereas in a national sur-vey in 1989, the average stack concentration of German MSWIs was determined to 8 ngI-TEQ/m³, the concentrations were between 0.5 and 5 ng I-TEQ/m³ for the reference year 1994(Ifeu 1998). Of the 40 MSWI plants operating in 1994, twelve did already comply with the 0.1 ngI-TEQ/m³ limit value. Also, for the inventory, an average concentration of 1 ng I-TEQ/m³ wascalculated resulting in an annual emission of 30 g I-TEQ/a. For the inventory, a meanconcentration of 0.5 ng I-TEQ/m³ was used for hazardous waste incinerators. In the referenceyear, 30 plants were in operation. The PCDD/PCDF emissions from sewage sludge incineratorswere lower than emissions from MSWI; an average of 0.08 ng I-TEQ/m³ was calculated based onmeasured data.
Measured PCDD/PCDF emissions from crematories were in the range from 0.05 to 14.4 ngI-TEQ/m³. For the reference year 1994, there were 107 crematories operating approximately2,000 hours per year. The total emissions from this source were calculated to be 2.38 g I-TEQ/a.Since 1997, there is a legal limit concentration for crematories of 0.1 ng I-TEQ/m³ (27th BImSchV1997).

40 Dioxin and Furan Inventories
May 1999 UNEP Chemicals
Table 26: Germany: PCDD/PCDF emissions from waste incineration plants; reference year1994 (Ifeu 1998)
Source Category Emission Concentrationsng I-TEQ/m³
Activity Rate Fluxg I-TEQ/a
Waste incinerationMunicipal solid waste incinerationHazardous waste incinerationSewage sludge incinerationHospital waste incineration
10.1-0.50.1-1<0.1
3230
20.1
<0.1Crematories 0.05-14.4 2000 h/a 2.38
Based on a Directive from the European Union (91/441/EWG), all cars run on gasoline with apermit after 31 December 1992 have to be equipped with a catalytic converter. AlthoughPCDD/PCDF are not addressed in the Directive, it can be assumed that a catalytic converter willalso reduce emissions of PCDD/PCDF. The 19th BImSchV, which is in force since 1992 andwhich forbids the use of halogenated scavengers as additives to gasoline further reducedPCDD/PCDF emissions from gasoline fuelled cars. For the German inventory, emission factorsas shown in Table 27 were applied. The highest uncertainty is for the emissions of trucks andbusses, as there were much higher emissions published in the literature. However, Ifeu (1998)found these data not appropriate for use in the present inventory. The total annual emissionsfrom automobile transport were less than 5 g I-TEQ/a.
Table 27: Germany: PCDD/PCDF emissions from road transport; reference year 1994 (Ifeu1998)
Source Category Emission Factorsng I-TEQ/L
Activity Ratet/a
Fluxg I-TEQ/a
Road transportPassenger cars, catalystPassenger cars, no catalystPassenger cars, DieselBusses, DieselTrucks <3.5 t, DieselTrucks, small, gasolineTrucks, Diesel
0.070.0950.040.0760.0760.0940.076
1836138397807665775074112077223864341511932
11957804
4.8041.7141.2260.2750.1010.2160.1901.082
Production of mineral materials such as cement, lime, glass, and brick occurs at very high tem-peratures. Measured PCDD/PCDF emissions were far below 0.1 ng I-TEQ/m³. In addition, theestimate for production of ethylene dichloride and the vinyl chloride monomer is included. As canbe seen, the contribution to the national inventory from these processes is less than 100 mgI-TEQ/a. Finally, other high temperature processes where PCDD/PCDF emission measurementswere performed are listed in Table 28 as well. Overall, the contribution of these sources to thetotal PCDD/PCDF emission inventory to air is very small (<<1 g I-TEQ/a).
Single measurement data exist for smokehouses (0.02 ng I-TEQ/m³), pyrolysis plants(0.055-2.6 ng I-TEQ/m³), sewage drying plants (0.05-0.11 ng I-TEQ/m³) and for manufacture oflacquer wires (0.0035 ng I-TEQ/m³). As there are no activity rates available for these industrialsectors and the emissions were very low, it was found that the contribution of these processes tothe total inventory is negligible.

Dioxin and Furan Inventories 41
UNEP Chemicals May 1999
Table 28: Germany: PCDD/PCDF emissions from production of mineral materials and otherproduction processes; reference year 1994 (Ifeu 1998)
Source Category Emission Factorsng I-TEQ/t
Activity RateMio t/a
Fluxg I-TEQ/a
Cement productionLime productionGlass productionBrick production
44.878.132.286.6
4.148.514.44
16.7
0.190.660.141.45
Drying of wood chipsDrying of green fodderAsphalt mixing plantCar shredders
739100
2.4246
0.090.04
0.37Emission Concentration
ng I-TEQ/m³Flux
mg I-TEQ/aProduction of vinyl chloride
OxychlorinationHCl-recycling from EDC manufactureCombustion of VC plant
0.0440.770.4
76.52.6
18.555.4
Further potential PCDD/PCDF sources with emissions can be briefly summarized as follows:
• Pulp and paper production is of minor importance in Germany. The total emissions wereestimated to be less than 1 g I-TEQ/a with the major pathway via wastewater.
• Areas, especially sport fields, covered with a copper slag named “Kieselrot” are a specialcase in Germany. Re-entrainment of PCDD/PCDF from these highly contaminated areas viaerosion and evaporation might occur. Lahl et al. (1995) estimated about 100 g I-TEQ annualfor this source. However, there is no strong scientific basis for such estimate.
• High uncertainty is associated with the emissions from accidental fires, especially when PVCis involved. Lahl and co-authors estimated 1-10 g I-TEQ annually from this source, assuming500,000 accidental fires occurring annually.
• PCDD/PCDF were found in the sludges from dry-cleaning units. As the residues from theseunits are treated as special waste, there is no release into the environment.
In conclusion, the inventory for the reference year 1994 gave PCDD/PCDF emissions of 333 gI-TEQ. The largest contributor was the iron and steel plants and foundries that accounted for54 % of the total inventory. Within this source category, the sinter plants were the major con-tributor. The second largest source with 15 % were the non-ferrous metal industries with produc-tion plants for aluminum and copper. The third major sector was the secondary zinc productionwith 12.5 %. In 1994, municipal solid waste incineration was a minor contributor with annualemissions of 30 g I-TEQ/a accounting to 9.6 % of the total inventory.
Potentials for Reductions
Although PCDD/PCDF minimization measures were already implemented in Germany in 1994,potentials for further reducing PCD/PCDF emissions was identified. Within these, the greatestreduction potential was identified for sintering plants. Tests at sinter plants have shown that bag-house filters as used in many other industries cannot be applied at sinter plants. However, addi-tion of adsorbent materials has proven to efficiently reduce the PCDD/PCDF emissions from the

42 Dioxin and Furan Inventories
May 1999 UNEP Chemicals
sinter bands. With such technology a limit concentration of 0.1 ng I-TEQ/m³ can be met. Onceestablished, the annual emissions will be reduced by 98 % to 9.3 g I-TEQ/a (Ifeu 1998).
Presently, there are no experiences with minimization methods tested at zinc plants. However,results obtained from other industries indicate that the same measures could be applied in thissector as well, leading to an annual emission of only 0.2 g I-TEQ.
The addition of an adsorbens after the combustion unit will reduce the PCDD/PCDF emissions inmany industrial sectors, e.g. cupolas, iron foundries, secondary aluminum production
For secondary copper plants, injection of oxygen resulted in PCDD/PCDF emissions <0.1 ngI-TEQ/m³.
For home heating units (small combustion plants for solid fuels), care should be taken that onlyuntreated wood is used.
Overall, it can be concluded that the German metal sector has undertaken many efforts to reducethe PCDD/PCDF from its plants. However, presently, the effectiveness of these efforts cannotbe quantified.
From the year 1994 it can be concluded that there is no further need for actions to reducePCDD/PCDF emissions for oxygen steel plants and electro steel plants. There is hardly anyreduction potential for power plants operated with fossil fuels. The annual emissions of about 5 gI-TEQ are due to the large volumes emitted.
For waste incineration primary measures and secondary technologies such addition of coke oractive carbon, non-catalytic reduction, and catalytic converters were successfully applied to meetthe legal limit concentration. Since 1 December 1996, all waste incinerators in Germany complywith this value. Results from more than 150 test data from cement kilns have shown that co-combustion of other materials including waste oil and used tires do not increase the PCDD/PCDFemissions. All measured concentrations were below 0.1 ng I-TEQ/m³.
As there is no longer leaded fuel available in Germany, it is guaranteed that the emissions fromthe use of leaded gasoline have been eliminated.
8.6.2 Hamburg
For the year 1992, annual fluxes and emission inventories of PCDD/PCDF were estimated forcombustion sources for the city of Hamburg, Germany (Lau et al. 1996). Measures taken duringthe last years in Hamburg have already markedly reduced emissions of PCDD/PCDF into theenvironment. To further minimize dioxin exposure, national and international measures have tobe taken.
With a population of 1.65 million inhabitants Hamburg is the second largest city in Germany; inaddition, Hamburg is a federal state, too. Its area is 755 km². Hamburg has a highly urbanindustrial infrastructure with 2,200 inhabitants/km² (for comparison: German average = 228inhabitants/km²). Hamburg has a long dioxin history including a former 2,4,5-T production siteand the landfill “Georgswerder“ and others are contaminated with PCDD/PCDF. In addition, sedi-ments from the harbor and the river Elbe are contaminated with dioxins and furans. Hamburghas several combustion sources (two municipal waste incinerators, one hazardous wasteincinerator, steel works, and non-ferrous metal industry).

Dioxin and Furan Inventories 43
UNEP Chemicals May 1999
Since 1983, more than 800 congener-specific dioxin analyses were performed in Hamburg todetermine levels of PCDD/PCDF in water, soil, and air. The number and quality of dioxin resultsare unique for any defined region in Germany. Almost complete statistical data were obtained forthe year 1992; whenever possible, newer data were incorporated into the dioxin balance forHamburg.
For Hamburg, PCDD/PCDF emissions to the air are predominantly from industrial and commer-cial activities (production/manufacture and finishing processes), domestic activities (home heat-ing), waste incineration, and traffic (automobiles). According to the evaluation, in 1992 a total of6.5 g I-TEQ were emitted from identified and quantified sources in Hamburg. Table 29 gives anoverview on the combustion sources and the annual amount of PCDD/PCDF released from thesesources to the atmosphere.
In the year 1992, incineration of municipal solid and hazardous waste was the major sector(industry) to emit PCDD/PCDF into the air: an annual flux of 4.5 g I-TEQ was attributed to thiscategory (see Table 29). Retrofitting of the combustion facilities, shut-down of one old incineratorand installation of a new incinerator resulted in a reduction of more than 95 % for the year 1995(total emissions from waste incineration and less than 0.2 g I-TEQ/a). Emissions from thermalindustrial processes, especially from a copper plant and to a minor extent from iron and steel pro-duction, generation of aluminum, and smokehouses were also of importance. The contributionfrom generation of energy - fossil fuel power plants and combustion of sewer gas - was low whencompared to the total amount of PCDD/PCDF emitted. Relatively large uncertainties exist for theestimate of PCDD/PCDF emissions from home heating. The best estimate for 1992 wasbetween 70 and 340 mg I-TEQ/a.
PCDD/PCDF emissions from automobiles were due to the presence of halogenated scavengersin leaded fuel. The decrease in the use of leaded gasoline and increasing numbers of carsequipped with catalysts can be expected to result in a further reduction of dioxin emissions fromtraffic in Hamburg, too. Based on the evaluation by Lau et al. (1996) there is still a potential tofurther reduce dioxin emissions within the industrial sources. These reductions can only berealized by cost-extensive technological changes, e.g. smaller stack volumes.
A high degree of uncertainty still exists for the estimate of the contribution from private heating.Although there exists an abundance of PCDD/PCDF emission data for incineration of wood andfewer for coal and oil, the number of installations and the frequency of using the heating systemsremain unknown. Uncertainty is also with the type of fuel burnt and whether the combustion offossil fuels in private ovens is just for heating during winter or also for generation of hot water andother energy. Due to such lack of information, the authors came to the conclusion that additionaldioxin measurements even of a large number of installations will not give further insight to moreprecisely calculate the annual load of PCDD/PCDF released from this source category.

44 Dioxin and Furan Inventories
May 1999 UNEP Chemicals
Table 29: PCDD/PCDF emissions to the air from combustion sources in Hamburg
Source Flux (mg I-TEQ/a)Stationary SourcesIndustry:
Copper industry 1,200Aluminum industry 8Iron and steel manufacture 166Petrochemical industry 0.009Smoke houses (smoked fish and meat) 8
Others:Crematories 4-21
Generation of Power:Power plants (fossil fuels) 69Industrial wood combustion 150Combustion of sewer gas 14
Waste disposal in HamburgMunicipal waste incineration 3,913Hazardous waste incineration 560
Subtotal Stationary Sources 6,092-6,109Diffuse SourcesTraffic
Automobiles 250Households:
Home heating 70-340Accidental fires in homes 8
Subtotal Diffuse Sources 328-598Total of All Known Sources 6,420-6,707
8.7 Hungary
In 1997, the Hungarian Institute of Environmental Protection (KGI 1997) published a report onemissions of persistent organic pollutants in preparation of international agreements. In thisreport, an inventory for PCDD/PCDF from sources in Hungary was included. Based on emissionfactors as established in the report by TNO (UBA 1997), PCDD/PCDF emissions were deter-mined for various reference years. A comparison for the reference years 1985, 1990, 1993,1995, and 1996 is shown in Table 30. In 1985, the highest dioxin emission was estimated to be215 g I-TEQ/a (in 1980 - not shown here - the total emission was calculated to be 185 g I-TEQ).It can be seen that for all estimates, the dioxin emissions from municipal solid waste incineration– one single plant - did not change at all.

Dioxin and Furan Inventories 45
UNEP Chemicals May 1999
Table 30: PCDD/PCDF emission inventory for Hungary (KGI 1997) (g I-TEQ/a)
1985 1990 1993 1995 1996Households 93.98 66.17 34.79 27.19 25.54Services 11.02 4.83 4.91 4.15 3.48Power plants 15.13 12.21 12.98 13.07 13.69District heating 2.59 1.63 2.98 1.48 0.021Agriculture 4.78 2.76 2.71 3.29 3.01Industry 8.51 5.27 3.61 3.40 3.46Road transport 0.98 0.88 0.52 0.27 0.20Incineration 46.50 46.50 46.50 46.50 46.50Sintering process 15.38 12.50 7.40 8.20 4.00Secondary copper processes n.a. 1.08 0.62 0.70 0.76Electric arc furnaces 15.79 12.53 3.43 3.96 2.87Total 214.65 167.36 119.57 112.21 103.53
8.8 Slovak Republic
In 1994, the Slovak Republic undertook a first study to establish an emission inventory of POPs.The estimate is based on available information on emission sources, source parameters andemission factors obtained from either own measurements or from published literature sources.The reference year is 1993 (Kocan 1994).
The total emissions of PCDD/PCDF into the atmosphere were estimated to be 42 g I-TEQ/a forthe reference year 1993. In 1993, incineration of waste was responsible for 61 % of the totalemissions, the various sectors of the metal industry accounted for 20 % and energy productionfor 17 %. An overview is shown in Table 31. The Slovak Republic is aware of potential furthersources, e.g. emissions from the chemical industry (including oil exploitation, transport and stor-age, petrochemical industry, production of organohalogen compounds and paints), but could notbe quantified at this time. Emissions from landfills and waste dumps, re-entrainment ofPCDD/PCDF from contaminated soils and from water surfaces, were identified but could not bequantified. In addition, the numbers as shown in Table 31 should be regarded as lower esti-mates; actual values are expected to be higher as for some sources there are high uncertaintiesin emission rates.
The uncertainties in the emission estimates result from the uncertainty in the emission factor, theactivity rate (the amount of fuel processed) and the efficiency of the pollution control device (fluegas cleaning system).

46 Dioxin and Furan Inventories
May 1999 UNEP Chemicals
Table 31: Slovak Republic: PCDD/PCDF emissions into air; reference year 1993
Source Fluxg I-TEQ/a
% of TotalInventory
ConfidenceRating
Waste incinerationMunicipal wasteHospital wasteIndustrial waste
26.011
69
61.2
NDND
Metallurgical industryIron, steel, cast iron, ferroalloysLight non-ferrous metals (Al)Other non-ferrous metals (Cu)
8.67.40.40.77
20.2
Fuel/Energy sectorCombustion facilities >5 MWCombustion facilities 0.2-5 MWCombustion facilities <0.2 MWCoke productionEnergy gases production and combustion
7.34.80.41.60.430.024
17.2
Mineral products industryCementLimeAsphalt mixing installationsGlass, stoneware, mineral fibersRefractory materialsBrick manufacture
0.050.0230.0140.00060.0030.0030.0006
0.1 NDNDNDND
Other high temperature processesTrafficCremationSmokingFires
0.540.350.0250.00090.16
1.3 ND
NDTotal 42.49 100.0
ND = Values are less reliable as no measurements (no data) are available and estimates werederived from hardly comparable activities
8.9 Sweden
Within the Swedish Dioxin Study, emission estimates were made for the years 1990 and 1993(Table 32) (de Wit 1995). Whereas no change was postulated for the amounts of PCDD/PCDFemitted to water and found in products and wastes, a decrease was calculated for the total emis-sions to air: the air emissions of 31.8-115 g N-TEQ from 1990 were assumed to decrease to21.6-88 g N-TEQ in the year 1993. The categories with the largest reductions were primary limeproduction, municipal waste incineration, and wood burning stoves. However, small increasesdue to larger amounts of material or fuel processed were found, too (natural and biogas burningas well as use of Diesel and unleaded gasoline; cremation). Decreases are indicated Table 32by bold numbers and increases by an asterisk.
Sweden is aware of additional sources, such as textile production, dry cleaners, and forest fires;however, no estimate was made. Sweden and the USA (results of the 1994 draft Dioxin Reas-sessment, not shown here) are the only countries that try to include dioxin emission streams toair, water, and sinks such as products and wastes.

Dioxin and Furan Inventories 47
UNEP Chemicals May 1999
Table 32: Sweden: Preliminary estimates of PCDD/PCDF emissions from various sources inSweden during 1990 and 1993 given in g Nordic-TEQ (N-TEQ)/a (de Wit 1995).
Source To Air1990
To Air1993
To Water InWastes
InProducts
IndustryBleached kraft pulp 1 1 1.5-5 0.3-6.6Recycling paper pulp 2.8Chloralkali plants 0.28-0.6 0.25Mercury distillation 0.000005 0.000005 0.003 0.004Sewage sludge 0.11 2.9 1.5Steel mills 1.6-4 1.6-4 8.2Scrap steel mills 0.4-15 0.4-15 20Prim. non-ferrous smelters 0.13-0.27 0.13-0.27 0.38Sec. non-ferrous smelters 4.3 4.3 2.1Foundries 0.007-0.49 0.007-0.49 0.82-15Cement kiln - gases 0.07-1.3 0.07-1.3Cement kilns - dust 0.35 0.28Lime burning, prim. prod. 9.8-18 2-2.5Lime burning - industrial use 0.5-6.3 0.5-6.3Ceramic salt glazing 0.01 0.01IncinerationGlassfiber waste incineration 0.00004 0.00006 *Municipal waste incineration 4.5 3.0 0.6-2.4Hazardous waste incineration 0.01 0.007Hospital waste incineration 0.001 0.001Cremation 0.34-0.68 0.37-0.73*Uncontrolled landfill fires 2.8-30 2.8-30Illegal metal reclamation ? ? 0.02-0.04Heating/EnergyOil 0.1-2.6 0.1-2.5Coal 0.75 0.61Natural gas 0.03 0.04 *Wood burning stoves 3-13.8 2.1-9.8Other biofuel 1.2-6.4 1.4-7.7 *TrafficFerries (gas oil, heavy oil) 0.7 0.63Planes (aviation fuel) 0.03-0.93 0.02-0.86Vehicles - Diesel 0.067-0.14 0.73-0.15* Gasoline - leaded 0.026-2.9 0.009-0.97 Gasoline - unleaded 0.08-0.16 0.14-0.27*Total 31.8-115 21.6-88 1.6-5.1 35-52 4.6-10.9
8.10 Switzerland
The Swiss Agency for Environment, Forest, and Nature estimates that before 1955, annual emis-sions of PCDD/PCDF were less than 40 g I-TEQ. Between 1955 and 1980 dioxin emissionsincreased about 12-fold and peaked in 1980 with approximately 480 g I-TEQ/a. Since 1980 asteady decline was observed resulting in an estimated emission of approximately 180 g I-TEQ/afor the year 1995. Due to legal requirements, it is assumed that by the year 2000 only 70 gI-TEQ will be emitted annually from identified sources (BUWAL 1997).

48 Dioxin and Furan Inventories
May 1999 UNEP Chemicals
Whereas in the past, waste incineration was the major contributor to the overall dioxin emissions(see Table 33), illegal combustion of wastes in private households will be the dominating sourcein the future. Although forbidden by law since 1986, such behavior is common practice stilltoday. In the year 2000, dioxin emissions from illegal waste combustion will be about 3-foldhigher than legal waste incineration from all municipal solid waste incinerators.
Table 33: Switzerland: PCDD/PCDF emissions into air (BUWAL 1997)
Source 1990 1995 2000Households 27.4 27.4 29.8Waste incineration 26.8 26.9 29.4Firing systems 0.5 0.5 0.4Waste Incineration 112.8 112.8 16.2Municipal solid waste incineration 96.2 96.2 9.9Hazardous waste incineration 7.3 7.3 4.9Sewage sludge incineration 0 0 0Burning on landfills 9.1 9.1 1.2Cable burning 0 0 0Shredders 0.2 0.2 0.2Construction 22.9 15.4 4.0Combustion of debris 19.9 12.7 1.6Use of wood preservatives 3.0 2.7 2.4Metal Industry 20.7 11.2 11.6Steel works 12.2 8.0 8.4Non-ferrous metal foundries 6.4 1.8 1.9Foundries (iron) 1.3 1.2 1.3Galvanization 0.1 0.1 0.1Aluminum remelting 0.7 0Miscellaneous Industries 16.7 13.1 9.7Combustion in small industries and commerce 1.0 1.1 1.1Hospital waste incinerators 13.8 10.4 6.9Cement kilns 0.8 0.7 0.7Smoke plants for meat 0.4 0.3 0.3Crematoria 0.4 0.4 0.5Chip-board production 0.2 0.2 0.2Others 0.1 0.1 0.1Traffic 1.9 0.9 0.3Vehicles without catalyst 1.8 0.7 0.2Agriculture and Forestry 0.1 0.1 0.1Total 242 180 72
8.11 The Netherlands
Annual PCDD/PCDF emissions were estimated for the Netherlands by de Koning et al. (1994).As shown in Table 34, in the year 1989, the total flux to the air was much higher (960 g I-TEQ)than in 1991. The decrease is due to the fact that some municipal waste incinerators with highemissions (up to 92 ng I-TEQ/m³) were either shut-down or retrofitted.
In 1991, municipal waste incineration was still the largest contributor with 79 %. The residual21 % were split on 16 process categories. There is high uncertainty with the emission estimatesfrom cable processing, wood combustion, and the former use of wood preservatives.

Dioxin and Furan Inventories 49
UNEP Chemicals May 1999
Interestingly, the estimate for the largest source in 1993, namely use of pentachlorophenol, isbased on no data. No data were available for accidental fires; thus, this category was notquantified.
Table 34: Estimated annual PCDD/PCDF emissions into the air for the Netherlands (de Koninget al. 1994)
Source Emission for 1991 Emission for 2000 1)
Municipal waste incineration 382 2-4Hazardous waste incineration 16 1.7Landfill, biogas, and sludge incineration 0.3 1.5Cable and electromotor burning 1.5 1.5Hospital waste incineration 2.1 0Asphalt mixing plants 2) 0.3 0.3Combustion of oil 1.0 1.0Combustion of coal 3.7 3.7Combustion of wood 3) 12 9Crematories 0.2 0.2Traffic 7.0 0.2-5Sintering plants 26 3NE-Non-ferrous metal industry 4.0 4.0Chemical production processes 0.5 0.5Use of wood preservatives 25 20Other high temperature processes 4) 2.7 2.7Accidental fires ? ?Total (without fires) 484 max. 58
1) The emission estimate for the year 2000, with the exemption of MWI, does not account forgrowth or decrease in the total mass processed
2) Emission as a result of heat generation is mentioned under the energy generators concerned3) Highly uncertain; further research recommended4) Thermal soil treatment, drying of fly ash, cement and glass/mineral wool production, etc.
8.12 United Kingdom
8.12.1 Emissions to Air
An inventory of PCDD/PCDF releases into the atmosphere of the United Kingdom was performedin 1995 (HMIP 1995, Eduljee and Dyke 1996). The numbers given in the second column ofTable 35 for the 1993 estimate by Eduljee and Dyke were derived from emission factors (µgI-TEQ/ton of material produced or treated) and the amount of material treated or produced byeach of the processes. In the case of crematoria and traffic, the emission factors wereexpressed in terms of the quantity of PCDD/PCDF emitted per cremation and per kilometer trav-eled, respectively. Measured data were used for municipal waste incineration, clinical andchemical waste incineration, coal combustion, and sinter plants which covered the main emis-sions. For the other cases, emission factors were obtained from the literature. A confidencerating was included. As industrial practices in the UK are currently undergoing significantchanges, the 1996 estimates as shown in Table 35 (2nd column) could not be taken as definitive:
50 Dioxin and Furan Inventories
May 1999 UNEP Chemicals
rather they should be regarded as indicative of the situation in the UK at that time using the bestdata then available.
As can be seen from Table 35 and the reference year 1993, industrial processes account forapproximately 90 % of the total inventory which ranges from 560 to 1,100 g I-TEQ per year.Municipal waste incineration (MWI) was identified as the major source of PCDD/PCDF emissionsto the atmosphere. However, as these emissions were subject to stringent control from 1995/96,the contribution of this source will reduce significantly. The non-industrial sources contributedemissions of 24-145 g I-TEQ/a, approximately 4-15 % of the inventory. By December 1996, allMSWI in the UK must either be upgraded to meet the limit of 1 ng TEQ/m³ ‡ as given in theEnvironmental Protection Act or cease operation. Thus, due to legal enforcement, the emissionsof old plants are expected to be reduced by a factor of 10 or 20 by 1996 compared to the 1993estimate. In addition, emissions to the atmosphere from combustion sources such as thermalwaste disposal and thermal metallurgical processes, will undergo significant changes over thenext few years as a result of the implementation of Integrated Pollution Control.
Since the first UK national emission estimates (Eduljee and Dyke 1996), a large amount of datafrom monitoring programs initiated by the UK Environment Agency was collected. New informa-tion was obtained for sectors such as MSW incinerators, sinter plants, cement kilns, chemicalwaste incinerators, and metal processing. The reference period is from 1995 to early 1997. Veryoften the monitoring was driven by the need to demonstrate compliance with emission standards.Although the majority of sources were sampled only once, except for MSWI, the new data didallow for a more precise estimate of total PCDD/PCDF emissions from UK sources. These newestimates are shown in the 3rd and the 4th columns of Table 35 for the lower and the upper esti-mates, respectively (Alcock et al. 1998).
Recent monitoring programs only included normal operation of plants. All analyses were carriedout with high-resolution gas chromatography and high-resolution mass spectrometry(HRGC/HRMS). Nevertheless, limitations occurred for isokinetic flue gas sampling which couldnot be achieved at all plants.
As for many other countries, municipal solid waste incinerators represented the sector with mostmeasured data available. Up to 1998, 14 sites have been analyzed for PCDD/PCDF. MSWI alsorepresented the sector with the broadest range of results with stack concentrations from 0.07 to74.4 ng I-TEQ/m³. A correlation between stack concentrations and age of the incinerator, type offlue gas cleaning system was not observed. Despite the broad range of concentrations found,the patterns of 2,3,7,8-substituted congeners of individual MSWI were quite similar: Typically,the emissions were dominated by Cl8DD and 1,2,3,4,6,7,8-Cl7DD followed by 1,2,3,4,6,7,8-Cl7DFand Cl8DF. Emissions from cement kilns, sewage sludge incinerators, and sinter plants(0.43-1.08 ng I-TEQ/m³) showed the least variation in measured emissions (normalized to I-TEQ)within a given industry sector. The I-TEQs for the ten chemical waste incinerators ranged from<<0.1 to 1.27 ng I-TEQ/m³. The pattern from the sinter plants was distinct from the pattern of theMSWI: In the sinter plant emissions PCDF were dominating with 2,3,4,7,8-Cl5DF as the mostabundant congener followed by 1,2,3,4,6,7,8-Cl7DF, 1,2,3,7,8,9-Cl6DF, and 1,2,3,4,7,8-Cl6DF.
For the establishment of the inventory, measured emission data for each industry were compiledand the PCDD/PCDF released per year calculated from known throughputs of input material andgas volumes generated. For some sectors such as accidental fires, data from the literature wereapplied. As can be seen from Table 35 right columns, municipal solid waste incineration was stilla significant source in the 1997 estimate contributing between 30 % and 56 % to the total inven-tory. However, this represents a significant decline from the 80 % estimated for 1993 by Eduljeeand Dyke (1996). Emissions from sinter plants contribute between 5 % and 11 % to the total ‡ The legislation includes a target of 0.1 ng I-TEQ/m³
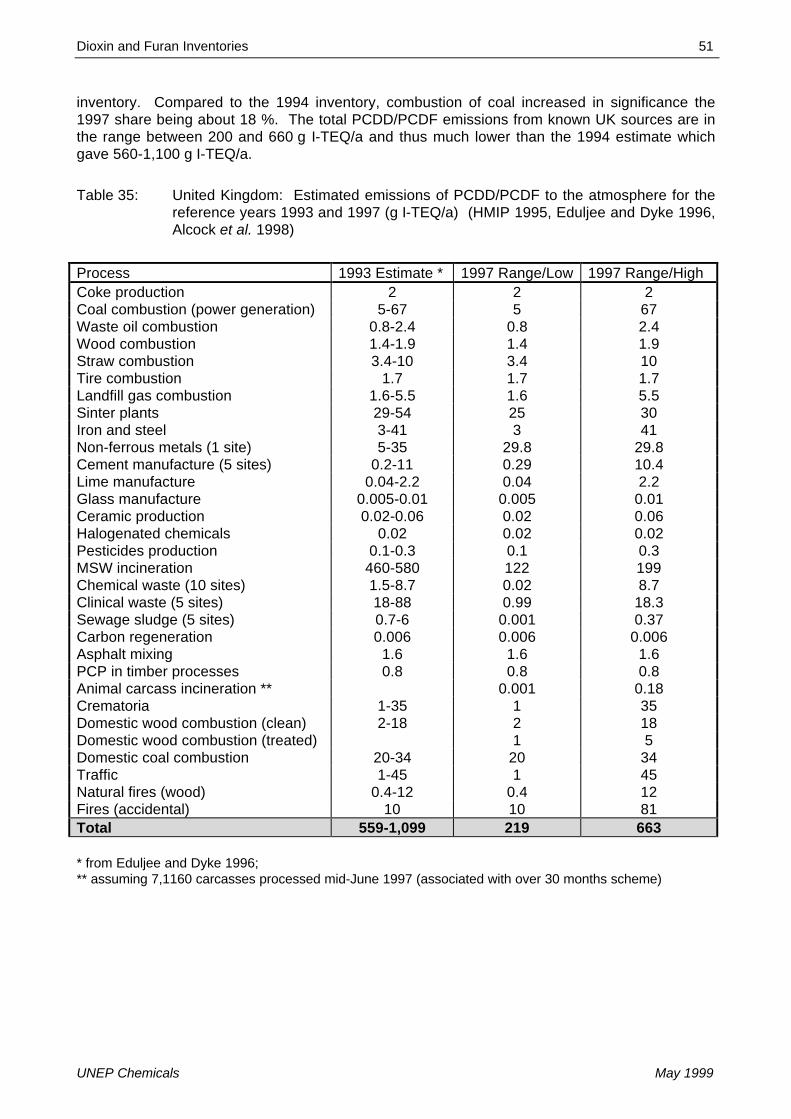
Dioxin and Furan Inventories 51
UNEP Chemicals May 1999
inventory. Compared to the 1994 inventory, combustion of coal increased in significance the1997 share being about 18 %. The total PCDD/PCDF emissions from known UK sources are inthe range between 200 and 660 g I-TEQ/a and thus much lower than the 1994 estimate whichgave 560-1,100 g I-TEQ/a.
Table 35: United Kingdom: Estimated emissions of PCDD/PCDF to the atmosphere for thereference years 1993 and 1997 (g I-TEQ/a) (HMIP 1995, Eduljee and Dyke 1996,Alcock et al. 1998)
Process 1993 Estimate * 1997 Range/Low 1997 Range/HighCoke production 2 2 2Coal combustion (power generation) 5-67 5 67Waste oil combustion 0.8-2.4 0.8 2.4Wood combustion 1.4-1.9 1.4 1.9Straw combustion 3.4-10 3.4 10Tire combustion 1.7 1.7 1.7Landfill gas combustion 1.6-5.5 1.6 5.5Sinter plants 29-54 25 30Iron and steel 3-41 3 41Non-ferrous metals (1 site) 5-35 29.8 29.8Cement manufacture (5 sites) 0.2-11 0.29 10.4Lime manufacture 0.04-2.2 0.04 2.2Glass manufacture 0.005-0.01 0.005 0.01Ceramic production 0.02-0.06 0.02 0.06Halogenated chemicals 0.02 0.02 0.02Pesticides production 0.1-0.3 0.1 0.3MSW incineration 460-580 122 199Chemical waste (10 sites) 1.5-8.7 0.02 8.7Clinical waste (5 sites) 18-88 0.99 18.3Sewage sludge (5 sites) 0.7-6 0.001 0.37Carbon regeneration 0.006 0.006 0.006Asphalt mixing 1.6 1.6 1.6PCP in timber processes 0.8 0.8 0.8Animal carcass incineration ** 0.001 0.18Crematoria 1-35 1 35Domestic wood combustion (clean) 2-18 2 18Domestic wood combustion (treated) 1 5Domestic coal combustion 20-34 20 34Traffic 1-45 1 45Natural fires (wood) 0.4-12 0.4 12Fires (accidental) 10 10 81Total 559-1,099 219 663
* from Eduljee and Dyke 1996;** assuming 7,1160 carcasses processed mid-June 1997 (associated with over 30 months scheme)

52 Dioxin and Furan Inventories
May 1999 UNEP Chemicals
8.12.2 Emissions to Water and Land
The UK Environment Agency required information on the scale of PCDD/PCDF releases to landand water. In 1997, the report was published by the Environment Agency (1997) based on datacompiled between February and August 1996. In the study, industrial and non-industrial sourceswere assessed. The releases to land included materials sent to landfills; similarly the releases towater covered releases to sewer. Where possible, UK data were used; where there were nodomestic data available, data from other countries were applied. Nevertheless, an urgent needfor generation of more data was identified. The results were given as ranges of estimates. Dueto the lack of data, releases to water were quantified according to the potential of a process torelease PCDD/PCDF as H (high = greater than 1.0 g I-TEQ/a), M (medium = 0.1-1 g I-TEQ/a) orL (low = < 0.1 g I-TEQ/a).
Despite the scarcity of data, it was possible to make estimates to land from a large number ofindustrial and non-industrial processes. Even for processes where it was possible to estimatereleases, great uncertainties were recognized. The uncertainty was either with a) the amounts ofmaterial arising and b) the high variability of PCDD/PCDF concentrations in the same kind ofmaterials from one sample to another sample or from process to process.
Total releases to land were estimated to be between 1,500 and 12,000 g I-TEQ per year (Table36). This number is significantly higher than the estimates of annual releases to air. The majorityof releases to land were contained in residues and materials for disposal in landfills. Under goodmanagement practices, such contamination is thought not to be mobile and bioavailable.Nevertheless, field monitoring may be recommended for surveillance. The major releases towere thought to come from open use of chemicals, the incineration of municipal waste in oldplants, accidental fires, chemical production processes, and the non-ferrous metal industry.Newer data on concentrations in chemicals especially are needed to better estimate the totalreleases.
As can be seen from Table 36 it was not possible to quantify the release of PCDD/PCDF towater. Only a few sources could be identified. In general, the numbers estimated were low butmay be the result that many water treatment systems are capable to remove PCDD/PCDF fromeffluents.

Dioxin and Furan Inventories 53
UNEP Chemicals May 1999
Table 36: United Kingdom: PCDD/PCDF releases to land and water; reference year 1996(Environment Agency 1997). All concentrations in g I-TEQ/a
Process Release toLand
PotentialRelease to
Water
Comments
Carbonization 0.023-0.85 L (0.0044)Coal combustion
• Power stations 1.6-81 L Half ash is sold, may not bereleased
• All industrial 0.015-4.3 L• Domestic: Ash 0.090-0.31 Negligible• Domestic: Soot 0.16-30 Negligible Includes soot from oil and
wood useOil combustion
• All industrial Not quantifiedbut low
Negligible Only soot discharge
• Domestic See coal soot NegligibleWaste oil combustion Not quantified Negligible No dataWood combustion
• All industrial 0.40-4.4 Negligible• Domestic 0.27-16 Negligible See domestic coal soot
Straw combustion 0.20-10 NegligibleTire combustion 1.9-2.8 LCrematoria Not quantified NegligibleRefuse-derived fuel combust. 3.7-6.4 L/MPoultry litter combustion 0.26 NegligiblePetroleum processes Not quantified LSinter plants 0.020-0.060 NegligibleElectric arc furnaces 59 Negligible Average PCDD/PCDF data
usedPrimary aluminum 0.082 LSecondary aluminum 29-320 L/MSecondary magnesium 0.38-3.2 L/M Based on estimates for Al
processesCopper 24 L/MSecondary lead 95-220 L/MCement 0.00040-12 LLime 0.000060-1.8 LOther mineral processes Not quantified M (<0.45) Only maximal data for asphalt
mixingChlorine production 6.0 LPVC/EDC production 25-80 M (0.070-0.040) Discharge to land goes to
containment and into lagoonPer-, trichloroethylene pro-duction
350-630 M (0.070-0.040) Discharge to land goes tocontainment
Pesticides production 8.9-2000 H (0.089-2.0) Very limited dataChlorophenol production Not quantified H Waste usually incinerated,
releases to water reducingOther chemical processes - Insufficient data for quantifica-
tion; potentially insignificant
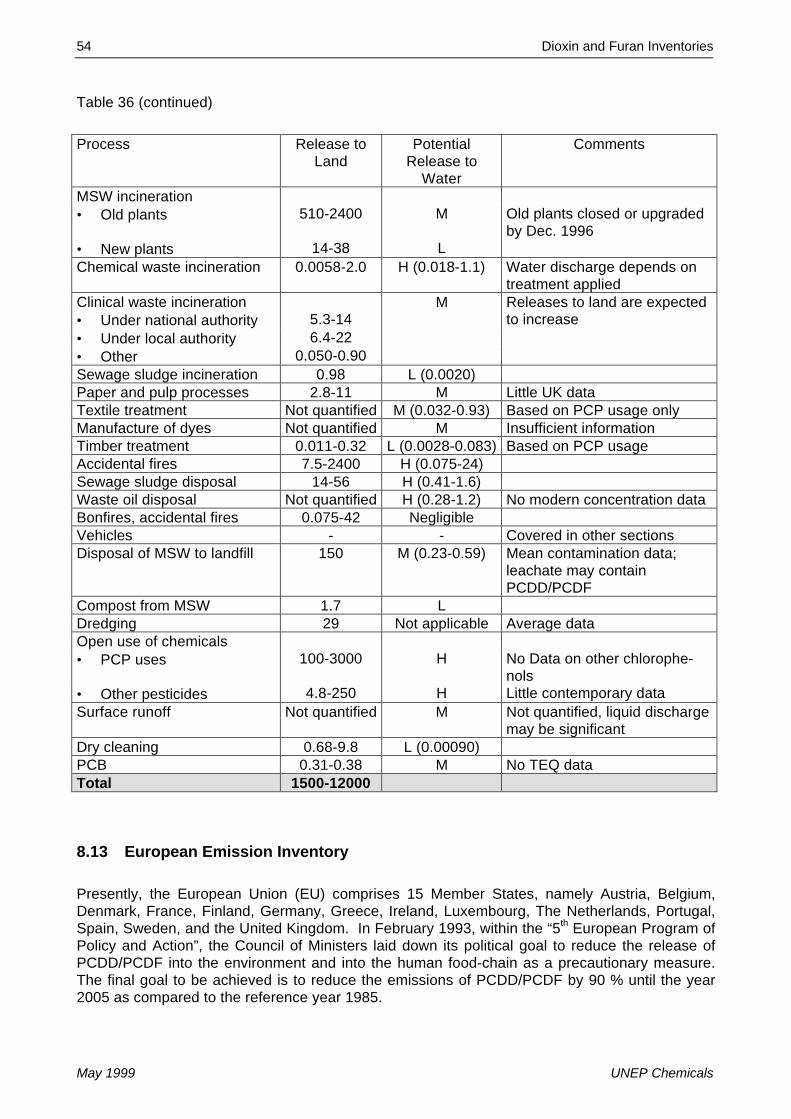
54 Dioxin and Furan Inventories
May 1999 UNEP Chemicals
Table 36 (continued)
Process Release toLand
PotentialRelease to
Water
Comments
MSW incineration• Old plants 510-2400 M Old plants closed or upgraded
by Dec. 1996• New plants 14-38 LChemical waste incineration 0.0058-2.0 H (0.018-1.1) Water discharge depends on
treatment appliedClinical waste incineration M Releases to land are expected• Under national authority 5.3-14 to increase• Under local authority 6.4-22• Other 0.050-0.90Sewage sludge incineration 0.98 L (0.0020)Paper and pulp processes 2.8-11 M Little UK dataTextile treatment Not quantified M (0.032-0.93) Based on PCP usage onlyManufacture of dyes Not quantified M Insufficient informationTimber treatment 0.011-0.32 L (0.0028-0.083) Based on PCP usageAccidental fires 7.5-2400 H (0.075-24)Sewage sludge disposal 14-56 H (0.41-1.6)Waste oil disposal Not quantified H (0.28-1.2) No modern concentration dataBonfires, accidental fires 0.075-42 NegligibleVehicles - - Covered in other sectionsDisposal of MSW to landfill 150 M (0.23-0.59) Mean contamination data;
leachate may containPCDD/PCDF
Compost from MSW 1.7 LDredging 29 Not applicable Average dataOpen use of chemicals• PCP uses 100-3000 H No Data on other chlorophe-
nols• Other pesticides 4.8-250 H Little contemporary dataSurface runoff Not quantified M Not quantified, liquid discharge
may be significantDry cleaning 0.68-9.8 L (0.00090)PCB 0.31-0.38 M No TEQ dataTotal 1500-12000
8.13 European Emission Inventory
Presently, the European Union (EU) comprises 15 Member States, namely Austria, Belgium,Denmark, France, Finland, Germany, Greece, Ireland, Luxembourg, The Netherlands, Portugal,Spain, Sweden, and the United Kingdom. In February 1993, within the “5th European Program ofPolicy and Action”, the Council of Ministers laid down its political goal to reduce the release ofPCDD/PCDF into the environment and into the human food-chain as a precautionary measure.The final goal to be achieved is to reduce the emissions of PCDD/PCDF by 90 % until the year2005 as compared to the reference year 1985.

Dioxin and Furan Inventories 55
UNEP Chemicals May 1999
To identify dioxin emitting sources and to quantify total releases of PCDD/PCDF within the Mem-ber States, the General Directorate (DG) XI commissioned a research program to the State Envi-ronmental Agency North Rhine-Westphalia (LUA). The program started in 1994 and has twostages (LUA 1997):
(1) Stage I: Collection of data on dioxin releases for the reference period 1993-1995. Besidesemissions to air, releases of PCDD/PCDF to water, land, and residual matter should be cov-ered as well. Based on the information available, the most important data gaps should beidentified; and
(2) Stage II, the gaps should be closed both for countries where only little information isavailable so far and for processes that need better characterization.
In 1997, LUA published the results of Stage I, a two-year research program on information avail-able with regard to emissions of PCDD/PCDF. The report covers the 15 member states of theEuropean Union and additionally includes Norway and Switzerland. The results of the 1997evaluation based on national documentation are summarized in Table 37.
It should be noted, however, that national emission inventories performed shortly afterwards gavedifferent estimates (e.g. emissions from MSWI in Germany, see section 8.5).
One of the major outcomes of the LUA study was that although the knowledge on PCDD/PCDFemissions in European countries has improved considerable, the national inventories are faraway from being complete. No information was available from the member States Greece,Ireland, Luxembourg, and Portugal. Data gaps existed in particular for municipal solid wasteincineration in Italy, Spain, and the large number of small facilities in France. Information on non-atmospheric emissions was reported only for very few countries and a small number of sourcetypes. In general, no emission factors were reported.
Within Stage II of the project, some of the above mentioned data gaps will be closed by theongoing French National Dioxin Program and by a measurement campaign carried out in Spain.Special attention will be paid to sintering plants operated in Belgium, Spain, France, Italy andPortugal. A better database has to be established for clinical waste incineration, especially forthe number and type of the facilities and waste statistics. Measurements are scheduled to beperformed within the Stage II framework in Spain, Denmark, and Poland. It is hoped to obtain amore reliable range of emission factors for this process. Further sub-projects will deal with non-ferrous metal production in the United Kingdom. Finally, PCDD/PCDF emissions from woodcombustion and Diesel-fueled vehicles will be evaluated.
The information in the LUA report is organized according to SNAP (Selected Nomenclature forAtmospheric Pollutants) as established by the CORINAIR (European Air Emission Data Base)inventory system.
8.13.1 Emissions to Air
Analyses of basic documents obtained from the 17 European countries gave total PCDD/PCDFemissions into the air from known sources of approximately 3,300 g I-TEQ/a (see Table 37).However, a re-evaluation of the data using emission factors for a given process were applied tak-ing into account parameters such as abatement technologies. The results of the re-evaluationprocedure yielded PCDD/PCDF emissions to the air from the most relevant sources of 5,800 gI-TEQ/a which are thought to represent 90 % of the total emissions. Thus, it was estimated thatthe annual air emissions of PCDD/PCDF from all known sources in the 17 countries are 6,500 g
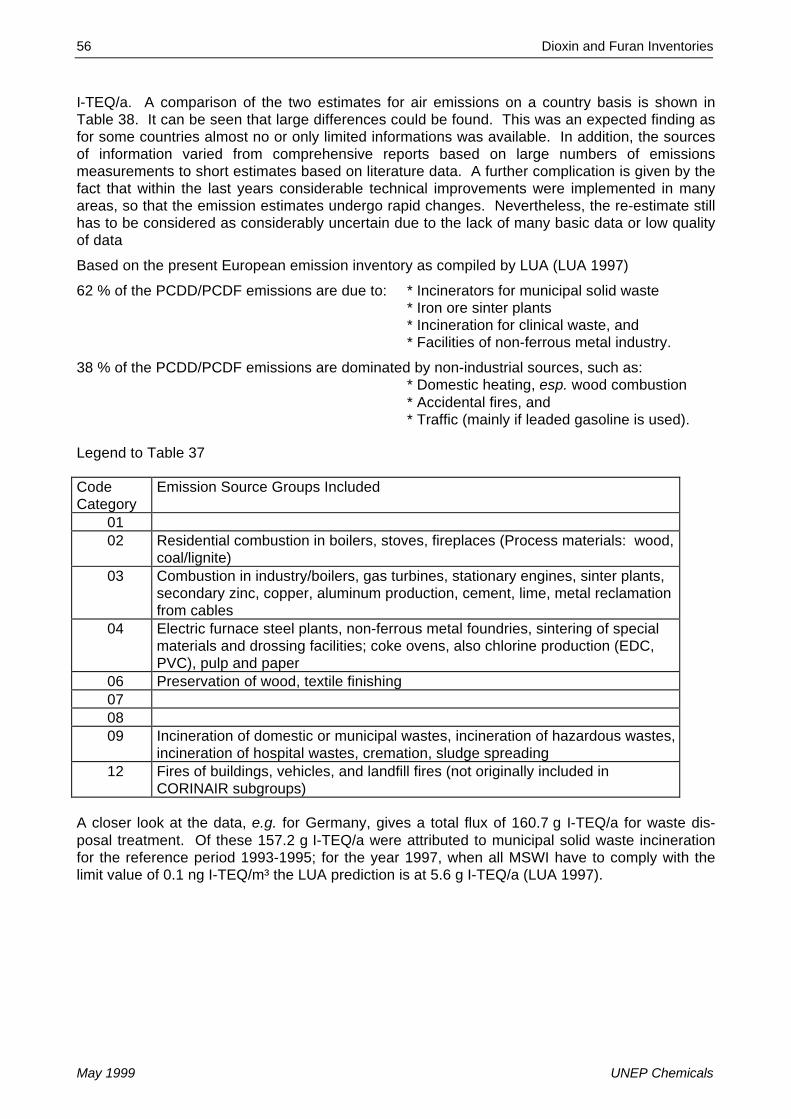
56 Dioxin and Furan Inventories
May 1999 UNEP Chemicals
I-TEQ/a. A comparison of the two estimates for air emissions on a country basis is shown inTable 38. It can be seen that large differences could be found. This was an expected finding asfor some countries almost no or only limited informations was available. In addition, the sourcesof information varied from comprehensive reports based on large numbers of emissionsmeasurements to short estimates based on literature data. A further complication is given by thefact that within the last years considerable technical improvements were implemented in manyareas, so that the emission estimates undergo rapid changes. Nevertheless, the re-estimate stillhas to be considered as considerably uncertain due to the lack of many basic data or low qualityof data
Based on the present European emission inventory as compiled by LUA (LUA 1997)
62 % of the PCDD/PCDF emissions are due to: * Incinerators for municipal solid waste* Iron ore sinter plants* Incineration for clinical waste, and* Facilities of non-ferrous metal industry.
38 % of the PCDD/PCDF emissions are dominated by non-industrial sources, such as:* Domestic heating, esp. wood combustion* Accidental fires, and* Traffic (mainly if leaded gasoline is used).
Legend to Table 37
CodeCategory
Emission Source Groups Included
0102 Residential combustion in boilers, stoves, fireplaces (Process materials: wood,
coal/lignite)03 Combustion in industry/boilers, gas turbines, stationary engines, sinter plants,
secondary zinc, copper, aluminum production, cement, lime, metal reclamationfrom cables
04 Electric furnace steel plants, non-ferrous metal foundries, sintering of specialmaterials and drossing facilities; coke ovens, also chlorine production (EDC,PVC), pulp and paper
06 Preservation of wood, textile finishing070809 Incineration of domestic or municipal wastes, incineration of hazardous wastes,
incineration of hospital wastes, cremation, sludge spreading12 Fires of buildings, vehicles, and landfill fires (not originally included in
CORINAIR subgroups)
A closer look at the data, e.g. for Germany, gives a total flux of 160.7 g I-TEQ/a for waste dis-posal treatment. Of these 157.2 g I-TEQ/a were attributed to municipal solid waste incinerationfor the reference period 1993-1995; for the year 1997, when all MSWI have to comply with thelimit value of 0.1 ng I-TEQ/m³ the LUA prediction is at 5.6 g I-TEQ/a (LUA 1997).
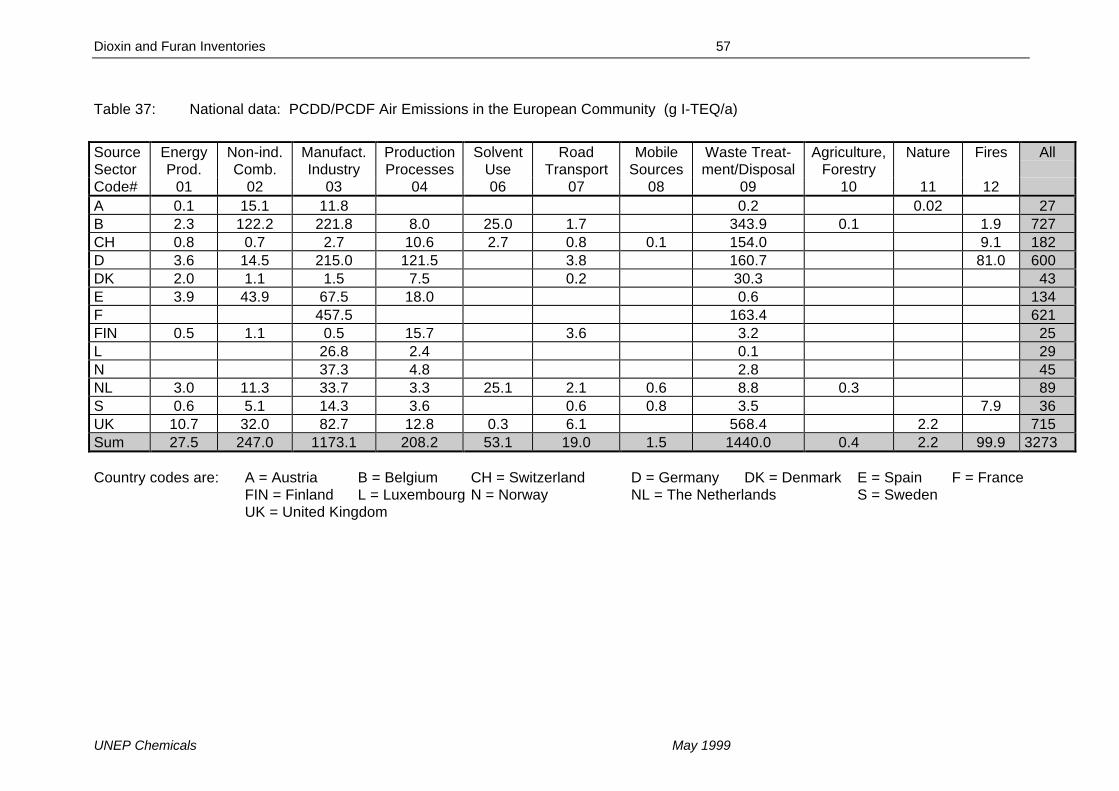
Dioxin and Furan Inventories 57
UNEP Chemicals May 1999
Table 37: National data: PCDD/PCDF Air Emissions in the European Community (g I-TEQ/a)
SourceSector
EnergyProd.
Non-ind.Comb.
Manufact.Industry
ProductionProcesses
SolventUse
RoadTransport
MobileSources
Waste Treat-ment/Disposal
Agriculture,Forestry
Nature Fires All
Code# 01 02 03 04 06 07 08 09 10 11 12A 0.1 15.1 11.8 0.2 0.02 27B 2.3 122.2 221.8 8.0 25.0 1.7 343.9 0.1 1.9 727CH 0.8 0.7 2.7 10.6 2.7 0.8 0.1 154.0 9.1 182D 3.6 14.5 215.0 121.5 3.8 160.7 81.0 600DK 2.0 1.1 1.5 7.5 0.2 30.3 43E 3.9 43.9 67.5 18.0 0.6 134F 457.5 163.4 621FIN 0.5 1.1 0.5 15.7 3.6 3.2 25L 26.8 2.4 0.1 29N 37.3 4.8 2.8 45NL 3.0 11.3 33.7 3.3 25.1 2.1 0.6 8.8 0.3 89S 0.6 5.1 14.3 3.6 0.6 0.8 3.5 7.9 36UK 10.7 32.0 82.7 12.8 0.3 6.1 568.4 2.2 715Sum 27.5 247.0 1173.1 208.2 53.1 19.0 1.5 1440.0 0.4 2.2 99.9 3273
Country codes are: A = Austria B = Belgium CH = Switzerland D = Germany DK = Denmark E = Spain F = FranceFIN = Finland L = Luxembourg N = Norway NL = The Netherlands S = SwedenUK = United Kingdom

58 Dioxin and Furan Inventories
May 1999 UNEP Chemicals
Table 38: PCDD/PCDF air emissions in the European Community – Comparison of resultsfrom national reports and LUA re-estimate; reference years 1993-1995(g I-TEQ/a) (Quaß et al. 1998)
Country National Reports LUA Re-EstimateAustria 29 121Belgium 727 484Denmark 43 50Finland 25 69France 621 1119Germany 600 840Greece No data 122Ireland No data 33Italy No data 1050Luxembourg 29 50The Netherlands 89 117Norway 45 41Portugal No data 127Spain 134 327Sweden 36 89Switzerland 182 183United Kingdom 715 928Total 3273 5750
An evaluation of the re-estimated emissions revealed that the European dioxin inventory is domi-nated by a few source categories. In the reference period 1993-1995, the largest contributor tothe inventory was municipal waste incineration followed by sinter plants (see Table 39). Strongdecreasing trends were identified for two source categories: Many countries are in the process tophase out leaded gasoline what will reduce dioxin emissions from this sector. The strongestdecline in the present inventory can be expected for municipal waste incineration: Whereas forthe reference period 1993-1995, the re-estimate was calculated to be 1,467 I-TEQ/a, only 20 gI-TEQ/a will be emitted if all MSWIs in Europe will comply with a limit value of 0.1 ng I-TEQ/m³ asproposed by the recent draft of the European Commission (EU 1998).

Dioxin and Furan Inventories 59
UNEP Chemicals May 1999
Table 39: PCDD/PCDF air emissions in the European Community – Most important sourcesfor reference years 1993-1995, LUA re-estimate (g I-TEQ/a) (Quaß et al. 1998)EF = Emission factor, AR = Activity rate
Source Type PCDD/PCDFg I-TEQ/a)
Remarks UncertaintyEF / AR
Municipal waste incineration 1467+ 174
Decreasing trendIllegal burning of domesticwaste
Low / Low
Sinter plants 1010+115 Sinter plants for recycling
materials
Medium / Low
Residential wood combustion 945 Use of contaminated wooduncertain
Medium / High
Clinical waste incineration 816 Few plant data and statistics High / HighWood preservation 381 From PCP-treated materials v. High / v. HighFires 380 Based on one reference only v. High / v. HighNon-ferrous metals 136 Cu, Al., Zn Medium / LowRoad transport 111 Mainly leaded fuel; decreas-
ing trendLow / Low
8.13.2 PCDD/PCDF Releases to Water and Residues
Apparently, much less is known about PCDD/F emissions through waste water and process resi-dues/wastes. Some of the reviewed national documents contain emission estimates whichamount to a total of 3,500 g I-TEQ per year for residues and about 20 g I-TEQ per year for wastewater. Both values must be considered as being uncertain, since no data are available to datefrom a huge number of emission sources. Emissions via wastewaters seem to be negligiblecompared with atmospheric emissions and emissions via residual materials. Thus the totalemissions into the atmosphere and through residues disposed off in landfills or other reservoirsare assessed to be of the same order of magnitude. Due to the lack of pertinent emission factorsand activity rates a recalculation of the emissions via wastewater or residues for all countries wasimpossible.
8.13.3 Conclusions
As indicated by the large emission margins calculated to be about 1,300-20,000 g I-TEQ/a for airemissions and 500-9,000 g I-TEQ/a for emissions via residual materials the overall uncertainty ofthe inventoried emission estimates is quite high. Moreover, the quality of the information avail-able from the respective national institutions differs widely particularly with respect to the numberof sources considered and the extent of measurements on which estimates are based. Mostdata are available concerning air emissions; the data situation is much worse with respect toother pathways of PCDD/PCDF into the environment. In particular, measurements ofPCDD/PCDF concentrations in residual materials are often not available; information about theamount and the fate of production wastes is scarce. Regarding the most relevant air emissionsources data gaps still exist and thus, causing considerable uncertainties of the emissionestimates:

60 Dioxin and Furan Inventories
May 1999 UNEP Chemicals
Municipal waste incineration: The main data gaps exist for plants located in Spain and Italywhere no measured data were available. In addition, there are no emission data from the largenumber of small incineration facilities (capacity <3 t/h) operated in France. Nevertheless, theemission estimate is assumed to have quite a high degree of certainty.
Iron ore sinter plants: PCDD/PCDF air emissions from about 10-15 sinter plants have beenmeasured during the last years with almost similar results. However in a few cases, unexpect-edly high flue gas concentrations (20-fold higher) were detected. Consequently, there is anurgent need to obtain more and reliable data from all remaining plants. It has been shown thatthe whole European emission inventory is highly sensitive to such outliers.
Clinical waste incineration: The major difficulty with the dioxin emission estimate is with the factthat there are no consistent statistical data available on the amount of clinical waste being incin-erated. Apparently, only total generation data are available without specification. Moreover, noinformation was available about the number and technology of the facilities presently inoperation. It is known that in some countries (e.g. Germany, the Netherlands) small in-housefacilities were shut down in the early 1990s. The few existing emission measurements gave awide range of emission factors. Consequently, the uncertainty of the emission estimate is veryhigh for this sector. Additional work to improve the database was strongly recommended.
Non ferrous metal industry: Among the large number of production facilities in this sector, theplants to recover metals from secondary materials need special attention, especially plants in Bel-gium, France, Spain, Italy, and the United Kingdom. Present emission factors were derived fromdata gathered in Switzerland, Germany, and The Netherlands and may not be applicable forother countries. Since the dioxin emissions may vary considerably with the technology applied(e.g. like in the case of hot and cold cupola furnaces), the use of pure statistical production datawithout relation to the actual technology will result in additional errors into the emission estimate.Moreover, no information was found on the number of cable recovering facilities. As this emis-sion source may have a significant local impact, better knowledge on the locations of such plantsand measured data are needed. In countries like Germany, thermal cable recycling was stoppedabout ten years ago.
Residential Wood Combustion: This sector is still highly uncertain, especially concerning theamount and the composition of wood being fueled into the stoves. The extent of co-combustionof household wastes is almost unknown and should be assessed by empirical studies since thispractice may influence considerably the PCDD/PCDF emissions from stoves and fireplaces.
Fires: It is well known that PCDD/PCDF may be formed during accidental fires of buildings,equipment, and vehicles; however, a prediction of the emission concentrations is very uncertain.The emission factors derived so far from a few experiments must be regarded as highly uncer-tain. Results from real fires have shown that very often, laboratory and pilot scale experimentsoverestimated the dioxin concentrations. Fire statistics generally do not contain data about themass and composition of burnt materials; these data can only roughly be estimated. An improve-ment of the data situation is regarded to be almost impossible and would require large efforts;hence no recommendation was given by LUA to further improve the database.
Road traffic: According to the available data, PCDD/PCDF emissions from road traffic predomi-nantly are caused by combustion of leaded fuels. Therefore they play a role only in countrieswith this fuel still in use. On the basis of emission factors derived from various investigations, theannual emission from this source category could be estimated with an acceptable precision.However, in the scientific literature, possible PCDD/PCDF emissions from heavy-duty Diesel en-gines are being discussed repeatedly; thus additional work seems to be necessary to get morereliable data.

Dioxin and Furan Inventories 61
UNEP Chemicals May 1999
8.14 European Atmospheric Emission Inventory
The TNO Institute of Environmental Sciences, Energy Research and Process Innovation, Apel-doorn (The Netherlands) published “The European Atmospheric Emission Inventory of HeavyMetals and Persistent Organic Pollutants for 1990“ on behalf of the German EnvironmentalAgency (UBA) (UBA 1997). The report presents the results of an emission inventory project forheavy metals and persistent organic pollutants for 1990 on the basis of submissions of emissiondata from the Parties to OSPARCOM, HELCOM and the Convention on LRTAP. The inventoryincludes all countries in Europe, except the three Caucasian countries and Turkey (total of 38countries), and is based on official country submissions and supplementary default emission esti-mates by TNO. The report’s substance list includes amongst others polychlorinated dibenzo-p-dioxins and polychlorinated dibenzofurans (PCDD/PCDF). For the countries, sources or com-pounds missing in official submissions, default emission estimates have been prepared andapplied to complete the inventory. The inventory practically covers the whole of Europe and theinventory results are available on a 50x50 km² EMEP grid for modeling purposes. The report isintended to be a preparatory step towards the preparation of the European CORINAIR95 emis-sion inventory. Similarly to the LUA Dioxin Emission Inventory Report (LUA 1997), the sourcesare categorized according to the SNAP categories.
This report presents the results of the inventory in the form of tables, maps and figures for allcompounds investigated. Here, only the results for PCDD/PCDF are summarized. The resultsare a mixture of official country submitted data and default emission estimates by TNO as not allcountries have been in the position to offer complete information on source categories andsubstances. The default emission database was prepared for the base year 1990.
In general terms, the PCDD/PCDF emission per source category has been estimated for eachcountry by multiplying the activity rate of the source (e.g. ton cement produced) with an emissionfactor (e.g. mg I-TEQ emitted per ton cement produced). A large number of handbooks and offi-cial statistics have been used to determine activity rate data for the project-specific SNAP sectorsapplied in this inventory.
The default emission factors have been applied uniformly over Europe for most categories due tolack of detailed and reliable data rather than deliberate choice. Differences in default emissionfactors between regions and countries in the validation database are based on differences bothin techniques and in abatement.
In order to determine the total emissions for the 38 European countries, Europe was split in threegroups: North-western (including Italy), Southern (excluding Italy), and Central and Easterncountries. Table 40 shows which countries belong to which group.
Table 40: Classification of countries into three groups to assign emission factors
Region CountriesNorth-western Europe Austria, Belgium, Denmark, Finland, France, Germany, Iceland, Ire-
land, Italy, Luxembourg, the Netherlands, Norway, Sweden, Swit-zerland and the United Kingdom
Southern Europe Cyprus, Greece, Portugal and SpainCentral and EasternEurope
Albania, Belarus, Bosnia and Herzegovina, Bulgaria, Croatia, theCzech Republic, Estonia, Hungary, Latvia, Lithuania, Former Yugo-slav Republic of Macedonia, Moldova, Poland, Romania, the Rus-sian Federation, the Slovak Republic, Slovenia, Ukraine and Yugo-slavia (Serbia and Montenegro)
62 Dioxin and Furan Inventories
May 1999 UNEP Chemicals
Default emission factors were determined for PCDD/PCDF depending on the sector and theregion. As can be seen from Table 41, except for municipal solid waste incineration, no differ-ence was made between regions. In other words: the same emission factors applied to anindustrial sector independent of the country. As a consequence it was assumed that there is nodifference in technology throughout Europe for the reference year 1990. For municipal solidwaste incineration, only the Western European countries were given a lower emission factor of40 mg I-TEQ/kton of waste incinerated whereas for all other regions an emission factor of150 mg I-TEQ/kton was assigned. An emission factor of 40 mg I-TEQ/kton corresponds to astack concentration of 8 ng I-TEQ/m³ and a factor of 150 mg I-TEQ/kton to a concentration of40 ng I-TEQ/m³. The limit concentration of 0.1 ng I-TEQ/m³ established by many countries formunicipal solid waste incineration would result in an emission factor of 0.5 mg I-TEQ/kton.
For the year 1990, there are hardly any measurements available from the ferrous and non-fer-rous metal industries as well as for crematoria, etc. and thus, the TNO estimates cannot be veri-fied by actual measurements. Nevertheless, the relation between industrial sectors does notseem to be supported on present knowledge. As an example, it is hard to understand that themost advanced municipal solid waste incinerators on an average emit eight times more dioxinsthan sinter plants (based on all existing plants). In addition, it is well known that the copperindustry is much more susceptible to generating PCDD/PCDF than the lead sector. Until present,PCDD/PCDF have not been detected in the emissions of kerosene combustion.
The total PCDD/PCDF emissions are summarized in Table 42. The total PCDD/PCDF emissionswere calculated to 11,300 g I-TEQ for the reference year 1990. The major emitters were station-ary combustion processes with 4,300 g I-TEQ/a. The largest single source was waste incinera-tion with 2,660 g I-TEQ/a. The contribution to the total inventory by country is given in Table 43.
Aggregated emissions are summarized in Table 44. For the OSPARCOM (15) and EU memberstates (15), the sectors with the highest PCDD/PCDF emissions were municipal waste incinera-tion, combustion of hard coal and other fuels and combustion processes in sinter plants. For theHELCOM (9) and the Central and Eastern European countries (19) combustion of hard coal wasidentified as the major contributor to the dioxin emission inventory followed by sinter plants andthe copper industry.
The TNO European Emissions Inventory was established for a broad range of compounds, heavymetals and organic substances, and makes a lot of generalizations. It determined emission fac-tors and does not account for differences in technology. Especially for PCDD/PCDF, where somany measurements are available and almost all potential source categories have been ana-lyzed for their air emissions, the methodology applied here is too coarse and the data too out-dated for the real situation today. The document should be taken for screening purposes for alarge number of chemicals and for countries where no data are available. To establish a nationaldioxin inventory, experiences from other countries and from their inventories should be applied.

Dioxin and Furan Inventories 63
UNEP Chemicals May 1999
Table 41: Region-specific default emission factors for PCDD/PCDFEmission factors are in mg I-TEQ/kton or µg I-TEQ/tNW = Northwestern Europe; S = Southern EuropeC+E = Central and Eastern Europe
Branch Description NW S C+ETransformation brown coal All types of brown coal 0.10Transformation fuel oils Light fuel oils 1.0Transformation fuel oils Heavy fuel oil, crude oil 1.0Transformation hard coal All hard coal types 0.10Transformation other fuels Other solid fuels 0.10Transformation other fuels Peat 0.10Small comb. sources brown coal Brown coal briquettes 10Small comb. sources brown coal Brown coal, lignite coke 10Small comb. sources fuel oils Fuel oils light 1.0Small comb. sources fuel oils Heavy fuel oil, crude oil 1.0Small comb. sources hard coal All hard coal types 10Small comb. sources other fuels Other solid fuels 10Small comb. sources other fuels Peat 10Small comb. sources other fuels Wood 5.0Industry brown coal All types of brown coal 1.0Industry fuel oils Fuel oils light 1.0Industry fuel oils Heavy fuel oil, crude oil 1.0Industry hard coal All hard coal types 1.0Industry other fuels Other solid fuels 1.0Industry other fuels Peat 1.0Industry other fuels Wood 1.0Electric arc furnace 2.0Sinter plants 5.0Cu industry Secondary production 20Pb industry Secondary production 20Other transport combustion Diesel 1.0Other transport combustion Heavy fuel oil, patent fuel 1.0Other transport combustion Kerosene 1.0Other transport combustion Motor gasoline 1.0Waste incineration Municipal waste 40 150
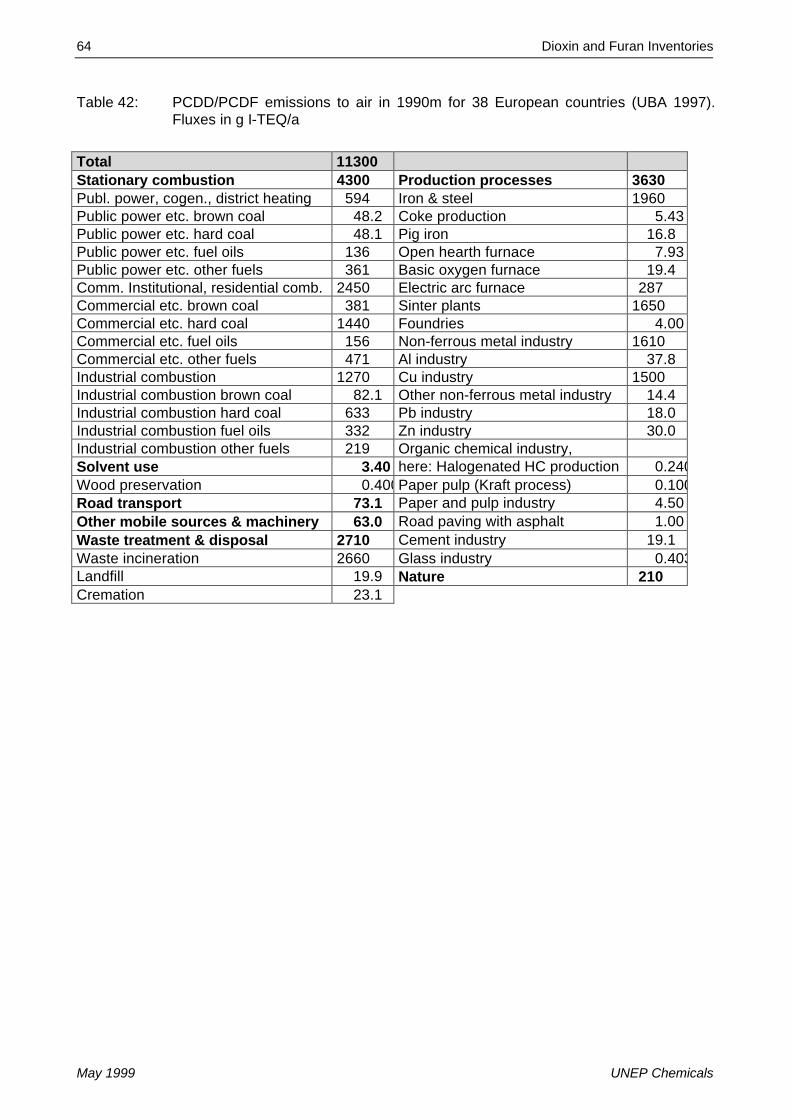
64 Dioxin and Furan Inventories
May 1999 UNEP Chemicals
Table 42: PCDD/PCDF emissions to air in 1990m for 38 European countries (UBA 1997).Fluxes in g I-TEQ/a
Total 11300Stationary combustion 4300 Production processes 3630Publ. power, cogen., district heating 594 Iron & steel 1960Public power etc. brown coal 48.2 Coke production 5.43Public power etc. hard coal 48.1 Pig iron 16.8Public power etc. fuel oils 136 Open hearth furnace 7.93Public power etc. other fuels 361 Basic oxygen furnace 19.4Comm. Institutional, residential comb. 2450 Electric arc furnace 287Commercial etc. brown coal 381 Sinter plants 1650Commercial etc. hard coal 1440 Foundries 4.00Commercial etc. fuel oils 156 Non-ferrous metal industry 1610Commercial etc. other fuels 471 Al industry 37.8Industrial combustion 1270 Cu industry 1500Industrial combustion brown coal 82.1 Other non-ferrous metal industry 14.4Industrial combustion hard coal 633 Pb industry 18.0Industrial combustion fuel oils 332 Zn industry 30.0Industrial combustion other fuels 219 Organic chemical industry,Solvent use 3.40 here: Halogenated HC production 0.240Wood preservation 0.400Paper pulp (Kraft process) 0.100Road transport 73.1 Paper and pulp industry 4.50Other mobile sources & machinery 63.0 Road paving with asphalt 1.00Waste treatment & disposal 2710 Cement industry 19.1Waste incineration 2660 Glass industry 0.403Landfill 19.9 Nature 210Cremation 23.1

Dioxin and Furan Inventories 65
UNEP Chemicals May 1999
Table 43: 38 European countries: PCDD/PCDF emissions in 1990 by country (UBA 1997).Fluxes in g I-TEQ/a
Country Flux/a Country Flux/aAlbania 12.1 Ireland 43.9Austria 84.8 Iceland 0.553Belgium 616 Italy 583Bulgaria 154 Lithuania 23.0Bosnia and Herzegovina 7.13 Luxembourg 27.6Belarus 106 Latvia 13.5Switzerland 242 Moldova 22.7Cyprus 1.02 Former Yugoslav Republic of Macedo-
nia4.90
Czech Republic 224 The Netherlands 505Germany 1196 Norway 38.7Denmark 70.6 Poland 359Spain 134 Portugal 17.4Estonia 17.7 Romania 1500Finland 53.3 Russian Federation 1412France 1636 Slovak Republic 43.0United Kingdom 881 Slovenia 5.99Greece 25.4 Sweden 83.5Croatia 12.9 Ukraine 877Hungary 167 Yugoslavia (Serbia and Montenegro) 112
Total Europe 11314
Table 44: Aggregated PCDD/PCDF emissions; reference year 1990. Fluxes in g I-TEQ/a
Flux/aOSPARCOM (15)Belgium, Denmark, Finland, France, Germany, Iceland, Ireland, Luxembourg, TheNetherlands, Norway, Portugal, Spain, Sweden, Switzerland, United Kingdom
5840
HELCOM (9)Denmark, Estonia, Finland, Germany, Latvia, Lithuania, Poland, Russian Federation,Sweden
3230
EU (15)Austria, Belgium, Denmark, Finland, France, Germany, Greece, Ireland, Italy, Lux-embourg, The Netherlands, Portugal, Spain, Sweden, United Kingdom
6250
Central and Eastern Europe (19)Albania, Belarus, Bosnia and Herzegovina, Bulgaria, Croatia, Czech republic, Esto-nia, Former Yugoslav Rep. of Macedonia, Hungary, Latvia, Lithuania, Moldova,Poland, Romania, Russian Federation, Slovak Republic, Slovenia, Ukraine, Yugosla-via (Serbia and Montenegro)
5070
66 Dioxin and Furan Inventories
May 1999 UNEP Chemicals
9 DIOXIN INVENTORIES FROM THE AMERICAN CONTINENTS
9.1 CanadaAs part of the mandate given to the Federal/Provincial Task Force on Dioxins and Furans todevelop an inventory of sources of releases of PCDD/PCDF in Canada, a report was published inJanuary 1999 (Environment Canada 1999). The purpose of the inventory report is to assist theFederal/Provincial Advisory Committee for the Canadian Environmental Protection Act (CEPA-FPAC) in identifying priority sectors for the development of prevention or reduction measuresregarding the releases of dioxins and furans (and hexachlorobenzene, HCB). The final goal isthe virtual elimination of these toxic substances. The inventory report covers man-made sourcesknown to release PCDD/PCDF in a continuous (or batch) process. The results are summarizedin Table 45 to * Projections
Table 49. The report covers releases of PCDD/PCDF to air, water, land and with products.
Between 1990 and 1997 an 18 % reduction in atmospheric releases was observed. For the year1999, it is projected that an additional 25 % reduction will be achieved as a result of announcedup-grades or closures of industrial facilities for a total reduction of 43 % compared to base year1990. A number of priority sectors were identified and reduction measures initiated. Thereleases of individual sources quantified so far are summarized in Table 45.
Municipal solid waste incineration is currently the largest emitting sector in Canada. There arecurrently nine operating large municipal waste incinerators in Canada (66.9 g TEQ/year - 23.1 %of total). Of these, stack testing for PCDD/PCDF has been performed on eight facilities and theremaining facility emissions was estimated. Of the total 66.9 g I-TEQ/a emissions, 61.8 gI-TEQ/a is emitted from one facility in Lévis, Québec. This facility is undergoing renovations to becompleted in the fall of 1998, which should reduce the dioxin/furan emissions to 0.08 g TEQ/a.In 1999, the total PCDD/PCDF release from this sector is expected to drop to 5.1 g I-TEQ/a.Measured concentrations ranged 0.0057 to 390 ng I-TEQ/m³. Small municipal waste incineratorsemitted 9.4 % in 1997. All small incinerators in British Columbia will be shut down and replacedby other facilities by the end of 1998. The third category of municipal waste incinerators inCanada is low temperature Teepee burners (45 existing) located in Newfoundland. Theestimated releases accounted to 74.5 g I-TEQ in the year 1997. It should be noted that none ofthese facilities has been tested; the estimate is based on emissions factors from the literature.
Residential wood combustion is another important sector, which is estimated to discharge 12% ofthe total PCDD/PCDF inventory. For both sectors, the Task Force recommends that optionsshould be investigated which might lead to reduced concentrations of PCDD/PCDF from existingfacilities and that feasible targets and timelines be established applicable to new municipalincinerators and new residential wood combustion equipment.
There are two sintering plants in Ontario: one of these was tested for PCDD/PCDF emissions(5.6 ng I-TEQ/m³). The actual emissions from the iron and steel sector need to be confirmed.There are 13 steel plants (electric arc furnaces) in Canada: none of these were tested forPCDD/PCDF stack emissions so far. For the inventory, European emission factors were used. Itwas recommended that Canadian operations should be requested to perform representativesource testing for PCDD/PCDF.
Dioxin and Furan Inventories 67
UNEP Chemicals May 1999
A survey of all hospital incinerators in 1995 revealed that there were 219 incinerators burning bio-medical waste in Canada. Testing for PCDD/PCDF has been completed at six typical Ontarioincinerators and the results of these tests extrapolated to all facilities in Canada based on thequantity of material burned. The estimated PCDD/PCDF emissions from hospital incinerators inCanada were 8.3 g TEQ/a in 1995. Since 1995, a number of hospital incinerators had been shutdown, thus reducing the total number of hospital incinerators to 160 and the total releases to 2.5g I-TEQ/a. All hospital incinerators in B.C. are expected to shut down by December 1998. Thiswould further reduce the release from this sector.
A unique source exists in British Columbia where that the wood used in the pulp and paperindustry is stored in salty water before combustion. The emissions from this sector were esti-mated to be 10.5 g I-TEQ in the year 1997.Releases to water were reduced by 99 % when comparing 1990 data with 1997 data. This is theresult of the adoption and implementation of pulp and paper regulations. Releases to effluentsfrom the pulp and paper sector have been reduced to below the “measurable concentration” levelas per the regulations, which is in keeping with the objective of virtual elimination. For this sector,for release to water no additional work is recommended. Emissions to water are shown inNumbers for 1999 are projections. Numbers in bold are priority sectors
Table 46. Before the adoption of the Pulp and Paper Regulations in 1992, the PCDD/PCDFreleased from this sector in liquid effluents amounted to approximately 450 g TEQ/a. The laststatus report for this sector indicates that the total release from the sector is now 5 g TEQ/a. ThePCDD/PCDF releases for the Pulp and Paper sector are based on an inventory of the 1995 dis-charges. The high contribution from British Columbia mills is due to the character of the effluentsfrom the coastal mills. These show the presence of higher concentrations of certain homologues.The congener pattern of these are linked to the operations of boilers that burn salty hog, wherewaste ash is disposed in the effluent treatment plant. Also there are indications of a patternassociated with pulping of chips from wood treated with pentachlorophenol. These activities werenot associated with either Inland British Columbia mills or mills elsewhere. The unique circum-stances of the coastal mills explain why the British Columbia discharges are greater than theproduction from these mills would account for.
Direct PCDD/PCDF releases to soil are expected as a result of the use of pesticides and of sew-age sludge.· The Pest Management Regulatory Agency (PMRA) is currently quantifying thereleases resulting from the use of pesticides.· Sewage sludge has been identified as a source ofPCDD/PCDF, however, the release to soil has not been yet quantified. Studies carried out indi-cate that this might be a concern. An additional source is in-service treated wood (utility polesand railroad ties). Results are compiled in Table 47.Reported amounts of PCDD/PCDF in products that may lead to releases to soil are from the ashresulting from the combustion of salt laden wood in British Columbia and the disposal of treatedwood. The total amounts are not expected to have changed between 1990 and 1999 (see *Projections
Table 48). The pulp and paper industry in British Columbia has measured the quantities andconcentrations of PCDD/PCDF in the ash produced by these boilers. The concentration ofPCDD/PCDF in the ash varied between 0.009 and 3.7 ng TEQ/g ash. The ash is disposed of intwo cases in ash ponds and in eight cases in a landfill. PCDD/PCDF are formed due to the factthat the wood used is stored in the salty water before combustion. This problem is unique toBritish Columbia, it is not found at mills on the east coast.
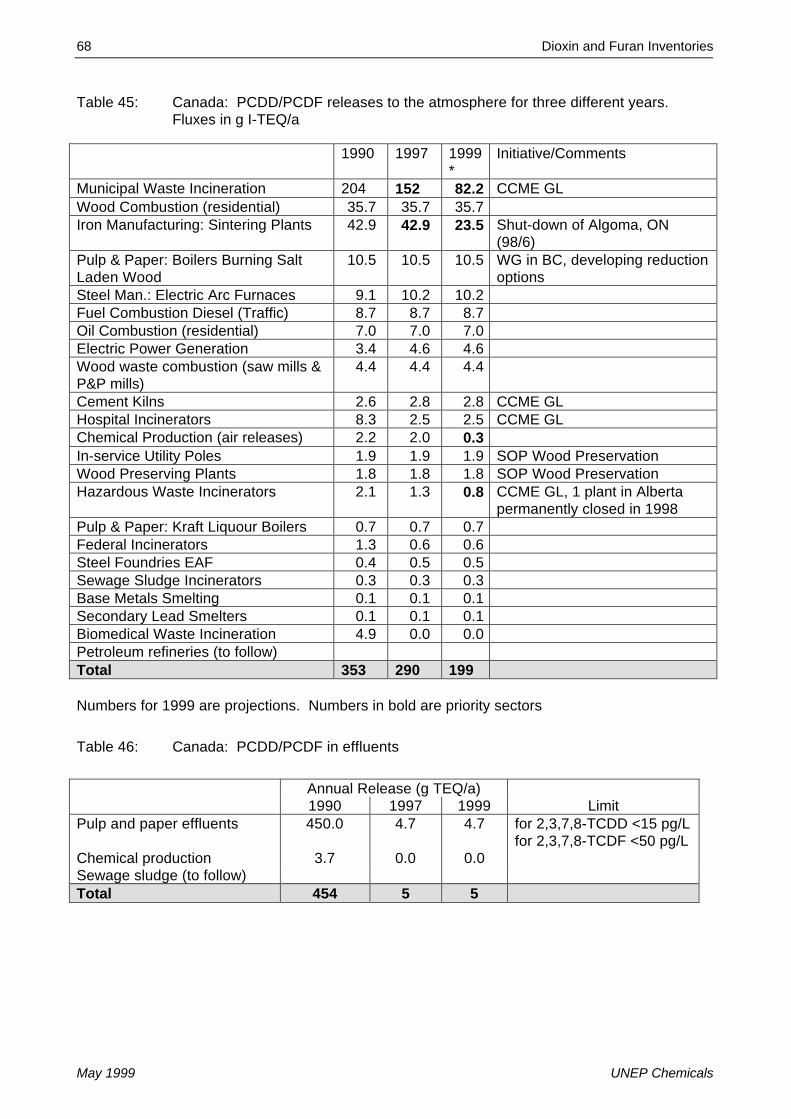
68 Dioxin and Furan Inventories
May 1999 UNEP Chemicals
Table 45: Canada: PCDD/PCDF releases to the atmosphere for three different years.Fluxes in g I-TEQ/a
1990 1997 1999*
Initiative/Comments
Municipal Waste Incineration 204 152 82.2 CCME GLWood Combustion (residential) 35.7 35.7 35.7Iron Manufacturing: Sintering Plants 42.9 42.9 23.5 Shut-down of Algoma, ON
(98/6)Pulp & Paper: Boilers Burning SaltLaden Wood
10.5 10.5 10.5 WG in BC, developing reductionoptions
Steel Man.: Electric Arc Furnaces 9.1 10.2 10.2Fuel Combustion Diesel (Traffic) 8.7 8.7 8.7Oil Combustion (residential) 7.0 7.0 7.0Electric Power Generation 3.4 4.6 4.6Wood waste combustion (saw mills &P&P mills)
4.4 4.4 4.4
Cement Kilns 2.6 2.8 2.8 CCME GLHospital Incinerators 8.3 2.5 2.5 CCME GLChemical Production (air releases) 2.2 2.0 0.3In-service Utility Poles 1.9 1.9 1.9 SOP Wood PreservationWood Preserving Plants 1.8 1.8 1.8 SOP Wood PreservationHazardous Waste Incinerators 2.1 1.3 0.8 CCME GL, 1 plant in Alberta
permanently closed in 1998Pulp & Paper: Kraft Liquour Boilers 0.7 0.7 0.7Federal Incinerators 1.3 0.6 0.6Steel Foundries EAF 0.4 0.5 0.5Sewage Sludge Incinerators 0.3 0.3 0.3Base Metals Smelting 0.1 0.1 0.1Secondary Lead Smelters 0.1 0.1 0.1Biomedical Waste Incineration 4.9 0.0 0.0Petroleum refineries (to follow)Total 353 290 199
Numbers for 1999 are projections. Numbers in bold are priority sectors
Table 46: Canada: PCDD/PCDF in effluents
Annual Release (g TEQ/a)1990 1997 1999 Limit
Pulp and paper effluents 450.0 4.7 4.7 for 2,3,7,8-TCDD <15 pg/Lfor 2,3,7,8-TCDF <50 pg/L
Chemical production 3.7 0.0 0.0Sewage sludge (to follow)Total 454 5 5

Dioxin and Furan Inventories 69
UNEP Chemicals May 1999
Table 47: Canada: PCDD/PCDF in soil
Sector Annual Release (g TEQ/a)1990 1997 1999*
Utility poles - in service 9 9 9Railroad ties – in service 164 164 164Total 173 173 173* Projections
Table 48: Canada: PCDD/PCDF releases in products (g I-TEQ/a)
Sector Annual Release (g TEQ/a)1990 1997 1999*
Pulp d paper: Boilers burning salt laden wood 137 137 137Out-of-service (landfilled) treated wood 89 89 89Total 226 226 226* Projections
Table 49: Canada: Summary of PCDD/PCDF releases to all media (g TEQ/a)* Projections
1990 1997 1999 *Air releases 353 290 199Effluents 454 5 5To soil (not complete) 173 173 173Total 980 468 377* Projections
9.2 United States of America
In 1992, the U.S. Environmental Protection Agency's Office of Research and Development(ORD) began an effort to reassess the exposure and health effects associated with polychlori-nated dibenzo-p-dioxins and polychlorinated dibenzofurans (PCDD/PCDF). Originally, the expo-sure portion of the Dioxin Reassessment did not include an emission inventory component asthere was a concern that the database for such an inventory was inadequate. However, review-ers of these early drafts strongly urged EPA to attempt an emissions inventory using the avail-able data. Responding to this suggestion, an inventory was developed and first published inSeptember 1994 as part of the overall draft Reassessment.
The draft Reassessment underwent reviews by both the public and EPA's Science AdvisoryBoard (SAB). In response to all comments and the availability of additional data, a number ofchanges have been made to the inventory since the 1994 draft resulting in significant revisions toboth the inventory structure and actual emission estimates. The information presented in thissection 9.2 is taken from the April 1998 draft report, ORD’s most recent but not finalizedinventory (US-EPA 1998).
In contrast to the 1992 version of the USA Emission inventory, the present inventory recognizesthe time-dependence of any emission inventory and thus reports emission estimates for the two

70 Dioxin and Furan Inventories
May 1999 UNEP Chemicals
reference years 1987 and 1995. 1987 was selected primarily because, prior to this time, littleempirical data existed for making source specific emission estimates. In addition, the year 1987also corresponds roughly with the time that significant advances occurred in emissions meas-urement techniques and in the development of high resolution mass spectrometry and gas chro-matography necessary for analytical laboratories to achieve low level detection of PCDD/PCDF inenvironmental samples. As a consequence, a number of facilities began upgrades specificallyintended to reduce PCDD/PCDF emissions. 1995 was selected as the latest time period wherealmost complete information was available consistent with the timetable for producing the rest ofthe Reassessment document.
A key element of the inventory is the method of extrapolation from tested facilities to nationalestimates. Because only a few U.S. facilities in most source categories have been tested forPCDD/PCDF emissions, an extrapolation was needed to estimate national emissions for mostsource categories. Many of the national emission estimates were, therefore, developed using a"top down" approach. The first step in this approach is to derive from the available emissionmonitoring data an emission factor (or series of emission factors) deemed to be representative ofthe source category (or segments of a source category that differ in configuration, fuel type, airpollution control equipment, etc.). The emission factor was then multiplied by a national value forthe activity level basis of the emission factor (e.g., total kg of material processed in the UnitedStates annually). Although no categories had estimates developed from a true "bottom up"approach (i.e., estimates developed using site-specific emissions and activity data for all individ-ual sources in a category and then summed to obtain a national total), existing facility-specificemissions testing and activity level data for some source categories (e.g., municipal solid wasteincinerators) supported a semi-"bottom up" approach. In this approach, facility-specific annualemissions were calculated for those facilities with adequate data. For the untested facilities inthe class, a subcategory (or class) emission factor was developed by averaging the emissionfactors for the tested facilities in the class. This average emission factor was then multiplied bythe measure of activity for the non-tested facilities in the class. Emissions were summed for thetested facilities and non-tested facilities. It should be noted that EPA used identical emissionfactors for a given subcategory for the two reference years 1987 and 1995 although it can beassumed that PCDD/PCDF emissions decreased due to improved designand operational prac-tices (e.g. for MSWI, there exist 17 subcategories based on furnace type and Air Pollution Con-trol Devices).
The inventory work in the USA is still on progress. One of the ongoing activities are the investi-gations of the vinyl and PVC manufacturing industries to better characterize the emissions ofPCDD/PCDF from this sector. There are additional samples being analyzed. This initiative isaccompanied by a third party review panel to improve the study.
The April 1998 External Review Draft “The Inventory of Sources of Dioxin in the United States“(US-EPA 1998) released by the U.S. Environmental Protection Agency (US-EPA) lists five majorgroups of PCDD/PCDF sources:• Combustion sources• Metals smelting and refining sources and processing sources• Chemical manufacture• Biological and photochemical processes• Reservoir sources.
For sources in each of the above classes - with the exception of reservoir sources - emissionestimates have been made for air, land, water, and products. For all estimates, lower, central,and upper estimates were given. The emission inventory was set up for the two reference years1987 and 1995 giving an upper and a lower estimate as well as the central estimate. Here weonly report the central number of the two reference years. The last column of Table 50 gives thechange of the emissions in percent when comparing the two reference years. All data were
Dioxin and Furan Inventories 71
UNEP Chemicals May 1999
labeled with a confidence rating (CR) as defined below as well as the number of tested facilitiesout of total facilities were reported in the 1998 Emission Inventory. A summary of the mostimportant findings was published at DIOXIN’98, the 18th International Dioxin Symposium, held inStockholm, August 1998 (Cleverly et al. 1998).
Confidence Rating Activity Level Estimate Emission Factor EstimateHigh Derived from comprehen-
sive surveyDerived from comprehensive survey
Medium Based on estimates of aver-age plant activity level andnumber of plants or limitedsurvey
Derived from testing at a limited but reason-able number of few facilities believed to berepresentative of source category
Low Based on expert judgementor unpublished estimates
Derived from testing at only a few, possiblynon-representative facilities or from similarsource categories or foreign surveys wheredifferences in industry practices may be likely
EPA is aware that there are several thousand individual dioxin sources existing. Of these only10 % were characterized for their PCDD/PCDF releases. A total of 390 sources were analyzedfor PCDD/PCDF. For some of the source categories quite good coverage was achieved: forexample, all 104 kraft pulp mills were analyzed for PCDD/PCDF. A much smaller number facili-ties were tested in other sectors; e.g. only one of the 24 secondary copper smelters was ana-lyzed for stack emissions. So far, none of the ferrous metal processing plants is analyzed withinthe frame of the US inventory.
In addition, EPA makes clear that there are sources that have not been properly characterized sofar and which are not included in the present draft inventory. Sources such as landfill fires, back-yard trash burning, etc. can be very important (Lemieux et al. 1997). Of the chemical sourceswith releases in the product, the largest amount is associated with pentachlorophenol. However,the EPA inventory does not mention the PCDF present in PCB at all (Table 51).
The present findings were summarized by US-EPA as follows:
• The environmental releases of PCDD/PCDF in the United States occur from a wide variety ofsources, but are dominated by releases to the air from combustion sources.
• Insufficient measurement data are available to comprehensively estimate source releases ofPCDD/PCDF to water and land.
• Central estimates of dioxin releases to all environmental media were approximately 12 kgTEQ in 1987 and 3 kg TEQ in the year 1995. As a reflection of uncertainties in the estimatefor individual sources, PCDD/PCDF releases ranged from 5 kg to about 30 kg TEQ in 1987and from 1.2 kg TEQ to about 8 kg in 1995, respectively.
• Comparison of the central estimates reveals that there was approximately a 75 % reduction ofdioxin releases in the United States between 1997 and 1995. This reduction was primarilycaused by reductions in air emissions from municipal and medical waste incinerators.

72 Dioxin and Furan Inventories
May 1999 UNEP Chemicals
Table 50: USA: PCDD/PCDF inventory to the air; reference year 1995. All fluxes in g TEQ/a
Emission Source Central 1987 Central 1995 ChangesWaste Incineration
Municipal waste incineration 7,900 1,100 -86 %Hazardous waste incineration 5 5.7 +20 %Boilers/industrial furnaces 1 0.38 -60 %Medical waste/pathological incineration 2,470 477 -80 %Crematoria 0.24Sewage sludge incineration 6 6.0 0 %Tire combustion NEGPulp and paper mill sludge incineration eBiogas combustion **
Power/Energy GenerationVehicle fuel combustion leaded 32 NEG -99 %
unleaded 4 6.3 +50 %Diesel 26 33.5 +30 %
Wood combustion residential 90 62.5 -30 %industrial 27 29.1 +10 %
Coal combustion residential **industrial/utility 63 72.8 +16 %
Oil combustion residential **industrial/utility 16 9.3 -44 %
Other High Temperature SourcesCement kilns (haz. waste burning) 117 153 +30 %Cement kilns (non-haz. waste burning) 14 17.8 +30 %Asphalt mixing plants **Petroleum refining catalyst regeneration *Cigarette combustion 1 0.81 -20 %Carbon reactivation furnaces NEGKraft recovery boilers 2.3
Minimally Controlled/Uncontrolled Combust.Combustion of landfill gas in flares **Landfill fires **Accidental fires (structural) *Accidental fires (vehicles) **Forest, brush, and straw fires 170 208 +22 %Backyard trash burning **Uncontrolled combustion of PCB *
Metallurgical ProcessesFerrous metal smelting/refining− Sintering plants **− Coke production **− Electric arc furnaces **− Ferrous foundries **Non-ferrous metal smelting/refining− Secondary aluminum smelting 10 17.0− Secondary copper smelting 304 541 +78 %− Secondary lead smelting 1 1.63 +100 %Scrap electric wire recovery *Drum and barrel reclamation NEG
Chemical Manufacture/Processing Sources *

Dioxin and Furan Inventories 73
UNEP Chemicals May 1999
Total 12,000 2,745 -75 %Legend to Table 50:
e: Included within total for wood combustion - industrialNA Not applicable* Some evidence exists suggesting that this category is a source of PCDD/PCDF emissions.
However, insufficient data are available for making a quantitative or qualitative emissionestimate.
** Evidence exists suggesting that this category is a source of PCDD/PCDF emissions.Preliminary estimates of emissions for reference year 1995 have been made, but theconfidence in the emission factor estimates or activity level estimates are so low that theestimates are too uncertain to include in the inventory
Table 51: USA: PCDD/PCDF emissions to water, land and products; reference year 1995- Central estimates (US-EPA 1998)
Emission Source Water Land* ProductWaste IncinerationPower/Energy GenerationMinimally Controlled or Uncontrolled CombustionChemical Manufacture/Processing Sources
Bleached chemical wood pulp and paper mills 19.5 1.4 24.1Mono- to tetrachlorophenols NEG NEG NEGPentachlorophenol NEG NEG 25,000Chlorobenzene NEG NEG NEGChlorobiphenyls (leaks/spills) NEG NEG NAEtyhlene dichloride/vinyl chloride * NEG *Dioxazine dyes and pigments NEG NEG 0.362,4-Dichlorophenoxy acetic acid NEG NEG 18.4Non-incinerated municipal NA 207 7.0Tall oil based liquid soaps NEG NEG *
Biological Formation * * NAPhotochemical Formation * * NATotal 20 208 25,050
e: Included within total for wood combustion - industrialNA Not applicable* Some evidence exists suggesting that this category is a source of PCDD/PCDF
emissions. However, insufficient data are available for making a quantitative or qualitativeemission estimate.
** Evidence exists suggesting that this category is a source of PCDD/PCDF emissions.Preliminary estimates of emissions for reference year 1995 have been made, but theconfidence in the emission factor estimates or activity level estimates are so low that theestimates are too uncertain to include in the inventory
9.3 Others
For Central and South America, neither PCDD/PCDF emission data nor inventories are available.

74 Dioxin and Furan Inventories
May 1999 UNEP Chemicals
10 DIOXIN INVENTORIES IN ASIA AND THE PACIFIC
10.1 Australia
On behalf of Environment Australia’s Environment Protection Group (EPG), Pacific Air & Envi-ronment investigated the sources of PCDD/PCDF emissions in Australia. The report published inAugust 1998, aims at identifying, quantifying, and recommending technologies and strategies forthe reduction of risks to human health and the environment arising from the environmentalrelease of the twelve key POPs as identified by the United Nations Environment Programme(UNEP) Governing Council (EPG 1998).
The estimates made for Australia are not based on own emission or deposition measurements.The basic methodology used in the study has been to review international PCDD/PCDF inventorystudies, and then a list of industries that release PCDD/PCDF to the atmosphere was collated.The emission factors for each of the industries were compiled and compared, and a final emis-sion factor range was then assumed for Australia. Where possible, Australian source test datawas also reviewed, however reliance on international data was significant due to the general lackof domestic source test data.
As a result of this procedure, the emission estimates made in this study are subject to uncer-tainty. Activity data relating to each industry source was collected from a number of sources.Sometimes only limited data was available to make best estimates. However, for some sourcesno activity data was found and so emissions from these industries could not be determined.Using the emission factors and appropriate activity data emissions were quantified for eachindustry.
The emissions as quantified using the methodology above are presented in Table 52. Theseestimates are subject to considerable uncertainties. Based on the upper bound of each range,biomass combustion from prescribed burning and wild bushfires are potentially the most signifi-cant sources of PCDD/PCDF compounds in Australia. These two sources contribute approxi-mately 75 % to the total PCDD/PCDF emissions. The second major group of sources includes(in decreasing order of contribution):• Cement production;• Residential wood combustion;• Coal combustion (utility and industrial);• Sinter production;• Industrial wood combustion; and• Lime production.
If the fossil fuel and biomass combustion sources are grouped together, and the upper emissionbounds are used, they contribute about 50 % of the emissions from these six sources. Cementand lime production account for 40 %, with sinter production accounting for the remaining 10 %.All six sources contribute about 20 % to the total emission inventory (based on upper bound esti-mates). Therefore, these sources combined with prescribed burning and bushfire sourcesaccount for approximately 95 % of total emissions. The most significant non-industrial source isresidential wood burning, ranked second place. Other sources such as motor vehicles howeverare not considered significant, contributing less than 1 % to total emissions. Emissions fromresidential oil combustion are even less significant.
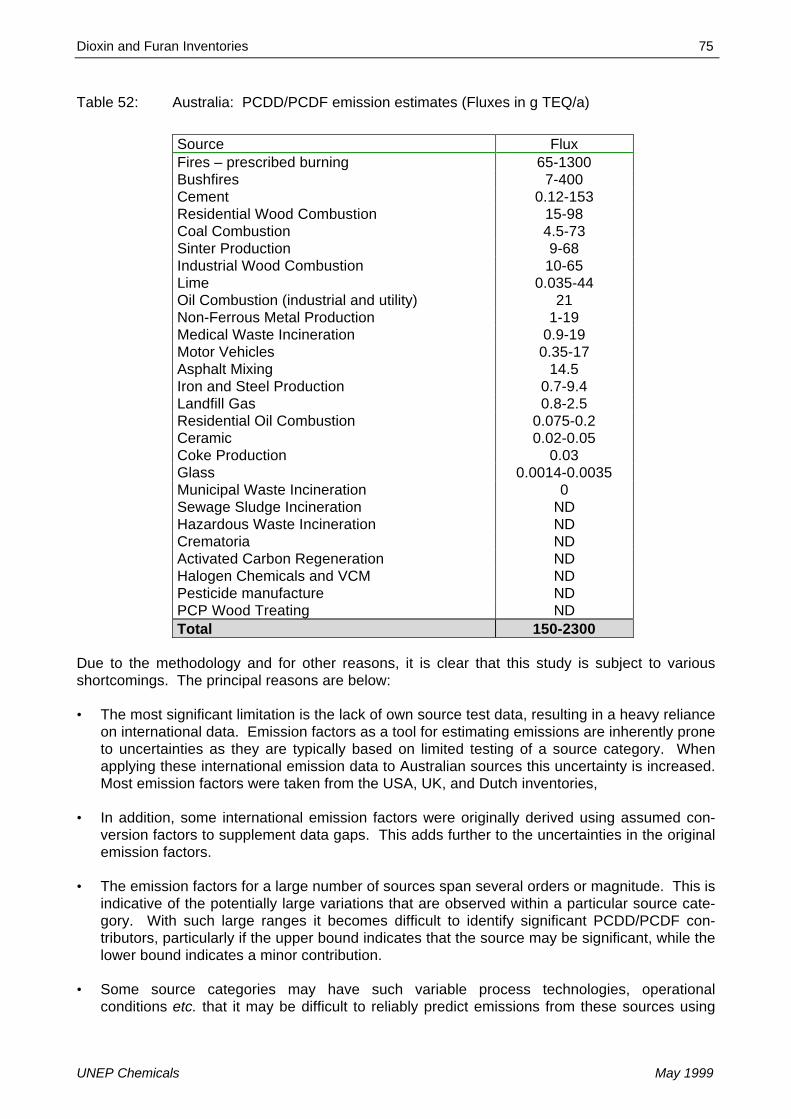
Dioxin and Furan Inventories 75
UNEP Chemicals May 1999
Table 52: Australia: PCDD/PCDF emission estimates (Fluxes in g TEQ/a)
Source FluxFires – prescribed burning 65-1300Bushfires 7-400Cement 0.12-153Residential Wood Combustion 15-98Coal Combustion 4.5-73Sinter Production 9-68Industrial Wood Combustion 10-65Lime 0.035-44Oil Combustion (industrial and utility) 21Non-Ferrous Metal Production 1-19Medical Waste Incineration 0.9-19Motor Vehicles 0.35-17Asphalt Mixing 14.5Iron and Steel Production 0.7-9.4Landfill Gas 0.8-2.5Residential Oil Combustion 0.075-0.2Ceramic 0.02-0.05Coke Production 0.03Glass 0.0014-0.0035Municipal Waste Incineration 0Sewage Sludge Incineration NDHazardous Waste Incineration NDCrematoria NDActivated Carbon Regeneration NDHalogen Chemicals and VCM NDPesticide manufacture NDPCP Wood Treating NDTotal 150-2300
Due to the methodology and for other reasons, it is clear that this study is subject to variousshortcomings. The principal reasons are below:
• The most significant limitation is the lack of own source test data, resulting in a heavy relianceon international data. Emission factors as a tool for estimating emissions are inherently proneto uncertainties as they are typically based on limited testing of a source category. Whenapplying these international emission data to Australian sources this uncertainty is increased.Most emission factors were taken from the USA, UK, and Dutch inventories,
• In addition, some international emission factors were originally derived using assumed con-version factors to supplement data gaps. This adds further to the uncertainties in the originalemission factors.
• The emission factors for a large number of sources span several orders or magnitude. This isindicative of the potentially large variations that are observed within a particular source cate-gory. With such large ranges it becomes difficult to identify significant PCDD/PCDF con-tributors, particularly if the upper bound indicates that the source may be significant, while thelower bound indicates a minor contribution.
• Some source categories may have such variable process technologies, operationalconditions etc. that it may be difficult to reliably predict emissions from these sources using
76 Dioxin and Furan Inventories
May 1999 UNEP Chemicals
limited data. Better characterization of industry will enable the identification of these industrytypes.
• Emission factors for many industries are based on test data taken during very short sampleperiods. The emission results are likely to be reflective of relatively good combustion andoperational practice and therefore may not be indicative of likely emissions during processupsets and/or abnormal operation.
• The authors did not find emission factors for glass and ceramic production and residentialsources and thus, added these sources as highly uncertain for their estimate. Nevertheless,there are existing data (UBA 1995).
• The Australian inventory used emissions from residential ‘wood burning stoves’ to bushfiresand the prescribed burning of agricultural waste and grasslands. Due to this lack of data, andconsidering the highly variable conditions under which these fires can burn emissions esti-mated from these sources are considered highly uncertain.
• Another limitation relates to the lack of activity data for a number of sources. This lack ofdata prevents the compilation of a comprehensive list of sources with emission estimates.Therefore, a complete picture of the Australian situation cannot be attained. Some of thesources not included are potentially significant contributors (such as waste incineration) andso their inclusion is important.
• An additional source that was identified as a potential PCDD/PCDF emitter is accidental fires.However, due to the lack of data it was not possible to derive emission estimates. This is asource that requires further consideration.
Considering these limitations, it is stressed that the emission estimates as determined by thisstudy are indicative only of the likely PCDD/PCDF releases by various sources in Australia. Theestimates have been developed based on the best information currently available. These esti-mates must be further refined as additional data is collected.
The most important recommendation made by the authors is the need for Australian data. Thus,it is important that PCDD/PCDF testing will be performed over a broad range of industries. Theprincipal focus should initially be on those industries identified in this study as being ‘potentially’significant. It is important that pertinent information such as feed or production rates, processtechnologies, operating conditions and pollution control equipment utilized be recorded with anytest data. Information such as operating temperatures of flue gas control systems should also beincluded. Additionally, it is important that all source testing is performed in line with the appropri-ate PCDD/PCDF source testing protocols.
As for any other country, there is a lack of activity data for a number of PCDD/PCDF sources. Itis considered desirable to have better estimates for bushfires, however, this may be a difficulttask. Testing of residential wood combustion equipment using various wood types is recom-mended to allow the development of more definitive emission factors
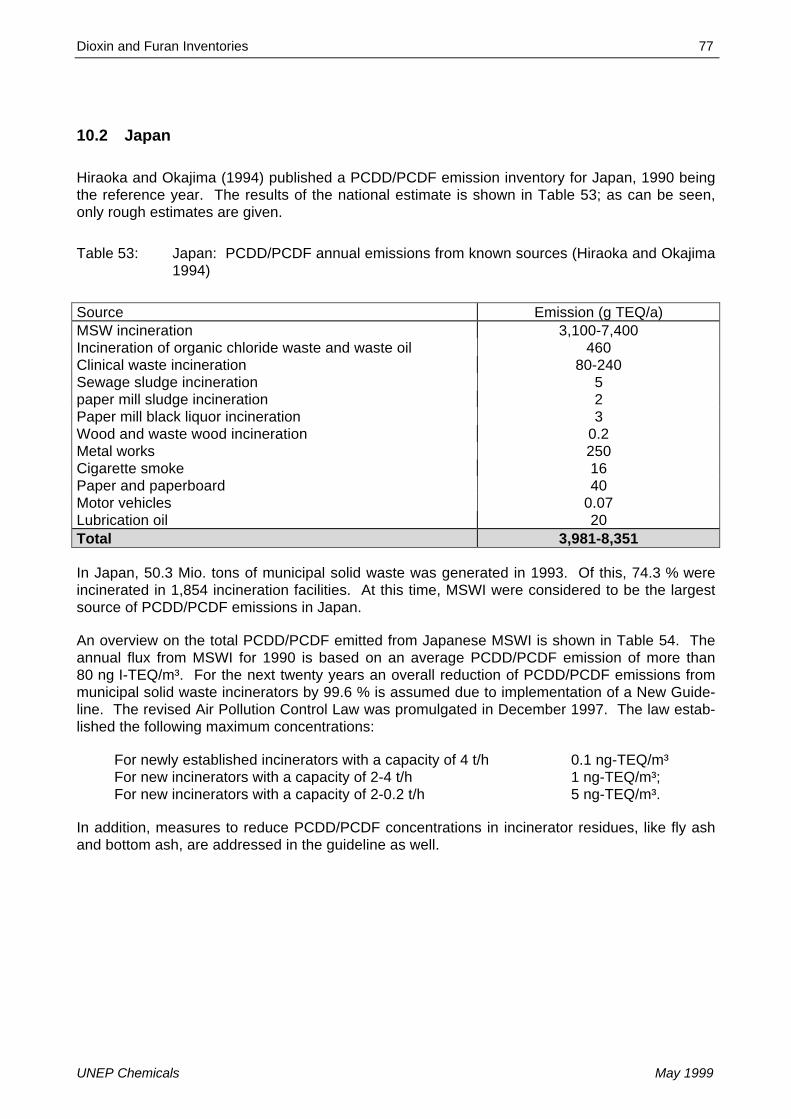
Dioxin and Furan Inventories 77
UNEP Chemicals May 1999
10.2 Japan
Hiraoka and Okajima (1994) published a PCDD/PCDF emission inventory for Japan, 1990 beingthe reference year. The results of the national estimate is shown in Table 53; as can be seen,only rough estimates are given.
Table 53: Japan: PCDD/PCDF annual emissions from known sources (Hiraoka and Okajima1994)
Source Emission (g TEQ/a)MSW incineration 3,100-7,400Incineration of organic chloride waste and waste oil 460Clinical waste incineration 80-240Sewage sludge incineration 5paper mill sludge incineration 2Paper mill black liquor incineration 3Wood and waste wood incineration 0.2Metal works 250Cigarette smoke 16Paper and paperboard 40Motor vehicles 0.07Lubrication oil 20Total 3,981-8,351
In Japan, 50.3 Mio. tons of municipal solid waste was generated in 1993. Of this, 74.3 % wereincinerated in 1,854 incineration facilities. At this time, MSWI were considered to be the largestsource of PCDD/PCDF emissions in Japan.
An overview on the total PCDD/PCDF emitted from Japanese MSWI is shown in Table 54. Theannual flux from MSWI for 1990 is based on an average PCDD/PCDF emission of more than80 ng I-TEQ/m³. For the next twenty years an overall reduction of PCDD/PCDF emissions frommunicipal solid waste incinerators by 99.6 % is assumed due to implementation of a New Guide-line. The revised Air Pollution Control Law was promulgated in December 1997. The law estab-lished the following maximum concentrations:
For newly established incinerators with a capacity of 4 t/h 0.1 ng-TEQ/m³For new incinerators with a capacity of 2-4 t/h 1 ng-TEQ/m³;For new incinerators with a capacity of 2-0.2 t/h 5 ng-TEQ/m³.
In addition, measures to reduce PCDD/PCDF concentrations in incinerator residues, like fly ashand bottom ash, are addressed in the guideline as well.

78 Dioxin and Furan Inventories
May 1999 UNEP Chemicals
Table 54: Time trend of PCDD/PCDF emissions from MSWI in Japan and prediction for thefuture
Year (Period) g I-TEQ/a Reduction Reference1990 3,100-7,400 Hiraoka and Okajima (1994)1996 4,300 35 % Ministry of Health and Welfare (1996)2001 590 86 % Prediction, Hiraoka et al. 19972006 100 98 % Prediction, Hiraoka et al. 19972016 20 99.6 % Prediction, Hiraoka et al. 1997
In November 1998, the Japanese Ministry of International Trade and Industry (MITI) published anew dioxin emission inventory for Japan (Table 55). The annual emissions for the reference year1998 were 5,300 g I-TEQ. These results are not much different from the estimate made byHiraoka in 1990. The new estimate is based on measured emissions and investigations voluntar-ily conducted by the industrial sectors following the advice of MITI. According to the inventory,municipal solid waste (MSW) incineration with 4,300 g I-TEQ/a is still the largest source contrib-uting to approximately 80 % of the total emission load. The sum of the other 27 sources investi-gated was around 1,000 g I-TEQ/a. In January 1997, there were still approximately 100 MSWIthat had emissions greater than 80 ng I-TEQ/m³. The emissions of these facilities alone contrib-uted to an annual load of 1,338 g I-TEQ. Immediate actions taken by the Ministry of Healthshould reduce these emissions to 94 g I-TEQ/a by September 1998. Hazardous waste incinera-tors were estimated to emit 460 g I-TEQ annually.
In addition to waste management processes, various industrial processes were investigated aswell. As can be seen from Table 55, among these processes, steel manufacturing (electric fur-nace) processes generated 190 g I-TEQ/a which amount to 3.5 % of the total. Sintering proc-esses generated 119 g I-TEQ/a, which is 2.2 % of the annual air input. Zinc recovery processeswere estimated to generate 34 g I-TEQ/a (0.6 %), and aluminum alloy manufacture produces16 g I-TEQ/a (0.3 %). In Japan, electric furnaces for steel manufacturing are facilities subject tospecial regulations within the Air Pollution Control Law. At present, for the sintering process insteel manufacture, zinc recovery and aluminum alloy manufacturing there are only industryguidelines to promote the control of PCDD/PCDF emissions on a voluntary basis. Special atten-tion was paid to the zinc recovering processes, which utilize PCDD/PCDF-contaminated fly ashfrom the steel manufacturing (electric furnace) as raw material. Although most PCDD/PCDFcontained in the fly ash are destroyed in the refining process, some contamination will not bedestroyed and some new PCDD/PCDF may be newly generated in the process. MITI estimatedan annual release of 34 g I-TEQ for the most recent year (Sakai 1999)
Table 55: Japan: PCDD/PCDF emissions to air – New estimates (MITI 1998)
Source Air Emissiong I-TEQ/a
Percent of Total
MSW incineration 4,300 80 %Hazardous waste incineration 460 9 %Medical waste incineration 80-240 1.6-4.6 %Sewage sludge incineration 5 ≈0 %Steel manufacturing (electric furnace) 190 3.5 %Steel manufacturing (sintering) 119 2.2 %Zinc recovery 34 0.6 %Aluminum alloy manufacturing: 16 0.3 %Total emission into air(form quantified sources)
5,300 100 %

Dioxin and Furan Inventories 79
UNEP Chemicals May 1999
10.3 New Zealand
A dioxin inventory will be available soon.
10.4 South Korea
So far, only emissions from municipal solid waste incinerators were evaluated. In Korea, elevenmunicipal solid waste incinerators are operated since 1986 to dispose of approximately 3 % ofthe total waste. It is planned to increase this share up to 20 % by the year 2001. As there is aserious concern on dioxin emissions from present MSWIs, a first survey on dioxin emissions andenvironmental levels was conducted (Chang et al. 1998).
In this first stage, flue gas samples were collected from all eleven MSWI in Korea according to amodified US-EPA Method 23. The stack emissions ranged 0.07-22.33 ng I-TEQ/m³. The totalannual emissions from this source category were estimated to be 10.81 g I-TEQ for the referenceyear 1997. Concentrations in fly ash were found to range from 0.37 to 21.0 ng I-TEQ/g resultingin an annual total of 127 g I-TEQ (Chang et al. 1998).

80 Dioxin and Furan Inventories
May 1999 UNEP Chemicals
11 GLOBAL EMISSION INVENTORY
Brzuzy and Hites (1995) studied PCDD/PCDF concentrations in soils to determine depositionalfluxes on a global basis. They collected soil samples from undisturbed locations as well as sedi-ments. For the determination of global fluxes, 107 soil samples globally were collected from sev-eral areas of the world covering the northern and the Southern hemispheres (Brzuzy and Hites1996). To determine fluxes, the authors established a correlation between the deposition ofPCDD/PCDF and various climatic zones of the world. The results of the flux determinations areshown in Table 56.
Table 56: Climate zones and average total fluxes of PCDD/PCDF to each zone (Brzuzy andHites 1996)
Climate Zone Area (1013 m²) Average Flux (ng m-²·a-1) 90 % ConfidenceLevel
Subtropical 0.4 610 90Temperate 2.4 280 52Polar/Boreal 2.2 41 6Tropical 5.5 25 7Arid 3.7 18 8Total Land Area 14.2
The highest average fluxes were determined for the subtropical and the temperate zones. Allhomologue profiles were found to be the same for all climatic zones (except for the boreal zonewhere a slightly more even distribution was found). Multiplication of the total fluxes with the areaof a given zone was used to calculate the total deposition rate. The total global deposition wasestimated to 12,500±1,300 kg PCDD/PCDF per year (Note: Totals for PCDD/PCDF not TEQ!).
Up to now, there is no data on depositional fluxes to oceans. Unpublished data and non-detectable PCDD/PCDF concentrations in Antarctica, indicate that the fluxes to remote oceanareas are approaching zero. The authors add another 610±1,500 kg PCDD/PCDF/a from theflow to the oceans. Thus, the total annual flux of PCDD/PCDF from deposition to land and watergives an annual total of 13,100±2,000 kg. The authors used a factor of 60 to convertPCDD/PCDF totals (=sum of homologues, Cl4-Cl8) into TEQ. In TEQ, the annual depositional fluxwould be 220±30 kg TEQ/a.
The same authors did a rough estimate on known dioxin emissions into air. Based on theassumptions as shown in Table 57, they calculated annual global emission to 3,000±600 kgPCDD/PCDF (total), equivalent to approximately 50±10 kg I-TEQ.

Dioxin and Furan Inventories 81
UNEP Chemicals May 1999
Table 57: Emission factors, global production rates, average emissions, and 90 % confi-dence level for major PCDD/PCDF sources; reference year 1990 (Brzuzy andHites 1996)
Emission Factorµg/kg
Production109 kg
Total Emissionkg/a
90 % Confidence
Waste incineration 13 87 1,130 450Biomass combustion 0.04 8700 350 140Ferrous metal production 0.5 700 350 140Cement kilns ( haz. Waste) 2.6 260 680 280Cement kilns (non-haz. W.) 0.2 1600 320 130Sec. Copper smelting 39 2 78 31Medical waste incineration 22 a 4 84 35Unleaded fuel combustion 320 b 3800 b 1 0.4Leaded fuel combustion 2800 b 3800 b 11 5Total (kg PCDD/PCDF/a) 3000 600Total (g I-TEQ/a) 50,000 10,000
a Emission factor and production data apply for USA onlyb emission factor units = pg/km; production units = km/a

82 Dioxin and Furan Inventories
May 1999 UNEP Chemicals
12 CONCLUSIONS FROM NATIONAL EMISSION INVENTORIES
Presently, there are PCDD/PCDF inventories available for 15 countries. All countries estimatedemissions to the air. A few attempts were made to quantify releases to water and to soil, e.g.Belgium, Canada, Denmark, Sweden, and the United States. The best estimates of the mostrecent evaluations (time period: 1993-1997) are summarized in Table 58. Based on these data,the central estimate of total annual PCDD/PCDF emissions is approximately 10,500 g I-TEQ.The lower estimate is around 8,300 g I-TEQ/a and the upper estimate approximately 36,000 gI-TEQ/a. A few countries that reported high PCDD/PCDF emissions drive this global number. Inparticular, Japan published large emissions from waste incinerators. It should be kept in mid thatthe Japanese inventory was established in 1994 when there was not much awareness aboutPCDD/PCDF emissions in this country. Once aware of the importance of municipal wasteincinerators as potential dioxin sources, the Japanese agencies started intensive measurementprograms and analyzed more than 1,900 MSWIs for PCDD/PCDF stack emissions. The mostrecent estimate gave even higher numbers of more than 5,000 g I-TEQ emitted in the year 1997.With the new guideline in place for municipal waste incinerators, it can be assumed that there willbe a strong downward trend for this source category in the near future. Nevertheless, based onmany measurements, the updated Japanese dioxin inventory estimates a total emission of 5,300g I-TEQ for the year 1998. This new number will add another 1,300 g I-TEQ to the “global”inventory.
A graphical sketch of the PCDD/PCDF emissions to air is given in Figure 3.
PCDD/PCDF Fluxes per Country
29 150
661
181 290 33439
873
112
3981
486
22 42
569
2744
0
500
1000
1500
2000
2500
3000
3500
4000
4500
A
AUS B
CH
CAN
D DK F
HU
N
JPN NL S
SR UK
USA
g I-T
EQ/a
Figure 3: PCDD/PCDF annual fluxes into air (g I-TEQ/a); reference year 1995.Total emissions from known sources = 10,500 g I-TEQ/a
The numbers generated in this survey can be compared with the EU Inventory and the TNOinventory which both cover broader geographical areas. The EU report covers 17 countries andestimates approximately 5,800 g I-TEQ/a to be emitted from known sources. However, the

Dioxin and Furan Inventories 83
UNEP Chemicals May 1999
authors assume a large margin of uncertainty and cannot exclude an upper estimate of approxi-mately 20,000 g I-TEQ being released into the air from the 17 European countries.
The TNO study is less specific to PCDD/PCDF sources and estimates an annual release of1,300 g I-TEQ for the reference year 1990. Finally, based on relatively few assumptions and nodetailed evaluation of emission inventories, Brzuzy and Hites estimate a global PCDD/PCDFrelease of 50,000 g I-TEQ/a.
Table 58: Global PCDD/PCDF emission inventory to air from known sources; based onexisting national inventories; reference year 1995* Central estimates or minimum concentrations
Annual Emissions *g I-TEQ/a
Additional Data and Remarks
Austria A 29Australia AUS 150 2300 Upper estimateBelgium B 661Switzerland CH 181Canada CAN 290Denmark DK 39 50.05 Upper estimateFrance F 873 674-2737 Range: Min-MaxGermany D 334Hungary HUN 112Japan JPN 3,981 8436 Upper estimateThe Netherlands NL 486 58 Prediction for 2000Sweden S 22 88 Upper estimateSlovak Republic SR 42United Kingdom UK 569 1,099 Upper estimateUnited States of America USA 2,744 1200-7900 Range: Min-MaxAnnual Flux 10,514 28,615 MaximumKorea 10.8 MSWI onlyEU Inventory 5,750 1,300-20,00017 Countries, lower
and upper estimatesTNO Inventory 11,300 38 Countries, refer-
ence year 1990Brzuzy and Hites 50,000 Global
The split of the major categories of PCDD/PCDF source sectors per country to the overall emis-sion of 10,500 g I-TEQ/a is given in Table 59. The percent share of the major groups per countryis shown in Table 60. It can be seen that the waste incineration is still the major emitter withalmost 70 %. The majority of PCDD/PCDF emissions from this sector are due to the municipal(and to a lesser extent to the hazardous) waste incinerators located in Japan. This source sectoralone is responsible for almost 34 % of the total PCDD/PCDF inventory to air from identifiedsources so far. In addition, Table 60 shows that in countries with stringent regulation ofPCDD/PCDF emissions from municipal and hazardous waste incineration, e.g. the memberstates of the European Union that started legislation in the early 1990, incineration of waste is aminor contributor. A clearer picture of this finding can be seen in Figure 2 (page 4). It should bementioned as well that in Australia there is no municipal waste incinerator at all and in othercountries, landfilling is still the preferred option for waste disposal.


Dioxin and Furan Inventories 85
UNEP Chemicals May 1999
Table 59: PCDD/PCDF emissions per sector and country. Reference year approximately 1995. Fluxes in g I-TEQ/a
A AUS B CH CAN D DK F HUN JPN NL S SR UK USA Global FluxIron and Steel 10.36 10.0 59.6 9.2 53.6 181 7.63 420 12.2 250 26 2.01 7.83 34 1,083Non-ferrous Metals 1.0 107 1.9 0.2 91.6 27 0.7 4 4.43 1.17 5.0 560 804Power Plants 2.31 4.6 5.3 2 13.1 16.7 6.82 6.4 57Ind. Combust. Plants 1.5 35.5 7 1.6 15.6 6.2 23 2.7 111 204Small Comb. Units 16.7 15.1 122 27.4 42.7 7.1 3.17 27.2 4.25 25.4 62.5 354Waste Incineration 0.179 1.70 303 127 156 32.1 25.3 402 46.5 3645 402 3.01 26 483 1589 7,241Road Transport 0 0.35 1.7 0.9 8.7 4.8 0.2 1 0.27 0.07 7 0.88 0.35 1.0 39.8 67Mineral Production 0.18 54.2 0.7 2.8 2.4 0.08 2.86 0.04 0.3 171 234Others 0.024 86.5 4.66 12.7 5.7 2.9 0.26 12.32 86.2 27.5 4.82 0.19 14.6 211 470Sum 28.8 150 661 181 290 334 38.7 873 112 3981 486 22.3 42.4 569 2744 10,514
Table 60: PCDD/PCDF emissions per sector and country in percent of the total annual emission (10,514 g I-TEQ/a). Reference yearapproximately 1995
A AUS B CH CAN D DK F HUN JPN NL S SR UK USA Global FluxIron and Steel 0.1% 0.1% 0.6% 0.1% 0.5% 1.7% 0.1% 4.0% 0.1% 2.4% 0.2% 0.0% 0.1% 0.3% 0.0% 10%Non-ferrous Metals 0.0% 0.0% 1.0% 0.0% 0.0% 0.9% 0.0% 0.3% 0.0% 0.0% 0.0% 0.0% 0.0% 0.0% 5.3% 8%Power Plants 0.0% 0.0% 0.0% 0.0% 0.0% 0.1% 0.0% 0.0% 0.1% 0.0% 0.2% 0.0% 0.1% 0.1% 0.0% 1%Ind. Combust. Plants 0.0% 0.3% 0.1% 0.0% 0.1% 0.1% 0.0% 0.2% 0.0% 0.0% 0.0% 0.0% 0.0% 0.0% 1.1% 2%Small Comb. Units 0.2% 0.1% 1.2% 0.3% 0.4% 0.1% 0.0% 0.0% 0.3% 0.0% 0.0% 0.0% 0.0% 0.2% 0.6% 3%Waste Incineration 0.0% 0.0% 2.9% 1.2% 1.5% 0.3% 0.2% 3.8% 0.4% 34.7% 3.8% 0.0% 0.2% 4.6% 15.1% 69%Road Transport 0.0% 0.0% 0.0% 0.0% 0.1% 0.0% 0.0% 0.0% 0.0% 0.0% 0.1% 0.0% 0.0% 0.0% 0.4% 1%Mineral Production 0.0% 0.0% 0.5% 0.0% 0.0% 0.0% 0.0% 0.0% 0.0% 0.0% 0.0% 0.0% 0.0% 0.0% 1.6% 2%Others 0.0% 0.8% 0.0% 0.1% 0.1% 0.0% 0.0% 0.0% 0.1% 0.8% 0.3% 0.0% 0.0% 0.1% 2.0% 4%Sum 0.3% 1.4% 6.3% 1.7% 2.8% 3.2% 0.4% 8.3% 1.1% 37.9% 4.6% 0.2% 0.4% 5.4% 26.1% 100%
Country codes are as follows:A Austria AUS Australia B Belgium CH Switzerland CAN Canada D GermanyDK Denmark F France HUN Hungary JPN Japan NL Netherlands S SwedenSR Slovak Republic UK United Kingdom USA United States of America

86 Dioxin and Furan Inventories
May 1999 UNEP Chemicals
The present situation of PCDD/PCDF inventories in terms of geographic coverage and methodsused can be summarized as follows:
• The present number of national PCDD/PCDF emission inventories is very small (15 based onnational data).
• Most data is available for countries from Western Europe and Northern America. However,the inventory from the United States is still in a draft stage. From Asia, there is only oneinventory for Japan covering a few sectors and the estimate for MSWIs for South Korea.From the Southern Hemisphere, so far, only Australia has estimated annual emissions basedon emission factors from the literature. From Africa, Central and Southern America, there areno data at all.
• Some countries have based their inventories on emission factors generated outside the owncountry. For some sources, there are no emission factors determined, e.g. open garbageburning, landfill fires, etc.
• Most inventories cover emissions to air only; there are few estimates on emissions to waterand land or with products. If existing, the estimates have a high degree of uncertainty.
From the existing inventories the following conclusions can be drawn:
• Amongst the source sectors, the best coverage exists for municipal solid waste incinerationfor both stack emission measurements and activity rates. This sector also undergoes themost dramatic changes in technology and thus, emission factors and PCDD/PCDF emissionschange rapidly. As a consequence, strong downward trends are recognized in countries withmodern technology or stringent legislation.
• The sector of hazardous waste incineration is relatively homogeneous and does not present amajor source in any country. However, it should be taken into account that the such evalua-tion is based on data from industrialized countries and such results not necessarily apply forless developed countries.
• There is only limited information available from the iron and steel-producing sector. SomeEuropean countries have identified this sector as the most major contributor to national dioxininventories. The United States and Canada are aware of these sources, but so far, nomeasurements have been performed. Here, generation of reliable data is urgently required.
• From the few examples on dioxin and furan emissions to water, land and with products it canbe concluded that emissions to water only cover wastewaters from the pulp and paper indus-try. Contamination in products largely is limited to pentachlorophenol (PCP) and the PCDF inpolychlorinated biphenyls (PCB) are being ignored.
• For some countries, the inventory should be updated to improve estimates of the presentsituation, especially where more stringent regulation has been established since the currentinventory.
• Presently there exists no harmonized methods for generating and evaluating data for nationalPCDD/PCDF inventories. In addition, the coverage of sources varies from country to country.Some countries such as the United Kingdom and the United States to a certain extent includereleases of PCDD/PCDF to landfills and land. Some countries give ranges of lower andupper estimates whereas other countries use mean/median values to calculate the annualdioxin emissions for a given source. Harmonization of data acquisition and evaluation is anobvious need and will help to better compare national dioxin inventories.
Dioxin and Furan Inventories 87
UNEP Chemicals May 1999
• Finally, harmonization of protocols for sampling stack emissions, water, soil, etc. and for ana-lyzing these samples is highly recommended.
The present report should only be seen as a snapshot on PCDD/PCDF emissions and estimatesof total releases of these compounds into the environment. Only major sectors of PCDD/PCDFreleases into the air were identified. Further, PCDD/PCDF sources may exist which have not yetbeen identified nor quantified, especially in geographic areas with no existing data.
Presently, the coverage is not sufficient to estimate accurately global emissions of PCDD/PCDF.Nevertheless, there are several efforts underway to identify dioxin sources better in parts of theworld where so far, there is no information available. In addition, existing inventories will beupdated, as it is obvious that measures were taken by many countries to reduce emissions ofPCDD/PCDF into the environment. For some industrialized countries in Europe and NorthAmerica, strong downward trends were observed during the last years. Implementation of dioxinabatement technologies in industrial sectors and advanced combustion technology will help toreinforce such trends.
88 Dioxin and Furan Inventories
May 1999 UNEP Chemicals
13 REFERENCES
AbfKlärV (1992): Klärschlammverordnung (AbfKlärV) vom 15.04.1992. Bundesgesetzblatt,Jahrgang 1992, Teil 1, 912-934 (Sewage Sludge Ordinance, Germany)
Alcock R., R. Genmill, and K.C. Jones (1998): An Updated UK PCDD/F Atmospheric EmissionInventory Based on Recent Emissions Measurement Programme. Organohalogen Compd. 36,105-108
Adème (1999): Homepage of the Ministry for Regional and National Development and the Envi-ronment, France: http://www.environnement.gouv.fr/actua/cominfos/dosdir/DIRPPR/dioxine/
Anonymous (1995): A New Guideline of 1997, Japan.
Austria (1993): Verordnung der o.ö. Landesregierung von 22. Februar 1993 über dieAusbringung von Klärschlamm, Müll- und Klärschlammkompost auf Böden (O.ö. Klärschlamm-,Müll- und Klärschlammverordnung. Oberösterreich. LGBl. Nr. 21/1993 and1. Novelle der NÖ Klärschlammverordnung (NÖ Klärschlammverordnung). LGBl. 6160/2-0,80/94
Austria (1994): Verordnung des Bundesministers für Land- und Forstwirtschaft, mit der Bestim-mungen zur Durchführung des Düngemittelgesetzes erlassen werden (Düngemittelverordnung1994). BGBl. Nr. 1007/1994
Austria (1997a): Verordnung: Begrenzung der Emission von luftverunreinigenden Stoffen ausAnlagen zum Sintern von Eisenerzen. BGBl. II, Jahrgang 1997, 20.01.1997, Nr. 163 (Ordinancefor sinter plants)
Austria (1997b): Verordnung: Begrenzung der Emission von luftverunreinigenden Stoffen ausAnlagen zur Erzeugung von Eisen und Stahl. BGBl. Teil II, Jahrgang 1997, 17.06.1997, Nr. 160(Ordinance for iron and steel plants)
BGA/UBA (1993): Dioxine und Furane - ihr Einfluß auf Umwelt und Gesundheit. Erste Auswer-tung des 2. Internationalen Dioxin-Symposium und der fachöffentlichen Anhörung des Bundes-gesundheitsamtes und des Umweltbundesamtes in Berlin vom 09. bis 13.11.1992. Bundesge-sundheitsblatt Sonderheft/93 (36. Jahrgang, Mai1993)
BLAG (1992): Umweltpolitik: Bericht der Bund/Länder-Arbeitsgruppe DIOXINE. Rechtsnormen,Richtwerte, Handlungsempfehlungen, Meßprogramme, Meßwerte und Forschungsprogramme.Bundesminister für Umwelt, Naturschutz und Reaktorsicherheit (Hrsg.), Bonn, Januar 1992
BLAG (1993): Umweltpolitik: 2. Bericht der Bund/Länder-Arbeitsgrupe DIOXINE. November1993, Bonn
BImSchV (1990): 17. Verordnung zur Durchführung des Bundesimmissionsschutzgesetzes vom23.1.1990 (Verordnung über Verbrennungsanlagen für Abfälle und ähnliche brennbare Stoffe -17. BImSchV). Bundesgesetzblatt Teil I, Jahrgang 1990, 2832. (Ordinance for wasteincinerators, Germany)

Dioxin and Furan Inventories 89
UNEP Chemicals May 1999
BImSchV (1992): 19. Verordnung zur Durchführung des Bundesimmissionsschutzgesetzes vom24.07.1992 (Verordnung über Chlor- und Bromverbindungen als Kraftstoffzusatz-19. BImSchV).Bundesgesetzblatt Teil 1, Jahrgang 1992, 75 (Ordinance on ban of halogenated scavengers,Germany)
BImSchV (1997): 27. Verordnung zur Durchführung des Bundes-Immissionsschutzgesetzes(Verordnung über Anlagen zur Feuerbestattung - 27. BImSchV) vom 19. März 1997. BGBl. I, S.545. (Ordinance for crematories)
Brzuzy L.P. and R.A. Hites (1995): Estimating the Atmospheric Deposition of PolychlorinatedDibenzo-p-dioxins and Dibenzofurans from Soils. Environ. Sci. Technol. 29, 2090-2098
Brzuzy L.P. and R.A Hites (1996): Global Mass Balance for Polychlorinated Dibenzo-p-dioxinsand Dibenzofurans. Environ. Sci. Technol. 30, 1791-1804
BUWAL (1997): Dioxine und Furane - Standortbestimmung, Beurteilungsgrundlagen, Maß-nahmen. Schriftenreihe Umwelt Nr. 290 Umweltgefährdende Stoffe. Bundesamt für Umwelt,Wald und Landschaft (BUWAL), Bern, Switzerland, 1997
Chang Y.-S., J.-E. Oh, and D.-C. Sin (1998): The Evaluation of Emission and EnvironmentalLevels of PCDD/Fs in Korea. Organohalogen Compd. 36, 11-15
ChemVerbotsV (1996): Verordnung über Verbote und Beschränkungen des Inverkehrbringensgefährlicher Stoffe, Zubereitungen und Erzeugnisse nach dem Chemikaliengesetz (Chemikalien-Verbotsverordnung - ChemVerbotsV) vom 19. Juli 1996. BGBl. I 1996, S. 1151, BGBl. I S. 1498(Chemical’s Law)
Cleverly D., J. Schaum, D. Winters, G. Schweer, and K. O’Rourke (1998): The Inventory ofSources of Dioxin in the United States. Organohalogen Compd. 36, 1-6
De Fré R. and M. Wewers (1995): Opgemaakt in Opdracht van de Vlaamse Milieumaatschappij(Ordernummer: 941055). Stofdossier Dioxines – Eindrapport. MIE-DI-9459. January 1995
de Koning J.. A.A. Sein. L.M. Troost, and H.J. Bremmer (1994): Sources of Dioxin Emissions inthe Netherlands. Organohalogen Compd. 14, 315-318. Environmental Protection Agency (eds.),Vienna, Austria
de Wit C. (1995): Swedish Dioxin Survey. Preliminary data. Solna, Sweden
Eduljee G. and P. Dyke (1996): An Updated Inventory of Potential PCDD and PCDF EmissionSources in the UK. Sci. Tot. Environ. 177, 303-321
Environment Agency (1997): A Review of Dioxin Releases to Land and Water in the UK. Envi-ronment Agency, Research and Development Publication 3, ISBN I 873160 40 2
Environment Canada and the Federal/Provincial Task Force (1999): Dioxins and Furans andHexachlorobenzene. Inventory of Releases. Prepared by Environment Canada and the Fed-eral/Provincial Task Force on Dioxins and Furans for the Federal Provincial Advisory Committeefor the Canadian Environmental Protection Act (CEPA-FPAC), January 1999
EPG (1998): Sources of Dioxins and Furans in Australia: Air Emissions. Study prepared byPacific Air & Environment for Environment Australia’s Environment Protection Group (EPG).Environment Australia, August 5, 1998

90 Dioxin and Furan Inventories
May 1999 UNEP Chemicals
Esposito M.P., T.O. Tiernan, and F.E. Dryden (1980): Dioxins. EPA/600/2-80-197. WashingtonD.C.
Fiedler H. (1995): EPA DIOXIN-Reassessment: Implications for Germany. OrganohalogenCompd. 22, 209-228, ECO-Informa Press, Bayreuth
Fiedler H. (1996a): Dioxine in Produkten und Abfällen. In: Dioxine-Vorkommen, Minderungs-maßnahmen, Meßtechnik. VDI Band 1298, 231-247. VDI-Verlag, Düsseldorf
Fiedler, H. (1996b): Sources of PCDD/PCDF and Impact on the Environment. Chemosphere 32,55-64
Fiedler H. (1998) Thermal Formation of PCDD/PCDF - A Survey. Environ. Eng. Sci. 15/1, 49-58
Fiedler H., O. Hutzinger, C. Timms (1990): Dioxins: Sources of Environmental Load and HumanExposure. Toxicol. Environ. Chem. 29, 157-234
FHH (1995) Dioxin-Bilanz für Hamburg. O. Hutzinger, H. Fiedler, C. Lau, G. Rippen, U.Blotenberg, H. Wesp, S. Sievers, P. Friesel, B. Gras, T. Reich, U. Schacht, and R. Schwörer.Hamburger Umweltberichte 51/95. Freie und Hansestadt Hamburg, Umweltbehörde (Eds.).Hamburg September 1995
Friesel P., S. Sievers, H. Fiedler, B. Gras, C. Lau, T. Reich, G. Rippen, U. Schacht, and F.Vahrenholt (1996): Dioxin Mass Balance for the City of Hamburg, Germany. Part 4: Trends ofPCDD/PCDF Fluxes. Organohalogen Compd. 28, 89-94
Hiraoka M. and S. Okajima (1994): Source Control Technologies in MSW Incineration Plants.Organohalogen Compd. 19, 275-291
Hiraoka M., S. Sakai, T. Sakagawa, and Y. Hata (1997): New Guideline for Controlling Poly-chlorinated Dibenzo-p-dioxins and Dibenzofurans (PCDDs/PCDFs) in MSW Management inJapan. Organohalogen Compd. 31, 446-453
HMIP (1995): A Review of Dioxin Emissions in the UK. Report DoE/HMIP/PR/95/004. Her Maj-esty’s Inspectorate of Pollution
Holoubek I., J. Easlavsky, A. Kocan, B. Pokorny, J. Lemieek, J. Hajlova, V. Kocourek, M.Matouek, J. Pacyna, and D. Thomas (1993): Compilation of Emission Factors for PersistentOrganic Pollutants. A Case Study of Emission Estimates in the Czech and Slovak Republics.Prepared for External Affairs Canada, Ottawa, ON, March 1993
Hutzinger O. and H. Fiedler (1993): From Source to Exposure: Some Open Questions Chemos-phere 27, 121-129.
IARC (1997): Polychlorinated Dibenzo-para-Dioxins and Polychlorinated Dibenzofurans. Sum-mary of Data Reported and Evaluation. IARC Monographs Vol. 69 (666 pages), IARC Press,Lyon, 1997
Ifeu (1998): Ermittlung von Emissionen und Minderungsmaßnahmen für persistente organischeSchadstoffe in der Bundesrepublik Deutschland. Stoffband A: Polychlorierte Dibenzodioxineund –furane (PCDD/F) und polycyclische aromatische Kohlenwasserstoffe (PAH). Ifeu-Institut,Heidelberg, März 1998. Forschungsvorhaben Nr. 104 02 365. Im Auftrag desUmweltbundesamtes, Berlin
Johnke B. (1997): Unpublished data. Federal Environmental Agency, Berlin, Germany

Dioxin and Furan Inventories 91
UNEP Chemicals May 1999
Johnke B. (1998): Situation and Aspects of Waste Incineration in Germany. UTA Technology &Environment 2/98, 98-103 (GIT Verlag, Darmstadt)
KGI (1997): Background Paper on Emissions of Metals and Persistent Organic Pollutants Neces-sary in Preparation of International Agreements. Institute of Environmental Protection, ExpertOffice, Budapest, December 1997
Kocan A. (1994): Air Pollution by Emissions of Persistent Organic Pollutants in the SlovakRepublic - Summary. Institute of Preventive and Clinical Medicine, Bratislava, Slovak Republic,November 1994
Kutz F.W., D.G. Barnes, E.W. Bretthauer, D.P. Bottimore, H. Greim (1990): The InternationalToxicity Equivalency Factor (I-TEF) Method for Estimating Risks Associated with Exposures toComplex Mixtures of Dioxins and Related Compounds. Toxicol. Environ. Chem. 26, 99-110.
Lau C., H. Fiedler, O. Hutzinger, G. Rippen, H.F. Wesp, S. Sievers, P. Friesel, U. Schacht, B.Gras, T. Reich, and F. Vahrenholt (1996): Dioxin Mass Balance for the City of Hamburg, Ger-many. Part 1: Objective and Emission Inventory. Organohalogen Compd. 28, 83-88
Leidraad bodemsanering (1988): Prüftabelle für Boden und Grundwasser, afl. 4 November 1988Staatsuitgeverij´s - Gravenhage. In: Landesamt für Wasser und Abfall Nordrhein-West-falen(1989): Materialien zur Ermittlung und Sanierung von Altlasten, Band 2
Lemieux P.M. (1997): Evaluation of Emissions from the Open Burning of Household Waste inBarrels. Volume 1 – Technical Report. EPA-600/R-97-134a, November 1997
LUA (1997): Identification of Relevant Industrial Sources of Dioxins and Furans in Europe. Mate-rialien No. 43. Landesumweltamt Nordrhein-Westfalen, Essen, 1997
Ministry of Environment and Energy (1997): Dioxins, Sources, Levels and Exposures inDenmark. Working Document No. 50, Ministry of Environment and Energy, Denkmark; DanishEnvironmental Protection Agency 1997
MITI (1998): Advisory Committee on Dioxins Measures, Environmental Protection and IndustrialLocation Bureau, Ministry of International Trade and Industry (MITI): The second interim report,November 1998
NATO/CCMS (1988a): International Toxicity Equivalency Factor (I-TEF) Method of Risk Assess-ment for Complex Mixtures of Dioxins and Related Compounds. Pilot Study on InternationalInformation Exchange on Dioxins and Related Compounds, Report Number 176, August 1988,North Atlantic Treaty Organization, Committee on Challenges of Modern Society
NATO/CCMS (1988b): Hutzinger O. und H. Fiedler: Emissions of Dioxins and Related Com-pounds from Combustion and Incineration Sources. Pilot Study on International Information Ex-change on Dioxins and Related Compounds, NATO/CCMS Report No. 172Öberg L.G., B. Glas, S.E. Swanson, C. Rappe, and K.G. Paul (1990): Peroxidase-Catalyzed Oxi-dation of Chlorophenols to Polychlorinated Dibenzo-p-dioxins and Dibenzofurans. Arch. Environ.Contam. Toxicol. 19, 930-938
Parma Z., J. Vosta. J. Horejs, J.M. Pacyna, and D. Thomas (1995): Atmospheric EmissionInventory Guidelines for Persistent Organic Pollutants (POPs). Prague, the Czech Republic, July1995
Quaß U., M.W. Fermann, and G. Bröker (1998): Steps Towards an European Emission Inven-tory. Organohalogen Compd. 36, 7-10
92 Dioxin and Furan Inventories
May 1999 UNEP Chemicals
Sakai S., M. Hiraoka, M. Ishida, R. Shiji, P. Nie, and N. Nakamura (1997): A Study of TotalPCDDs/PCDFs Release to Environment from MSWI. Organohalogen Compd. 31, 376-381
She J. and H. Hagenmaier (1994): PCDDs and PCDFs with Chloralkali Pattern in Soil andSludge Samples. Organohalogen Compd. 20, 261-264
UBA (1997): The European Atmospheric Emission Inventory of Heavy Metals and PersistentOrganic Pollutants for 1990. TNO Institute of Environmental Sciences, Energy and Process Inno-vation. Forschungsbericht 104 02 672/03 im Auftrag des Umweltbundesamtes Berlin, June 1997
UBAVIE (1996): http://www.ubavie.gv.at/info/corin94e/pops.htm. Copyright: Federal Environ-ment Agency, Vienna, Austria
US-EPA (1998): The Inventory of Sources of Dioxin in the United States. External Review Draft,451 p. EPA/600/P-98/002Aa. U.S. Environmental Protection Agency, Exposure Analysis andRisk Characterization Group, Washington, D.C.
van Leeuwen F.X.R. and M. Younes (1998): WHO Revises the Tolerable Daily Intake (TDI) forDioxins. Organohalogen Compd. 38, 295-298
Wagner H.C., K.-W. Schramm, O. Hutzinger (1990): Biogenes polychloriertes Dioxin aus Tri-chlorphenol. UWSF - Z. Umweltchem. Ökotox. 2, 63-65
WHO - World Health Organization (1998): WHO Experts Re-evaluate Health Risks from Dioxins.Press Release WHO/45, 3 June 1998
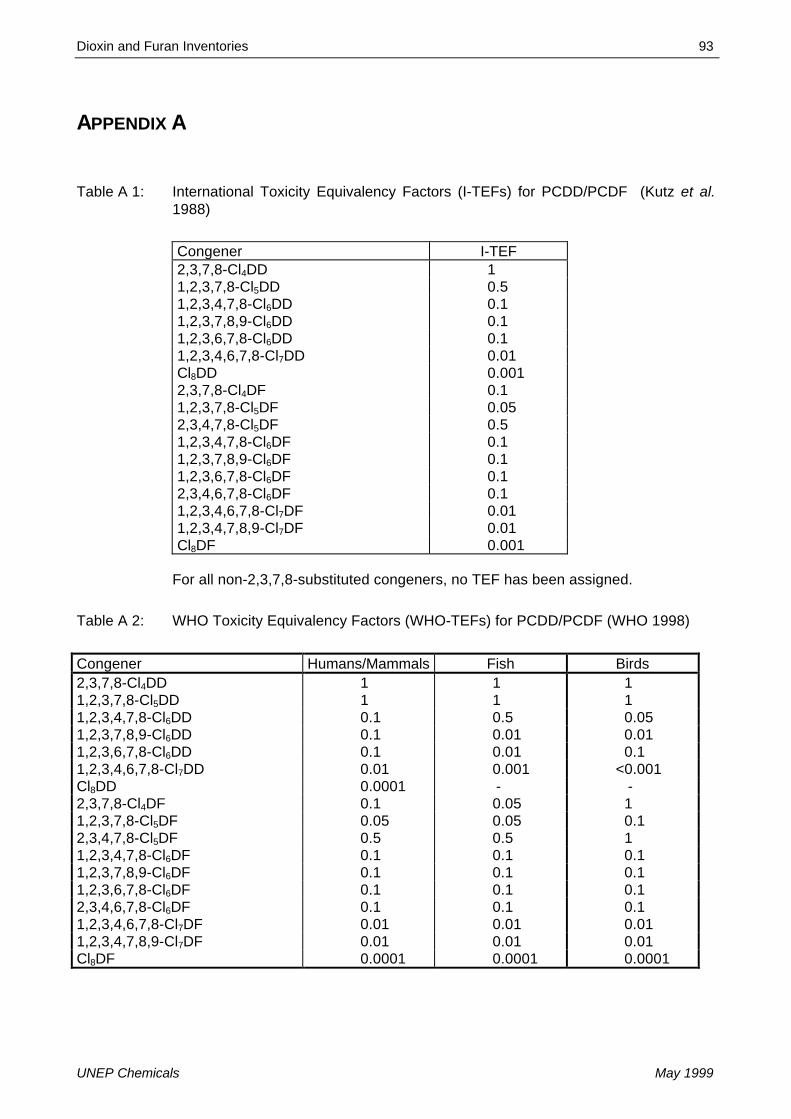
Dioxin and Furan Inventories 93
UNEP Chemicals May 1999
APPENDIX A
Table A 1: International Toxicity Equivalency Factors (I-TEFs) for PCDD/PCDF (Kutz et al.1988)
Congener I-TEF2,3,7,8-Cl4DD 11,2,3,7,8-Cl5DD 0.51,2,3,4,7,8-Cl6DD 0.11,2,3,7,8,9-Cl6DD 0.11,2,3,6,7,8-Cl6DD 0.11,2,3,4,6,7,8-Cl7DD 0.01Cl8DD 0.0012,3,7,8-Cl4DF 0.11,2,3,7,8-Cl5DF 0.052,3,4,7,8-Cl5DF 0.51,2,3,4,7,8-Cl6DF 0.11,2,3,7,8,9-Cl6DF 0.11,2,3,6,7,8-Cl6DF 0.12,3,4,6,7,8-Cl6DF 0.11,2,3,4,6,7,8-Cl7DF 0.011,2,3,4,7,8,9-Cl7DF 0.01Cl8DF 0.001
For all non-2,3,7,8-substituted congeners, no TEF has been assigned.
Table A 2: WHO Toxicity Equivalency Factors (WHO-TEFs) for PCDD/PCDF (WHO 1998)
Congener Humans/Mammals Fish Birds2,3,7,8-Cl4DD 1 1 11,2,3,7,8-Cl5DD 1 1 11,2,3,4,7,8-Cl6DD 0.1 0.5 0.051,2,3,7,8,9-Cl6DD 0.1 0.01 0.011,2,3,6,7,8-Cl6DD 0.1 0.01 0.11,2,3,4,6,7,8-Cl7DD 0.01 0.001 <0.001Cl8DD 0.0001 - -2,3,7,8-Cl4DF 0.1 0.05 11,2,3,7,8-Cl5DF 0.05 0.05 0.12,3,4,7,8-Cl5DF 0.5 0.5 11,2,3,4,7,8-Cl6DF 0.1 0.1 0.11,2,3,7,8,9-Cl6DF 0.1 0.1 0.11,2,3,6,7,8-Cl6DF 0.1 0.1 0.12,3,4,6,7,8-Cl6DF 0.1 0.1 0.11,2,3,4,6,7,8-Cl7DF 0.01 0.01 0.011,2,3,4,7,8,9-Cl7DF 0.01 0.01 0.01Cl8DF 0.0001 0.0001 0.0001

94 Dioxin and Furan Inventories
May 1999 UNEP Chemicals
Table A 3: Toxicity Equivalency Factors (TEFs) for non-ortho and mono-ortho substitutedPCB (WHO 1997)
PCB Substitution IUPAC WHO-TEF Congener No. Humans Fish Birds Non-ortho 3,3',4,4'- 77 0.0001 0.0005 0.1 substituted: 3,4,4’,5- 81 0.0001 0.0001 0.05 3,3',4,4',5- 126 0.1 0.005 0.1 3,3',4,4',5,5'- 169 0.01 0.00005 0.001 Mono-ortho 2,3,3',4,4'- 105 0.0001 <0.000005 0.0001 substituted: 2,3,4,4',5- 114 0.0005 <0.000005 0.0001 2,3',4,4',5- 118 0.0001 <0.000005 0.00001 2',3,4,4',5- 123 0.0001 <0.000005 0.00001 2,3,3',4,4',5- 156 0.0005 <0.000005 0.0001 2,3,3',4,4',5'- 157 0.0005 <0.000005 0.0001 2,3',4,4',5,5'- 167 0.00001 <0.000005 0.00001 2,3,3',4,4',5,- 189 0.0001 <0.000005 0.00001 Di-ortho 2,2',3,3',4,4',5 170 0 0 0 substituted: 2,2',3,4,4',5,5' 180 0 0 0

Dioxin and Furan Inventories 95
UNEP Chemicals May 1999
APPENDIX B: DIOXIN AND FURAN PROFILE INFORMATION– UNEP CHEMICAL’S SURVEY
B.1 General
In 1997, UNEP Chemicals sent questionnaires to the POPs focal points requesting informationon POPs uses and releases. To March 1999, responses were obtained from 68 countries; ofthese, 43 countries addressed dioxins and furans. Table B 1 lists in alphabetical order allcountries that responded with the information if a dioxin inventory was performed or not.Although most countries are aware that there might exist sources of PCDD/PCDF, these classesof compounds have not been quantified so far. The major reason for not having identified dioxinand furan sources is lack of financial or analytical capacities.
New information giving quantitative data not yet published in the literature so far were obtainedfor Croatia, Finland, and Norway. The data are shown in Table B 2, Table B 3 and Table B 5.Countries like Austria, the Czech Republic, Denmark, The Netherlands, the United Kingdom, andSwitzerland reported the same data as were published in the literature before and thus, theseresults can be found in the main part of the report under the given country’s section. As thePCDD/PCDF releases reported by Germany and Sweden differ slightly from the data found in theliterature and thus, are listed in this Annex as well (Table B 4 and Table B 6).
Table B 1: Dioxin and furan sources information received at UNEP Chemicals
Dioxin InventoryCountry Yes NoArmenia XAustria X 1Belgium X 2Benin XBulgaria XBurkina Faso XCameroon XChile XChina XCongo XCosta Rica XCroatia XCzech Republic ?Denmark X 1Dominica XFiji XFinland XGambia XGermany X 1Guinée XIreland XRepublic of Korea XKuwait X
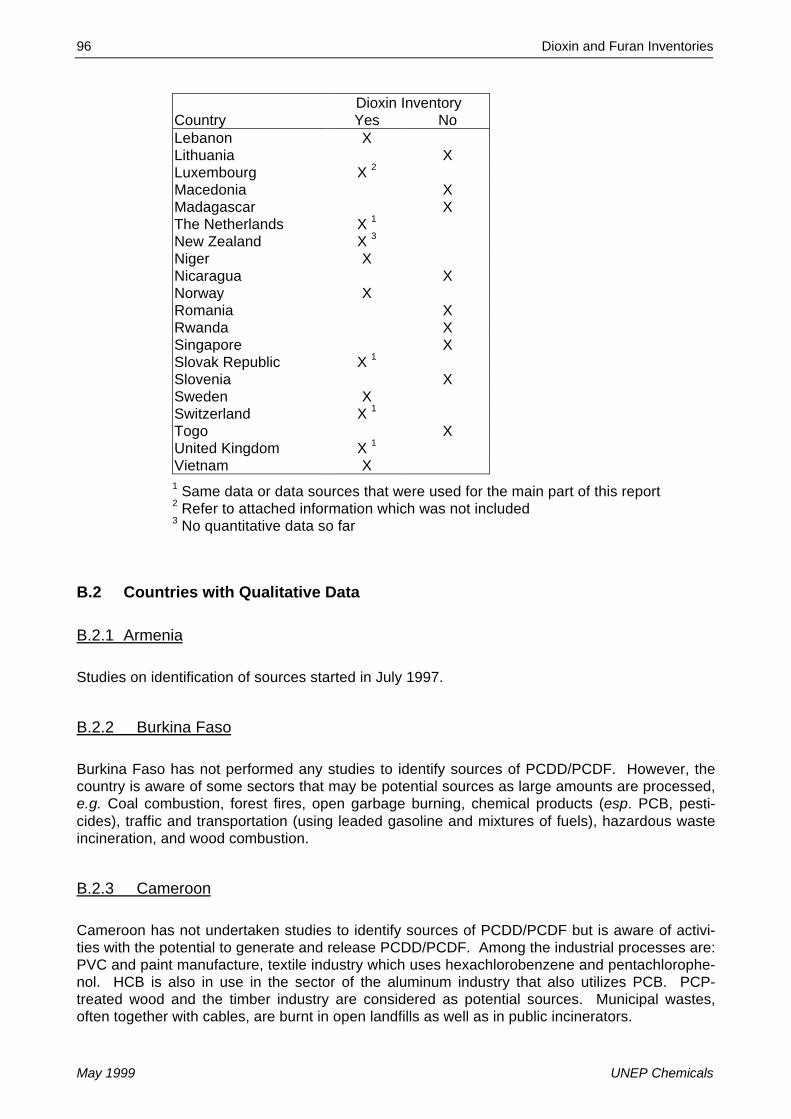
96 Dioxin and Furan Inventories
May 1999 UNEP Chemicals
Dioxin InventoryCountry Yes NoLebanon XLithuania XLuxembourg X 2Macedonia XMadagascar XThe Netherlands X 1New Zealand X 3Niger XNicaragua XNorway XRomania XRwanda XSingapore XSlovak Republic X 1Slovenia XSweden XSwitzerland X 1Togo XUnited Kingdom X 1Vietnam X1 Same data or data sources that were used for the main part of this report2 Refer to attached information which was not included3 No quantitative data so far
B.2 Countries with Qualitative Data
B.2.1 Armenia
Studies on identification of sources started in July 1997.
B.2.2 Burkina Faso
Burkina Faso has not performed any studies to identify sources of PCDD/PCDF. However, thecountry is aware of some sectors that may be potential sources as large amounts are processed,e.g. Coal combustion, forest fires, open garbage burning, chemical products (esp. PCB, pesti-cides), traffic and transportation (using leaded gasoline and mixtures of fuels), hazardous wasteincineration, and wood combustion.
B.2.3 Cameroon
Cameroon has not undertaken studies to identify sources of PCDD/PCDF but is aware of activi-ties with the potential to generate and release PCDD/PCDF. Among the industrial processes are:PVC and paint manufacture, textile industry which uses hexachlorobenzene and pentachlorophe-nol. HCB is also in use in the sector of the aluminum industry that also utilizes PCB. PCP-treated wood and the timber industry are considered as potential sources. Municipal wastes,often together with cables, are burnt in open landfills as well as in public incinerators.
Dioxin and Furan Inventories 97
UNEP Chemicals May 1999
B.2.4 China
China refers to a publication where emissions from a waste incinerator burning PCB wastes werereported: The publication gives very high concentrations of 47,210 ng I-TEQ/kg fly ash.
Reference: Jiang Ke, L. Li, J. Jin. D. Zhang, and C. Shao (1995): Specific Congeners Analysis ofDioxins from the Emissions of a Testing Incinerator. Organohalogen Compd. 23, 451-454
B.2.5 Costa Rica
The country is aware of potential sources such as: asphalt mixing, incineration, chemical industry,forest fires, fuel combustion, hospital waste incineration, foundries, PCB in capacitors andtransformers, sintering, traffic emissions, transportation, wood combustion. There is a need forinformation.
B.2.6 Guinée
Potential sources may exist, e.g. aluminum production, calcination of bauxite, traffic, and medicalwaste incineration.
B.2.7 Ireland
Ireland has a number of small industries likely to emit PCDD/PCDF. Studies are required to ana-lyze these emissions. Some sources of PCDD/PCDF identified in other countries do not exist inIreland (e.g. cable burning, landfill gas incineration, municipal, hazardous and medical wasteincineration). First surveys on environmental matrices such as soil and cow milk have indicatedthat dioxin levels are generally very low or close to detection limits.
B.2.8 Lebanon
Lebanon has initiated a study to quantify sources of PCDD/PCDF in the country by taking sam-ples from the six counties. Sources targeted are chemicals and derivatives, plastics and rubber,hospital waste incinerators, cement kilns, metal sector, power plants and traffic emissions.Finally, one compost sample will be analyzed as well.
B.2.9 Madagascar
The country is aware of potential sources.
B.2.10 Niger
Assumes PCDD/PCDF contaminations in PCB and thus, may be present in the country.Research has been started.
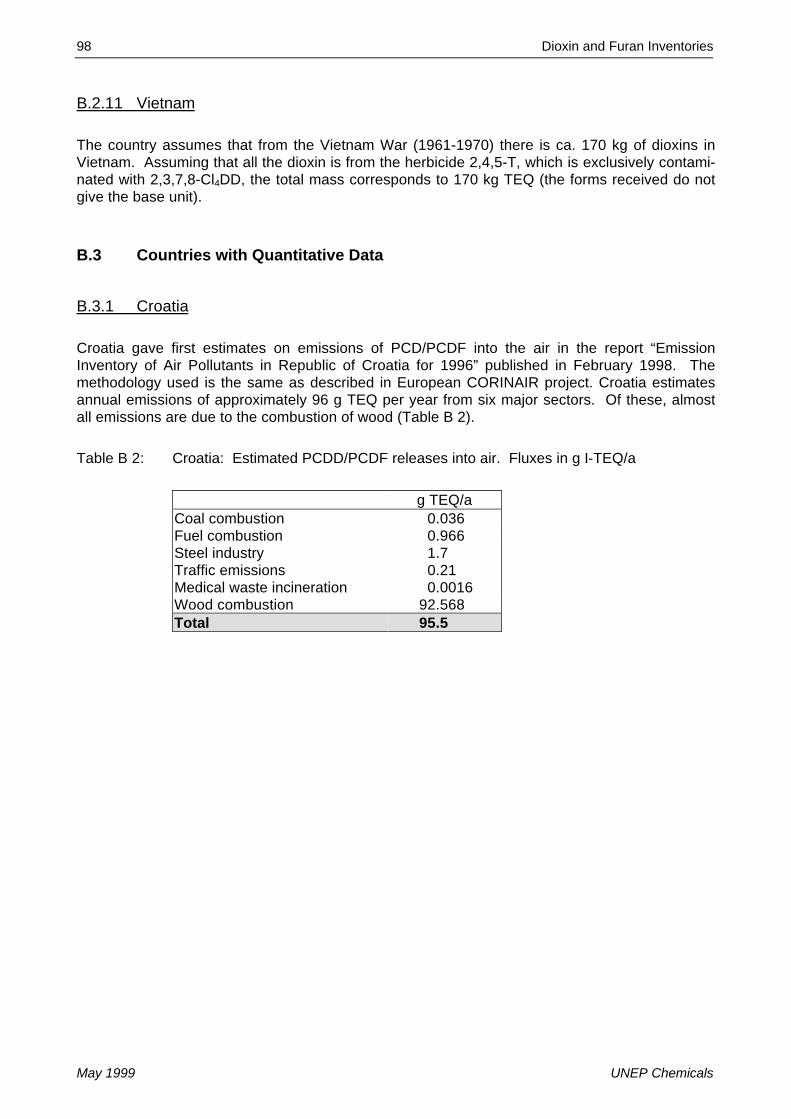
98 Dioxin and Furan Inventories
May 1999 UNEP Chemicals
B.2.11 Vietnam
The country assumes that from the Vietnam War (1961-1970) there is ca. 170 kg of dioxins inVietnam. Assuming that all the dioxin is from the herbicide 2,4,5-T, which is exclusively contami-nated with 2,3,7,8-Cl4DD, the total mass corresponds to 170 kg TEQ (the forms received do notgive the base unit).
B.3 Countries with Quantitative Data
B.3.1 Croatia
Croatia gave first estimates on emissions of PCD/PCDF into the air in the report “EmissionInventory of Air Pollutants in Republic of Croatia for 1996” published in February 1998. Themethodology used is the same as described in European CORINAIR project. Croatia estimatesannual emissions of approximately 96 g TEQ per year from six major sectors. Of these, almostall emissions are due to the combustion of wood (Table B 2).
Table B 2: Croatia: Estimated PCDD/PCDF releases into air. Fluxes in g I-TEQ/a
g TEQ/aCoal combustion 0.036Fuel combustion 0.966Steel industry 1.7Traffic emissions 0.21Medical waste incineration 0.0016Wood combustion 92.568Total 95.5
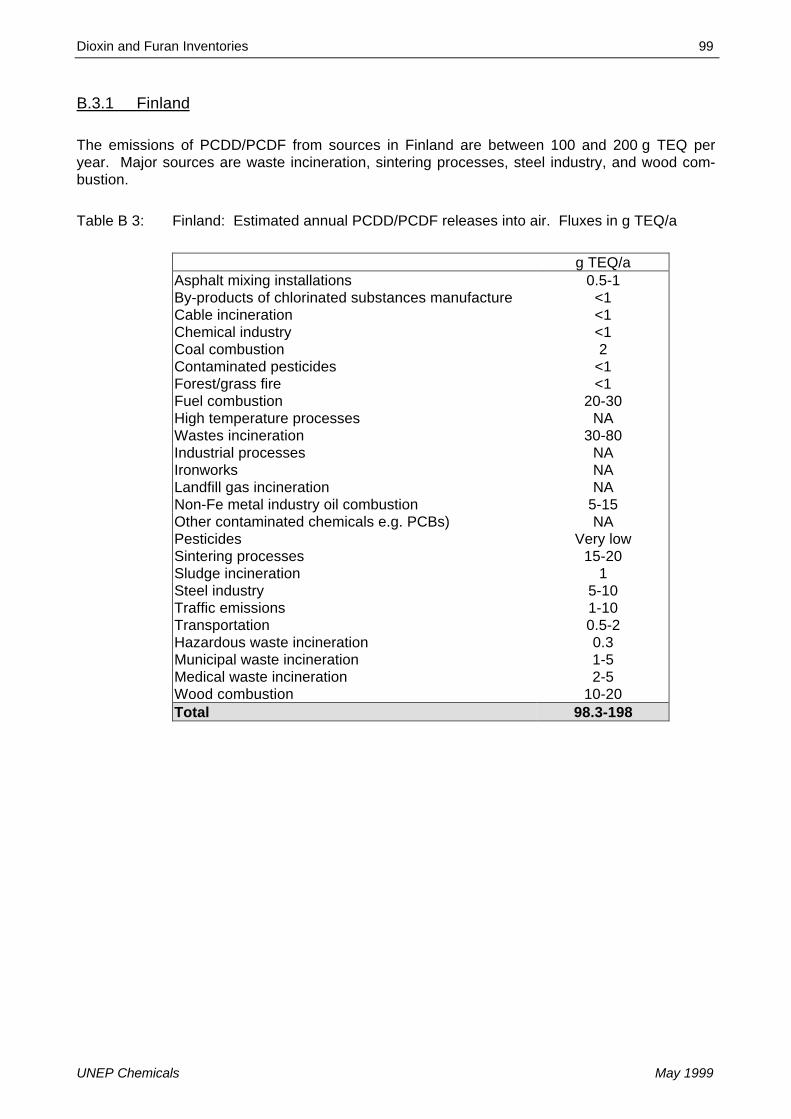
Dioxin and Furan Inventories 99
UNEP Chemicals May 1999
B.3.1 Finland
The emissions of PCDD/PCDF from sources in Finland are between 100 and 200 g TEQ peryear. Major sources are waste incineration, sintering processes, steel industry, and wood com-bustion.
Table B 3: Finland: Estimated annual PCDD/PCDF releases into air. Fluxes in g TEQ/a
g TEQ/aAsphalt mixing installations 0.5-1By-products of chlorinated substances manufacture <1Cable incineration <1Chemical industry <1Coal combustion 2Contaminated pesticides <1Forest/grass fire <1Fuel combustion 20-30High temperature processes NAWastes incineration 30-80Industrial processes NAIronworks NALandfill gas incineration NANon-Fe metal industry oil combustion 5-15Other contaminated chemicals e.g. PCBs) NAPesticides Very lowSintering processes 15-20Sludge incineration 1Steel industry 5-10Traffic emissions 1-10Transportation 0.5-2Hazardous waste incineration 0.3Municipal waste incineration 1-5Medical waste incineration 2-5Wood combustion 10-20Total 98.3-198
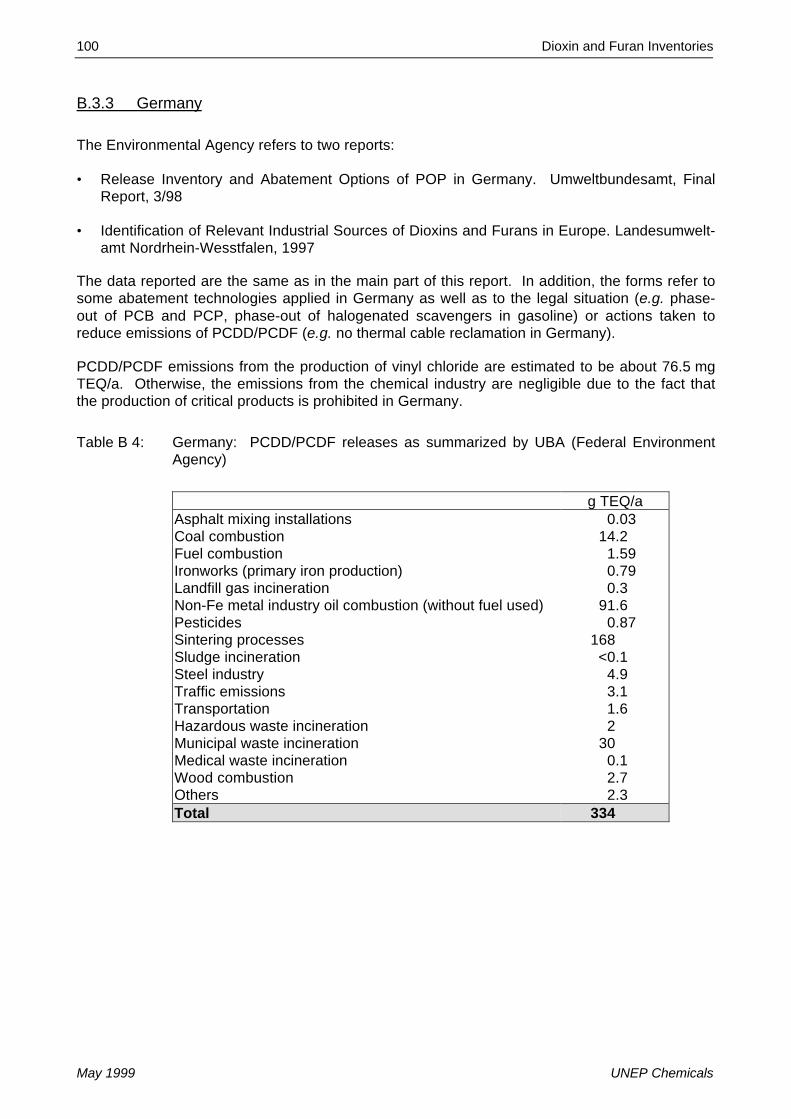
100 Dioxin and Furan Inventories
May 1999 UNEP Chemicals
B.3.3 Germany
The Environmental Agency refers to two reports:
• Release Inventory and Abatement Options of POP in Germany. Umweltbundesamt, FinalReport, 3/98
• Identification of Relevant Industrial Sources of Dioxins and Furans in Europe. Landesumwelt-amt Nordrhein-Wesstfalen, 1997
The data reported are the same as in the main part of this report. In addition, the forms refer tosome abatement technologies applied in Germany as well as to the legal situation (e.g. phase-out of PCB and PCP, phase-out of halogenated scavengers in gasoline) or actions taken toreduce emissions of PCDD/PCDF (e.g. no thermal cable reclamation in Germany).
PCDD/PCDF emissions from the production of vinyl chloride are estimated to be about 76.5 mgTEQ/a. Otherwise, the emissions from the chemical industry are negligible due to the fact thatthe production of critical products is prohibited in Germany.
Table B 4: Germany: PCDD/PCDF releases as summarized by UBA (Federal EnvironmentAgency)
g TEQ/aAsphalt mixing installations 0.03Coal combustion 14.2Fuel combustion 1.59Ironworks (primary iron production) 0.79Landfill gas incineration 0.3Non-Fe metal industry oil combustion (without fuel used) 91.6Pesticides 0.87Sintering processes 168Sludge incineration <0.1Steel industry 4.9Traffic emissions 3.1Transportation 1.6Hazardous waste incineration 2Municipal waste incineration 30Medical waste incineration 0.1Wood combustion 2.7Others 2.3Total 334

Dioxin and Furan Inventories 101
UNEP Chemicals May 1999
B.3.4 Norway
Norway has quantified a few sources of PCDD/PCDF. The total emissions from identifiedsources are 9 g TEQ per year. The two major sources are municipal solid waste incineration andproduction of aluminum and magnesium. A minor source is the production of the vinyl chloridemonomer (chemical industry). Norway does not have sewage sludge incinerators.
Table B 5: Norway: PCDD/PCDF emissions to air
g TEQ/aChemical industry (VCM) 0.05Industrial processes(Hydro aluminum and hydro magnesium)
4.4
Sludge incinerationHazardous waste incineration 0.3Municipal waste incineration 4.4Total 9.15

102 Dioxin and Furan Inventories
May 1999 UNEP Chemicals
B.3.5 Sweden
Sweden has banned several products containing PCDD/PCDF such as PCB, PCP, and 2,4,5-T.Emissions from waste incinerators are controlled. The Swedish inventory considers releases toair, water and with wastes or products. The reference year is 1993.
Table B 6: Sweden: PCDD/PCDF releases to air, water and wastes or products; referenceyear 1993. Fluxes in g TEQ/a
To Air
g TEQ/a
To Water
g TEQ/a
With Wastes (W)/Products (P)
g TEQ/aBy-products of chlorinated substances manufacture 0.5-0.8Coal combustion 0.6Ironworks 0.5 1-15 (W)Sintering processes 3Steel industry 2-19 28 (W)Traffic emissions 0.2-1Transportation 1-2Hazardous waste incineration 0.007Municipal waste incineration 3 1-2 (W)Medical waste incineration 0.001Wood combustion 4-18Bleached kraft pulp 1 2-5 0.3-7 (P)Recycled pulp 3 (P)Sewage sludge 0.1 4 (W)Primary non-ferrous smelters 0.1-0.3 0.4 (W)Secondary non-ferrous smelters 4 2 (W)Cement kilns 3-5Cremation 0.4-2Lime burning 3-5Uncontrolled landfill fires 3-30Oil heating 0.1-3Natural gas heating 0.04Total 23.3-93 2.6-5.8 11.7-24