modelling tsunamis generated by earthquakes and … · p017-1 modelling tsunamis generated by...
TRANSCRIPT

P017-1
Modelling Tsunamis Generated by Earthquakes and Submarine Slumps Using Mike 21
Stephen Anton LUGER, Rhydar Lee HARRIS
Prestedge Retief Dresner Wijnberg, 5th Floor, Safmarine Quay, Clock Tower Precinct, Victoria and Alfred Waterfront, Cape Town, South Africa, e-mails: [email protected], [email protected]
Keywords
MIKE 21, tsunami, earthquake, submarine slump
Abstract
This paper describes the modelling of tsunamis generated by earthquakes and submarine slumps using Mike 21. This includes the calculation of the initial conditions, the numerical settings applied for the propagation model and three case studies. A comparison between the MIKE 21 Classic and MIKE 21 Flexible Mesh models is also described. Given appropriate initial conditions, the MIKE 21 Classic can be used to efficiently simulate the propagation of tsunamis generated by both earthquakes and submarine slumps. The lack of geographical coordinates in MIKE 21 Classic can however result in a distorted grid when simulating larger domains. Although the MIKE 21 Flexible Mesh model includes geographical coordinates, the numerical scheme (including the higher order options) appears to be too dispersive to accurately simulate tsunami propagation over large distances, and the Flexible Mesh version presently does not feature a landslide option. MIKE 21 Classic is thus the preferred DHI model for tsunami modelling at present.
INTRODUCTION
A tsunami is a series of water waves generated by rapid, large scale disturbance of a water body. Only geophysical events that release a large amount of energy in a very short time into a water body generate tsunamis. Earthquakes are the most frequent causes, but submarine and subaerial landslides, pyroclastic flows and caldera collapses during volcanic eruptions, meteorite impacts and ice falls may also generate tsunamis. Tsunami waves travel over long distances across the water body with little loss of energy towards the shore, where they shoal as they reach shallow water. The waves have the potential to inundate significant areas onshore, depending on local bathymetry and topography, and the hydrostatic and hydrodynamic forces associated with these waves can be severely destructive (U.S. NRC, 2009).
This paper describes the modelling of tsunamis generated by earthquakes and submarine slumps using Mike 21. This includes the calculation of the initial conditions, the numerical settings applied for the propagation model and three case studies. A comparison between the MIKE 21 Classic and MIKE 21 Flexible Mesh models is also described.
INITIAL CONDITIONS FOR TSUNAMIS GENERATED BY EARTHQUAKES
A tsunamigenic earthquake results in a displacement of the water surface, which is applied as the initial condition in the model. For earthquake-generated

P017-2
tsunamis the duration of the source dynamics is generally much smaller than the period of the tsunami waves, so the coupling between the source and the initial waveform can be neglected without significantly affecting the properties of the tsunami waves (U.S. NRC, 2009). The formulation of Okada (1985), which is based on an elastic earth crust, may be used to calculate the displacement of the seabed due to the earthquake. A complex rupture pattern can be simulated by dividing the fault plane into a series of smaller segments, each of these individually described by an Okada formulation. The vertical displacement of the seabed induces a corresponding displacement of the water surface, which is applied as the initial condition for the hydrodynamic model.
An example of the fault parameters for the 26 December 2004 Sumatra tsunami and the corresponding initial water surface elevation are shown in Table 1 and Figure 1, respectively.
Table 1: Fault parameters for the 26 December 2004 Sumatra magnitude 9.2 earthquake (Grilli et al, 2007).
Parameter Fault Segment Number 1 2 3 4 5
Origin(1) Longitude [degrees] 94.10 93.33 92.71 92.17 92.44 Origin(1) Latitude [degrees] 3.48 5.10 7.21 9.68 11.78 Strike(2) [degrees] 323 348 338 356 10 Depth(3) [km] 25 25 25 25 25 Length [km] 220 150 390 150 350 Width [km] 130 130 120 95 95 Dip [degrees] 12 12 12 12 12 Mean Dislocation [m] 18 23 12 12 12 (1) The origin is defined as the mid-point of the upper border of the fault. (2) An observer facing along strike will see the fault dip to the right (degrees clockwise from north). (3) Depth from the seabed to the upper border of the fault.

Figure 1: Initial water surface elevation calculated for the 26 December 2004 Sumatra tsunami using the fault parameters in Table 1.
INITIAL CONDITIONS FOR TSUNAMIS GENERATED BY SUBMARINE SLUMPS
Submarine mass failures can be categorised as either slip events, which are typically large translations in landslide masses, or rotational failure leading to a slump event (see Figure 2). Only slumps will be considered here, although a similar methodology can be applied for slips. Unlike tsunami generation by earthquakes, which can be accurately modelled using the instantaneous co-seismic displacement of the water surface as an initial condition, submarine slumps or slides typically take place over a number of minutes. The velocity of landslides can often be comparable to the phase velocity of the tsunami waves generated by it and an explicit landslide model should thus be employed in order to initiate the tsunami (U.S. NRC, 2009).
P017-3

Figure 2 The main morphological and structural features of submarine slumps (Dingle, 1977).
Subaerial or submarine slumps and slides can be simulated explicitly in the MIKE 21 Classic model using the landslide option. The effect of the landslide is modelled by forcing terms representing the temporal dynamic vertical deformation of the bathymetry. The main task in preparing the input data for the model is to generate a time varying bathymetry file.
We have developed a numerical routine to define the dynamic changes in seabed level arising from a slump. The submarine slump is simulated as a rigid body moving down a slope. The body has a Gaussian shape as specified in Grilli and Watts (2005). The equation describing the slump motion follows Watts et al (2003), where the slump motion is modelled as a rigid body undergoing a rotation around a point described as the centre of rotation of a circle prescribed by the arc of the circular failure plane (see Figure 3). The rigid body is subject to external moments due to gravity, added mass and shear stress summed over the failure plane. The slump motion is described with a cosine function and as such experiences an initial angular acceleration, relatively constant maximum angular velocity and a subsequent deceleration before coming to rest in a position such that the centre of mass of the slump is vertically under the axis of rotation.
Figure 3: Parameters defining the slump model of Watts et al (2003).
P017-4

The magnitude of the tsunami generated by a slump depends on a number of parameters including slump volume, water depth, slump thickness, initial acceleration and the maximum velocity of the slump. An example of the application of this methodology is described later in this paper.
PROPAGATION MODELLING USING MIKE 21 CLASSIC
The MIKE 21 Classic hydrodynamic model is used to simulate the propagation of the tsunami wave from the source to the shore. The model solves the non-linear two-dimensional shallow water equations (conservation of mass and vertically-integrated momentum) on a series of dynamically-nested rectangular grids using an implicit time scheme. Processes simulated include spatially-varying Coriolis force, bottom shear stress, momentum dispersion and flooding / drying.
Our tests indicate that the grid spacing should be selected to ensure at least 20 to 30 grid points per tsunami wavelength. Although a Courant number of 5 to 20 may be acceptable for the stability of the implicit solver, our tests indicate that a Courant number of approximately 1 is required for the accurate propagation of the tsunami wave over large distances. Given the grid spacing and model time step, the maximum and minimum allowable water depths in a particular grid area can be calculated as follows:
2
2imummin
T81.9)kx∆(d =
2
2imummax
t∆81.9)x∆C(d =
where ∆x = grid spacing [m] k = grid points per tsunami wavelength, 20 to 30 are recommended T = tsunami period [s], typically 5 to 40 minutes C = Courant number, 1 is recommended ∆t = model time step [s]
The nested grid facility allows progressively finer grid sizes to be used as the tsunami propagates into shallower water. For smaller model domains in the order of 500 km, the default map projection such as UTM is used. In the case of large model domains, e.g. modelling tsunami propagation across an ocean, a limitation of MIKE 21 Classic is the lack of geographical coordinates, which will result in a distorted grid and associated errors in the tsunami propagation. In this case the best option is to use the Map Projection Editor to set up a custom map projection designed to minimise the distortion in the area of interest, e.g. using the projection type: Lambert conformal conic with two standard parallels.
The default drying depth of 0.2 m and flooding depth of 0.3 m are applied. Eddy viscosity is generally found to have an insignificant influence on these simulations and is often set to zero, although it can be used to suppress high frequency disturbances, particularly when modelling landslides. Bed resistance is specified by a Manning number of 32 m1/3/s.
P017-5

P017-6
Where open boundaries exist, it is important that the tsunami waves are not reflected back into the model domain. In the absence of an absorbing boundary condition in MIKE 21 Classic, we have applied an artificial cubic-shaped beach in front of the open boundaries. The beach is typically 100 grid cells wide. This is easily created in the MIKE Grid Editor by deleting the existing depths near the boundary, setting the depth at the boundary to zero, and then using the “inverse distance ^3 weighted” interpolation tool. In addition, the bed resistance on the artificial beach slope is increased by specifying a Manning number of 0.1 m1/3/s.
CASE STUDY: PROPAGATION OF 2004 SUMATRA TSUNAMI TO SOUTH AFRICA
The methodology described above has been applied to the Sumatra tsunami of 26 December 2004. The fault parameters and the corresponding initial water surface elevation are shown in Table 1 and Figure 1, respectively. The tsunami is propagated across the Indian Ocean to South Africa.
Nine nested grids are used, with the grid spacing varying from 120 m at Port Elizabeth to 9720 m at the model boundaries. The model time step is 6 s, which ensures a Courant Number of less than 1.0. The model results are shown in Figure 4. The bathymetry and orientation of Port Elizabeth Bay is seen to amplify the tsunami, particularly in the western corner of the bay and inside the two ports.
The 26 December 2004 event was measured at a number of tidal stations along the South African coastline, with the largest water level variation measured in the Port of Port Elizabeth. The measured tide has been subtracted from predicted tide and then adjusted for the average storm surge of 0.18 m measured during the tsunami. The resulting tsunami signal is shown in Figure 5. It should be noted that the maximum crest of the tsunami was not recorded due to an instrument problem. Hartnady and Okal (2007) estimate the maximum crest level to have been approximately 2.11 m above the predicted tidal level. If the 0.18 m average storm surge is taken into account the maximum tsunami crest level reduces to 1.93 m.
The modelled tsunami-induced water levels inside the Port of Port Elizabeth compare well to the measurements (see Figure 5). The model slightly under-predicts the maximum water level (model: 1.7 m, measured: approximately 1.9 m) while over-predicting the minimum water level (model: -2.0 m, measured: -1.5 m). Both measured and modelled tsunamis have periods of between 30 and 40 minutes.

Figure 4: Modelled propagation of the Sumatra tsunami of 26 December 2004. (The maximum water surface elevations in the large plot are calculated from the model solution saved at 10 minute intervals, which allows the propagation of the wave crests to be visualised. The small plot uses the model solution saved at 1 minute intervals in order to obtain an accurate estimate of the maximum elevations near the coastline.)
Figure 5: Calibration of tsunami model against tide gauge measurements in the Port of Port Elizabeth
P017-7

P017-8
CASE STUDY: TSUNAMI GENERATED BY A HYPOTHETICAL SUBMARINE SLUMP OFFSHORE OF CAPE TOWN
The methodology described above is applied to model the tsunami generated by a hypothetical 80 km3 slump on the continental shelf edge offshore of Cape Town. The geometry of the hypothetical slump described here is based on the measured geometry of the proximal portion of the much larger historical Agulhas Slump, located on the continental shelf edge of South Africa (Dingle, 1977). The slump parameters are given in Table 2 and the resulting tsunami is shown in Figure 6.
Table 2: Parameters describing a hypothetical 80 km3 slump on the continental shelf edge offshore of Cape Town.
Volume(1) [km3] 80 Length(2) “b” [km] 18 Width(3) [km] 18 Thickness “T” [km] 0.3 Rotation “φ” [degrees] 0.4 Radius “R” [km] 135 Displacement “S” [km] 1.0 Centroid Longitude [degrees] 17.18 Centroid Latitude [degrees] -34.37 Strike(4) [degrees] 10 Water Depth [m] 2000 Initial Acceleration [m/s2] 0.011 Maximum Velocity [m/s] 2.3 Duration of Slump Movement [minutes] 11.3 (1) Since the slump is elliptic, the volume = π/4 x length x width x thickness (2) Items in “inverted commas” are defined in Figure 3 (3) Width of the slump is measured transversely across the slope. (4) An observer facing along strike will see the slump moving down to the right (degrees clockwise from north).

Figure 6: Modelled propagation of a tsunami generated by a hypothetical 80 km3 slump on the continental shelf edge offshore of Cape Town. (The maximum water surface elevations in the large plot are calculated from the model solution saved at 10 minute intervals, which allows the propagation of the wave crests to be visualised. The small plot uses the model solution saved at 1 minute intervals in order to obtain an accurate estimate of the maximum elevations near the coastline.)
The modelled 80 km3 slump results in a maximum runup of approximately 2 m at the shoreline. Although there is clear evidence of historical slumps around the shelf margin of South Africa, the present-day risk posed by slumps is unclear. The historical Agulhas Slump located on the edge of the Agulhas Bank approximately 400 km south-west of Cape Town is one of the largest slumps identified world-wide with an estimated length of 750 km, width of 106 km and volume of 20 000 km3. The slump involved Pliocene sediments and may therefore be Quaternary (1.8 million years to present) in age (Dingle, 1977).
The volume of the historical Agulhas Slump is 250 times larger than the slump that has been modelled, implying a devastating tsunami should the slump have occurred as a single unit rather than a number of smaller events at different times. Preliminary numerical modelling indicates that for this slump region the duration of the tsunami-induced water level disturbance at the shore is 1 to 2 hours, implying that individual slumps separated by longer than this time are effectively separate smaller events rather than one large event. The present-day risk posed by these events to sensitive infrastructure such as power stations is the subject of ongoing research.
CASE STUDY: TSUNAMI-INDUCED WATER LEVELS AND CURRENTS FOR PORT DESIGN IN CHILE
P017-9
Mejillones Bay is located in northern Chile. The subduction zone of the Nazca and South American plates lies approximately 100 km to the west of the bay. The existing port infrastructure includes the port terminals of Mejillones and
Angamos. Currently in design and construction is the Terminal Graneles Del Norte (TGN) to the north of Angamos Port. Maximum tsunami-induced water levels and currents are required to check the structural integrity of the port structures.
The two tsunami events modelled are based on two previous seismic events in Chile: the 1877 event with a magnitude of 8.7 and the February 2010 event with a magnitude of 8.8. Although these previous earthquake epicentres were over land or within 7 km of the shore, respectively, for this study both events are assumed to occur in deep water offshore of Mejillones. The sensitivity to the fault position and fault depth were investigated. It was found that a shallow (depth = 10 km) source located in deep water along the Peru-Chile trench (longitude = -71.5°) resulted in the worst tsunami runup and velocities in Mejillones Bay.
Six nested grids were used, with a grid spacing of 6075 m, 2025 m, 675 m, 225 m, 75 m and 25 m. The model bathymetry was obtained from the MIKE C-MAP electronic hydrographic charts and local bathymetric surveys. Topographic data up to +30 m Chart Datum was included in the model. The model time step was 1 s, which ensured a Courant number of less than 1.3. The grid spacing was selected to ensure at least 30 grid points per tsunami wavelength. The drying depth was set at 0.2 m and the flooding depth was 0.4 m. A constant velocity-based eddy viscosity of 0.5 m2/s was applied. Bed resistance was specified by a Manning number of 32 m1/3/s.
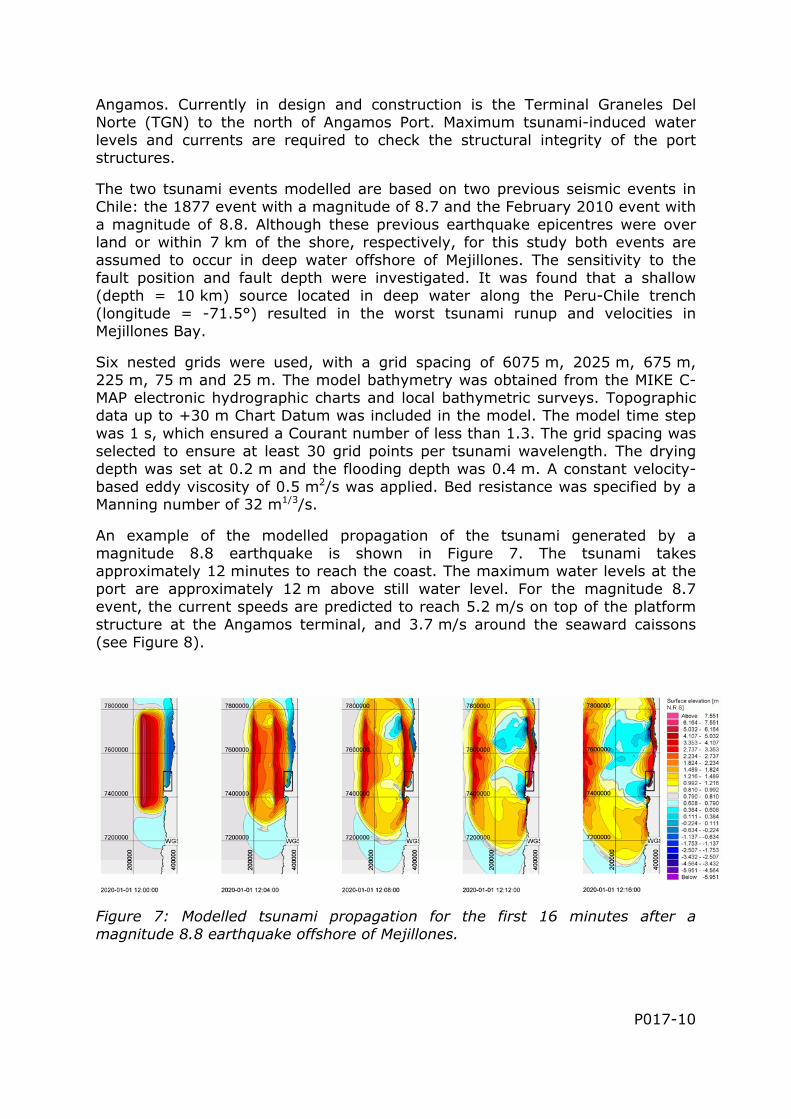
An example of the modelled propagation of the tsunami generated by a magnitude 8.8 earthquake is shown in Figure 7. The tsunami takes approximately 12 minutes to reach the coast. The maximum water levels at the port are approximately 12 m above still water level. For the magnitude 8.7 event, the current speeds are predicted to reach 5.2 m/s on top of the platform structure at the Angamos terminal, and 3.7 m/s around the seaward caissons (see Figure 8).
Figure 7: Modelled tsunami propagation for the first 16 minutes after a magnitude 8.8 earthquake offshore of Mejillones.
P017-10

Figure 8: Instantaneous current speeds at Angamos terminal during tsunami drawdown from a magnitude 8.7 earthquake. Maximum current speeds reach 5.2 m/s on top of the platform structure.
APPLICATION OF MIKE 21 FLEXIBLE MESH MODEL FOR TSUNAMI MODELLING
A brief assessment of the MIKE 21 Flexible Mesh model has been undertaken by repeating the Chilean case study described above using the Flexible Mesh model instead of the MIKE 21 Classic model. A triangular mesh was generated to mimic the refinement achieved with the nested rectangular grids, although the large number of resulting elements meant that the element areas in the Flexible Mesh model were approximately 30% larger compared to the Classic model. The Flexible Mesh model was run with both the lower and higher order time integration and space discretization schemes. The default critical CFL number of 0.8 was tested, as well as a lower value of 0.4.
The results in Figure 9 show that the higher order scheme improves the model accuracy, particularly for the current speeds. Reducing the critical CFL number to 0.4 does not improve the results further. Compared to the Classic model, the Flexible Mesh is seen to underestimate the current speeds by approximately 25% in this particular example.
P017-11

Figure 9: Comparison between the MIKE 21 Classic and Flexible Mesh models. Plots show the surface elevation and velocities in Mejillones Bay due to magnitude 8.7 earthquake offshore.
The Classic model was found to be more computationally efficient in this case, as shown by the following runtimes for the four models:
• HD Classic, CFL = 1.3 : 2.5 hours • FM Lower Order, CFL = 0.8 : 4.0 hours • FM Higher Order, CFL = 0.8 : 12.2 hours • FM Higher Order, CFL = 0.4 : 22.3 hours
In cases where frequency dispersion is important, e.g. where the source is close to the shoreline, the use of a Boussinesq wave model such as MIKE BW should be considered in preference to shallow water equation models such as MIKE 21 Classic and Flexible Mesh.
CONCLUSIONS
Given appropriate initial conditions, the MIKE 21 Classic can be used to efficiently simulate the propagation of tsunamis generated by both earthquakes and submarine slumps. The lack of geographical coordinates in MIKE 21 Classic can however result in a distorted grid when simulating larger domains.
Although the MIKE 21 Flexible Mesh model includes geographical coordinates, the numerical scheme (including the higher order options) appears to be too dispersive to accurately simulate tsunami propagation over large distances, and the Flexible Mesh version presently does not feature a landslide option.
P017-12

P017-13
MIKE 21 Classic is thus the preferred DHI model for tsunami modelling at present.
REFERENCES
Dingle R (1977) The anatomy of a large submarine slump on a sheared continental margin (SE Africa). Journal of the Geological Society of London 134; 293-310.
Grilli S and Watts P (2005) Tsunami Generation by Submarine Mass Failure, 1: Modelling, Experimental Validation and Sensitivity Analysis. Journal of Waterway, Port, Coastal and Ocean Engineering, November/December 2005.
Grilli S, Ioualalen M, Asavanant J, Shi F, Kirby J and Watts P (2007) Source Constraints and Model Simulation of the December 26, 2005, Indian Ocean Tsunami. Journal of Waterway, Port, Coastal, and Ocean Engineering, Vol. 133, No. 6, November, 2007.
Hartnady C and Okal E (2007) Mentawai tsunami effect at Port Elizabeth, South Africa on 12-14 September 2007, South Afr. J. Sci.
Okada Y (1985) Surface Deformation to Shear and Tensile Faults in a Half-Space. Bull. Seism. Soc. Am., 75, [4], 1135-1154.
U.S. NRC (2009) Tsunami Hazard Assessment at Nuclear Power Plant Sites in the United States of America, Final Report. U.S. Nuclear Regulatory Commission, Report NUREG/CR-6966, March 2009.
Watts P, Grilli S, Kirby J, Fryer G and Tappin D (2003). Landslide Tsunami Case Studies Using a Boussinesq Model and a Fully Nonlinear Tsunami Generation Model. Natural Hazards and Earth System Sciences, Vol. 3, 2003, pp. 391-402.