modelling illicit drug fate in sewers for wastewater-based ...pedram ramin modelling illicit drug...
TRANSCRIPT

General rights Copyright and moral rights for the publications made accessible in the public portal are retained by the authors and/or other copyright owners and it is a condition of accessing publications that users recognise and abide by the legal requirements associated with these rights.
Users may download and print one copy of any publication from the public portal for the purpose of private study or research.
You may not further distribute the material or use it for any profit-making activity or commercial gain
You may freely distribute the URL identifying the publication in the public portal If you believe that this document breaches copyright please contact us providing details, and we will remove access to the work immediately and investigate your claim.
Downloaded from orbit.dtu.dk on: May 25, 2020
Modelling Illicit Drug Fate in Sewers for Wastewater-Based Epidemiology
Ramin, Pedram
Publication date:2016
Document VersionPublisher's PDF, also known as Version of record
Link back to DTU Orbit
Citation (APA):Ramin, P. (2016). Modelling Illicit Drug Fate in Sewers for Wastewater-Based Epidemiology. TechnicalUniversity of Denmark, DTU Environment.

Modelling Illicit Drug Fate in Sewers
for Wastewater-Based Epidemiology
Pedram Ramin
PhD Thesis
December 2016
DTU Environment
Department of Environmental Engineering
Technical University of Denmark
Pedram Ramin
Modelling Illicit Drug Fate in Sewers for Wastewater-Based Epidemiology
PhD Thesis, December 2016
The synopsis part of this thesis is available as a pdf-file for download from
the DTU research database ORBIT: http://www.orbit.dtu.dk.
Address: DTU Environment
Department of Environmental Engineering
Technical University of Denmark
Bygningstorvet, building 115
2800 Kgs. Lyngby
Denmark
Phone reception: +45 4525 1600
Fax: +45 4593 2850
Homepage: http://www.env.dtu.dk
E-mail: [email protected]
Printed by: GraphicCo
December 2016
i
Preface The PhD thesis is based on the work carried out at the Technical University of
Denmark, Department of Environmental Engineering, from February 2013 to De-
cember 2016. The project was carried out under the main supervision of Assoc.
Prof. Benedek Gy. Plósz with Prof. Peter Steen Mikkelsen, as co-supervisor. The
project funding was provided by the Marie Curie Initial Training Networks (ITN) in
a European project “SEWPROF” (https://sewprof-itn.eu/).
I Ramin, P., Brock, A.L., Polesel, F., Causanilles, A., Emke, E., de Voogt,
P., Plósz, B.G. (2016). Transformation and sorption of illicit drug
biomarkers in sewer systems : understanding the role of suspended solids
in raw wastewater. Environmental Science and Technology. doi:10.1021
/acs.est.6b03049
II Ramin, P., Valverde-Pérez, B., Polesel, F., Locatelli, L., Plósz, B.G.
(2016). A systematic model calibration method for chemical and
biochemical transformation pathway models – The case of transformation
of heroin biomarkers in wastewater. Submitted manuscript
III Ramin, P., Brock, A.L., Causanilles, A., Valverde-Pérez, B., Emke, E.,
de Voogt, P., Polesel, F., Plósz, B.G. (2016). Transformation and sorption
of illicit drug biomarkers in sewer biofilms. Submitted manuscript
IV Ramin, P., Vezzaro, L., Mikkelsen, P.S., Plósz, B.G. (2016). Back-
calculating illicit drug abuse rates in urban areas – Quantifying
uncertainties associated with in-sewer transformation and samplin.
Submitted manuscript
ii
In addition, the following publications, not included in this thesis, were also
concluded during this PhD study
Mardal, M., Kinyua, J., Ramin, P., Miserez, B., van Nuijs, A.L.N.,
Covaci, A., Meyer, M.R. (2016). Screening for illicit drugs in pooled
human urine and urinated soil samples and studies on the stability of
urinary excretion products of cocaine, MDMA, and MDEA in
wastewater by hyphenated mass spectrometry techniques. Drug Test-
ing and Analysis. doi:10.1002/dta.1957.
Bade, R., Bijlsma, L., Sancho, J. V, Baz-Lomba, J.A., Castiglioni, S.,
Castrignanò, E., Causanilles, A., Gracia-Lor, E., Kasprzyk-Hordern,
B., Kinyua, J., McCall, A.-K.,van Nuijs, A.L.N., Ort, C., Plósz, B.G.,
Ramin, P., Rousis, N.I., Ryu, Y., Thomas, K.V., de Voogt, P.,
Zuccato, E., Hernandez., F. (2016). Chemosphere Liquid
chromatography-tandem mass spectrometry determination of synthetic
cathinones and phenethylamines in fluent wastewater of eight
European cities. Chemosphere. doi:10.1016/j.chemosphere.2016.10.
107
Baz-Lomba, J.A., Salvatore, S., Gracia-Lor, E., Bade, R., Castiglioni,
S., Castrignanò, E., Causanilles, A., Hernandez, F., Kasprzyk-Hordern,
B., Kinyua, J., McCall, A.-K., van Nuijs, A., Ort, C., Plósz, B.G.,
Ramin, P., Reid, M., Rousis, N.I., Ryu, Y., de Voogt, P., Bramness, J.,
Thomas, K. (2016). Comparison of pharmaceutical, illicit drug,
alcohol, nicotine and caffeine levels in wastewater with sale, seizure
and consumption data for 8 European cities. BMC Public Health 16:
1035. doi:10.1186/s12889-016-3686-5
Ryu, Y., Garcia-lor, E., Bade, R., Bramness, J.G., Castiglioni, S.,
Causanilles, A., Covaci, A., de Voogt, P., Hernandez, F., Kasprzyk-
hordern, B., Mccall, A., Ort, C., Plósz, B.G., Ramin, P., Rousis, N.I.,
Reid, M.J., Thomas, K. V. (2016). Increased levels of the oxidative
stress biomarker 8-iso-prostaglandin F2α in a city´s wastewater related
to tobacco use, Scientific Reports, Accepted Manuscript
Gracia-lor, E., Castiglioni, S., Bade, R., Béen, F., Castrignanò, E.,
Covaci, A., González-, I., Hapeshi, E., Kasprzyk-hordern, B., Kinyua,
J., Lai, F.Y., Letzel, T., Lopardo, L., Meyer, M.R., O’Brien, J.,
Ramin, P., Rousis, N.I., Rydevik, A., Ryu, Y., Santos, M., Senta, I.,
Thomaidis, N., Veloutsou, S., Yang, Z., Bijlsma, L. (2016). Measuring
excretion biomarkers in wastewater as a new source of information for
epidemiological studies. Submitted Manuscript
iii
Causanilles, A., Emke, E., Bade, R., Baz-Lomb, J.A., Castiglioni, S.,
Castrignanò, E., Hernández, F., Kasprzyk-Hordern, B., Kinyua, J.,
McCall, A.-K., Nuijs, A. van, Ort, C., Plósz, B.G., Ramin, P., Rousis,
N.I., Ryu, Y., Thomas, K., de Voogt, P. (2016). Application of
wastewater-based epidemiology to assess erectile dysfunction
pharmaceuticals usage in 10 European citiesin. Manuscript in
preparation
This PhD study also contributed to international conferences with the follow-
ing proceeding and conference papers:
Ramin, P., Polesel, F., Andrésson, G., Vezzaro L., Sharma, A.K.,
Reid, M., Thomas, K.V., Mikkelsen, P.S., Plósz, B.G. (2014). Impacts
of Hydraulic Residence Time Prediction and Diurnal Loading Pattern
on the Estimation of Drug Abuse in Urban Areas. 13th International
Conference on Urban Drainage, Kuching, Malaysia, 7-11 September
2014.
Mardal, M., Ramin, P., Plósz, B.G., Maurer H.H., Meyer, M.R.
(2014). Analysis of Drugs of Abuse in Anonymously Collected Urine
and Soil samples from a Music Festival in Scandinavia. 52nd
Annual
meeting of the International Association of Forensic Toxicologists
(TIAFT), Buenos Aires, Argentina, 9-11 November 2014.
Ramin, P., Causanilles, A., Polesel, F., Emke, E., de Voogt P., Plósz,
B.G. (2015). Abiotic and biofilm-mediated transformation of heroin
biomarkers in wastewater under aerobic and anaerobic conditions. 2nd
International Conference on "Wastewater-based drug epidemiology",
Ascona, Switzerland, 11-15 October 2015.
Ramin, P., Baz-Lomba, J.A., Reid, M., Thomas, K.V., Plósz, B.G.
(2015). Impact of sampling resolution on estimation of community-
wide daily illicit drug use. 9th IWA Specialist Conference on Assess-
ment and Control of Micropollutants and Hazardous Substances in Wa-
ter, 2015, Singapore, 22-25 November.
Ramin, P., Brock, A.L., Polesel, F., Causanilles, A., Emke, E., de
Voogt P., Plósz, B.G. (2016). Fate of cocaine drug biomarkers in sewer
system: the role of suspended solids in biotransformation and sorption.
18th International EWA Symposium, Munich, Germany, 1-2 June
2016.
iv
Ramin, P., Polesel, F., Brock, A.L., Torresi, E., Plósz, B.G. (2016).
Removal of primary and secondary trace organic substrates in aerobic
and anaerobic sewer biofilm. IWA Microbial Ecology in Water Engi-
neering & Biofilms, Copenhagen, Denmark, 4-7 September 2016.
Ramin, P., Brock, A.L., Polesel, F., Torresi, E., Plósz, B.G. (2016).
Improving the prediction of in-sewer transformation of illicit drug bi-
omarkers by identifying a new modelling framework. 5th International
Conference on Emerging Contaminants (EmCon 2016) and Micropol-
lutants (WiOW 2016) in the Environment, Sidney, Australia, 20-23
September 2016.
v
Acknowledgements
This thesis is the result of nearly four years of adventure, along with many
people that made it possible for me to pass through the labyrinth of this PhD.
First of all, I would like to thank my main supervisor Associate Professor
Benedek Gy. Plósz, who gave me the opportunity to conduct this research. I
appreciate his enthusiasm, ambitious ideas, and his constant availability and
support. I also want to thank Professor Peter Steen Mikkelsen for his holistic
perspectives and critical point of view that always pulled me back to the main
research objectives through his challenging questions.
I would like to thank the SEWPROF project for providing the funding for this
work. In this European project, I had the pleasure of meeting and working
with many people, not only as project partners, but also as friends. I had a
great time with them during the training courses, project meetings, and se-
condments.
Working at DTU environment was one of the most spectacular experiences of
my life. I had the opportunity to work, and importantly, make friendships
with people with more than 20 nationalities. To begin with, I would like to
thank my colleagues and friends in the research group. Especially, I want to
thank my sister Elham, for all her motivation and the encouragement that I
needed. Also, Fabio, with a great sense of responsibility and dedication, has
been a savior who always had my back. Thanks to Borja for all the discus-
sions we had in our office. He was always there no matter how tight the situa-
tion was. I appreciate all the kindness of Dorottya, who never says no if you
need help. I enjoyed the company of Elena, not only for all the discussions
we had on biofilms but also her great and fun company. I also appreciate my
former colleague Pau. Very special thanks to Andreas for his great precision
and dedication during his Master thesis. A major experimental result of this
thesis wouldn’t be possible without his help.
I also want to thank my friends and colleagues at DTU Environment and out-
side, Pauly, Carson, Uli, Kos, Mike, Maziar, Sina, Yalda, Mohammad, Narg-
es M., Aiga, Manfred, Ramona, Jane, Will, Elena P.R., Arnaud, Arda, Carlos,
Bentje, Luca L. Luca V., Ehsan, Raphael, Alberto, Tonio, Marta, Bas, Palo-
mo, Xavier, Alex, Gizem, Yoshi, Jan, Fynn, Marie, Helene, Malene, Christi-
na, Klaus, Katerina, Melanie, Ioannis, Florian, Carina, Rikke, Narges A. and
my brother Danial.
My final thanks goes to my mum and dad, just for being there, even on the
phone. They are truly the co-authors of this thesis.

vi

The end
The reverse story of
Wastewater-based epidemiology

viii
ix
Summary
With increasing consumption of illicit drugs, in particular cocaine and canna-
bis, in recent decades, the negative social and public health impact has also
propagated. Following drug consumption and human metabolism, fractions of
unchanged parent drugs and metabolites are excreted into toilets. After
transport in sewers, these chemicals enter wastewater treatment plants
(WWTPs). Monitoring campaigns are normally performed at WWTP influent
to collect representative samples. Following quantitative chemical analysis,
measured drug loads are used to estimate population-normalized parent drug
consumption based on a candidate biomarker (the parent drug itself or one of
the human metabolites). This approach has gained increasing attention in the
past decade and is termed wastewater-based epidemiology. It has been shown
that this emerging approach can improve and complement survey-based
methods.
Sewer systems can be considered as biological reactors, in which the concen-
tration of organic chemicals present in wastewater can be impacted by in-
sewer processes during hydraulic residence time. Illicit drug biomarkers, as
trace organic chemicals in the range of nanograms to micrograms per liter,
are subject to physical, chemical or biological processes in sewers (fate pro-
cesses). The occurrence of these processes may lead to significant change of
drug loads at WWTP influent compared to source release points. Therefore,
not accounting for these variations may negatively affect drug use estimates.
However, due to a lack of sufficient evidence on potential in-sewer sorption
and transformation of drug biomarkers, these processes are often neglected
by wastewater-based epidemiologists. The motivation of this thesis was to
overcome this substantial knowledge gap by: (i) providing new evidence on
sorption and transformation of drug biomarkers in raw wastewater and sewer
biofilms; and (ii) developing modelling tools – by combining and extending
existing modelling frameworks – to predict such processes. To achieve this
goal, a substantial part of this thesis was dedicated to the experimental as-
sessment and modelling of in-sewer processes by means of laboratory scale
studies under the conditions representative to sewer systems. Eventually, the
prediction of in-sewer processes at the catchment level was carried out and
back-calculation of drug consumption was performed using measured data
from a monitoring campaign.
Overall, the methodology used in this thesis combined different aspects,
namely: (i) optimal experimental design; (ii) mathematical formulation of
processes; (iii) model calibration; (iv) uncertainty analysis and model param-
x
eters identifiability; (v) model validation; and (vi) model application for
back-calculation at catchment level. In this thesis, 16 drug biomarkers were
selected based on their ubiquitous occurrence in wastewater, and include co-
caine, mephedrone, methadone, heroin, codeine and tetrahydrocannabinol
(THC) and their respective major human metabolites.
In-sewer processes, namely, sorption and transformation of these chemicals
were assessed in raw wastewater (suspended biomass) and sewer biofilms in
targeted batch experiments. These experiments were conducted under aerobic
and anaerobic conditions. Annular rotating biofilm reactors were used to
simulate shear conditions prevailing in sewers and were operated over 14
months. Abiotic transformation (e.g., hydrolysis) was also evaluated using
mineral water and sorption to suspended solids and biofilms were additional-
ly assessed. Overall, two sets of experiments were performed and used for
model calibration and model validation purposes.
To predict the fate of drug biomarkers in raw wastewater, simultaneous eval-
uation and modelling of substrate utilization and microbial growth processes
was performed. It was hypothesized that active biomass dynamics during
batch experiments (due to high substrate availability and significant microbial
growth) can significantly impact the prediction of biotransformation rates.
For this purpose, the Wastewater Aerobic/anaerobic Transformations in Sew-
ers (WATS) model was combined with the Activated Sludge Model for Xe-
nobiotics (ASM-X) to predict the fate of drug biomarkers together with the
primary metabolic processes. Two new processes were considered, namely
sorption-desorption to reactor wall and abiotic transformation. As for sewer
biofilms, the extended ASM-X model was further modified by accounting for
diffusive mass transfer limitation of biomarkers from the bulk phase into the
biofilms and within the biofilm matrix.
Selected model parameters were estimated with the Bayesian optimization
method DREAM(ZS). A calibration methodology was developed with focus on
uncertainty propagation among model parameters, e.g. from abiotic transfor-
mation rates to biotransformation rates. Subsequently, uncertainty analysis
was performed to assess the impact of variability of model parameters on
model output. Moreover, different transformation pathways were tested for
the selected biomarkers and new pathways were identified based on mass
balance, uncertainty analysis, and feasibility of transformations (according to
an existing pathway database). Results from the experimental and modelling
assessment indicated that by ignoring primary metabolic processes in raw
wastewater would impose significant overestimation (up to 385%) of trans-
xi
formation rates under aerobic conditions, whereas no difference was found
under anaerobic conditions. Abiotic transformation processes were the domi-
nant removal mechanism for many of the selected chemicals (e.g., cocaine:
80-100%, batch experiments with raw wastewater) under both aerobic and
anaerobic conditions. Several biomarkers underwent substantial biotransfor-
mation e.g., almost complete removal of heroin and morphine-3-glucuronide
after 12 h in batch experiments with raw wastewater. It was further observed
that sewer biofilms can enhance biotransformation of a number of selected
chemicals, such as benzoylecgonine and 6-monoacetylmorphine. Overall, re-
dox conditions were found to have an influence on biotransformation rates
(especially for methadone) and, to a lesser extent, on abiotic transformation
rates. Only a few chemicals, such as 11-hydroxy-THC, were found to sorb
onto suspended solids and sewer biofilms. Validation of calibrated models
with an independent dataset was successful for most compounds, the main
exception being methadone under aerobic conditions.
To demonstrate the impact of in-sewer processes on estimation of daily drug
use at catchment level, a generic scenario analysis was performed to assess
the uncertainties associated with in-sewer processes and sampling. It was
found that ignoring in-sewer processes for cocaine and its metabolite ben-
zoylecgonine can add up to 11% (median value for a large catchment) error
in daily cocaine consumption estimates. This error was 43% and 11% for es-
timates of daily heroin use with 6-monoacetylmorphine and morphine as can-
didate biomarkers, respectively. In contrary, sampling error (flow-
proportional sampling mode) was the highest in the smallest catchment – up
to 17% for cocaine.
Subsequently, measured cocaine and benzoylecgonine loads from a 2-week
monitoring campaign at the Lynetten WWTP influent (Copenhagen, Den-
mark) was used to estimate cocaine consumption in two upstream catchments
by accounting for in-sewer fate processes. Significant differences in con-
sumption trends were observed between weekdays, weekends, holidays and a
street music festival. On average, twice as high cocaine consumption was
found during festival period as compared to normal weekdays. Wastewater-
based epidemiology is a truly interdisciplinary approach in which engineering
tools, including models developed and tested in this thesis, can be beneficial
for the accurate estimation of drug consumption in urban areas.
xii
Dansk sammenfatning
Med et stigende narkotikaforbrug gennem de seneste årtier, særligt af kokain
og cannabis, er også fulgt en stigning i negative sociale og folkesundheds
påvirkninger. Efter indtagelse af et narkotikum og metabolisme i kroppen vil
rester af stoffet blive udskilt, delvist som det uændrede aktivstof og delvist i
form af forskellige nedbrydningsprodukter. Stofferne udskilles typisk via uri-
nen og transporteres derefter via kloaksystemet til et rensningsanlæg. Over-
vågningskampagner tager typisk udgangspunkt i målinger ved indløbet til
rensningsanlægget, hvor man efter kvantitativ kemisk analyse kan estimere
forbruget af et givent narkotikum i oplandet. Forbruget vil da være baseret på
koncentrationen af en biomarkør (aktivstoffet selv eller dets nedbrydnings-
produkter) i det urensede spildevand. Denne metode kaldes spildevandsbase-
ret epidemiologi og har opnået stigende opmærksomhed i det seneste årti. Det
er blevet påvist, at metoden kan forbedre og supplere spørgeundersøgelser.
Kloaksystemer kan ses som biologiske reaktorer, hvor koncentrationsniveauet
af spildevandets organiske kemikalier påvirkes af forskellige processer i løbet
af den hydrauliske opholdstid. Biomarkører fra ulovlig narkotika, såsom
sporstoffer fra organiske kemikalier i nanogram/L og microgram/L niveau,
undergår fysiske, kemiske og biologiske processer i kloaksystemet. Disse
processer kan medføre, at der er signifikant forskel på koncentrationsniveauet
i indløbet til rensningsanlægget sammenlignet med koncentrationsniveauet
ved udledningspunktet. Hvis der ikke tages højde for disse variationer, vil det
betyde at forbruget af stoffer i oplandet underestimeres. På grund af mang-
lende viden overses potentielle sorptions- og omdannelsesprocesser i kloak-
systemer ofte af eksperter indenfor spildevandsbaseret epidemiologi. Motiva-
tionen for denne afhandling var derfor at dække en del af dette store videns-
hul ved (i) at finde nye vidnesbyrd om sorption og transformation af narkoti-
kum-biomarkører i råt spildevand samt i kloakkernes biofilm; og (ii) at ud-
vikle modelværktøjer til at forudsige sådanne processer ved at kombinere og
udvide eksisterende modelleringsprogrammer. En væsentlig del af denne af-
handling var dedikeret til eksperimentel undersøgelse og modellering af pro-
cesser i kloaksystemer ved hjælp af laboratorieskala forsøg under forhold der
er repræsentative for kloaksystemer. Endeligt blev bestemmelsen af processer
i kloaksystemet på oplands-niveau og beregningen af narkotikaforbrug udført
og evalueret ved brug af måledata fra en overvågningskampagne.
Den metode, der anvendes i denne afhandling, kombinerer forskellige aspek-
ter: (i) optimalt eksperimentelt design; (ii) matematisk formulering af proces-
ser; (iii) model kalibrering; (iv) statistisk analyse, såsom usikkerhedsanalyse
xiii
og identifikation af modelparametre; (v) modelvalidering; og (vi) anvendelse
af de udviklede modeller til beregning af narkotika forbrug på oplands-
niveau. I denne afhandling blev seksten narkotika-biomarkører valgt baseret
på deres udbredte brug og deraf følgende høje forekomst i spildevand. Blandt
stofferne var kokain, mephedron, metadon, heroin, kodein og tetrahydrocan-
nabinol (THC) samt deres respektive nedbrydningsprodukter.
Processer i kloakken, især sorption og transformation af disse kemikalier blev
vurderet i råt spildevand (suspenderet biomasse) og kloak biofilm i målrette-
de batch eksperimenter. Disse eksperimenter blev udført under aerobe og
anaerobe forhold. Ringformede roterende biofilm reaktorer blev brugt til at
simulere forskydnings forhold i kloakker og eksperimentet kørte i 14 måne-
der. Den abiotiske omdannelse (fx hydrolyse) af disse stoffer blev bestemt
ved brug af mineralvand, og sorption til suspenderet faststof og biofilm blev
endvidere bestemt. To sæt af eksperimenter blev udført og anvendt til model
kalibrering of model validering.
Med henblik på at forudse skæbnen af narkotika-biomarkører i urenset spil-
devand blev der udført sideløbene evaluering og modellering af substratoptag
og mikrobiel vækst. Hypotesen var, at aktive biomassedynamikker under
batchforsøg (grundet høj tilgængelighed af substrat og betydelig mikrobiel
vækst) kan påvirke forudsigelsen af biotransformationsrater signifikant. Med
dette formål blev modellen “Wastewater Aerobic/anaerobic Transformations
in Sewers” (WATS) kombineret med modellen ”Activated Sludge Model for
Xenobiotics” (ASM-X) til at bestemme skæbnen af narkotika-biomarkører
samt de primære metaboliske processer. To nye processer blev taget i be-
tragtning; nemlig sorption-desorption til reaktorens vægge samt abiotisk om-
dannelse. For biofilm blev den udvidede ASM-X model yderligere ændret til
at tage højde for diffusive begrænsninger for massetransport af narkotika-
biomarkører fra bulk fasen til biofilmen samt inde i biofilmen.
Udvalgte modelparametre blev estimeret ved hjælp af den Bayesianske opti-
meringsmetode DREAM(ZS). En kalibreringsmetode blev udviklet med fokus
på spredningen af usikkerheder blandt modelparametre, f.eks. fra abiotiske til
biotiske omdannelsesrater. Efterfølgende blev en usikkerhedsanalyse udført
med henblik på at bestemme effekten af variabilitet i modelparametre på mo-
dellens output. Ydermere blev forskellige omdannelsesveje testet for udvalgte
biomarkører, og nye veje blev identificeret baseret på massebalancer, usik-
kerhedsanalyse og vurdering af mulige omdannelsesveje (baseret på en eksi-
sterende database).

xiv
Resultater fra de eksperimentelle - og modelbaserede evalueringer indikerer,
at udeladelse af primære metabolske processer i urenset spildevand vil med-
føre en betydelig overestimering (op til 385%) af omdannelsesrater under ae-
robe forhold, mens ingen forskel blev funder for anaerobe forhold. Abiotiske
transformationsprocesser var den dominerende mekanisme for fjernelse af
mange af de udvalgte kemikalier (såsom kokain: 80-100%, batch forsøg med
råt spildevand) under både aerobiske og anaerobiske forhold. Mange af de
udvalgte kemikalier undergik betydelig biotransformation, f.eks.blev heroin
og morfin-3-glucoronide næsten fuldstændig omsat i 12 timers batch forsøg
med råt spildevand. Det blev yderligere observeret, at kloakkernes biofilm
kan forstærke biotransformation af mange udvalgte kemikalier såsom ben-
zoylecgonine og 6-monoacetylmorfin. Overordnet viste redoxforholdene sig
at have stor indflydelse på biologiske omdannelsesrater (særligt for metadon)
og i mindre grad på abiotiske omdannelsesrater. Kun for nogle få kemikalier,
såsom 11-hydroxy-THC, blev der observeret væsentlig sorption til suspende-
rede stoffer og biofilm. Validering af de kalibrerede modeller med uafhængi-
ge data var succesfuld for de fleste stoffer, med metadon som den vigtigste
undtagelse under aerobe forhold.
For at demonstrere effekten af processer i kloaksystemer på estimation af det
daglige narkotikaforbrug på oplandsniveau blev en generisk scenarieanalyse
udført, med fokus på at bestemme usikkerheden forbundet med processer i
kloaksystem og prøvetagningen. Ved at se bort fra processer i kloakken for
kokain og dets stofskifteprodukt benzylecgonine kan fejl opstå på op til 11%
i estimater af det daglige kokain forbrug (median værdi for et stort opland).
Denne fejl var på henholdvis 43% og 11% for estimater af det daglige kokain
forbrug ved brug af 6-monoacetylmorfin og morfin som kandidat biomarkø-
rer. I modsætning hertil var effekten af fejl i prøvetagningen (flow proportio-
nal metode) størst for små oplande , helt op til 17% for kokain.
Efterfølgende blev målinger af kokain- og benzoylecgonine-belastningen
gennem en to-ugers overvågningskampagne ved indløbet til Lynetten rens-
ningsanlæg (København, DK) anvendt til at estimere kokainforbruget i to op-
strøms oplande ved samtidig at tage højde for omdannelsesprocesserne i klo-
akken. Der blev observeret betydelige forskelle i udviklingen i forbruget mel-
lem ugedage, weekender og helligdage Det gennemsnitlige forbrug af kokain
i forbindelse med en gademusikfestival var dobbelt så stort som på normale
arbejdsdage. Spildevandsbaseret epidemiologi er en interdisciplinær arbejds-
metode, hvor ingeniørmæssige beregninger, herunder modellerne udviklet og
afprøvet i denne afhandling, kan forbedre præcisionen af narkotika forbruget
i byområder.
xv
Table of contents
Preface ............................................................................................................ i
Acknowledgements ....................................................................................... v
Summary ...................................................................................................... ix
Dansk sammenfatning ................................................................................ xii
Table of contents ........................................................................................ xv
1 Introduction ............................................................................................. 1
1.1 Background .................................................................................................. 1
1.2 Motivation of the study ................................................................................. 3
1.3 Research objectives ...................................................................................... 4
1.4 Overview of methodology ............................................................................ 6
2 Processes in sewer systems ..................................................................... 9
2.1 Sewer characteristics .................................................................................... 9
2.2 Design and operation .................................................................................. 10
2.3 Transport processes .................................................................................... 11
2.4 Fate processes ............................................................................................. 12
2.5 Modelling approaches ................................................................................. 14
3 Sampling and quantification of drug biomarkers in wastewater ....... 23
3.1 Representative sampling ............................................................................. 23
3.2 Quantitative chemical analysis .................................................................... 25
4 Fate model identification ...................................................................... 29
4.1 Experimental design ................................................................................... 29
4.2 Model structure ........................................................................................... 32
4.2.1 Physico-chemical processes ......................................................................... 32
4.2.2 Biological processes .................................................................................... 34
4.2.3 Mass transfer by diffusion ........................................................................... 36
4.2.4 Transformation pathways ............................................................................ 37
4.3 Model calibration ........................................................................................ 39
4.4 Model validation ......................................................................................... 45
5 Monitoring campaigns .......................................................................... 47
6 Estimation of drug use in catchments .................................................. 51
7 Conclusion ............................................................................................. 55
8 Future perspectives ............................................................................... 59
9 References .............................................................................................. 61
10 Papers .................................................................................................... 70

xvi
1
1 Introduction
1.1 Background With the increase of drug consumption in recent decades, in particular co-
caine and cannabis, the social impact on society has also propagated
(EMCDDA, 2015a). These consequences include rising healthcare costs,
crime rates, and economic losses. Therefore, it is imperative that policy mak-
ers gain knowledge of the trends, usage levels, hot spots, and overall preva-
lence of illicit drug consumption, in order to develop proper prevention cam-
paigns and effective intervention strategies.
Estimation of drug use at the population level is traditionally performed
mainly via socio-epidemiological methods, such as population surveys and
seizure data. These data are subject to significant uncertainties in measure-
ment and selection, for example, self-reporting bias from false reports, una-
ware or misinformed consumers, and limited population coverage of the
study (Banta-Green and Field, 2011; Castiglioni et al., 2014).
A new concept to assess collective drug consumption, based on measuring
concentrations of illicit drugs and their excreted human metabolites in un-
treated sewage, was proposed by Daughton et al. (2001). The technique is
based on the principle that excreted drug residuals in the sewage can be col-
lected by the downstream end of urban drainage systems and subsequently
analysed. Later, this approach, termed wastewater-based epidemiology
(WBE), was applied by Zuccato et al. (2005) in several Italian cities. Levels
of illicit drugs (parent compounds or metabolites) in wastewater can be used
to back-calculate the total consumption of drug of abuse by the population
served by a particular wastewater treatment plant (WWTP). Therefore,
wastewater analysis was found to overcome some of the inherent limitation of
survey-based methods, by providing evidence-based and objective estimates.
Sampling campaigns for the purpose of detection of excreted drug residuals
(drug biomarkers) are usually performed at the inlet to WWTPs. There have
been many studies to monitor temporal and spatial patterns of drug use in se-
lected urban sewer catchments (Castiglioni et al., 2013; Gomes et al., 2009;
Plósz et al., 2013); allowing, more recently, for the undertaking of interna-
tional comparative studies (Ort et al., 2014; Thomas et al., 2012). These find-
ings demonstrated that wastewater analysis techniques have the potential to
complement conventional surveillance data. Estimation of drug use via
wastewater analysis has been further expanded to include monitoring during
2
special events (e.g. music festivals) (Gerrity et al., 2011; Lai et al., 2013), as
well as within smaller communities (e.g. fitness centers or prisons) (Postigo
et al., 2011; Schröder et al., 2010). Despite the claim for protection of ano-
nymity and non-intrusive approaches, various ethical concerns and debates
have been raised with regards to the privacy of individuals and how far up-
stream one can perform monitoring in this way (Hall et al., 2012).
Estimation of drug use via wastewater analysis consists of several consecu-
tive steps (Castiglioni et al., 2014) which allow researchers to back-calculate
the parent drug consumptions, based on observations of the drug or its human
metabolites at a sampling point:
1. As first step, representative sampling techniques are used to collect
raw wastewater. Since the occurrence of drug biomarkers in the sewer
exhibits high dynamics, a suitable sampling strategy should be able to
capture short term variations of drug loads. Different sampling guide-
lines for trace organics have been suggested for daily composite sam-
pling (Ort, 2014; Ort et al., 2010c).
2. Following sample preparation e.g. concentrating and isolating the ana-
lytes of interest via solid phase extraction (SPE), wastewater samples
are qualitatively and quantitatively analyzed by a chromatographer
coupled to a mass analyzer e.g. liquid chromatography-mass spectros-
copy (LC-MS/MS). The challenges and the analysis techniques are re-
ported in most WBE studies (Bijlsma et al., 2013; Gheorghe et al.,
2008; Pinhancos et al., 2011). In this step, the stability of drug bi-
omarkers during sample handling, known as in-sample stability should
be further considered (e.g. Baker & Kasprzyk-Hordern 2011;
Castiglioni et al. 2006).
3. The amount of drug residuals detected at the treatment plan (e.g. g d-1
)
is then calculated from the quantified concentration, based on the aver-
age wastewater flowrate to the WWTP.
4. The total daily drug load is then estimated based on a candidate bi-
omarker which fulfils several requirements, i.e. it is excreted in con-
sistent amounts in urine, detectable and stable in wastewater, and is
present in sewers only due to human excretion (Castiglioni et al.,
2016). Estimation should involve a correction factor which includes
the excretion ratio and molecular mass ratio of parent to candidate bi-

3
omarker (Gracia-lor et al., 2016; Lai et al., 2012; van Nuijs et al.,
2011; Zuccato et al., 2008).
5. Total daily drug consumption is then normalized to the population size
so the data can be compared with the results from other geographical
areas. Estimation of the population size that actually contributed to the
wastewater sample is very challenging. Although census data are most
widely used, these estimations based on a single day may not have a
high reliability. Other methods such as estimates based on the loads of
specific chemicals e.g. cotinine (metabolite of nicotine) or pharmaceu-
ticals are also proposed (Chen et al., 2014; Lai et al., 2015). Based on
estimation on the average consumed dose, drug consumption estimates
are also reported as dose per capita per day.
1.2 Motivation of the study In the commonly applied methodological steps in WBE studies, it is assumed
that a candidate biomarker does not undergo a significant transformation dur-
ing its in-sewer transport time. This general assumption is however not accu-
rate for many of chemicals. For example, benzoylecgonine, BE (a major hu-
man metabolite of cocaine, COC) that is widely used as a candidate bi-
omarker to back-calculate COC consumption, is reported to actually form
considerably from hydrolysis of cocaine in raw wastewater (Bisceglia et al.,
2012). Other studies also found transformation of 6-monoacetylmorphine,
6MAM (a candidate biomarker for heroin, HER) in raw wastewater (van
Nuijs et al., 2012) as well as in sewer biofilms (Thai et al., 2014). These stud-
ies demonstrated that many of commonly accepted candidate drug biomarkers
undergo in-sewer transformation. The importance of accounting for in-sewer
processes in back-calculation methods is demonstrated (Plósz et al., 2013).
As opposed to in-sample stability only few studies assessed transformation of
illicit drug biomarkers in the sewer (in-sewer stability) (Bisceglia et al.,
2012; McCall et al., 2016; Plósz et al., 2013; Senta et al., 2014). In fact, the
sewer network is not only a system of collection and conveyance of
wastewater, but also a bioreactor for chemical and microbial transformations
(Hvitved-Jacobsen et al., 2002). Wastewater composition at the WWTP influ-
ent is impacted by the design features and the operation conditions of the
sewer system leading to alteration of organic matter during the sewer hydrau-
lic residence time (Nielsen et al., 1992). Consequently, illicit drug bi-
omarkers, as trace organic chemicals, can be influenced by physico-chemical
and biological processes (fate processes) in the sewer. Ignoring the fate of
4
illicit drugs in the sewer may lead to significant under,- or over-estimation of
drug consumption estimates in wastewater-based epidemiological studies.
Therefore it is important to develop models that can be used to predict in-
sewer transformation of drug biomarkers, which eventually will lead to more
accurate estimation of drug consumption.
1.3 Research objectives This thesis aims to provide a systematic procedure for model identification of
in-sewer fate processes for illicit drug biomarkers. To this end, a variety of
tools and methodologies have been used such as, experimental assessments,
analytical procedures, modeling frameworks and statistical analyses. The re-
search outcomes were then applied in the context of wastewater-based epi-
demiology where an objective assessment using uncertainty analysis was
added to the conventional methods. Fig. 1.1 illustrates the research focus are-
as of this thesis. The main research objectives of this thesis are:
i. To experimentally assess in-sewer chemical and biological transfor-
mation and partitioning processes for selected illicit drug biomarkers
under environmentally relevant conditions prevailing in sewer systems.
Various experiments were performed in batch mode to investigate fate
processes and biological activities in raw wastewater (suspended bio-
mass) and sewer biofilms (Paper I and III).
ii. To develop mathematical models and evaluate different model struc-
ture to predict transformation of illicit drug biomarkers in raw
wastewater and sewer biofilms (Paper I and III).
iii. Calibration of chemical pathway models combined with reaction kinet-
ics using heroin drug biomarkers as an example. This includes the reli-
able propagation and prediction of uncertainty for drug transformation
rates according to their transformation pathways. The methodology
was assessed with parameter correlation analysis and compared with
other common estimation methods (Paper II).
iv. To objectively assess the uncertainty associated with neglecting in-
sewer processes as compared to uncertainty in sampling via a model-
based approach at the catchment level. This includes generation of
short-term variations of drug loads based on stochastic sewer inputs.
(Paper IV).
5
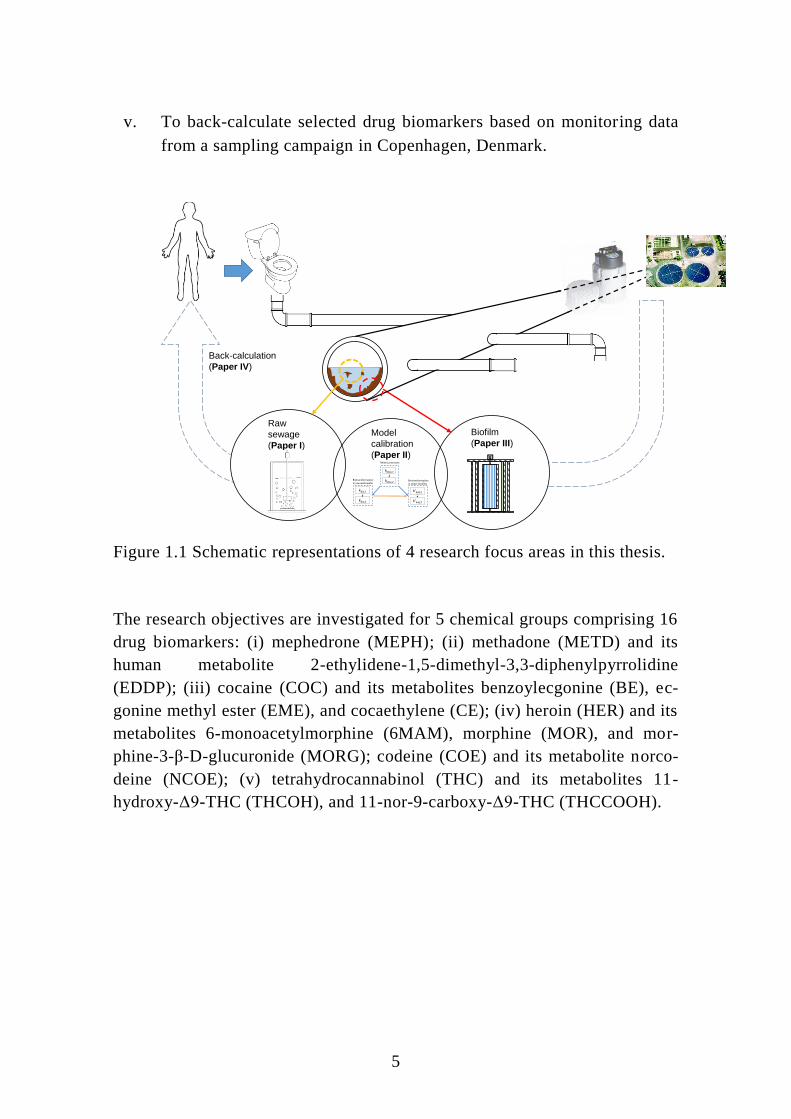
v. To back-calculate selected drug biomarkers based on monitoring data
from a sampling campaign in Copenhagen, Denmark.
Figure 1.1 Schematic representations of 4 research focus areas in this thesis.
The research objectives are investigated for 5 chemical groups comprising 16
drug biomarkers: (i) mephedrone (MEPH); (ii) methadone (METD) and its
human metabolite 2-ethylidene-1,5-dimethyl-3,3-diphenylpyrrolidine
(EDDP); (iii) cocaine (COC) and its metabolites benzoylecgonine (BE), ec-
gonine methyl ester (EME), and cocaethylene (CE); (iv) heroin (HER) and its
metabolites 6-monoacetylmorphine (6MAM), morphine (MOR), and mor-
phine-3-β-D-glucuronide (MORG); codeine (COE) and its metabolite norco-
deine (NCOE); (v) tetrahydrocannabinol (THC) and its metabolites 11-
hydroxy-Δ9-THC (THCOH), and 11-nor-9-carboxy-Δ9-THC (THCCOOH).
Biofilm
(Paper III)Model
calibration
(Paper II)
Raw
sewage
(Paper I)
Back-calculation
(Paper IV)
kabio,1
kabio,2
k’biof,1
k'biof,2
kbio,1
kbio,2
Abiotic processes
Biotransformation in raw wastewater
Biotransformation in sewer biofilms
6
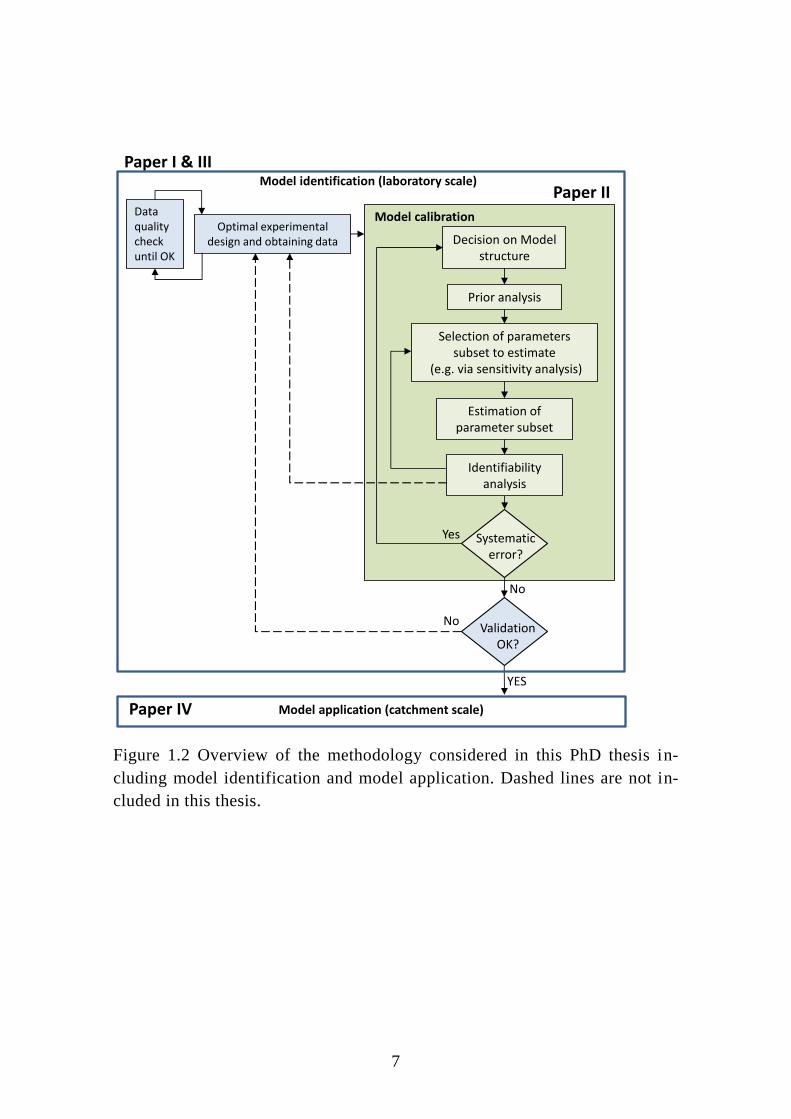
1.4 Overview of methodology Fig. 1.2 shows the systematic procedure applied to achieve the objectives in
this thesis. This procedure involves model identification and model applica-
tion. Model identification is a process that includes identification of a suitable
model structure and unique estimates of model parameters.
First, based on the framework and objectives of the study, relevant experi-
ments are designed and data are collected. Data quality must be assured either
by repeating experiments or by replicating chemical analysis and data pro-
cessing. Eventually, a suitable mathematical model structure is formulated
based on experimental data and available modeling frameworks for model
calibration. In prior analysis, model parameters are initially set as default
values (in case of previous estimations by other studies). If the simulation
results do not adequately predict the experimental data, e.g. the deviation (re-
siduals) is significant, a selection of parameter subset – chosen based on sen-
sitivity analysis or expert knowledge – is considered for estimation. If the
parameters are not identifiable based on available criterion in literature, a
new parameters subset is chosen. Subsequently, if a significant and systemat-
ic deviation is observed, the structure of the model is modified. Alternatively,
new experiments should be conducted in case of identifiability problem (not
part of this thesis).
Once both model structure identification and the subsequent calibration is
successful, model validation should be assured by testing the model predic-
tion against an independent dataset. The validated model is then reliably used
for application.
In this PhD thesis, experimental assessments and model formulations were
performed for laboratory scale studies, whilst model application was con-
ducted at catchment level. Model application involves back-calculation of
daily drug consumption based on monitoring data of WWTP influent.
7
Figure 1.2 Overview of the methodology considered in this PhD thesis in-
cluding model identification and model application. Dashed lines are not in-
cluded in this thesis.
Optimal experimental design and obtaining data
Data quality check until OK
No
Prior analysis
Selection of parameters subset to estimate
(e.g. via sensitivity analysis)
Estimation of parameter subset
Identifiability analysis
YES
No
Paper II
Paper I & III
Decision on Model structure
Systematicerror?
ValidationOK?
Model application (catchment scale) Paper IV
Yes
Model identification (laboratory scale)
Model calibration

8
9
2 Processes in sewer systems
2.1 Sewer characteristics Sewer systems are primarily designed to collect and convey wastewater from
households and industries as well as runoff water from precipitation to stor-
age tanks (e.g. retention basins), treatment and disposal facilities (e.g.
WWTPs). The ultimate goal of this collection system is to maintain public
hygiene and also prevent flooding. It consists of a network of pipes with a
number of infrastructures such as manholes, valves, pumps and overflow
weirs. In addition to transport mechanism in the sewer, sewer systems can
also be considered as bioreactors where the organic matter can undergo sig-
nificant alterations (Hvitved-Jacobsen et al., 2002; Warith et al., 1998). These
alterations influence the interaction between the sewer and the subsequent
treatment processes at the WWTP. Although urban drainage systems was not
traditionally considered as “biologically active systems” when designing the
sewer systems, there have been many studies on self-purification and the po-
tential of sewers for biological wastewater treatment since the 1970s
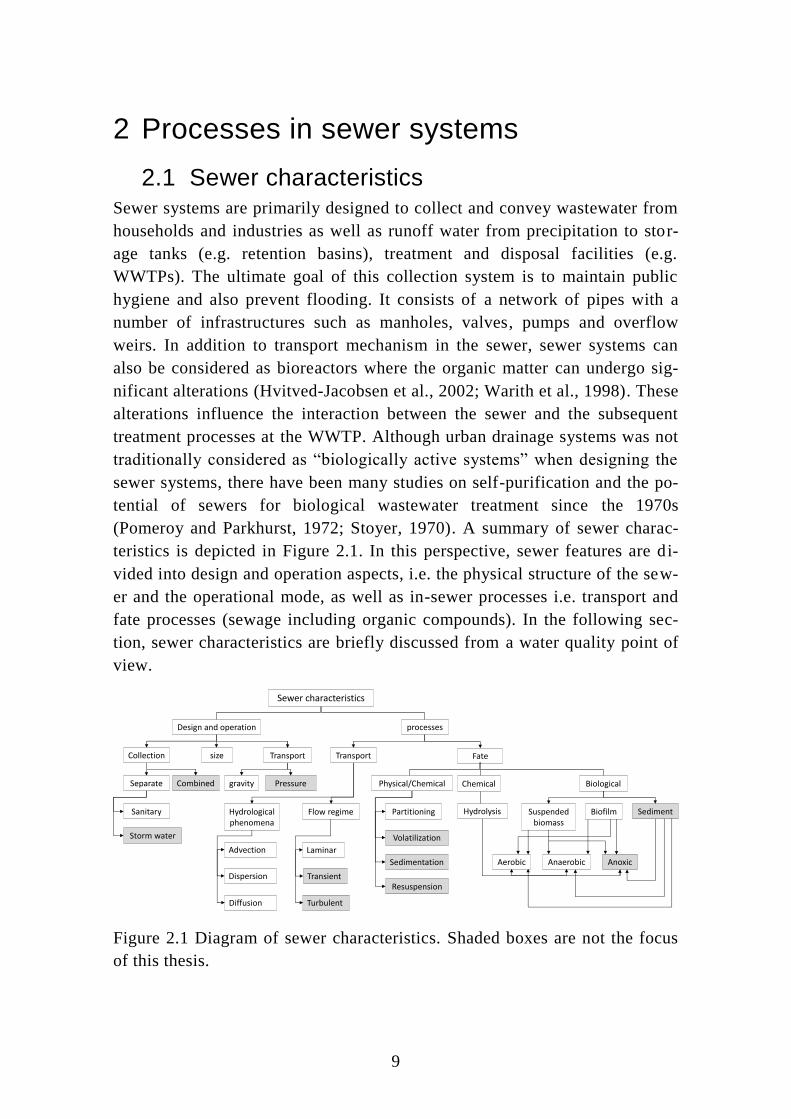
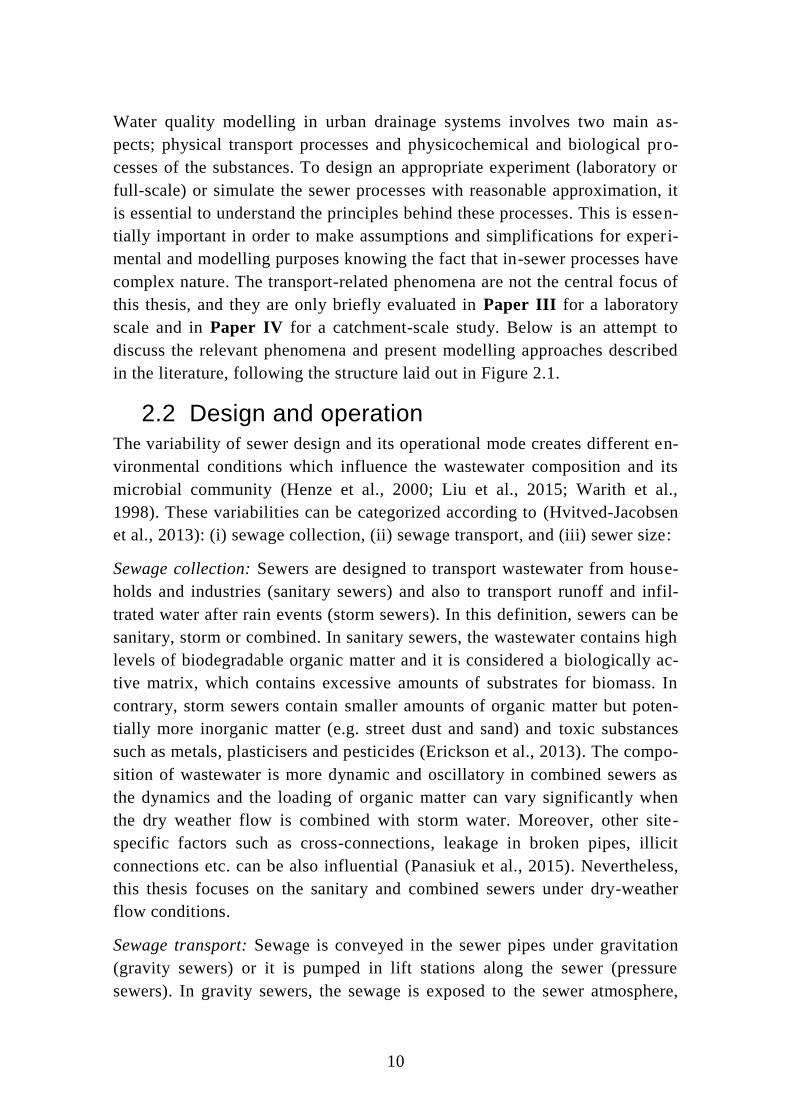
(Pomeroy and Parkhurst, 1972; Stoyer, 1970). A summary of sewer charac-
teristics is depicted in Figure 2.1. In this perspective, sewer features are di-
vided into design and operation aspects, i.e. the physical structure of the sew-
er and the operational mode, as well as in-sewer processes i.e. transport and
fate processes (sewage including organic compounds). In the following sec-
tion, sewer characteristics are briefly discussed from a water quality point of
view.
Figure 2.1 Diagram of sewer characteristics. Shaded boxes are not the focus
of this thesis.
Sewer characteristics
Design and operation processes
Collection size Transport
Separate Combined
Sanitary
Storm water
gravity Pressure Physical/Chemical Chemical Biological
Partitioning
Volatilization
Sedimentation
Resuspension
HydrolysisHydrological phenomena
Flow regime
Aerobic Anaerobic Anoxic
Laminar
Suspended biomass
Biofilm Sediment
Transport Fate
Turbulent
Transient
Advection
Dispersion
Diffusion
10
Water quality modelling in urban drainage systems involves two main as-
pects; physical transport processes and physicochemical and biological pro-
cesses of the substances. To design an appropriate experiment (laboratory or
full-scale) or simulate the sewer processes with reasonable approximation, it
is essential to understand the principles behind these processes. This is essen-
tially important in order to make assumptions and simplifications for experi-
mental and modelling purposes knowing the fact that in-sewer processes have
complex nature. The transport-related phenomena are not the central focus of
this thesis, and they are only briefly evaluated in Paper III for a laboratory
scale and in Paper IV for a catchment-scale study. Below is an attempt to
discuss the relevant phenomena and present modelling approaches described
in the literature, following the structure laid out in Figure 2.1.
2.2 Design and operation The variability of sewer design and its operational mode creates different en-
vironmental conditions which influence the wastewater composition and its
microbial community (Henze et al., 2000; Liu et al., 2015; Warith et al.,
1998). These variabilities can be categorized according to (Hvitved-Jacobsen
et al., 2013): (i) sewage collection, (ii) sewage transport, and (iii) sewer size:
Sewage collection: Sewers are designed to transport wastewater from house-
holds and industries (sanitary sewers) and also to transport runoff and infil-
trated water after rain events (storm sewers). In this definition, sewers can be
sanitary, storm or combined. In sanitary sewers, the wastewater contains high
levels of biodegradable organic matter and it is considered a biologically ac-
tive matrix, which contains excessive amounts of substrates for biomass. In
contrary, storm sewers contain smaller amounts of organic matter but poten-
tially more inorganic matter (e.g. street dust and sand) and toxic substances
such as metals, plasticisers and pesticides (Erickson et al., 2013). The compo-
sition of wastewater is more dynamic and oscillatory in combined sewers as
the dynamics and the loading of organic matter can vary significantly when
the dry weather flow is combined with storm water. Moreover, other site-
specific factors such as cross-connections, leakage in broken pipes, illicit
connections etc. can be also influential (Panasiuk et al., 2015). Nevertheless,
this thesis focuses on the sanitary and combined sewers under dry-weather
flow conditions.
Sewage transport: Sewage is conveyed in the sewer pipes under gravitation
(gravity sewers) or it is pumped in lift stations along the sewer (pressure
sewers). In gravity sewers, the sewage is exposed to the sewer atmosphere,
11
allowing for reaeration and exchange of volatile compounds. Aerobic condi-
tions in the bulk phase together with long residence time in gravity sewers
allows for reduction of biodegradable substrates and production of biomass.
In contrary, sewage in pressure sewers is transported with higher velocity and
possibly under anaerobic conditions favoring the conditions for anaerobic
activity of biomass.
Sewer size: Sewer systems consist of many interconnecting pipes covering an
area (catchment) from the most upstream part to the downstream regions
close to the WWTP. Pipes are designed with increasing diameter throughout
the system as they collect more wastewater. Sewer biofilms (attached micro-
bial communities on sewer walls) can potentially enhance microbial process-
es in the sewer (Huisman and Gujer, 2002).
2.3 Transport processes Flow in sewer pipes can fill the whole cross-section (pipe flow) or partially
fill the pipe (part-full pipe flow). The presence of these two flow types de-
pends on sewer (i.e. gravity or pressure) and the type of flow (dry- vs. wet-
weather flow). However the second flow type is the most common condition
in sewers: gravity-driven flow with free surface (Butler and Davies, 2004).
This implies that the redox conditions in the bulk liquid of the pipes are dom-
inated by aerobic conditions (favoring the conditions for aerobic hetero-
trophic biomass), an assumption that was considered at catchment scale in
Paper IV.
The flow regime in sewer pipes can be either laminar (e.g. in dry-weather
flow), turbulent (e.g. storm flow) or an in-between regime known as transi-
ent. In laminar flow, the water flows in parallel layers with no cross-current
among the layers. The velocity of water is at the minimum close to the pipe
wall due to the flow resistance (viscous effect) and reaches a maximum after
a specific length known as the boundary layer thickness. In a turbulent re-
gime, flow and pressure change chaotically and intense mixing occurs at the
microscopic scale. In this regime the flow velocity has a higher gradient close
to the wall (high drag force) and the boundary layer is unsteady. The average
flow velocity in laminar flow is defined at the average cross-sectional veloci-
ty profile. The impact of flow regime on the mass transfer of substances be-
tween the bulk liquid and the sewer biofilms is discussed in Paper III.
Transport of substances in the sewer can be explained by hydrodynamic phe-
nomena, defined as advection, diffusion and dispersion.
12
Advection is the process of transport of water and the substances with the
mean flow velocity. In this mode of flow, the flux vector for all substances in
the liquid phase is equal. In contrary, diffusion refers to the random motion
of compounds at the molecular scale and it is caused by concentration gradi-
ent due to unequal distribution of the compounds such as drug biomarkers. In
sewer systems, diffusion is also enhanced by mixing in manholes. Diffusion
depends on temperature, size of the compounds and viscosity of the fluid. In
addition, dispersion is caused by combined action of variation of velocity
over the cross section (e.g. pipe) and molecular diffusion causing the spread-
ing of the compounds (Taylor, 1953). Dispersion along the pipe can be calcu-
lated based on a dispersion coefficient that can be calculated based on ob-
served distribution of concentrations (Nordin and Troutman, 1980; Singh and
Beck, 2003). Dispersion can also result from deviation of the real flow field
from a one dimensional model. This deviation is known as numerical disper-
sion as simplified models cannot capture complex three dimensional fluid
profiles. In simulation tools, numerical dispersion can substitute real disper-
sion (Gujer, 2008). This is briefly discussed and demonstrated in Paper IV.
2.4 Fate processes The sewer is not a homogenous system and consists of different distinct
phases or compartments; wastewater; biofilm/sediment and sewer atmosphere
(in gravity sewers), Fig. 2.2. Wastewater components, such as soluble, col-
loidal and suspended matter, undergo different physical, chemicals and bio-
logical processes (fate processes) within each of the sewer phases. Although
the primary goal of this thesis is the fate assessment of drug biomarkers in the
sewer, their fate can be directly related to the primary metabolic processes
which include the biological activities relevant for utilization of organic
growth substrates and formation of biomass. Understanding the principles
behind these processes – and also other physical and chemical processes that
could indirectly impact the fate of drug biomarkers – would help to properly
design experiments and construct appropriate mathematical models.
Physical, chemical and biological processes, under the environmental condi-
tions prevailing in sewer systems, lead to alteration of organic compounds
and trace organics (e.g. drug biomarkers) during their transport time in the
sewer. Physical processes include volatilization, sedimentation/resuspension
as well as partitioning i.e. sorption/desorption to suspended solids and bio-
mass (a physico-chemical process); chemical processes can be in the form of
hydrolysis; and biological processes are microbially-mediated transfor-
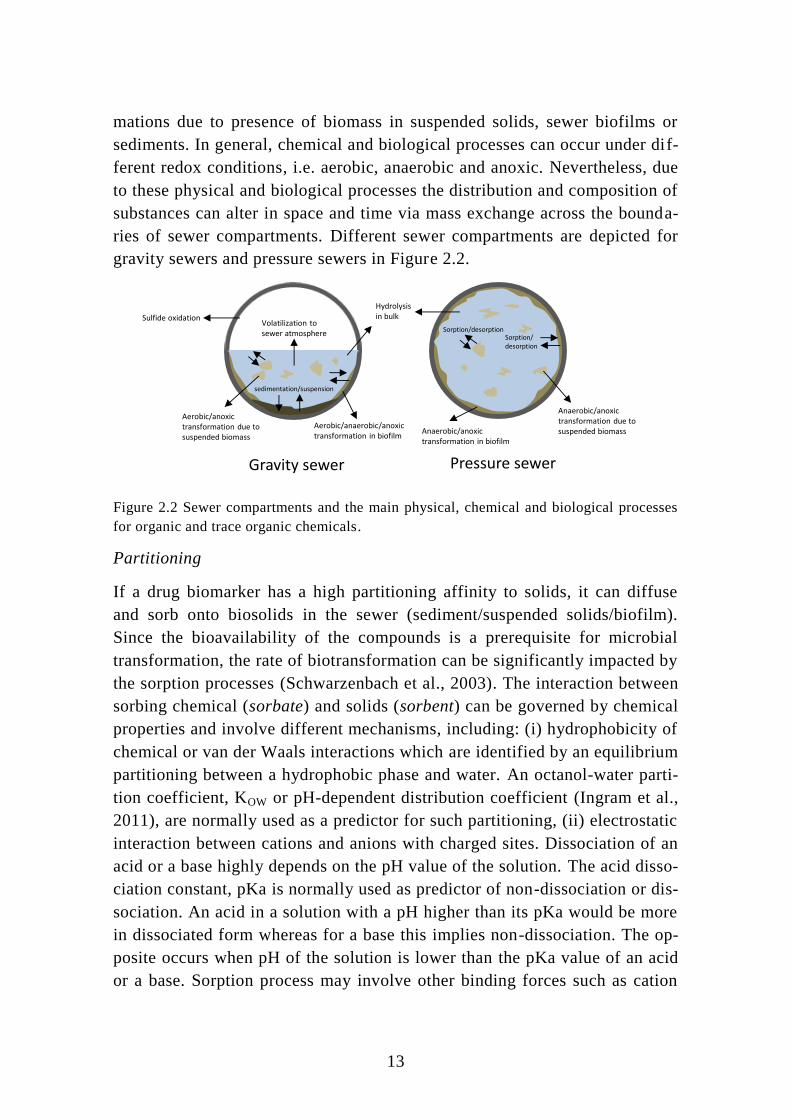
13
mations due to presence of biomass in suspended solids, sewer biofilms or
sediments. In general, chemical and biological processes can occur under dif-
ferent redox conditions, i.e. aerobic, anaerobic and anoxic. Nevertheless, due
to these physical and biological processes the distribution and composition of
substances can alter in space and time via mass exchange across the bounda-
ries of sewer compartments. Different sewer compartments are depicted for
gravity sewers and pressure sewers in Figure 2.2.
Figure 2.2 Sewer compartments and the main physical, chemical and biological processes
for organic and trace organic chemicals.
Partitioning
If a drug biomarker has a high partitioning affinity to solids, it can diffuse
and sorb onto biosolids in the sewer (sediment/suspended solids/biofilm).
Since the bioavailability of the compounds is a prerequisite for microbial
transformation, the rate of biotransformation can be significantly impacted by
the sorption processes (Schwarzenbach et al., 2003). The interaction between
sorbing chemical (sorbate) and solids (sorbent) can be governed by chemical
properties and involve different mechanisms, including: (i) hydrophobicity of
chemical or van der Waals interactions which are identified by an equilibrium
partitioning between a hydrophobic phase and water. An octanol-water parti-
tion coefficient, KOW or pH-dependent distribution coefficient (Ingram et al.,
2011), are normally used as a predictor for such partitioning, (ii) electrostatic
interaction between cations and anions with charged sites. Dissociation of an
acid or a base highly depends on the pH value of the solution. The acid disso-
ciation constant, pKa is normally used as predictor of non-dissociation or dis-
sociation. An acid in a solution with a pH higher than its pKa would be more
in dissociated form whereas for a base this implies non-dissociation. The op-
posite occurs when pH of the solution is lower than the pKa value of an acid
or a base. Sorption process may involve other binding forces such as cation
Volatilization to sewer atmosphere
sedimentation/suspension
Hydrolysisin bulk
Sorption/desorptionSorption/desorption
Aerobic/anaerobic/anoxic transformation in biofilm
Anaerobic/anoxic transformation in biofilm
Gravity sewer Pressure sewer
Anaerobic/anoxic transformation due to suspended biomass
Aerobic/anoxic transformation due to suspended biomass
Sulfide oxidation
14
exchange, surface complexation and hydrogen binding (Hyland et al., 2012;
Trapp et al., 2010) and may also be associated with multiple interactions e.g.
electrostatic interaction and surface complexation (Mackay and Vasudevan,
2012). Therefore, capturing a range of interactions between the chemicals and
solids may be required to improve the prediction accuracy (Polesel et al.,
2015; Sathyamoorthy and Ramsburg, 2013). Moreover, to simulate sorption
processes in biofilm, diffusion of sorbate to the biofilm should also be con-
sidered (Wicke et al., 2007).
Chemical Hydrolysis
Chemical bounds of organic matters in water might cleave off due to a chem-
ical reaction known as hydrolysis. By cleavage of a leaving group a new bond
is formed as H+ or OH-. Transformation of drug biomarkers is often possible
as these molecules usually have different functional groups and structural
moieties such as ester, amide, lactone etc. that are susceptible to cleavage in
water (Li, 2012). Beside the hydrolysis mechanism in neutral environments,
hydrolysis can be catalyzed by acids or basis. Chemical hydrolysis is relevant
for both primary substrates and drug biomarkers. It must be noted that chemi-
cal hydrolysis is different from enzymatic hydrolysis (breaking down large
organics to smaller components by enzymes).
Biological processes
Biological processes in the sewers follow a basic principle: removal of sub-
strates for anabolic (cellular growth) and catabolic (as energy source) reac-
tions. These processes are referred to as primary metabolic processes which
involve biomass growth and substrate utilization. The underlying concepts to
simulate these processes are similar to the ones applied for activated sludge
systems (Henze et al., 2000). Together with other organic chemicals trace
organics also undergo biological transformations leading to conversion to
other chemical structures. These processes are referred to as secondary meta-
bolic processes. These microbial processes are one of the focal points of this
thesis which are further discussed in this chapter.
2.5 Modelling approaches Sewer systems have very dynamic characters from both water quantity and
water quality perspectives. Modeling urban catchments involves generation
of dry weather flow and run off water as well as description of transport pro-
cesses for flowrate and pollutant load. Different modelling approaches are
15
extensively described in literature (Achleitner et al., 2007; Butler and
Graham, 1995; Rauch et al., 2002).
Sewer flow is commonly simulated either by a physically-based description
of flow using partial differential equations such as the Saint-Venant equation
e.g. in MOUSE–HD (Garsdal et al., 1995) or conceptual-based models for-
mulated as ordinary differential equations such as the tank-in-series approach
e.g. in CITYDRAIN (Achleitner et al., 2007). Besides such deterministic
models, the stochastic phenomena of sewer flow are also modelled by sto-
chastic differential equations in the stochastic grey-box modelling approach
(Breinholt et al., 2011). Moreover, mechanistic models based on advection-
dispersion principles with stochastic model inputs is also suggested (Ort et
al., 2005) to simulate stochastic load variations of trace chemicals such as
illicit drugs (Mathieu et al., 2011). This model was used in Paper IV.
Compared to sewer flow modelling, fewer studies have focused on water
quality modelling aspects. Water quality models received a major attention
after sewer modelers attempted to develop an integrated urban water system
model to combine sewer system and wastewater treatment into one model for
better management and control strategies (Bach et al., 2014; Meirlaen et al.,
2002; Olsson and Jeppsson, 2006; Rauch et al., 2002). Due to limited under-
standing of in-sewer chemical and biological processes, water quality models
have been applied to a limited extent (e.g. Benedetti et al., 2013). Different
models have been proposed to describe biological processes similar to exist-
ing models for treatment plants (Huisman and Gujer, 2002; Mourato et al.,
2003; Tanaka and Hvitved-Jacobsen, 1998). Although these models are de-
veloped to describe primary metabolic processes, there are also models that
include prediction of fate of trace organic chemicals and micropollutants
(Benedetti et al., 2013; Keyser et al., 2010; Lindblom et al., 2006; Snip et al.,
2014; Vezzaro et al., 2014). However, fate processes for trace organic chemi-
cals are often compound-specific and requires understanding the principles
behind sorption and transformation processes. A model identification proce-
dure is discussed in detail in chapter 4, for illicit drug biomarkers.
Primary metabolic processes:
As discussed earlier, wastewater in sewers consists of soluble and particulate
fractions. A biological modeling concept should include these two groups of
components and their relevant kinetic characteristics. In this perspective, the
traditional reporting on removal of biological oxygen demand (BOD) and
chemical oxygen demand (COD) in the bulk phase of raw sewage (Pomeroy
16
and Parkhurst, 1972; Stoyer, 1970) is not a reliable method to characterize
the in-sewer biological processes. Microbial organisms in raw wastewater, to
some extent, are similar to activated sludge biomass in WWTPs (Henze and
Comeau, 2008). Hence, the existing models to predict microbial activity in
activated sludge could be relevant in sewers as well. Process models devel-
oped by the International Water Association (IWA) Task Group on design
and operation of biological wastewater treatment are the most widespread
models which primarily focus on modelling of activated sludge systems
(ASMs) (Henze et al., 2000). These models are widely described and dis-
cussed in literature (Decostere et al., 2016; Kappeler and Gujer, 1992; G Sin
et al., 2009; Vanrolleghem et al., 1999).
Despite similarities between microbial processes in a sewer and in a
wastewater treatment plant, these two systems are conceptually different
mainly due to two reasons (Hvitved-Jacobsen et al., 2013): (i) The principle
of biological processes are not the same, i.e. a WWTP is a controlled and op-
timized system to remove organic carbon, nitrogen and phosphorous, whereas
a sewer is a highly dynamic environment in which the microbial transfor-
mation can be utilized for other purposes, e.g. preventing the emission of hy-
drogen sulfide or preserving biodegradable substrates removal for following
denitrification and biological phosphorous removal in a WWTP. (ii) The pro-
cess conditions are different. In WWTPs, active heterotrophic biomass is pre-
sent in abundance in activated sludge systems and the biomass is often under
the conditions of limited readily biodegradable substrates. Due to high solids
retention time (SRT) in WWTPs, the biomass contains high microbial diver-
sity. In contrary, due to comparably shorter SRT, or in-sewer hydraulic resi-
dence time (HRT), the biodiversity is expected to be lower in the bulk phase
of the sewers (suspended biomass). Readily biodegradable substrates are in
abundance in the sewer, although oxygen can be limited. Biomass in sewers
exhibit less microbial diversity partially due to short SRT of biomass e.g. au-
totrophic biomass can be expected to be close to zero (Jiang et al., 2009).
These differences are summarized in Table 2.1.
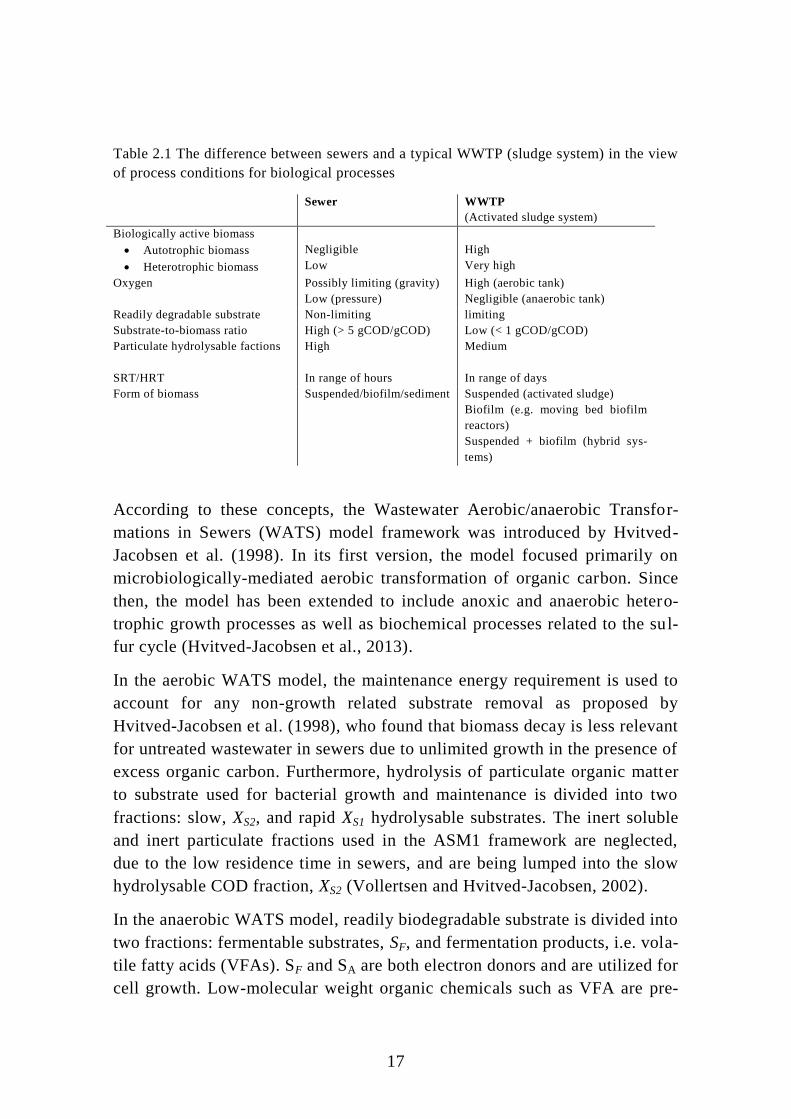
Based on these differences, the microbial community underlying processes in
the sewer system should be characterized differently than in WWTPs in terms
of availability of growth substrates and terminal electron acceptors and frac-
tion of active biomass.
17
Table 2.1 The difference between sewers and a typical WWTP (sludge system) in the view
of process conditions for biological processes
Sewer WWTP
(Activated sludge system)
Biologically active biomass
Autotrophic biomass
Heterotrophic biomass
Negligible
Low
High
Very high
Oxygen Possibly limiting (gravity)
Low (pressure)
High (aerobic tank)
Negligible (anaerobic tank)
Readily degradable substrate Non-limiting limiting
Substrate-to-biomass ratio High (> 5 gCOD/gCOD) Low (< 1 gCOD/gCOD)
Particulate hydrolysable factions
High Medium
SRT/HRT In range of hours In range of days
Form of biomass Suspended/biofilm/sediment Suspended (activated sludge)
Biofilm (e.g. moving bed biofilm
reactors)
Suspended + biofilm (hybrid sys-
tems)
According to these concepts, the Wastewater Aerobic/anaerobic Transfor-
mations in Sewers (WATS) model framework was introduced by Hvitved-
Jacobsen et al. (1998). In its first version, the model focused primarily on
microbiologically-mediated aerobic transformation of organic carbon. Since
then, the model has been extended to include anoxic and anaerobic hetero-
trophic growth processes as well as biochemical processes related to the sul-
fur cycle (Hvitved-Jacobsen et al., 2013).
In the aerobic WATS model, the maintenance energy requirement is used to
account for any non-growth related substrate removal as proposed by
Hvitved-Jacobsen et al. (1998), who found that biomass decay is less relevant
for untreated wastewater in sewers due to unlimited growth in the presence of
excess organic carbon. Furthermore, hydrolysis of particulate organic matter
to substrate used for bacterial growth and maintenance is divided into two
fractions: slow, XS2, and rapid XS1 hydrolysable substrates. The inert soluble
and inert particulate fractions used in the ASM1 framework are neglected,
due to the low residence time in sewers, and are being lumped into the slow
hydrolysable COD fraction, XS2 (Vollertsen and Hvitved-Jacobsen, 2002).
In the anaerobic WATS model, readily biodegradable substrate is divided into
two fractions: fermentable substrates, SF, and fermentation products, i.e. vola-
tile fatty acids (VFAs). SF and SA are both electron donors and are utilized for
cell growth. Low-molecular weight organic chemicals such as VFA are pre-
18
sent in raw wastewater and also produced via fermentation of SF. Only het-
erotrophic biomass is considered for enzymatic hydrolysis since polymeric
organic compounds are not typically direct substrate for sulfate reducing bac-
teria (SRB) (Muyzer and Stams, 2008). A decay rate and no growth rate are
considered for heterotrophic biomass (XH). The decay of biomass results in
the formation of XS2. However, growth of SRB is considered as detached bio-
film from the pressure sewer that could be present in the sample. Rudelle et
al. (2012) concluded that for wastewater that has already undergone anaero-
bic process it is important to consider sulfate respiration even in the bulk
wastewater. Methanogenesis is assumed to be negligible as it is typically not
observed in sewers and only in the permanent layer of deposits. Acetogenic
bacteria are also considered to be outcompeted by SRB species, especially
when acetate is present. WATS model calibration and simulation is presented
in chapter 4 (Paper I).
Secondary metabolic processes:
Microorganisms use different strategies to catalyze transformation of trace
organics such as hydrolysis, oxidation, reduction and photolysis (not relevant
for sewers). The rate of biotransformation may be determined by the process-
es that limit the delivery of substrates to microorganisms such as mass
transport limitation of substrates across intervening media e.g. in biofilm
(Rittmann, 1995) or sorption of hydrophobic organic compounds (Zhang et
al., 1998). Since most trace organic chemicals (such as drug biomarkers), also
called xenobiotics, are foreign to the microorganism, the cells may not have
extracellular systems to actively pick up these chemicals and carry them to
the interior part of the cell. Although the uptake is facilitated for nonpolar
species, the uptake rate of trace organics may dictate the overall transfor-
mation (Schwarzenbach et al., 2003). Moreover, the bioavailability of trace
organics can be affected by other phenomena, such as sequestration to solids
matrix (Alexander, 2000) or cometabolism processes (Criddle, 1993).
Once trace organics and enzymes coexist, if the metabolism of the chemicals
results in enough energy yield, the microorganisms may develop new cells. In
such case, the dynamic of microbial population can be expressed based on
Monod-kinetics and transformation of trace organic chemicals can follow this
principle (Lindblom et al., 2006; Rittmann, 1995; Siegrist et al., 1989), eq.
2.1, Table 2.2. In this formulation, CLI (g L-1
) is the concentration in the bulk,
μC (d-1
) and YC (gXB gCLI-1
) are the maximum specific growth rate and yield
19
coefficients and KC (gCLI L-1
) is the affinity constant. The biomass is indicat-
ed by XB which could be heterotrophic and also autotrophic biomass.
However, trace organics are primarily different from primary substrates be-
cause: (i) they present at very low concentration (in the range of nanograms
to micrograms), significantly lower than their affinity constant and unlike
primary substrates they are usually considered as non-growth substrates, (ii)
their transformation can be catalyzed by non-specific enzymes widely present
in wastewater and biofilm. From these stand points, biotransformation can be
described based on a pseudo-first-order rate equation (Schwarzenbach et al.,
2003) in which the removal rate is described by the concentration of the trace
organic and a constant microbial population, X (eq. 2.2). In this formulation,
kbio (L gX-1
d-1
) is the biotransformation rate constant and it is assumed that
biomass growth can be considered negligible during the time of investigation.
Following the assumption of negligible biomass growth, the extent of trans-
formation can be expressed by a transformation rate, k’bio (d-1
) in a first-order
rate equation i.e. k’bio=kbio × X, eq 2.3 (Bisceglia and Lippa, 2014; Senta et al.,
2014; Vezzaro et al., 2014). It is argued that a transformation rate based on X
would reflect an empirical character i.e. a system-specific behavior in a tested
environment, and may not be applicable to other experimental conditions
(Jacobsen et al., 1996). In this respect, more appropriate biotransformation
can be expressed for a specific active biomass concentration, XB, rather than
total biomass (eq. 2.4). Moreover, sorption of trace organics can be consid-
ered as a lumped parameter within the expression for biotransformation (Joss
et al., 2006; Plósz et al., 2013), assuming that sorption is fast compared to
biotransformation (Wang and Grady, 1995), eq 2.5. In this sorption-
biotransformation expression the bioavailability of the chemical due to sorp-
tion is inherently considered assuming that the trace chemical is bioavailable
in aqueous phase and it is not bioavailable once it is sorbed (Schwarzenbach
et al., 2003).
Many of trace organic chemicals such as illicit drugs (Kasprzyk-Hordern and
Baker, 2012) have two or more enantiomers (a pair of molecules with a mir-
ror image of each other). This implies that biotransformation of such com-
pounds may need to address enantiomer-specific processes i.e. different
transformation kinetics for each of the compounds (Polesel, 2016) eq. 2.6.
In the view of co-metabolism (co-digestion of primary and secondary sub-
strates by enzymes), primary substrates may play a significant role in bio-
transformation of trace organic chemicals, suggesting that a biotransfor-
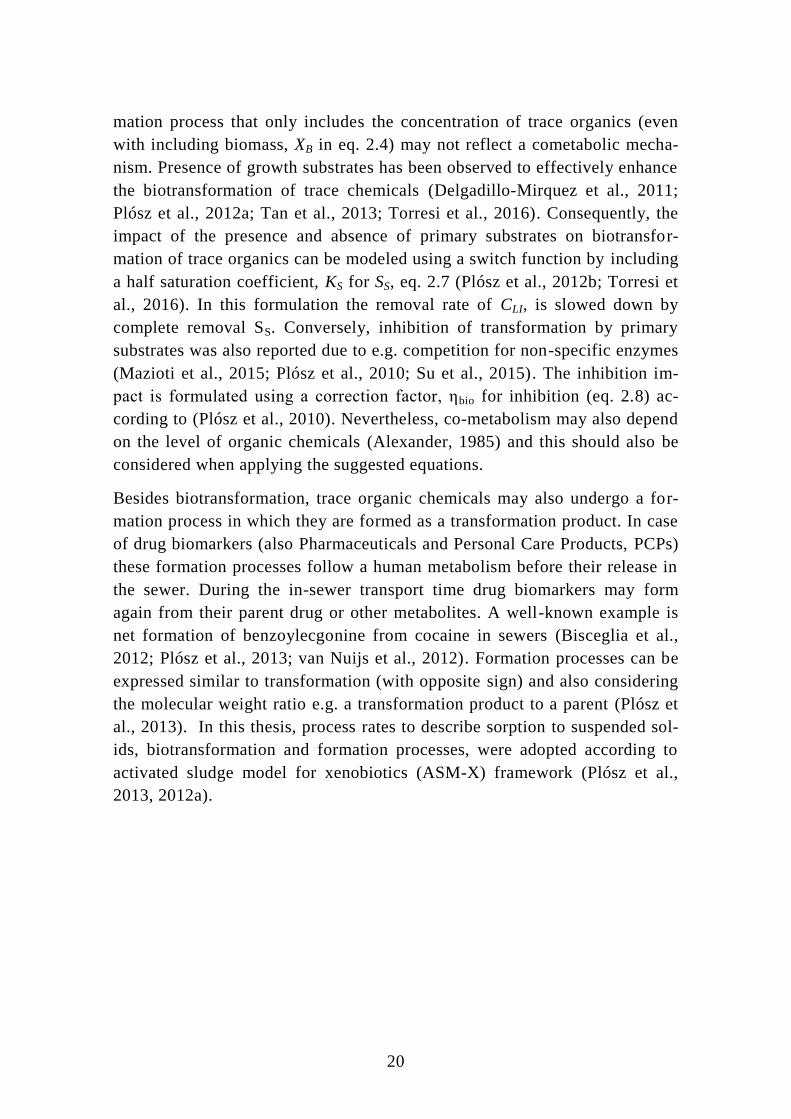
20
mation process that only includes the concentration of trace organics (even
with including biomass, XB in eq. 2.4) may not reflect a cometabolic mecha-
nism. Presence of growth substrates has been observed to effectively enhance
the biotransformation of trace chemicals (Delgadillo-Mirquez et al., 2011;
Plósz et al., 2012a; Tan et al., 2013; Torresi et al., 2016). Consequently, the
impact of the presence and absence of primary substrates on biotransfor-
mation of trace organics can be modeled using a switch function by including
a half saturation coefficient, KS for SS, eq. 2.7 (Plósz et al., 2012b; Torresi et
al., 2016). In this formulation the removal rate of CLI, is slowed down by
complete removal SS. Conversely, inhibition of transformation by primary
substrates was also reported due to e.g. competition for non-specific enzymes
(Mazioti et al., 2015; Plósz et al., 2010; Su et al., 2015). The inhibition im-
pact is formulated using a correction factor, ηbio for inhibition (eq. 2.8) ac-
cording to (Plósz et al., 2010). Nevertheless, co-metabolism may also depend
on the level of organic chemicals (Alexander, 1985) and this should also be
considered when applying the suggested equations.
Besides biotransformation, trace organic chemicals may also undergo a for-
mation process in which they are formed as a transformation product. In case
of drug biomarkers (also Pharmaceuticals and Personal Care Products, PCPs)
these formation processes follow a human metabolism before their release in
the sewer. During the in-sewer transport time drug biomarkers may form
again from their parent drug or other metabolites. A well-known example is
net formation of benzoylecgonine from cocaine in sewers (Bisceglia et al.,
2012; Plósz et al., 2013; van Nuijs et al., 2012). Formation processes can be
expressed similar to transformation (with opposite sign) and also considering
the molecular weight ratio e.g. a transformation product to a parent (Plósz et
al., 2013). In this thesis, process rates to describe sorption to suspended sol-
ids, biotransformation and formation processes, were adopted according to
activated sludge model for xenobiotics (ASM-X) framework (Plósz et al.,
2013, 2012a).
21
Table 2.2 Secondary metabolic process rate equations according to literature studies to
describe transformation of trace organic chemicals, with typical references and an indica-
tion of what papers in this thesis they have been used.
eq. Biotransformation process for CLI Reference
(2.1) Second-order (Monod-based kinetics)
Siegrist et al. 1989Rittmann 1995Lindblom et al. 2006
(2.2) Pseudo-first order Schwarzenbach et al. 2003 Paper I, II, III
(2.3) first order Senta et al. 2014Bisceglia & Lippa 2014Vezzaro et al. 2014
Paper I, II, III
(2.4) Second order Jacobsen et al. 1996 Paper I
(2.5) Pseudo-first order (instantaneous sorption)
Joss et al. 2006Plósz et al. 2013
Paper III, IV
(2.6) Two Pseudo-first order (Enantioselective)
Polesel 2016
(2.7) Pseudo-first order (co-metabolism; enhancement)
Plósz et al. 2012Torresi et al. 2016
(2.8) Pseudo-first order (co-metabolism; inhibition)
Plósz et al. 2010

22
23
3 Sampling and quantification of drug
biomarkers in wastewater
3.1 Representative sampling As mentioned in the introduction, sampling campaigns are usually performed
at the WWTP inlet. Collection of representative samples is a prerequisite for
further methodological steps. A non-representative sample can be a major
source of inaccuracy in consumption estimates which cannot be compensated
with a highly accurate analytical procedure or very sophisticated backcalcula-
tion method. It is well-known that substances in the sewer are generally sub-
ject to systematic variations (i.e. seasonal, weekly, diurnal). However, du to
infrequent release of many trace organic chemicals including drug bi-
omarkers, these variations can occur in significantly shorter time frames, e.g.
minutes or even seconds. Such short-term variations can result in a non-
representative sample in case of inappropriate sampling. There have been dif-
ferent sampling guidelines for decades (Clesceri et al., 1998; U.S. EPA,
1982). However many studies have not considered these guidelines or they
lack a transparent explanation of the sampling procedure used (Ort et al.,
2010b). Performing sampling according to best-practice sampling protocols
can be challenging, since these guidelines are provided to be of general valid-
ity and it might be difficult to adapt them for specific cases. Depending on
the characteristics of the sewer (e.g. design and operational condition) the
occurrence of substances might significantly differ from one site to the other.
These variations are also substance-specific. For instance it has been shown
that the variations of benzotriazole – contained in dishwasher detergents – as
an example of a house hold chemical can be very different from human relat-
ed PPCPs that are excreted with urine (Rieckermann et al., 2011). Even
among excreted compounds (e.g. pharmaceuticals and drug biomarkers), high
variability can be expected in one sampling site (Ort et al., 2010b). Regard-
less of sewer characteristics and catchment layout, the variability of excreted
compounds is intrinsically dependent on the frequency of usage and excretion
ratios (how much of parent is excreted as metabolites) which can be different
from one person to another (Khan and Nicell, 2011). Moreover, the require-
ments for representative sampling might be not in access e.g. lack of access
to flow sensor for flow-proportional sampling. Decision on the sampling lo-
cation is also important. If the sampling is performed after the primary clari-
fier (or simply in a tank) the short term variations can be attenuated (Ort et
24
al., 2010b). However, this sampling location is not proper for particulate mat-
ters as they are substantially removed in primary clarifiers (Ort, 2014).
A “true” representative sampling is only possible with online automatic in-
strumentation or continuous sampling by diversion of a side stream of the
inflow to the WWTP proportional to the flow (Ort and Gujer, 2006). For drug
biomarkers no such online sensors exist and most available commercial sam-
plers do not support continuous flow-proportional sampling. Instead, discrete
sampling is usually applied following three sampling modes: (i) Time-
proportional sampling where a fixed sample volume is taken at fixed prede-
termined time intervals. (ii) Volume-proportional sampling where a fixed
sampling volume is collected at variable time intervals, which are triggered
by a predefined wastewater volume arriving at the measurement point. (iii)
Flow-proportional sampling where a variable sampling volume is collected at
fixed time intervals and the sampling volume is proportional to the flow at
the time of sampling.
A decision on sampling interval is highly dependent on the dynamic nature of
the substance load with relation to the flow (i.e. concentration variations).
The substances are released in the sewer with intermittent wastewater pulses.
Due to dispersion and mixing effects in the sewer, the pulses overlay each
other throughout the transport and form series of larger superimposed pulses.
In case of scarce release of a substance or short transport time, the pulses can
appear distinctly at the sampling site. Capturing such pulses requires very
short sampling interval (Ort et al., 2010a) that could be as short as 2 min to
correctly capture short-term fluctuations (Ort, 2014). As mentioned earlier,
the geometry and structure of the sewers can have huge impact on flow varia-
tions. Since the occurrence of the drug biomarkers (as mainly dissolved sub-
stance in wastewater) depends on the flow, the fluctuation of the flow should
be considered during sampling. In time proportional sampling mode, the
samples are collected irrespective of the flow while in flow-proportional
sampling the samples are collected with a volume weighted according to the
flow. Although representativeness of the sample is improved with this sam-
pling mode, the drawback is when wastewater flow is repeatedly stagnant (no
flow). In such case volume-proportional sampling is preferred.
Choice of the right sampling mode and sampling interval is only possible
with detailed preliminary knowledge which is often site and compound spe-
cific. By using a model-based approach and generating realistic load patterns,
different sampling scenarios can be investigated a priori. A sewage Pattern
25
Generator (SPG) was introduced (Ort et al., 2005) to simulate stochastic load
variation of the substances in the sewer, which can also be used to compare
different sampling modes on drug biomarkers (Ort, 2016). This software
computes superposition of wastewater pulses emitted from users distributed
over a catchment. The transport of solutes in gravity sewer networks is simu-
lated using a 1-D advection dispersion model. The SPG package requires pri-
or knowledge such as number of pulses, drug mass per pulse and pulse dura-
tion. The drawback of this software is that it does not assess the impact of
sorption and biotransformation on generation of drug load patterns.
As part of this thesis number of sampling campaigns were performed using
flow,- and volume-proportional sampling modes (chapter 5). An objective
assessment was also performed on the uncertainty in daily drug estimates that
is due to inaccurate sampling. Moreover, different sampling modes were test-
ed through scenario analysis (Paper IV).
3.2 Quantitative chemical analysis Quantifying the concentration of drug pharmaceuticals and drug biomarkers
in wastewater requires robust and reliable analytical methods. A number of
challenges can be addressed: (i) target compounds are present in trace
amounts, which necessitates extensive pre-concentration during sample prep-
aration; (ii) Wastewater is a complex matrix, accuracy and reproducibility of
quantitative analysis can be severely impacted by the presence of interfering
compounds present in the matrix. This requires sample purification prior to
mass detection and using isotope-labelled internal standards (ILIS) (Bijlsma
et al., 2013); (iii) it is likely that there are other compounds present in a
wastewater sample similar to the target compounds i.e. having similar mass.
Presence of possible enantiomers for the same compound should be also con-
sidered in analysis (Kasprzyk-Hordern and Baker, 2012). The analytical
method should be able to distinguish and evaluate these contributions through
confirmation steps. Measurement (quantification) is normally performed via
spectrometric techniques comprising of sample preparation, analysis using a
mass spectrometer, and data processing. In this study these steps were per-
formed for the samples collected during batch experiments (Paper I & III).
Sample preparation:
This step includes the preparation of samples after sample collection and be-
fore injection to a mass spectrometer. Sample collection might be from a
monitoring study or from a laboratory-scale reactor. To prevent possible al-
26
teration of compound concentrations due to biological activity or partitioning
to solids, samples in monitoring studies are preferably kept refrigerated dur-
ing sample collection and transport to a lab. Depending on the stability of the
compound in wastewater, the sample might need to be adjusted to acidic pH
(van Nuijs et al., 2011). It is recommended that the samples are spiked with
target analytes soon after sample collection. After transport, if the analysis is
to be done later on, samples are stored in the dark at -20°C. After defrosting,
samples are vacuum filtered through glass fiber filters to remove particulate
matters from the matrix and clean the sample. For further sample clean-up,
pre-concentration as well as isolation of the analytes of interest, filtered sam-
ples are passed through solid phase extraction (SPE) cartridges. The analytes
are retained by the sorbent inside the cartridges with different mechanisms
including hydrophobic interaction (nonpolar-nonpolar), hydrophilic interac-
tion (polar-polar), ion exchange (electrostatic attraction) or mixed mode (two
or more retention mechanisms). The choice of SPE sorbent highly depends on
the analyte functional groups and polarity. SPE can be done manually or au-
tomatic (Trenholm et al., 2009) following this procedure: (i) sample pre-
treatment which includes pH adjustment, (ii) conditioning of the cartridge
e.g. with MeOH or acetonitrile, (iii) loading of the sample, (iv) washing the
cartridges to remove undesired contaminants, and (v) disrupting the retentive
interaction between the analytes and the sorbent so the analytes are eluted
from the cartridge.
The stability of the target compounds should be well assessed during sample
collection, storage and preparation. It has been demonstrated that the in-
sample stability of many drug biomarkers can be significantly affected by the
choice and the length of the procedures before analysis (Baker and Kasprzyk-
Hordern, 2011). A study on the impact of short-term (7 days) and long-term
(60 and days) storage of wastewater samples on the analysis of PPCPs re-
vealed that for short-term storage, keeping the sample in the fridge is better
than freezing while for long-term storage freezing is preferred (Fedorova et
al., 2014). Optimizing a method for sample handling can be very rigorous if a
sample should be prepared for multi-analyte analysis in which analytes have
very different physicochemical properties, e.g. a wide range of polarity
(Borova et al., 2014).
Analysis using a mass spectrometer:
Following sample extraction, the sample is injected by a mobile phase at high
pressure into a liquid chromatographic (LC) column that is packed with a sta-
tionary phase. Based on the specific physical interaction between the analytes
27
and the stationary phase, analytes move in the column with different velocity
resulting in separate elution of analytes. The mass of separated analytes are
then measured using mass spectrometry (MS) technique via ionizing the ana-
lyte molecules and sort the ions – including any fragment ion – based on their
mass-to-charge ratio. Ionization, ion analysis and detection can be performed
using different techniques, resulting in many different types of mass spec-
trometers. These three are the main parts of a mass analyzer: (i) an ion source
to create atomic and molecular ions from sample molecules, (ii) mass analyz-
er to separate ions based on mass-to-charge ratio, (iii) following the ejection
of ions from mass analyzer, they are collected by a detector such as electron
multiplier to multiply incident charges.
Electrospray ionization (ESI) is a common method for ionization of organic
compounds in which a beam of high energetic electrons knock off an electron
from analytes to form an ion. During ionization different fragment ions – ac-
quiring positive or negative charges – are produced which can then be used to
identify target compounds.
Among the most common mass analyzers (Fitzgerald et al., 1997) are time of
flight (TOFMS), quadrupole (QMS), ion trap (ITMS) and orbitrap. In
TOFMS method, the mass-to-charge ratio is determined by the velocity
(time) of the accelerated ion in electric field. In QMS, ions are filtered de-
pending on their trajectories in an oscillating electric field. Only ions with a
certain mass-to-charge will reach the detector. In ITMS, the ions – formed
before or inside the trap – are trapped between two endcap electrodes and a
ring electrode where they are oscillated by acceleration and deceleration. The
ions leave the cap at specific mass-to-charge ratios. In Orbitrap ions cycle
around a central electrode and simultaneously oscillate along a horizontal
axis. The mass analysis is then performed in Fourier transform mode (by
measuring oscillations) or mass selective instability mode (ejection and col-
lection by detector).
Employed method in this thesis:
In this thesis, the selected drug biomarkers have different physicochemical
characteristics, e.g. low (logKow=7.61 for THC) to high hydrophilicity
(logKow<0 for MORG). Most of them are weak bases (except THC, THCOH,
and THCCOOH, which are weak acids, and BE and MORG, zwitterions) and
undergo cationic-neutral speciation (except THC which undergoes neutral-
anionic; THCCOOH is always anionic; BE and MORG are zwitterionic-
anionic) at typical wastewater pH=7-8. Acid dissociation constants range
28
from pKa = 10.6 for THC to pKa = 3.6 for BE. Based on the variation of
properties, an all-purpose cartridge (Oasis HLB) was selected. This cartridge
has strongly hydrophilic filter with water-wettable polymer and has a unique
hydrophilic-lipophilic balance. SPE was performed manually using MeOH
and MiliQ for conditioning and MiliQ for washing. The extraction was per-
formed using MeOH followed by nitrogen evaporation. Samples were ana-
lyzed with high performance liquid chromatography coupled with linear ion
trap-orbitrap mass spectrometry. Analytical methods were developed based
on the accurate mass of the protonated ion with one nominal mass product ion
and retention time.
29
4 Fate model identification
4.1 Experimental design In-sewer fate processes were experimentally investigated by assessing trans-
formation of illicit drug biomarkers in the sewer as well as abiotic transfor-
mations such as chemical hydrolysis. Moreover, partitioning of these chemi-
cals to sewer solids was examined. All experimental assessments were per-
formed in laboratory scale systems.
Biotransformation experiments
Biotransformation in presence of sewer suspended solids was tested by per-
forming laboratory scale experiments using raw wastewater (Paper I). Two-
jacketed reactors, filled with fresh raw influent wastewater were operated at
15°C under aerobic and anaerobic conditions by sparging air and nitrogen in
the reactors respectively. Throughout a 2-day experiment, 9-12 samples were
withdrawn from each reactor. Experiments were initially performed without
spiking target drug biomarkers to test the biotransformation of drug bi-
omarkers already present in the background. In this procedure (P0) the hy-
pothesis was to test biotransformation under representative environmental
conditions as previously suggested (Alexander, 1985). Following chemical
analysis, the concentrations of drug biomarkers in many of the samples were
below quantification levels. Subsequently, the experimental procedure was
revaluated and further refined by spiking internal standards at a high level (10
μg L-1
), such that presence of background concentrations would not cause any
interference. In this procedure (P1), almost all target chemicals were detected
in samples, and the quality of data were assured with replicate analysis and
confirmation steps. An additional set of experiments was also performed with
an alternative procedure (P2) by spiking and targeting labelled internal stand-
ards (2 μg L-1
) with the hypothesis that transformation of these chemicals can
be traced without any influence from back-ground concentrations.
To test the biotransformation in sewer biofilms (Paper III), two annular ro-
tating biofilm reactors were used to simulate the shear conditions as in the
sewer. Each reactor consisted of a stationary inner cylinder (diameter=9 cm)
and an outer rotating drum (diameter=11.4 cm). The advantage of the reactors
were high area to volume ratio (A/V=175 m2 m
-3) which allowed a high sur-
face area for grow of biofilm. Each of the reactors were fed continuously (4 L
d-1
) via an external tank (T=4°C), filled with pre-clarified wastewater. One
external tank was sparged with air, and the other one with nitrogen to main-
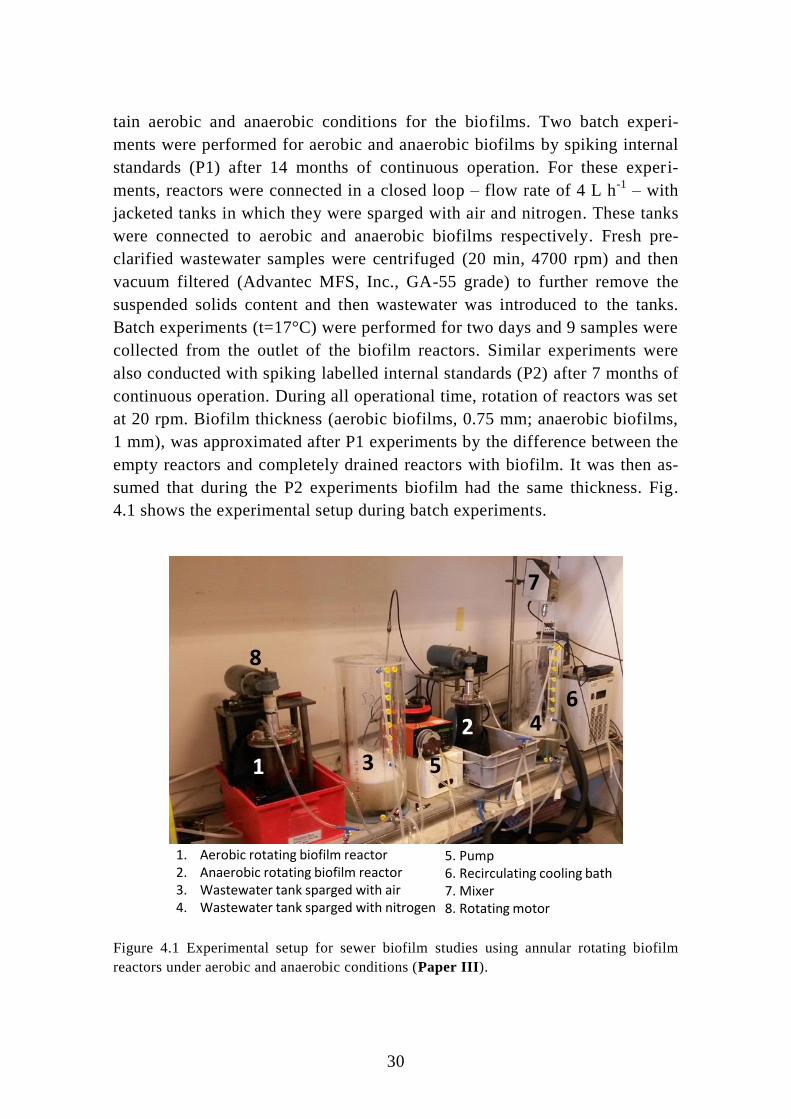
30
tain aerobic and anaerobic conditions for the biofilms. Two batch experi-
ments were performed for aerobic and anaerobic biofilms by spiking internal
standards (P1) after 14 months of continuous operation. For these experi-
ments, reactors were connected in a closed loop – flow rate of 4 L h-1
– with
jacketed tanks in which they were sparged with air and nitrogen. These tanks
were connected to aerobic and anaerobic biofilms respectively. Fresh pre-
clarified wastewater samples were centrifuged (20 min, 4700 rpm) and then
vacuum filtered (Advantec MFS, Inc., GA-55 grade) to further remove the
suspended solids content and then wastewater was introduced to the tanks.
Batch experiments (t=17°C) were performed for two days and 9 samples were
collected from the outlet of the biofilm reactors. Similar experiments were
also conducted with spiking labelled internal standards (P2) after 7 months of
continuous operation. During all operational time, rotation of reactors was set
at 20 rpm. Biofilm thickness (aerobic biofilms, 0.75 mm; anaerobic biofilms,
1 mm), was approximated after P1 experiments by the difference between the
empty reactors and completely drained reactors with biofilm. It was then as-
sumed that during the P2 experiments biofilm had the same thickness. Fig.
4.1 shows the experimental setup during batch experiments.
Figure 4.1 Experimental setup for sewer biofilm studies using annular rotating biofilm
reactors under aerobic and anaerobic conditions (Paper III).
1. Aerobic rotating biofilm reactor2. Anaerobic rotating biofilm reactor3. Wastewater tank sparged with air4. Wastewater tank sparged with nitrogen
2
3
4
5
7
8
5. Pump6. Recirculating cooling bath7. Mixer8. Rotating motor
6
1
31
During biotransformation experiments using raw wastewater and in biofilm
reactors (P1), biological activity of biomass was monitored by taking addi-
tional samples to measure total and soluble chemical oxygen demand (COD),
total suspended solids (TSS), nitrate, ammonium and sulfate. Moreover, the
activity of heterotrophic biomass was concomitantly investigated during aer-
obic biotransformation experiments in raw wastewater by measuring oxygen
uptake rate in fresh wastewater samples.
Abiotic experiments
Transformation of selected drug biomarkers due to abiotic processes, i.e.
chemical hydrolysis in absence of biomass, was tested using mineral water.
Experiments were conducted in jacketed reactors (t=15°C) under aerobic and
anaerobic conditions by following the procedure of spiking internal standards
(P1) and taking 5 samples over 2-day experiments. To assess possible at-
tachments of drug biomarkers to the reactor wall (plexiglass), a sample was
taken at 15 min, from each reactor, by hypothesizing that any partitioning to
the reactor wall, especially for hydrophobic compounds, would occur rapidly.
Sorption experiments
Sorption to suspended solids was assessed using primary sludge in batch re-
actors. Biomass was deactivated using 0.05% (v/v) sodium azide. Experi-
ments were performing by spiking internal standards (P1) and samples were
collected over 4 h. Two experiments were conducted at pH∼8.4 and 7.7 to
replicate the pH conditions during biotransformation experiments with raw
wastewater (P1) (Paper I).
To investigate sorption to sewer biofilms, sewer biofilms on two strips, from
each reactor separately, were suspended in tap water and biomass was deac-
tivated as previous. The hypothesis was to test instantaneous sorption without
interference of diffusion limitation (Paper III). Two experiments were per-
formed in total for 4 h, for aerobic biofilms and anaerobic biofilm (pH∼8.8).
For all sorption experiments, control experiments were also performed with
mineral water with same amount of sodium azide and approximately same
pH.
32
4.2 Model structure
4.2.1 Physico-chemical processes
Partitioning to solids
Sorption and desorption to suspended solids was modeled using two first order
differential equations in opposite directions; one to describe the sorption
(partitioning) of compounds from the aqueous phase, CLI (g L-1
), onto solids
phase CSL (g L-1
) and one to describe the desorption of already sorbed com-
pounds from the solid phase back to the aqueous phase (Joss et al., 2006). In
this formulations the extent of sorption was described with partition coeffi-
cients of biomarkers, Kd (L gTSS d-1
) and the sorption rate was defined as Kd
× Kdes in which Kdes (d-1
) is the desorption rate from suspended solids (Paper
I). Sorption to sewer biofilms however defined together with biotransfor-
mation processes, similar to eq. 2.5 in Table 2.2. It was assumed that desorp-
tion rate from suspended biofilm was rather fast, e.g. kdesf=100 (d-1
)(Plósz et
al., 2013) and equilibrium between sorbed and dissolved chemicals were
reached instantaneously. In this formulations the stress is on the impact of
sorption on bioavailability of drug biomarkers (Schwarzenbach et al., 2003),
rather than predicting the dynamics of sorption and desorption. Nevertheless,
the sorption coefficient for sewer biofilms kdf (L gTSS d-1
) was described and
subsequently estimated as linear equilibrium distribution between sorbate and
sorbent. Since drug biomarkers can undergo abiotic processes even at the
presence of sodium azide, these processes were also included, from control
experiments, in the estimation of kd. The dynamics of sorption and desorption
processes can be simulated during sorption experiments with both suspended
solids and biofilm. Fig. 4.2 presents a concentration profile of ecgonine me-
thyl ester (EME), as an example, during a sorption experiment with anaerobic
biofilms and during a control experiment. Estimated sorption coefficient,
(kdf=1.59 L gTSS d-1
), could simulate the removal of this compound due to
sorption.
To simulate sorption and desorption processes onto the reactor wall, two
first-order kinetics were formulated. Similar to partitioning to suspended sol-
ids, the extent of sorption was correlated with the partitioning coefficient to
the reactor wall, kdw (m3 m
-2). Furthermore abiotic processes were described
with first-order kinetics, in which removal or formation of a drug biomarker
is proportional only to its concentration.

33
Figure 4.2 Ecgonine methyl ester (EME) concentration in bulk liquid (CLI μg L
-1) during a
sorption experiment with suspended anaerobic biofilms (left Y-axis) and EME data in the
bulk liquid phase during a control experiment with mineral water (CLI,cont) (right Y-axis).
CLI and concentration in solids (CSL) are simulated with two reverse first-order kinetics.
In Fig. 4.3 it is shown that simulation of abiotic processes for mephedrone
(MEPH) without accounting for partitioning to the reactor wall, even with
best estimates kabio=0.17 d-1
, could not well predict experimental data (green
line). By including partitioning (Kdf=1.6 L gTSS d-1
), model could capture
data pints (kabio=0.1 d-1
) more precisely.
Figure 4.3 Mephedrone (MEPH) concentration in bulk liquid during an abiotic experiment
under aerobic conditions. Simulation results reflect on the variation of the simulated bulk
concentration, CLI and the attached concentration to the reactor wall, CSL, during the abiotic
processes and sorption/ desorption onto and from reactor wall.
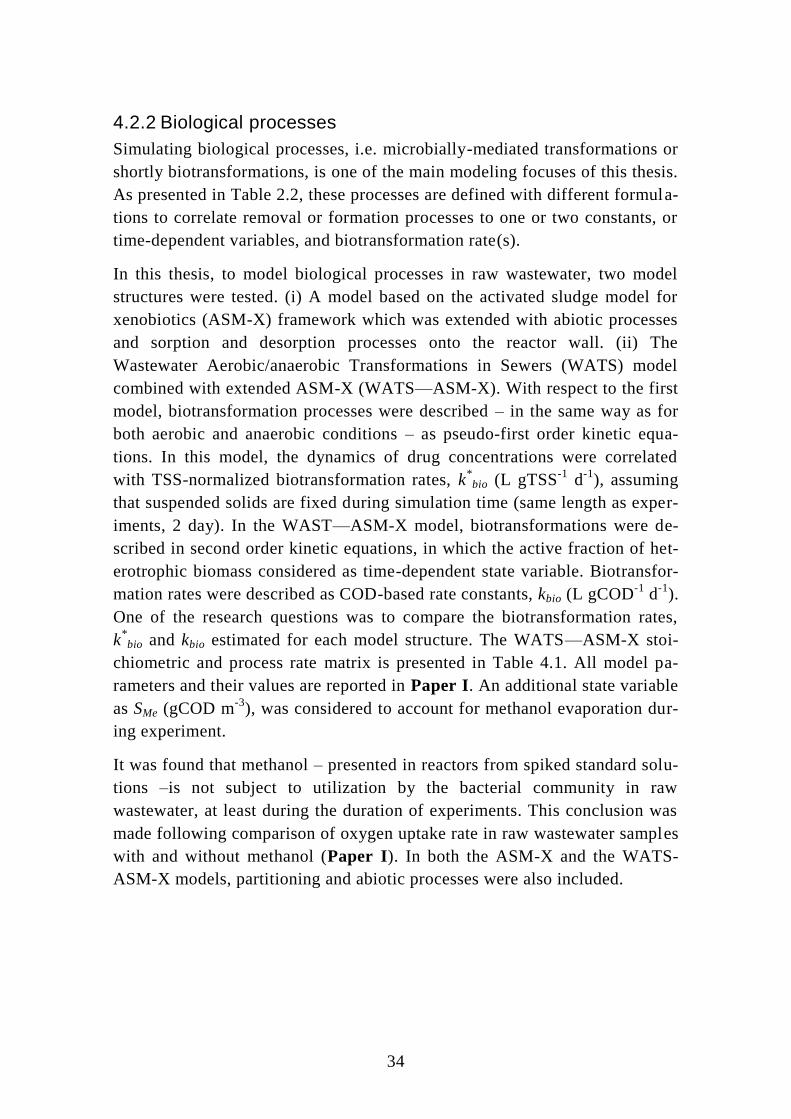
34
4.2.2 Biological processes
Simulating biological processes, i.e. microbially-mediated transformations or
shortly biotransformations, is one of the main modeling focuses of this thesis.
As presented in Table 2.2, these processes are defined with different formula-
tions to correlate removal or formation processes to one or two constants, or
time-dependent variables, and biotransformation rate(s).
In this thesis, to model biological processes in raw wastewater, two model
structures were tested. (i) A model based on the activated sludge model for
xenobiotics (ASM-X) framework which was extended with abiotic processes
and sorption and desorption processes onto the reactor wall. (ii) The
Wastewater Aerobic/anaerobic Transformations in Sewers (WATS) model
combined with extended ASM-X (WATS—ASM-X). With respect to the first
model, biotransformation processes were described – in the same way as for
both aerobic and anaerobic conditions – as pseudo-first order kinetic equa-
tions. In this model, the dynamics of drug concentrations were correlated
with TSS-normalized biotransformation rates, k*
bio (L gTSS-1
d-1
), assuming
that suspended solids are fixed during simulation time (same length as exper-
iments, 2 day). In the WAST—ASM-X model, biotransformations were de-
scribed in second order kinetic equations, in which the active fraction of het-
erotrophic biomass considered as time-dependent state variable. Biotransfor-
mation rates were described as COD-based rate constants, kbio (L gCOD-1
d-1
).
One of the research questions was to compare the biotransformation rates,
k*
bio and kbio estimated for each model structure. The WATS—ASM-X stoi-
chiometric and process rate matrix is presented in Table 4.1. All model pa-
rameters and their values are reported in Paper I. An additional state variable
as SMe (gCOD m-3
), was considered to account for methanol evaporation dur-
ing experiment.
It was found that methanol – presented in reactors from spiked standard solu-
tions –is not subject to utilization by the bacterial community in raw
wastewater, at least during the duration of experiments. This conclusion was
made following comparison of oxygen uptake rate in raw wastewater samples
with and without methanol (Paper I). In both the ASM-X and the WATS-
ASM-X models, partitioning and abiotic processes were also included.

35
Table 4.1 Stoichiometric matrix and process rates in the WAST—ASM-X model (Paper I).
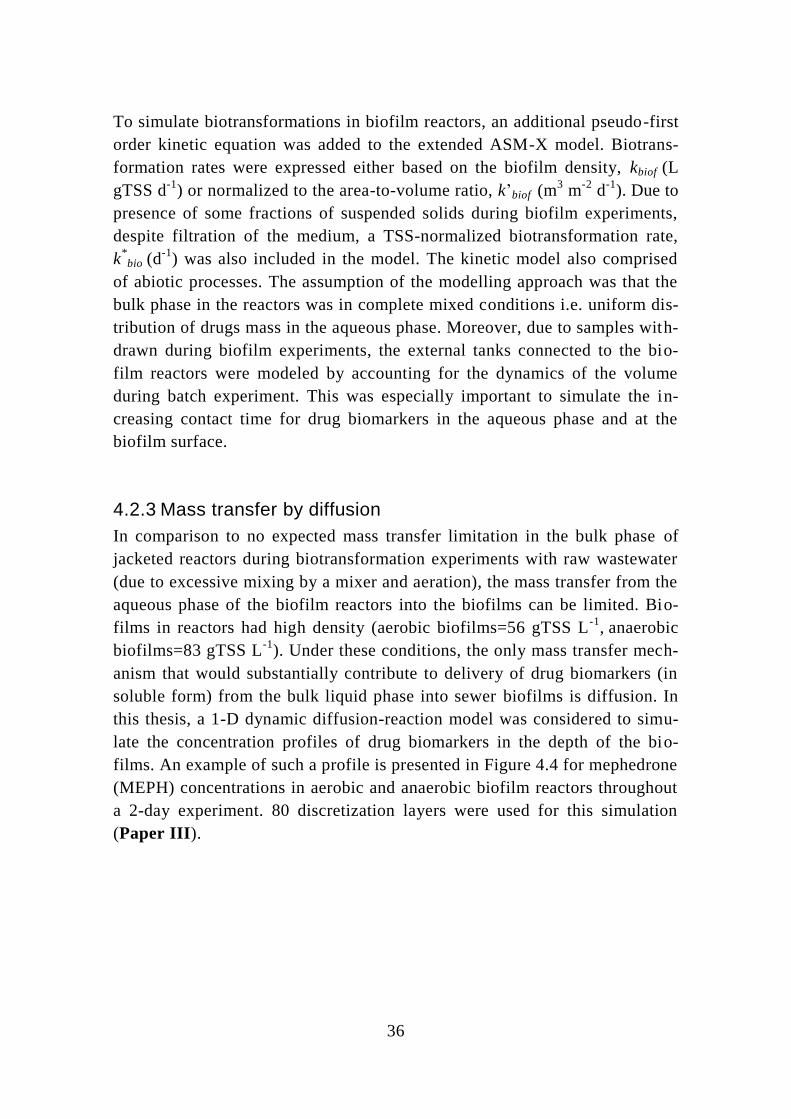
36
To simulate biotransformations in biofilm reactors, an additional pseudo-first
order kinetic equation was added to the extended ASM-X model. Biotrans-
formation rates were expressed either based on the biofilm density, kbiof (L
gTSS d-1
) or normalized to the area-to-volume ratio, k’biof (m3 m
-2 d
-1). Due to
presence of some fractions of suspended solids during biofilm experiments,
despite filtration of the medium, a TSS-normalized biotransformation rate,
k*
bio (d-1
) was also included in the model. The kinetic model also comprised
of abiotic processes. The assumption of the modelling approach was that the
bulk phase in the reactors was in complete mixed conditions i.e. uniform dis-
tribution of drugs mass in the aqueous phase. Moreover, due to samples with-
drawn during biofilm experiments, the external tanks connected to the bio-
film reactors were modeled by accounting for the dynamics of the volume
during batch experiment. This was especially important to simulate the in-
creasing contact time for drug biomarkers in the aqueous phase and at the
biofilm surface.
4.2.3 Mass transfer by diffusion
In comparison to no expected mass transfer limitation in the bulk phase of
jacketed reactors during biotransformation experiments with raw wastewater
(due to excessive mixing by a mixer and aeration), the mass transfer from the
aqueous phase of the biofilm reactors into the biofilms can be limited. Bio-
films in reactors had high density (aerobic biofilms=56 gTSS L-1
, anaerobic
biofilms=83 gTSS L-1
). Under these conditions, the only mass transfer mech-
anism that would substantially contribute to delivery of drug biomarkers (in
soluble form) from the bulk liquid phase into sewer biofilms is diffusion. In
this thesis, a 1-D dynamic diffusion-reaction model was considered to simu-
late the concentration profiles of drug biomarkers in the depth of the bio-
films. An example of such a profile is presented in Figure 4.4 for mephedrone
(MEPH) concentrations in aerobic and anaerobic biofilm reactors throughout
a 2-day experiment. 80 discretization layers were used for this simulation
(Paper III).
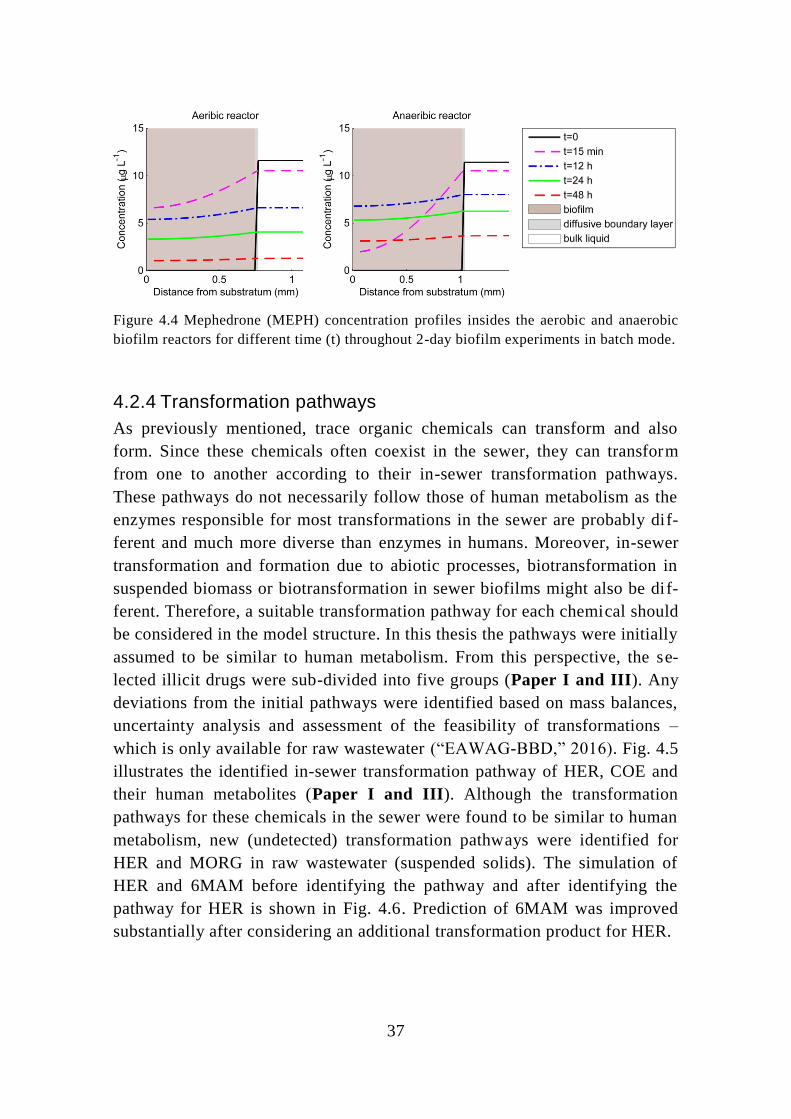
37
Figure 4.4 Mephedrone (MEPH) concentration profiles insides the aerobic and anaerobic
biofilm reactors for different time (t) throughout 2-day biofilm experiments in batch mode.
4.2.4 Transformation pathways
As previously mentioned, trace organic chemicals can transform and also
form. Since these chemicals often coexist in the sewer, they can transform
from one to another according to their in-sewer transformation pathways.
These pathways do not necessarily follow those of human metabolism as the
enzymes responsible for most transformations in the sewer are probably dif-
ferent and much more diverse than enzymes in humans. Moreover, in-sewer
transformation and formation due to abiotic processes, biotransformation in
suspended biomass or biotransformation in sewer biofilms might also be dif-
ferent. Therefore, a suitable transformation pathway for each chemical should
be considered in the model structure. In this thesis the pathways were initially
assumed to be similar to human metabolism. From this perspective, the se-
lected illicit drugs were sub-divided into five groups (Paper I and III). Any
deviations from the initial pathways were identified based on mass balances,
uncertainty analysis and assessment of the feasibility of transformations –
which is only available for raw wastewater (“EAWAG-BBD,” 2016). Fig. 4.5
illustrates the identified in-sewer transformation pathway of HER, COE and
their human metabolites (Paper I and III). Although the transformation
pathways for these chemicals in the sewer were found to be similar to human
metabolism, new (undetected) transformation pathways were identified for
HER and MORG in raw wastewater (suspended solids). The simulation of
HER and 6MAM before identifying the pathway and after identifying the
pathway for HER is shown in Fig. 4.6. Prediction of 6MAM was improved
substantially after considering an additional transformation product for HER.
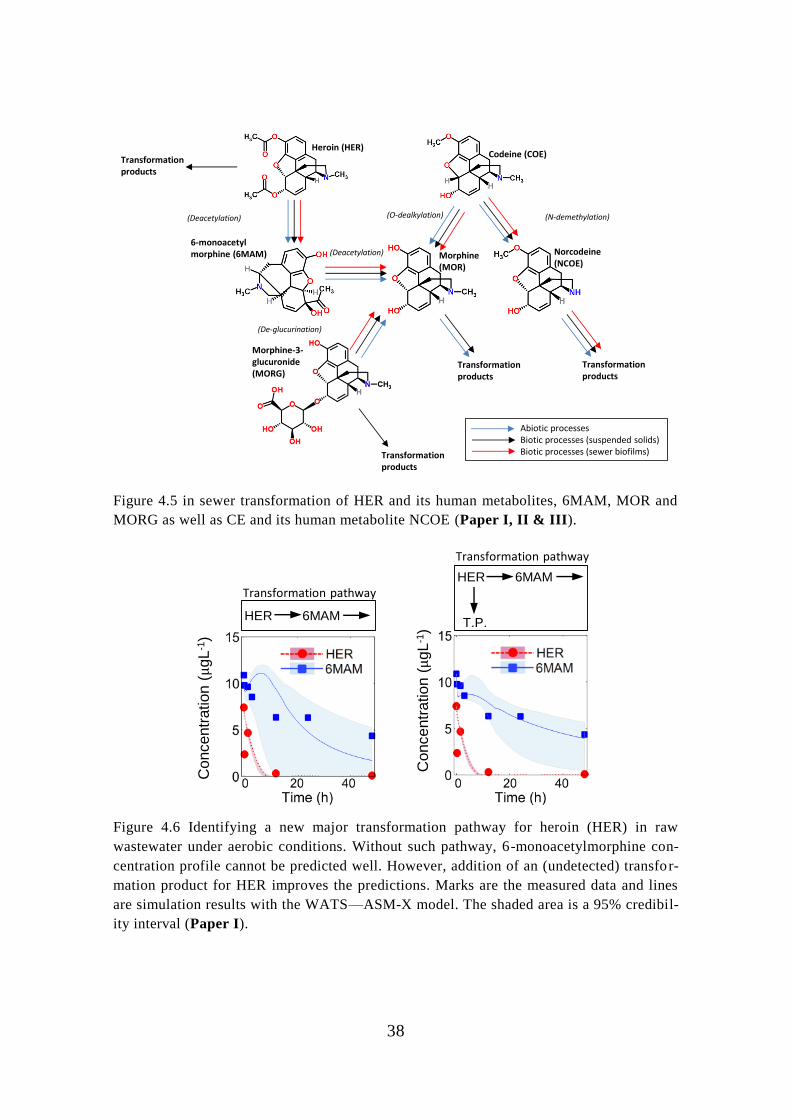
38
Figure 4.5 in sewer transformation of HER and its human metabolites, 6MAM, MOR and
MORG as well as CE and its human metabolite NCOE (Paper I, II & III).
Figure 4.6 Identifying a new major transformation pathway for heroin (HER) in raw
wastewater under aerobic conditions. Without such pathway, 6-monoacetylmorphine con-
centration profile cannot be predicted well. However, addition of an (undetected) transfor-
mation product for HER improves the predictions. Marks are the measured data and lines
are simulation results with the WATS—ASM-X model. The shaded area is a 95% credibil-
ity interval (Paper I).
Heroin (HER)
6-monoacetyl morphine (6MAM)
Morphine-3-glucuronide (MORG)
Morphine (MOR)
Codeine (COE)
Norcodeine(NCOE)
Transformation products
Transformation products
Transformation products
(Deacetylation)
(De-glucurination)
(N-demethylation) (O-dealkylation)
(Deacetylation)
Transformation products
Abiotic processesBiotic processes (suspended solids)Biotic processes (sewer biofilms)
Concentr
ation (μgL
-1)
Concentr
ation (μgL
-1)
HER 6MAM
T.P.HER 6MAM
Transformation pathway
Transformation pathway
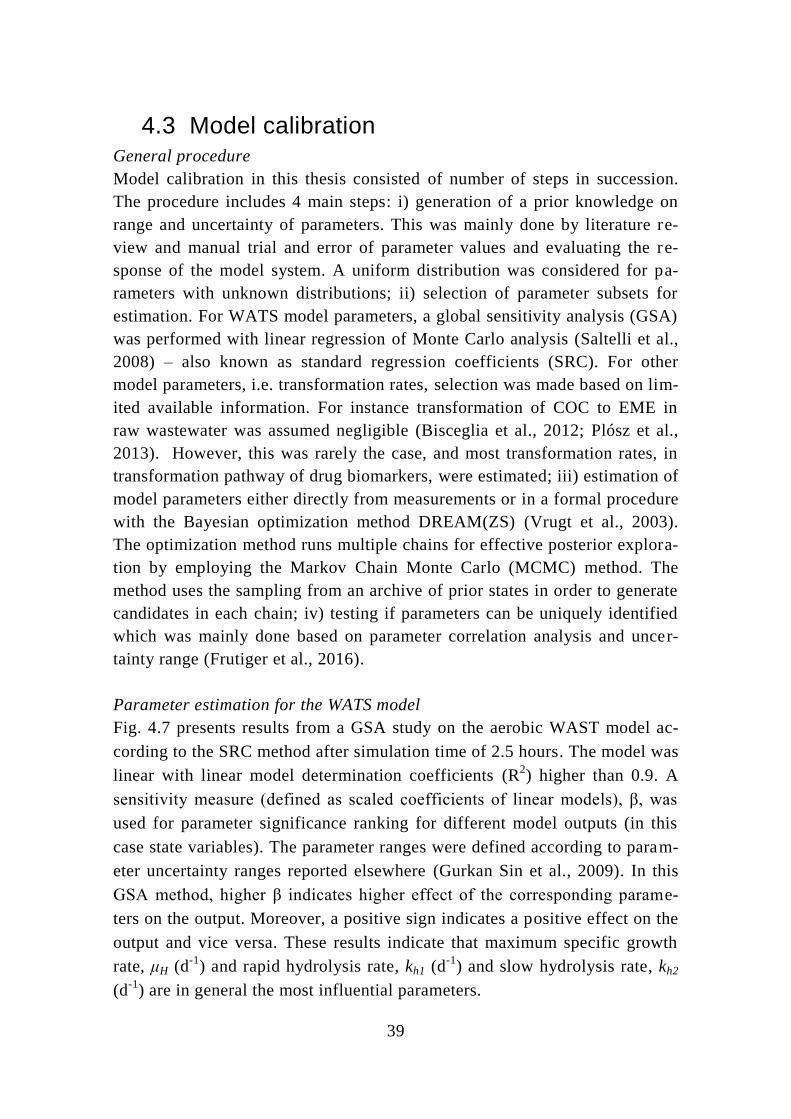
39
4.3 Model calibration General procedure
Model calibration in this thesis consisted of number of steps in succession.
The procedure includes 4 main steps: i) generation of a prior knowledge on
range and uncertainty of parameters. This was mainly done by literature re-
view and manual trial and error of parameter values and evaluating the re-
sponse of the model system. A uniform distribution was considered for pa-
rameters with unknown distributions; ii) selection of parameter subsets for
estimation. For WATS model parameters, a global sensitivity analysis (GSA)
was performed with linear regression of Monte Carlo analysis (Saltelli et al.,
2008) – also known as standard regression coefficients (SRC). For other
model parameters, i.e. transformation rates, selection was made based on lim-
ited available information. For instance transformation of COC to EME in
raw wastewater was assumed negligible (Bisceglia et al., 2012; Plósz et al.,
2013). However, this was rarely the case, and most transformation rates, in
transformation pathway of drug biomarkers, were estimated; iii) estimation of
model parameters either directly from measurements or in a formal procedure
with the Bayesian optimization method DREAM(ZS) (Vrugt et al., 2003).
The optimization method runs multiple chains for effective posterior explora-
tion by employing the Markov Chain Monte Carlo (MCMC) method. The
method uses the sampling from an archive of prior states in order to generate
candidates in each chain; iv) testing if parameters can be uniquely identified
which was mainly done based on parameter correlation analysis and uncer-
tainty range (Frutiger et al., 2016).
Parameter estimation for the WATS model
Fig. 4.7 presents results from a GSA study on the aerobic WAST model ac-
cording to the SRC method after simulation time of 2.5 hours. The model was
linear with linear model determination coefficients (R2) higher than 0.9. A
sensitivity measure (defined as scaled coefficients of linear models), β, was
used for parameter significance ranking for different model outputs (in this
case state variables). The parameter ranges were defined according to param-
eter uncertainty ranges reported elsewhere (Gurkan Sin et al., 2009). In this
GSA method, higher β indicates higher effect of the corresponding parame-
ters on the output. Moreover, a positive sign indicates a positive effect on the
output and vice versa. These results indicate that maximum specific growth
rate, μH (d-1
) and rapid hydrolysis rate, kh1 (d-1
) and slow hydrolysis rate, kh2
(d-1
) are in general the most influential parameters.
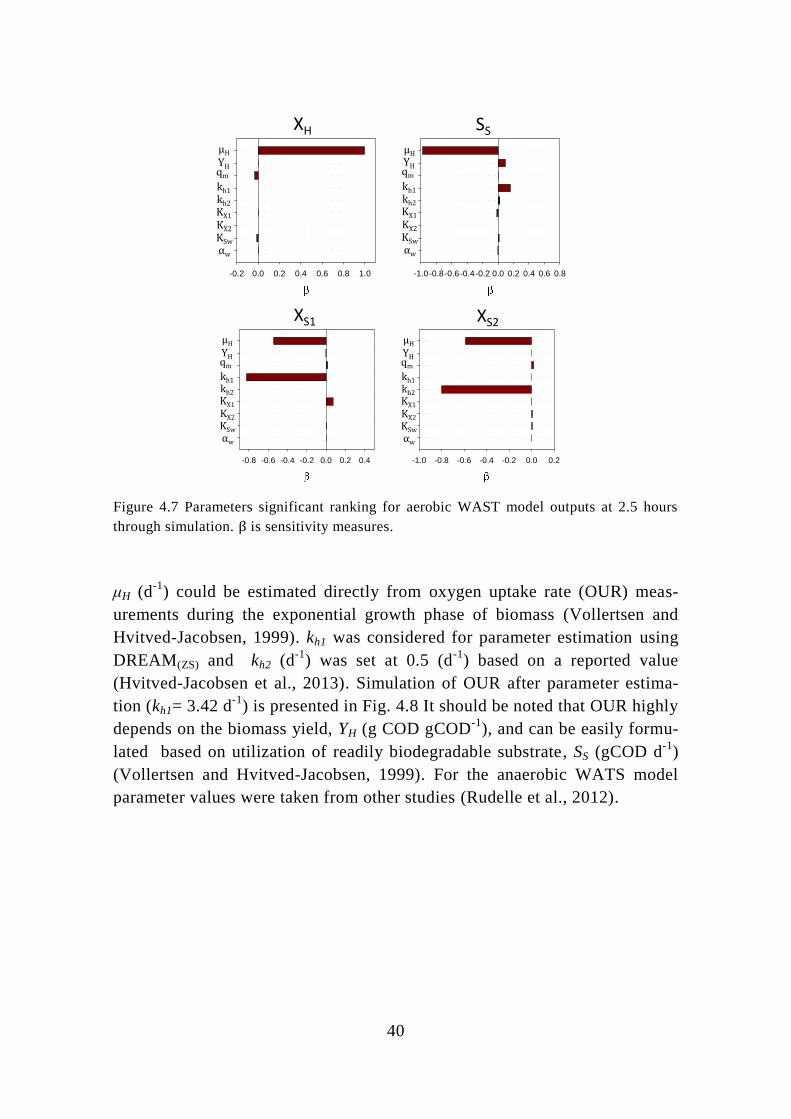
40
Figure 4.7 Parameters significant ranking for aerobic WAST model outputs at 2.5 hours
through simulation. β is sensitivity measures.
μH (d-1
) could be estimated directly from oxygen uptake rate (OUR) meas-
urements during the exponential growth phase of biomass (Vollertsen and
Hvitved-Jacobsen, 1999). kh1 was considered for parameter estimation using
DREAM(ZS) and kh2 (d-1
) was set at 0.5 (d-1
) based on a reported value
(Hvitved-Jacobsen et al., 2013). Simulation of OUR after parameter estima-
tion (kh1= 3.42 d-1
) is presented in Fig. 4.8 It should be noted that OUR highly
depends on the biomass yield, YH (g COD gCOD-1
), and can be easily formu-
lated based on utilization of readily biodegradable substrate, SS (gCOD d-1
)
(Vollertsen and Hvitved-Jacobsen, 1999). For the anaerobic WATS model
parameter values were taken from other studies (Rudelle et al., 2012).
-0.2 0.0 0.2 0.4 0.6 0.8 1.0 -1.0-0.8-0.6-0.4-0.2 0.0 0.2 0.4 0.6 0.8 -0.8 -0.6 -0.4 -0.2 0.0 0.2 0.4 -1.0 -0.8 -0.6 -0.4 -0.2 0.0 0.2
μH
YHqm
kh1
kh2
KX1
KX2
KSw
αw
μH
YHqm
kh1
kh2
KX1
KX2
KSw
αw
μH
YHqm
kh1
kh2
KX1
KX2
KSw
αw
μH
YHqm
kh1
kh2
KX1
KX2
KSw
αw
XH SS XS1 XS2
-0.2 0.0 0.2 0.4 0.6 0.8 1.0 -1.0-0.8-0.6-0.4-0.2 0.0 0.2 0.4 0.6 0.8 -0.8 -0.6 -0.4 -0.2 0.0 0.2 0.4 -1.0 -0.8 -0.6 -0.4 -0.2 0.0 0.2
μH
YHqm
kh1
kh2
KX1
KX2
KSw
αw
μH
YHqm
kh1
kh2
KX1
KX2
KSw
αw
μH
YHqm
kh1
kh2
KX1
KX2
KSw
αw
μH
YHqm
kh1
kh2
KX1
KX2
KSw
αw
XH SS XS1 XS2
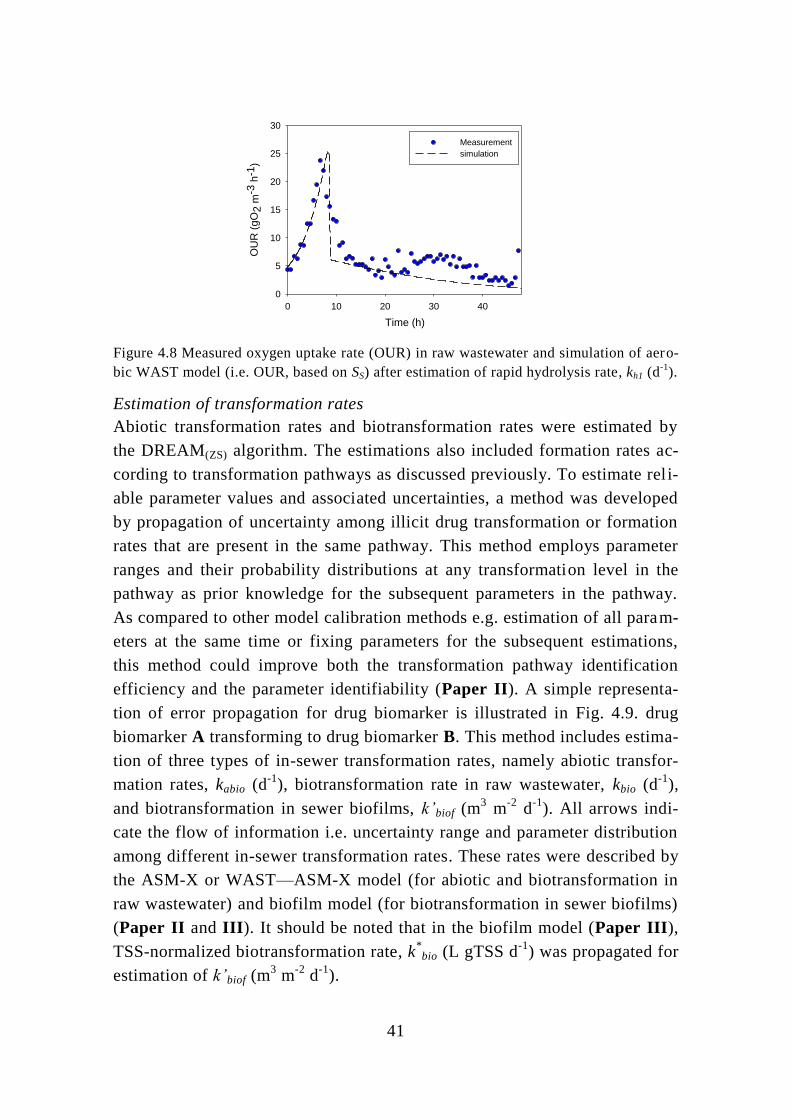
41
Figure 4.8 Measured oxygen uptake rate (OUR) in raw wastewater and simulation of aero-
bic WAST model (i.e. OUR, based on SS) after estimation of rapid hydrolysis rate, kh1 (d-1
).
Estimation of transformation rates
Abiotic transformation rates and biotransformation rates were estimated by
the DREAM(ZS) algorithm. The estimations also included formation rates ac-
cording to transformation pathways as discussed previously. To estimate reli-
able parameter values and associated uncertainties, a method was developed
by propagation of uncertainty among illicit drug transformation or formation
rates that are present in the same pathway. This method employs parameter
ranges and their probability distributions at any transformation level in the
pathway as prior knowledge for the subsequent parameters in the pathway.
As compared to other model calibration methods e.g. estimation of all param-
eters at the same time or fixing parameters for the subsequent estimations,
this method could improve both the transformation pathway identification
efficiency and the parameter identifiability (Paper II). A simple representa-
tion of error propagation for drug biomarker is illustrated in Fig. 4.9. drug
biomarker A transforming to drug biomarker B. This method includes estima-
tion of three types of in-sewer transformation rates, namely abiotic transfor-
mation rates, kabio (d-1
), biotransformation rate in raw wastewater, kbio (d-1
),
and biotransformation in sewer biofilms, k’biof (m3 m
-2 d
-1). All arrows indi-
cate the flow of information i.e. uncertainty range and parameter distribution
among different in-sewer transformation rates. These rates were described by
the ASM-X or WAST—ASM-X model (for abiotic and biotransformation in
raw wastewater) and biofilm model (for biotransformation in sewer biofilms)
(Paper II and III). It should be noted that in the biofilm model (Paper III),
TSS-normalized biotransformation rate, k*
bio (L gTSS d-1
) was propagated for
estimation of k’biof (m3 m
-2 d
-1).
Time (h)
0 10 20 30 40
OU
R (
gO
2 m
-3 h
-1)
0
5
10
15
20
25
30
Measurement
simulation
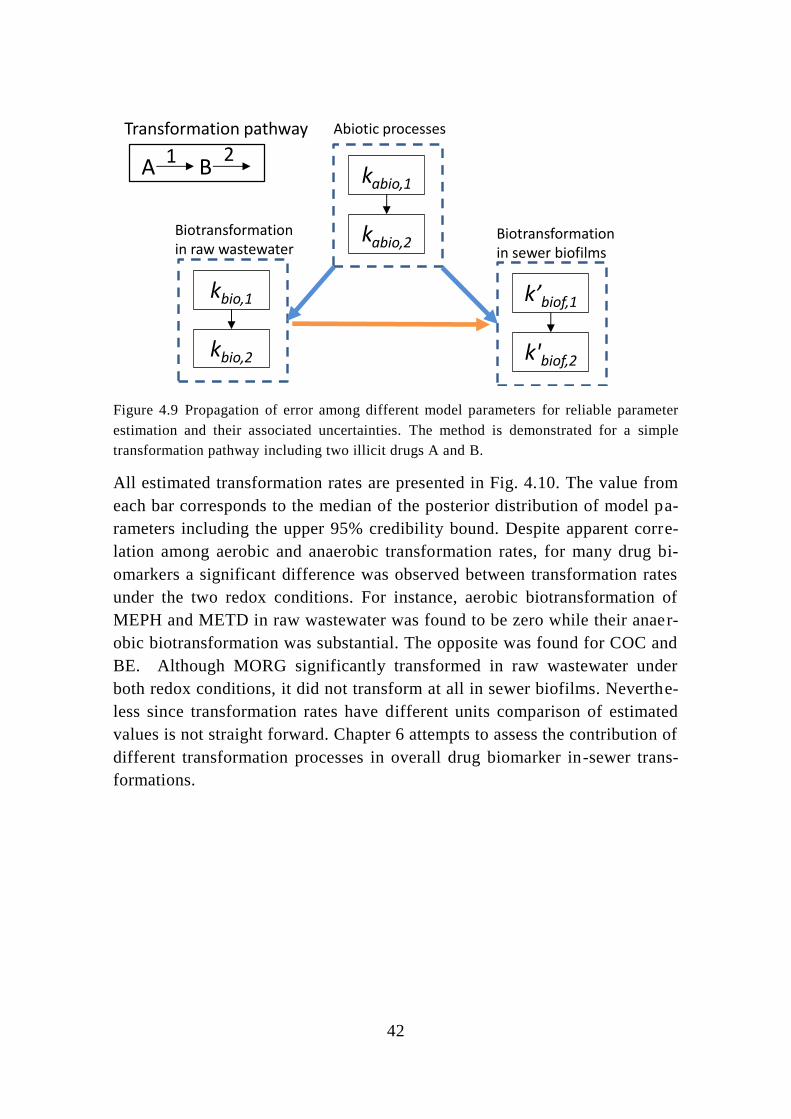
42
Figure 4.9 Propagation of error among different model parameters for reliable parameter
estimation and their associated uncertainties. The method is demonstrated for a simple
transformation pathway including two illicit drugs A and B.
All estimated transformation rates are presented in Fig. 4.10. The value from
each bar corresponds to the median of the posterior distribution of model pa-
rameters including the upper 95% credibility bound. Despite apparent corre-
lation among aerobic and anaerobic transformation rates, for many drug bi-
omarkers a significant difference was observed between transformation rates
under the two redox conditions. For instance, aerobic biotransformation of
MEPH and METD in raw wastewater was found to be zero while their anaer-
obic biotransformation was substantial. The opposite was found for COC and
BE. Although MORG significantly transformed in raw wastewater under
both redox conditions, it did not transform at all in sewer biofilms. Neverthe-
less since transformation rates have different units comparison of estimated
values is not straight forward. Chapter 6 attempts to assess the contribution of
different transformation processes in overall drug biomarker in-sewer trans-
formations.
kabio,1
kabio,2
k’biof,1
k'biof,2
kbio,1
kbio,2
A B 1 2Transformation pathway Abiotic processes
Biotransformation in raw wastewater
Biotransformation in sewer biofilms
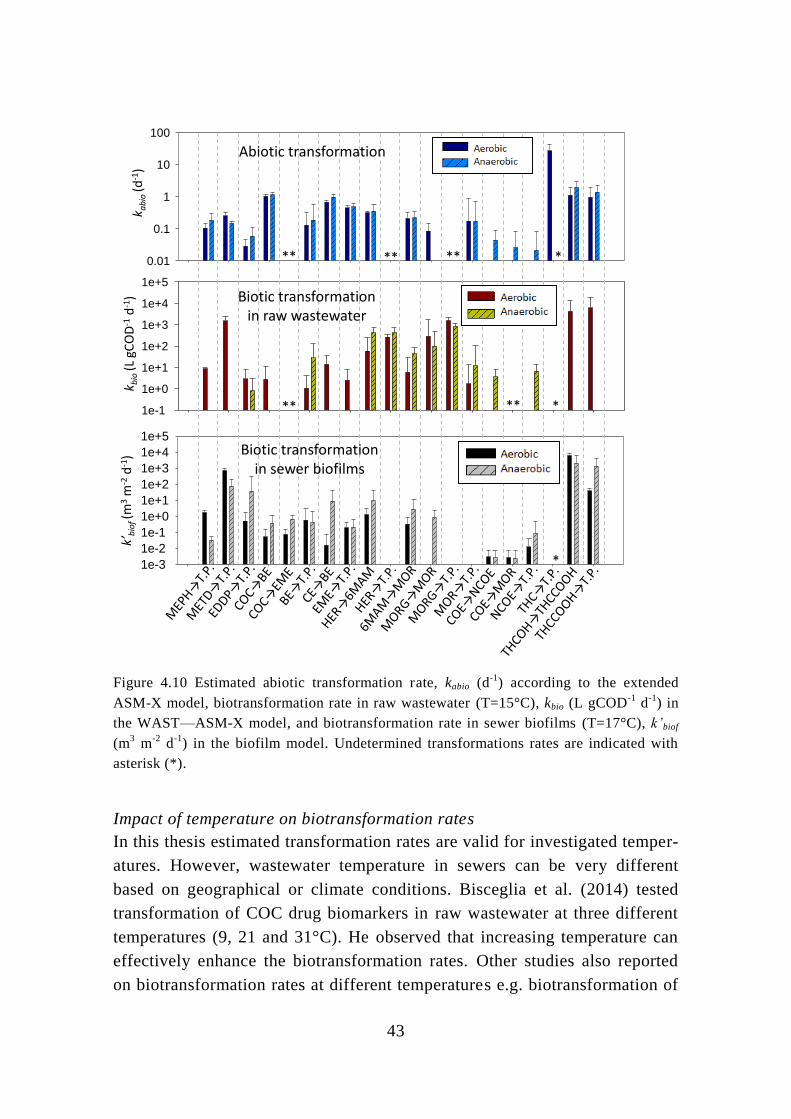
43
Figure 4.10 Estimated abiotic transformation rate, kabio (d-1
) according to the extended
ASM-X model, biotransformation rate in raw wastewater (T=15°C), kbio (L gCOD-1
d-1
) in
the WAST—ASM-X model, and biotransformation rate in sewer biofilms (T=17°C), k’biof
(m3 m
-2 d
-1) in the biofilm model. Undetermined transformations rates are indicated with
asterisk (*).
Impact of temperature on biotransformation rates
In this thesis estimated transformation rates are valid for investigated temper-
atures. However, wastewater temperature in sewers can be very different
based on geographical or climate conditions. Bisceglia et al. (2014) tested
transformation of COC drug biomarkers in raw wastewater at three different
temperatures (9, 21 and 31°C). He observed that increasing temperature can
effectively enhance the biotransformation rates. Other studies also reported
on biotransformation rates at different temperatures e.g. biotransformation of
1e-3
1e-2
1e-1
1e+0
1e+1
1e+2
1e+3
1e+4
1e+5
0.01
0.1
1
10
100
1e-1
1e+0
1e+1
1e+2
1e+3
1e+4
1e+5
k bio
(L g
CO
D-1
d-1
)k a
bio
(d-1
)k’
bio
f(m
3m
-2d
-1)
Abiotic transformation
Biotic transformationin raw wastewater
Biotic transformationin sewer biofilms
**
** ** *
*
*
****

44
COC in raw wastewater at 10 and 20°C (Senta et al., 2014), and biotransfor-
mation of COC and CE in raw wastewater at 21±1°C (McCall et al., 2016).
Fig. 4.11 shows reported k’bio(d-1
) values in these studies including the values
estimated in this thesis in raw wastewater at 15°C. The impact of temperature
on process rates is calculated using a modified Arrhenius equation similar to
the WATS model (Table 4.1): k’bio,T= k’bio,T0 × αb(T-T0)
, in which αb is the tem-
perature coefficient and k’bio,T0 is the biotransformation rate at a reference
temperature, T0. Although T0 is normally the standard temperature (20°C),
due to insufficient number of data points k’bio,20 could not be accurately esti-
mated, hence T0 was considered at 15°C and αb was estimated based on
k’bio,15. Estimation was performed with regression using reported mean or
median values of k’bio; αb,COC=1.14, αb,EME=1.13, αb,CE=1.14.
Figure 4.11 Biotransformation rate, k’bio (d-1
) for COC, EME and CE at different tempera-
tures reported by different studies including the values from this thesis (Paper I). Regres-
sion was used to estimate temperature coefficient, αb according to a modified Arrhenius
equation.
Temperature (°C)
5 10 15 20 25 30 35
kb
io (
d-1
)
0.0
0.5
1.0
1.5
2.0
2.5
3.0Bisceglia et al. 2014
Senta et al. 2014
Ramin et al. 2016
McCall et al. 2016
Temperature (°C)
5 10 15 20 25 30 35
kb
io (
d-1
)
0.0
0.5
1.0
1.5
2.0
2.5
3.0Bisceglia et al. 2014
Senta et al. 2014
Ramin et al. 2016
McCall et al. 2016
Temperature (°C)
5 10 15 20 25 30 35
kb
io (
d-1
)
0
2
4
6
8Bisceglia et al. 2014
Ramin et al. 2016
Temperature (°C)
5 10 15 20 25 30 35
kb
io (
d-1
)
0.0
0.2
0.4
0.6
0.8
1.0
1.2
1.4
1.6Bisceglia et al. 2014
Ramin et al. 2016
McCall et al. 2016
COC EME
CE
k‘b
io(d
-1)
k‘b
io(d
-1)
k‘b
io(d
-1)
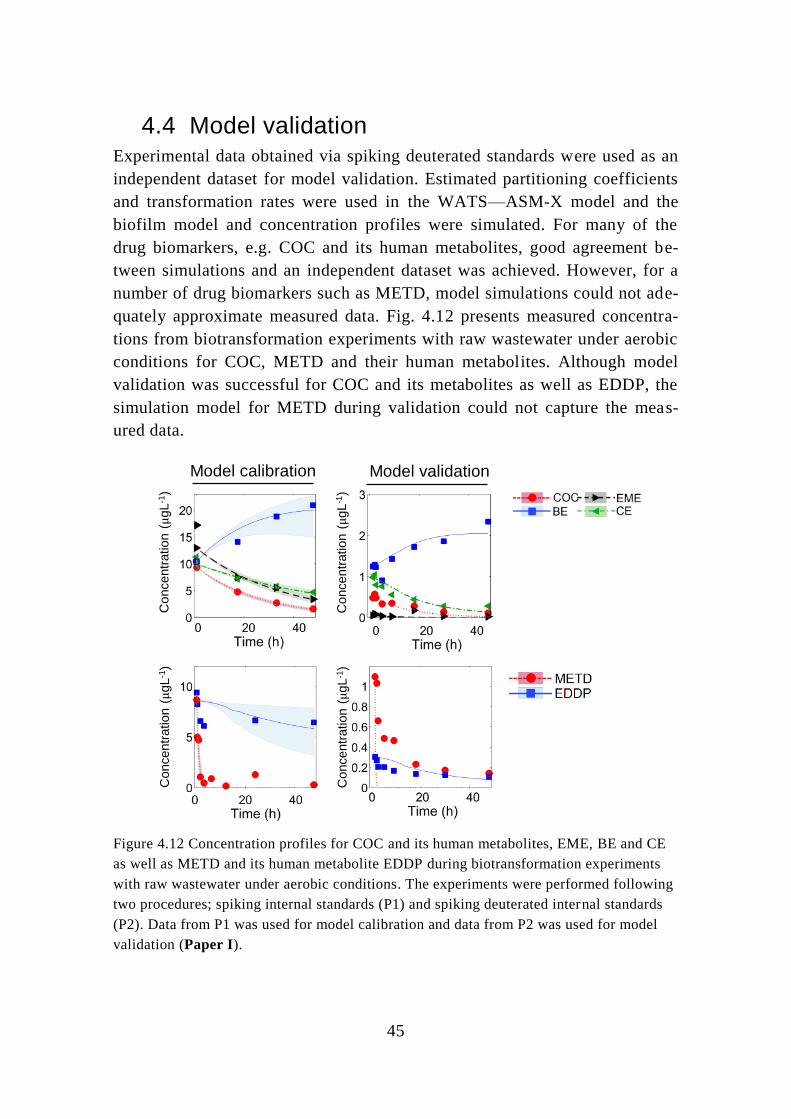
45
4.4 Model validation Experimental data obtained via spiking deuterated standards were used as an
independent dataset for model validation. Estimated partitioning coefficients
and transformation rates were used in the WATS—ASM-X model and the
biofilm model and concentration profiles were simulated. For many of the
drug biomarkers, e.g. COC and its human metabolites, good agreement be-
tween simulations and an independent dataset was achieved. However, for a
number of drug biomarkers such as METD, model simulations could not ade-
quately approximate measured data. Fig. 4.12 presents measured concentra-
tions from biotransformation experiments with raw wastewater under aerobic
conditions for COC, METD and their human metabolites. Although model
validation was successful for COC and its metabolites as well as EDDP, the
simulation model for METD during validation could not capture the meas-
ured data.
Figure 4.12 Concentration profiles for COC and its human metabolites, EME, BE and CE
as well as METD and its human metabolite EDDP during biotransformation experiments
with raw wastewater under aerobic conditions. The experiments were performed following
two procedures; spiking internal standards (P1) and spiking deuterated internal standards
(P2). Data from P1 was used for model calibration and data from P2 was used for model
validation (Paper I).
Model calibration Model validation
Co
ncentr
ation (μgL
-1)
Co
ncentr
ation (μgL
-1)
Co
ncentr
ation (μgL
-1)
Co
ncentr
ation (μgL
-1)

46
47
5 Monitoring campaigns
Sampling from Lynetten WWTP
As part of this thesis, several sampling campaigns were performed at the inlet
of Lynetten WWTP located in the city center of Copenhagen (Denmark). The
catchment covers Copenhagen and seven other municipalities with total re-
duced area of 7600 ha and an estimated population of 531000 inhabitants
(last census: 2009). A major part of the drainage system is built as a com-
bined system where domestic and industrial wastewater as well as storm wa-
ter is conveyed to the treatment plant. The plant has a design capacity of
750000 PE with an average daily wastewater inflow of 175000 m3 d
-1. The
treated effluent is discharged in the Øresund strait. At the inlet of the plant
there are three pressurized collectors: the northern pipe stretching from
Strandvænget pump station which receives flow also from the Skovshoved
pump station, and two southern pipes from Kløvermarken pump station
(Breinholt and Sharma, 2010).
Participation in Europe-wide monitoring campaign
The first Europe-wide monitoring campaign was performed in 2011 by the
Sewage Analysis CORe group Europe (SCORE) network and is still annually
performed. This group aims at providing patterns of drug use at geographical
and temporal resolution across European cities. The network has established
a robust protocol concerning representative sample collection, sample prepa-
ration, analysis and data reporting. A minor part of this PhD thesis work was
devoted to contributing to SCORE group activities by performing 1-week
sampling campaigns during March in 2013, 2014 and 2015. Samplings were
performed after the primary clarifier with a volume-proportional automatic
sampler installed at this location (sampling interval of every 2000 m3 sew-
age). Samples were collected in refrigerated plastic containers. At the end of
each sampling day, collected samples were acidified (1% v/v, acetic acid) and
transported to a freezer. Following defrosting and sample preparation (i.e.
SPE), samples were sent to project partners for analysis. Briefly, analysis was
carried out using the Waters Acquity UPLC system, with a Xevo G2-S QTOF
detector according to developed methods (Baz-Lomba et al., 2016). Fig. 5.1,
reports the illicit drug biomarkers that were detected in the samples for each
year. This figure includes additional illicit drugs, Amphetamine (AMPH),
Methamphetamine (METH) and 3,4-Methylenedioxymethamphetamine
(MDMA) that are not discussed in this thesis. The average concentrations of
biomarkers during weekday and weekends in Copenhagen (CPH) are com-
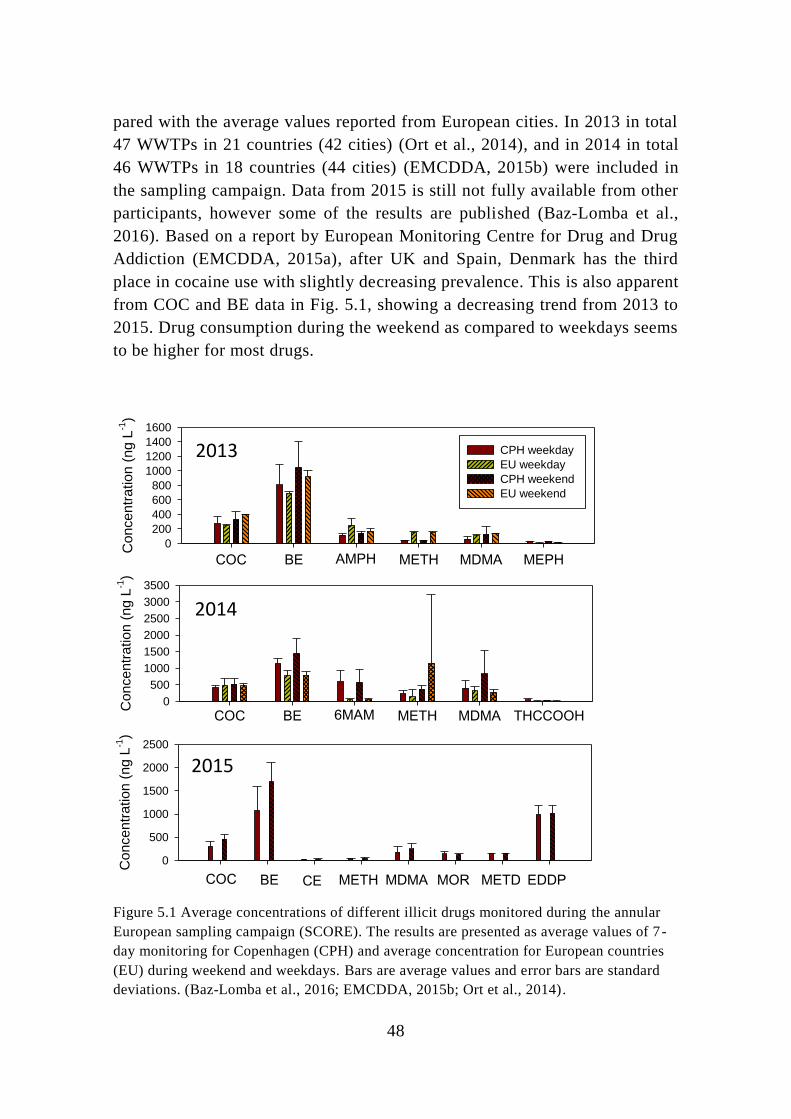
48
pared with the average values reported from European cities. In 2013 in total
47 WWTPs in 21 countries (42 cities) (Ort et al., 2014), and in 2014 in total
46 WWTPs in 18 countries (44 cities) (EMCDDA, 2015b) were included in
the sampling campaign. Data from 2015 is still not fully available from other
participants, however some of the results are published (Baz-Lomba et al.,
2016). Based on a report by European Monitoring Centre for Drug and Drug
Addiction (EMCDDA, 2015a), after UK and Spain, Denmark has the third
place in cocaine use with slightly decreasing prevalence. This is also apparent
from COC and BE data in Fig. 5.1, showing a decreasing trend from 2013 to
2015. Drug consumption during the weekend as compared to weekdays seems
to be higher for most drugs.
Figure 5.1 Average concentrations of different illicit drugs monitored during the annular
European sampling campaign (SCORE). The results are presented as average values of 7 -
day monitoring for Copenhagen (CPH) and average concentration for European countries
(EU) during weekend and weekdays. Bars are average values and error bars are standard
deviations. (Baz-Lomba et al., 2016; EMCDDA, 2015b; Ort et al., 2014).
Co
nce
ntr
atio
n (
ng L
-1)
0
200
400
600
800
1000
1200
1400
1600
CPH weekday
EU weekday
CPH weekend
EU weekend
COC BE AMPH METH MDMA MEPH
Co
nce
ntr
atio
n (
ng L
-1)
0
500
1000
1500
2000
2500
3000
3500
COC BE 6MAM METH MDMA THCCOOH
Co
nce
ntr
atio
n (
ng L
-1)
0
500
1000
1500
2000
2500
COC BE CE METH MDMA METDMOR EDDP
2013
2014
2015
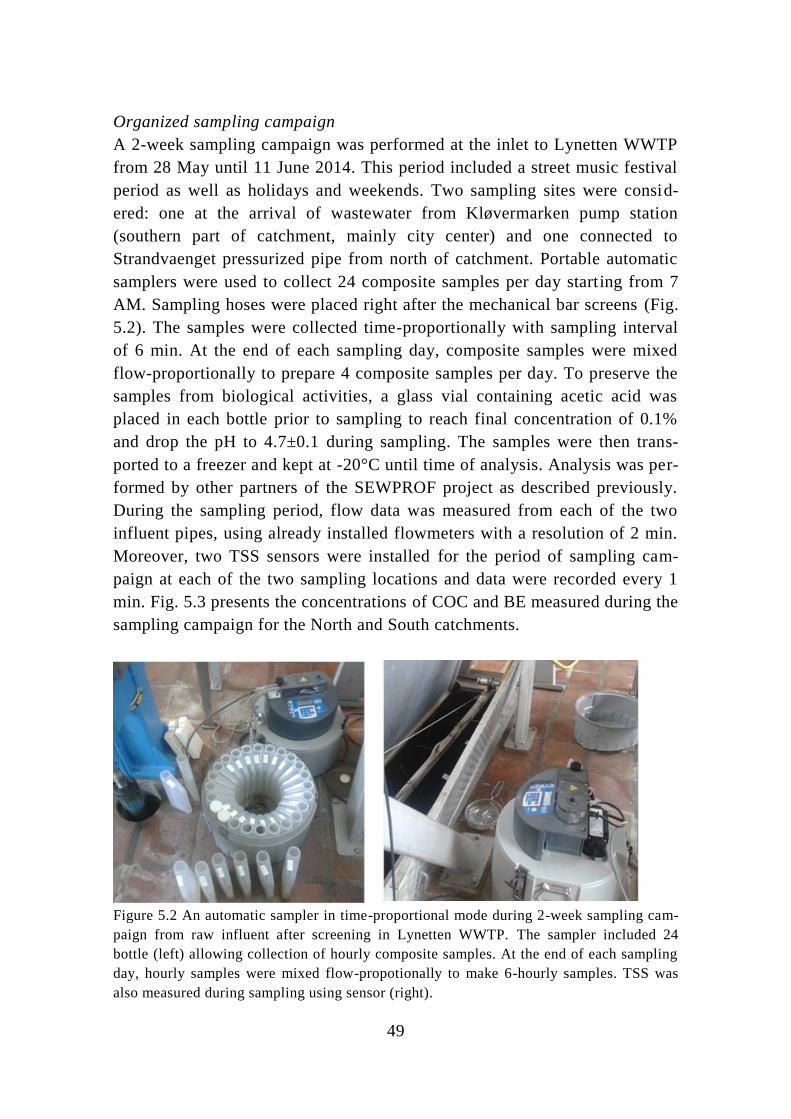
49
Organized sampling campaign
A 2-week sampling campaign was performed at the inlet to Lynetten WWTP
from 28 May until 11 June 2014. This period included a street music festival
period as well as holidays and weekends. Two sampling sites were consid-
ered: one at the arrival of wastewater from Kløvermarken pump station
(southern part of catchment, mainly city center) and one connected to
Strandvaenget pressurized pipe from north of catchment. Portable automatic
samplers were used to collect 24 composite samples per day starting from 7
AM. Sampling hoses were placed right after the mechanical bar screens (Fig.
5.2). The samples were collected time-proportionally with sampling interval
of 6 min. At the end of each sampling day, composite samples were mixed
flow-proportionally to prepare 4 composite samples per day. To preserve the
samples from biological activities, a glass vial containing acetic acid was
placed in each bottle prior to sampling to reach final concentration of 0.1%
and drop the pH to 4.7±0.1 during sampling. The samples were then trans-
ported to a freezer and kept at -20°C until time of analysis. Analysis was per-
formed by other partners of the SEWPROF project as described previously.
During the sampling period, flow data was measured from each of the two
influent pipes, using already installed flowmeters with a resolution of 2 min.
Moreover, two TSS sensors were installed for the period of sampling cam-
paign at each of the two sampling locations and data were recorded every 1
min. Fig. 5.3 presents the concentrations of COC and BE measured during the
sampling campaign for the North and South catchments.
Figure 5.2 An automatic sampler in time-proportional mode during 2-week sampling cam-
paign from raw influent after screening in Lynetten WWTP. The sampler included 24
bottle (left) allowing collection of hourly composite samples. At the end of each sampling
day, hourly samples were mixed flow-propotionally to make 6-hourly samples. TSS was
also measured during sampling using sensor (right).
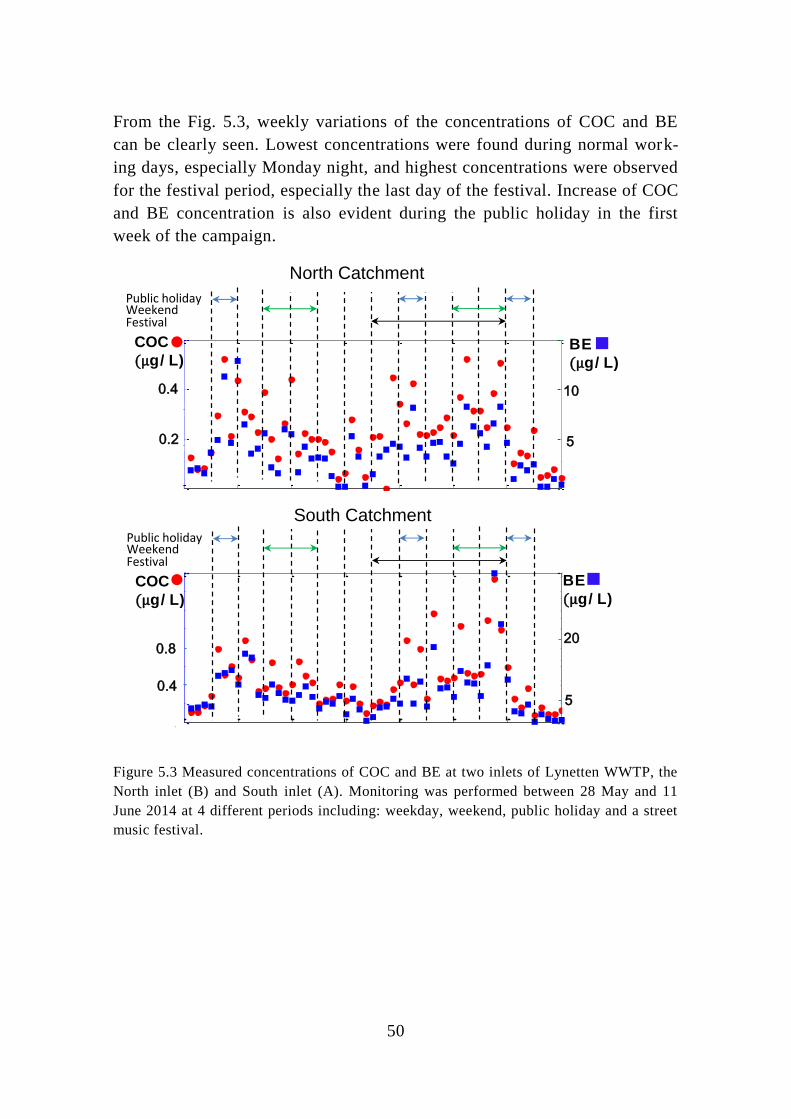
50
From the Fig. 5.3, weekly variations of the concentrations of COC and BE
can be clearly seen. Lowest concentrations were found during normal work-
ing days, especially Monday night, and highest concentrations were observed
for the festival period, especially the last day of the festival. Increase of COC
and BE concentration is also evident during the public holiday in the first
week of the campaign.
Figure 5.3 Measured concentrations of COC and BE at two inlets of Lynetten WWTP, the
North inlet (B) and South inlet (A). Monitoring was performed between 28 May and 11
June 2014 at 4 different periods including: weekday, weekend, public holiday and a street
music festival.
0 2 4 6 8 10 12 140
200
400
600
0 2 4 6 8 10 12 140
5000
10000
15000
0 2 4 6 8 10 12 140
200
400
600
800
1000
1200
1400
1600
CO
C
0 2 4 6 8 10 12 140
0.5
1
1.5
2
2.5
3
3.5
x 104
BE
20
50.4
BE
(μg/ L)COC
(μg/ L)
0.8
Public holidayWeekendFestival
10
50.2
BE
(μg/ L)
COC
(μg/ L)
0.4
Public holidayWeekendFestival
North Catchment
gC
OC
d-1
10
00
PE
-1
0
2
4
6
8
Weekday
Weekend
Holiday
Festival
gC
OC
d-1
10
00
PE
-1
0.0
0.5
1.0
1.5
2.0
2.5
3.0
Col 19
Col 23
Col 27
Col 31
South Catchment
North Catchment gC
OC
d-1
10
00
PE
-1
0
2
4
6
8
Weekday
Weekend
Holiday
Festival
gC
OC
d-1
10
00
PE
-1
0.0
0.5
1.0
1.5
2.0
2.5
3.0
Col 19
Col 23
Col 27
Col 31
South Catchment
51
6 Estimation of drug use in catchments
Generic assessment by scenario analysis
One of the concluding goals of this thesis is to refine the existing drug use
estimation methods by accounting for in-sewer processes. These processes
should be included in back-calculation schemes at the catchment level. The
extent of in-sewer drug biomarker transformations significantly depends on
the hydraulic residence time in the sewer. Drug biomarkers enter the sewer
system mostly after toilet flushes across the catchment. Depending on the
distance of drug release to the sampling point, the flow velocity (and other
sewer design factors such as pump sump volume) and the hydraulic residence
time can be very variable. Moreover, beside diurnal variations (resolution of
hours), the loads of drug biomarkers exhibit short term fluctuations (resolu-
tion of seconds to minutes) as previously reported (Ort et al., 2010c). Em-
ploying in-sewer processes in such a highly dynamic systems – across spatio-
temporal scales – is very challenging. However, since estimations in WBE
studies are normally based on hourly to daily drug consumption, the chal-
lenge of short-term variations of drug loads remains mainly for representative
sampling (Paper IV) and not the estimation of transformation of drug bi-
omarkers in the sewer. Nevertheless, prediction of spatial variability of drug
release – and hence hydraulic residence time – seems rather crucial.
In this thesis, a simple approach was considered by assuming a theoretical
discharge point in the catchment. This discharge point has no physical mean-
ing but is rather conceptually defined based on the average hydraulics resi-
dence time in the catchment. The error introduced by neglecting in-sewer
processes was calculated by comparing the daily drug load at the theoretical
discharge point estimated with and without in-sewer processes. The contribu-
tion of uncertainties from different transformations i.e. abiotic transformation
and biotransformation in raw wastewater and sewer biofilms was also quanti-
fied by neglecting each of these processes individually and comparison of
back-calculation with the reference scenario. This assessment was performed
for COC, BE, MOR, MORG and 6MAM with three different catchment sizes:
small, 10000 PE; medium, 50000 PE and large, 200000 PE.
The sewage pattern generator (SPG) software (Ort, 2016) was used to gener-
ate drug load profiles with short term variations at the WWTPs inlet. Selected
drug pharmacokinetics, i.e. excretion profiles, together with other assump-
tions e.g. flow distance distribution, were used as input to the model. Subse-
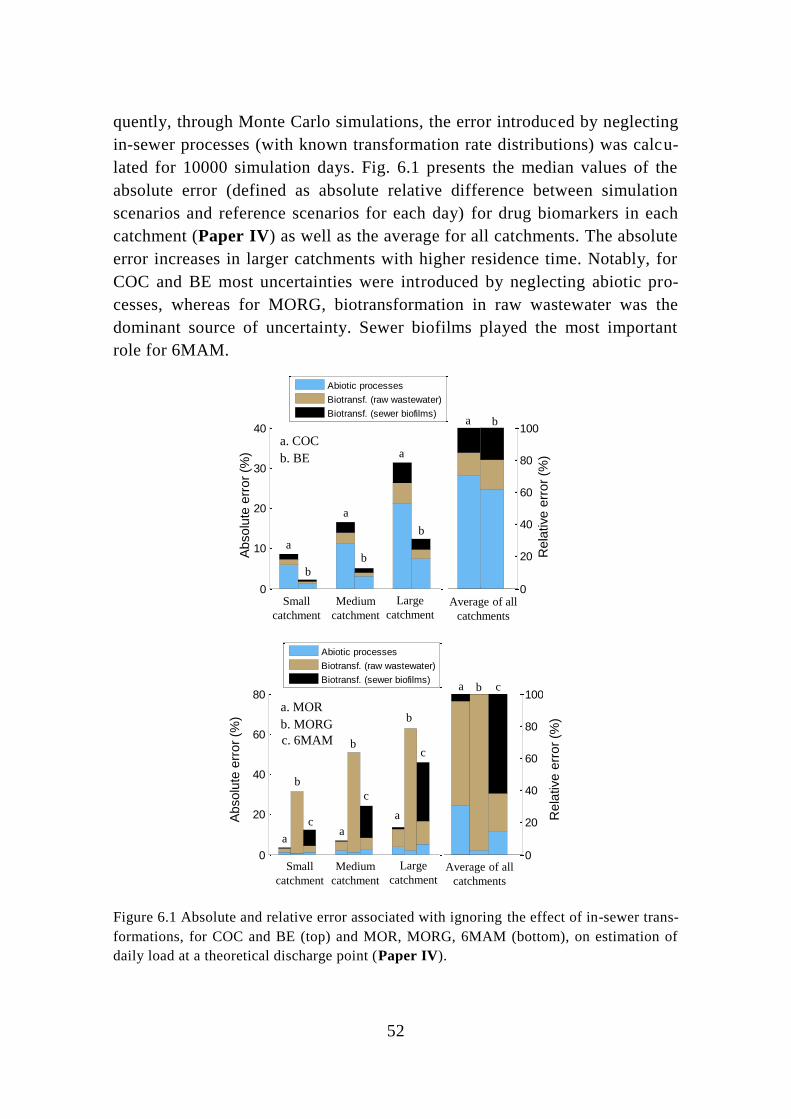
52
quently, through Monte Carlo simulations, the error introduced by neglecting
in-sewer processes (with known transformation rate distributions) was calcu-
lated for 10000 simulation days. Fig. 6.1 presents the median values of the
absolute error (defined as absolute relative difference between simulation
scenarios and reference scenarios for each day) for drug biomarkers in each
catchment (Paper IV) as well as the average for all catchments. The absolute
error increases in larger catchments with higher residence time. Notably, for
COC and BE most uncertainties were introduced by neglecting abiotic pro-
cesses, whereas for MORG, biotransformation in raw wastewater was the
dominant source of uncertainty. Sewer biofilms played the most important
role for 6MAM.
Figure 6.1 Absolute and relative error associated with ignoring the effect of in-sewer trans-
formations, for COC and BE (top) and MOR, MORG, 6MAM (bottom), on estimation of
daily load at a theoretical discharge point (Paper IV).
0
20
40
60
80
100
0
20
40
60
80
100
0
20
40
60
80
100
0
20
40
60
80
100
0
20
40
60
80
0
10
20
30
40
Abiotic processes
Biotransf. (raw wastewater)
Biotransf. (sewer biofilms)
0
2
4
6
8
10
12
14
Abiotic processes
Biotransf. (raw wastewater)
Biotransf. (sewer biofilms)
Small
catchment
a. COC
a
b
b
b
a
a
aa
a
c
c
c
b
b
b
b. BE
Ab
solu
te e
rro
r (%
)A
bsolu
te e
rro
r (%
)
Re
lative
err
or
(%)
Re
lative
err
or
(%)
0
2
4
6
8
10
12
14
Abiotic processes
Biotransf. (raw wastewater)
Biotransf. (sewer biofilms)
a b
a b c
0
20
40
60
80
100
0
20
40
60
80
100
Medium
catchment
Large
catchmentAverage of all
catchments
Small
catchment
Medium
catchment
Large
catchmentAverage of all
catchments
a. MOR
b. MORG
c. 6MAM
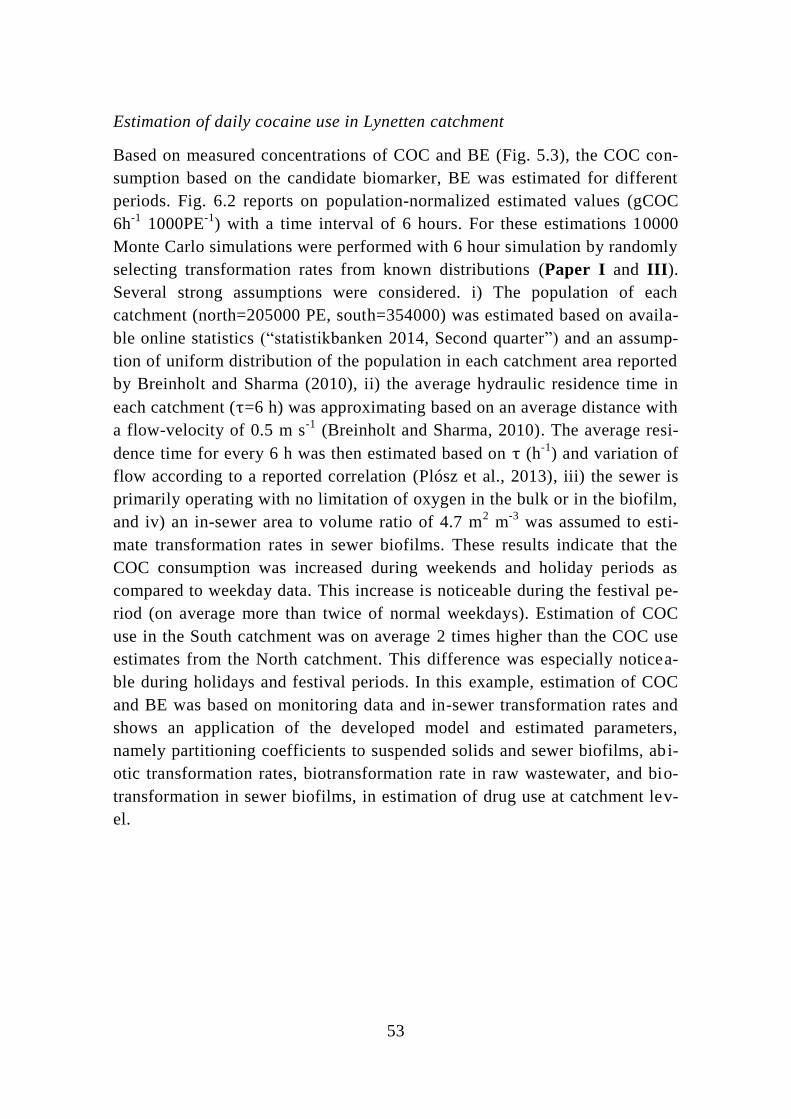
53
Estimation of daily cocaine use in Lynetten catchment
Based on measured concentrations of COC and BE (Fig. 5.3), the COC con-
sumption based on the candidate biomarker, BE was estimated for different
periods. Fig. 6.2 reports on population-normalized estimated values (gCOC
6h-1
1000PE-1
) with a time interval of 6 hours. For these estimations 10000
Monte Carlo simulations were performed with 6 hour simulation by randomly
selecting transformation rates from known distributions (Paper I and III).
Several strong assumptions were considered. i) The population of each
catchment (north=205000 PE, south=354000) was estimated based on availa-
ble online statistics (“statistikbanken 2014, Second quarter”) and an assump-
tion of uniform distribution of the population in each catchment area reported
by Breinholt and Sharma (2010), ii) the average hydraulic residence time in
each catchment (τ=6 h) was approximating based on an average distance with
a flow-velocity of 0.5 m s-1
(Breinholt and Sharma, 2010). The average resi-
dence time for every 6 h was then estimated based on τ (h-1
) and variation of
flow according to a reported correlation (Plósz et al., 2013), iii) the sewer is
primarily operating with no limitation of oxygen in the bulk or in the biofilm,
and iv) an in-sewer area to volume ratio of 4.7 m2 m
-3 was assumed to esti-
mate transformation rates in sewer biofilms. These results indicate that the
COC consumption was increased during weekends and holiday periods as
compared to weekday data. This increase is noticeable during the festival pe-
riod (on average more than twice of normal weekdays). Estimation of COC
use in the South catchment was on average 2 times higher than the COC use
estimates from the North catchment. This difference was especially noticea-
ble during holidays and festival periods. In this example, estimation of COC
and BE was based on monitoring data and in-sewer transformation rates and
shows an application of the developed model and estimated parameters,
namely partitioning coefficients to suspended solids and sewer biofilms, abi-
otic transformation rates, biotransformation rate in raw wastewater, and bio-
transformation in sewer biofilms, in estimation of drug use at catchment lev-
el.
54
Figure 6.2 COC consumption with 6 h time interval (X axis) during a 2-week sampling
campaign at the influent of Lynetten WWTP in Copenhagen. Estimated consumptions are
reported as gCOC 6h-1
1000PE-1
for the North catchment (top) and South catchments (bot-
tom).
gC
OC
6h
-1 1
00
0 P
E-1
0
1
2
3
4
5
Weekday
Weekend
Holiday
Festival
gC
OC
6h
-1 1
00
0 P
E-1
0
2
4
6
8
10
12
North Catchment
South Catchment
55
7 Conclusion
The study presented in this thesis is the first example of developing a detailed
mathematical description of transformation and partitioning of illicit drug
biomarkers in sewer systems. To reach the major conclusion of this thesis,
prediction of in-sewer fate processes were addressed from five different per-
spectives - namely experimental assessments, model development, model cal-
ibration, uncertainty analysis for daily drug use estimates and model applica-
tion.
Through different experimental assessments, it was found that drug bi-
omarkers can potentially undergo significant sorption and transfor-
mation in the sewers. Among the selected drug biomarkers in this the-
sis such as COC and CE, chemical hydrolysis and to a lesser extent bi-
otransformation was responsible for most transformations in the sewer
bulk. However, significant removal of HER and MORG was also ob-
served in raw wastewater with much less removal in mineral water.
Overall, aerobic and anaerobic transformations in mineral water
showed higher similarity than aerobic and anaerobic biotransformation
in raw wastewater and sewer biofilms. Redox conditions played an im-
portant role in transformation of a number of chemicals. For instance,
substantial removal of METD was observed in raw wastewater under
aerobic conditions, whereas no removal was shown under anaerobic
conditions. This may suggest that the activity of the bacterial commu-
nity, responsible for biotransformation of drug biomarkers, can be very
different under different redox conditions. Sewer biofilms can signifi-
cantly enhance the overall transformation of drug biomarkers. This
was especially observed for EDDP, COC, EME and 6MAM. However,
the extent of biotransformation was different in aerobic and anaerobic
biofilms. Following sorption experiments, the highest sorption capaci-
ty to suspended solids and biofilms (in suspended form) was shown for
THCOH and THCCOOH due to very high hydrophobicity of these
chemicals. For other drug biomarkers, rather than 6MAM, no signifi-
cant partitioning to suspended solids was observed. EME was only
sorbed to anaerobic biofilms and not the aerobic one. These evidences
provided new insights on the fate of drug biomarkers in the presence of
different sewer biosolids and supported the requirements for prediction
the fate of these chemicals in sewers.
56
Sorption and transformation of drug biomarkers in mineral water and
raw wastewater (presence of suspended solids) could be adequately
predicted by the extended Activated Sludge Modelling framework for
Xenobiotics (ASM-X). The model was then further extended with pre-
diction of primary metabolic processes using the Wastewater Aero-
bic/anaerobic Transformations in Sewers (WATS) model. Following
estimation of transformation rates, it was found that neglecting the dy-
namics of biomass during batch experiments could result in significant
over estimation of aerobic biotransformation rates in raw wastewater.
However, no significant difference was observed for the biotransfor-
mation rates under anaerobic conditions. These results suggest that
considering the variation of biomass is rather crucial for accurate esti-
mation of aerobic biotransformation rates in raw wastewater. This is
especially relevant for sewers which are often operated under the con-
ditions of significance biomass growth e.g. in gravity sewers, due to
high substrate-to-biomass ratio. Moreover, the 1-D biofilm model was
successful in simulating concentrations of drug biomarkers in the
aqueous phase of biofilm reactors. It was shown that an inaccurate
boundary layer thickness and number of discretization for spatial inte-
gration in the model can deteriorate the accuracy of simulation. All
models could be validated for most tested drug biomarkers, except a
few such as METD. The validation was performed by using an inde-
pendent dataset.
It was demonstrated that transformation pathways in sewers may be
different from human metabolism. A calibration method was devel-
oped based on propagating uncertainty associated with model parame-
ters. The method developed was compared with estimation methods
commonly used in literature (i.e. estimation of all parameters at the
same time or fixing parameters at earlier levels). Proposed method
could outperform other methods in terms of prediction accuracy, trans-
formation pathway identification efficiency and parameter identifiabil-
ity
At the catchment level, uncertainties in estimation of daily drug con-
sumption, that are associated with neglecting, or imprecisely predict-
ing, in-sewer transformation, were assessed through scenario analysis
for different catchment sizes. Moreover the error imposed by inaccu-
rate sampling was also assessed. Under the tested conditions, the re-
sults indicated that ignoring in-sewer transformation of drug bi-

57
omarkers can introduce significant error as compared to inaccurate
sampling, especially for larger catchments. It was found that abiotic
processes play an important role in prediction of daily COC consump-
tion based on BE. However, in estimation of HER consumption based
on 6MAM, it was the sewer biofilms that dominated the total transfor-
mations.
Eventually, the developed model was successfully applied to estimate
COC consumption in Lynetten catchment, in Copenhagen, Denmark,
based on a 2-week monitoring campaign performed at Lynetten
WWTP inlet. The full-scale evaluation for Lynetten catchment pre-
sented in this thesis represents one of the first examples of estimation
of drug use by including a detailed fate processes.

58
59
8 Future perspectives
Experimental assessments carried out in this thesis demonstrated that many of
selected drug biomarkers undergo significant transformations. Different fac-
tors can impact the transformation of drug biomarkers that were not assessed
in this thesis including i) transformation under different pH levels. This can
be an influential factor as the activity of bacterial community can be impact-
ed at different pH levels; ii) transformation tests with representative concen-
tration of drug biomarkers. High concentration of drug biomarkers in batch
experiments might have strong impact on cometabolism of drug biomarkers.
Possible inhibition of microorganisms that capable of biotransformation of
selected drug biomarkers should be considered (Alexander, 1985); iii) moni-
toring formation of drug biomarkers with deuterated standards. This would
allow direct observation of illicit drugs that are formed such as benzoylec-
gonine (McCall et al., 2016; Thai et al., 2014); iv) biotransformation experi-
ments with sewer sediments; v) transformation tests in sewer sections similar
to the experiment performed by Jelic et al. (2014) for pharmaceuticals. The
tests should be conducted in both aerobic and anaerobic sewer sections.
The mathematical models presented in this thesis could adequately predict
most transformation processes. However, model simulation and calibration
were validated for transformations in laboratory scale systems. The predic-
tion potential of these models should be validated in sewer systems. At
catchment level, the fate of illicit drugs should be formulated together with
prediction of flowrates, such as the modeling tool for dynamic transport and
fate of micropollutants (Vezzaro et al., 2014). The model should ideally in-
clude prediction of drug biomarkers at temporal and spatial scales.
The biofilm model in this thesis is rather simplified by assuming the density
and thickness of biofilm as fixed parameters. This is while the concentration
of all electron donors and acceptors and biomass composition exhibit a gradi-
ent inside the biofilm. In this respect, the biofilm is not a homogeneous sys-
tem. Different multispecies model has been developed for sewer biofilms in-
cluding the interactions among different microbial species (Huisman et al.,
2003; Jiang et al., 2009). Incorporating the active biomass fraction in predic-
tion of illicit drug transformation processes can be beneficial for more accu-
rate estimation of transformation rates, similar to the approach in WATS—
ASM-X model.

60
61
9 References
Achleitner, S., Möderl, M., Rauch, W., 2007. CITY DRAIN © – An open source approach
for simulation of integrated urban drainage systems. Environ. Model. Softw. 22,
1184–1195.
Alexander, M., 2000. Aging, bioavailability, and overestimation of risk from
environmental pollutants. Environ. Sci. Technol. 34, 4259–4265.
Alexander, M., 1985. Biodegradation of organic chemicals. Environ. Sci. Technol. 19,
106–111.
Bach, P.M., Rauch, W., Mikkelsen, P.S., Mccarthy, D.T., Deletic, A., 2014. A critical
review of integrated urban water modelling - Urban drainage and beyond. Environ.
Model. Softw. 54, 88–107.
Baker, D.R., Kasprzyk-Hordern, B., 2011. Critical evaluation of methodology commonly
used in sample collection, storage and preparation for the analysis of pharmaceuticals
and illicit drugs in surface water and wastewater by solid phase extraction and liquid
chromatography-mass spectrometry. J. Chromatogr. A 1218, 8036–59.
Banta-Green, C., Field, J., 2011. City-wide drug testing using municipal wastewater.
Significance 8, 70–74.
Baz-Lomba, J.A., Salvatore, S., Gracia-Lor, E., Bade, R., Castiglioni, S., Castrignanò, E.,
Causanilles, A., Hernandez, F., Kasprzyk-Hordern, B., Kinyua, J., McCall, A.-K., van
Nuijs, A., Ort, C., Plósz, B.G., Ramin, P., Reid, M., Rousis, N.I., Ryu, Y., de Voogt,
P., Bramness, J., Thomas, K., 2016. Comparison of pharmaceutical, illicit drug,
alcohol, nicotine and caffeine levels in wastewater with sale, seizure and consumption
data for 8 European cities. BMC Public Health 16.
Benedetti, L., Langeveld, J., Comeau, A., Corominas, L., Daigger, G., Martin, C.,
Mikkelsen, P.S., Vezzaro, L., Weijers, S., Vanrolleghem, P.A., 2013. Modelling and
monitoring of integrated urban wastewater systems: review on status and
perspectives. Water Sci. Technol. 68, 1203–1215.
Bijlsma, L., Emke, E., Hernández, F., de Voogt, P., 2013. Performance of the linear ion
trap Orbitrap mass analyzer for qualitative and quantitative analysis of drugs of abuse
and relevant metabolites in sewage water. Anal. Chim. Acta 768, 102–110.
Bisceglia, K.J., Roberts, A.L., Lippa, K.A., 2012. A hydrolysis procedure for the analysis
of total cocaine residues in wastewater. Anal. Bioanal. Chem. 402, 1277–1287.
Bisceglia, K.J.K., Lippa, K. a, 2014. Stability of cocaine and its metabolites in municipal
wastewater - the case for using metabolite consolidation to monitor cocaine
utilization. Environ. Sci. Pollut. Res. 21, 4453–4460.
Borova, V.L., Maragou, N.C., Gago-Ferrero, P., Pistos, C., Thomaidis, N.S., 2014. Highly
sensitive determination of 68 psychoactive pharmaceuticals, illicit drugs, and related
human metabolites in wastewater by liquid chromatography-tandem mass
spectrometry. Anal. Bioanal. Chem. 406, 4273–4285.
Breinholt, A., Sharma, A.K., 2010. Case Area Baseline Report Copenhagen Energy &
Lynettefællesskabet.
62
Breinholt, A., Thordarson, F.Ö., Møller, J.K., Grum, M., Mikkelsen, P.S., Madsen, H.,
2011. Grey-box modelling of flow in sewer systems with state-dependent diffusion.
Environmetrics 22, 946–961.
Butler, D., Davies, J.W., 2004. Urban Drainage, Third. ed. CRC Press.
Butler, D., Graham, N.J.D., 1995. Modelling Dry Weather Wastewater Flow In Sewer
Networks. J. Environ. Eng. 121, 161–173.
Castiglioni, S., Bijlsma, L., Covaci, A., Emke, E., Harman, C., Hernández, F., Kasprzyk-
Hordern, B., Ort, C., van Nuijs, A.L.N., de Voogt, P., Zuccato, E., 2016. Estimating
community drug use through wastewater-based epidemiology, Assessing illicit drugs
in wastewater: advances in wastewater-based drug epidemiology, EMCDDA Insights
22.
Castiglioni, S., Bijlsma, L., Covaci, A., Emke, E., Hernández, F., Reid, M., Ort, C.,
Thomas, K. V., Van Nuijs, A.L.N., De Voogt, P., Zuccato, E., 2013. Evaluation of
uncertainties associated with the determination of community drug use through the
measurement of sewage drug biomarkers. Environ. Sci. Technol. 47, 1452–1460.
Castiglioni, S., Thomas, K. V., Kasprzyk-Hordern, B., Vandam, L., Griffiths, P., 2014.
Testing wastewater to detect illicit drugs: State of the art, potential and research
needs. Sci. Total Environ. 487, 613–620.
Castiglioni, S., Zuccato, E., Crisci, E., Chiabrando, C., Fanelli, R., Bagnati, R., 2006.
Identification and measurement of illicit drugs and their metabolites in urban
wastewater by liquid chromatography-tandem mass spectrometry. Anal. Chem. 78,
8421–8429.
Chen, C., Kostakis, C., Gerber, J.P., Tscharke, B.J., Irvine, R.J., White, J.M., 2014.
Towards finding a population biomarker for wastewater epidemiology studies. Sci.
Total Environ. 487, 621–628.
Clesceri, L.S., Greenberg, A.E., Eaton, A.D., 1998. Standard Methods for the Examination
of Water and Wastewater. Am. Public Heal. Assoc. 20, 1998.
Criddle, C.S., 1993. The kinetics of cometabolism. Biotechnol. Bioeng. 41, 1048–1056.
Daughton CG, 2001. Illicit drugs in municipal sewage: proposed new non-intrusive tool to
heighten public awareness of societal use of illicit/abused drugs and their potential for
ecological consequences, in: American Chemical Society, Symposium Series.
American Chemical Society, Symposium Series, Washington, DC, p. 348–364.
Decostere, B., De Craene, J., Van Hoey, S., Vervaeren, H., Nopens, I., Van Hulle, S.W.H.,
2016. Validation of a microalgal growth model accounting with inorganic carbon and
nutrient kinetics for wastewater treatment. Chem. Eng. J. 285, 189–197.
Delgadillo-Mirquez, L., Lardon, L., Steyer, J.P., Patureau, D., 2011. A new dynamic model
for bioavailability and cometabolism of micropollutants during anaerobic digestion.
Water Res. 45, 4511–4521.
EAWAG-BBD [WWW Document], 2016. . Pathw. Predict. Syst. URL http://eawag-
bbd.ethz.ch/predict/index.html (accessed 3.15.16).
EMCDDA, 2015a. European Drug Report.
EMCDDA, 2015b. Wastewater analysis and drugs: a European multi-city study, European
Monitoring Centre for Drugs and Drug report.
63
Erickson, A.J., Weiss, P.T., Gulliver, J.S., 2013. Optimizing Stormwater Treatment
Practices, Springer. ed.
Fedorova, G., Golovko, O., Randak, T., Grabic, R., 2014. Storage effect on the analysis of
pharmaceuticals and personal care products in wastewater. Chemosphere 111, 55–60.
Fitzgerald, R.L., O’Neal, C.L., Hart, B.J., Poklis, a, Herold, D. a, 1997. Comparison of an
ion-trap and a quadrupole mass spectrometer using diazepam as a model compound. J.
Anal. Toxicol. 21, 445–50.
Frutiger, J., Marcarie, C., Abildskov, J., Sin, G., 2016. A Comprehensive Methodology for
Development, Parameter Estimation, and Uncertainty Analysis of Group Contribution
Based Property Models-An Application to the Heat of Combustion. J. Chem. Eng.
Data 61, 602–613.
Garsdal, H., Mark, O., Dorge, J., Jepsen, S.E., 1995. MOUSETRAP: Modelling of water
quality processes and the interaction of sediments and pollutants in sewers. Water Sci.
Technol. 31, 33–41.
Gerrity, D., Trenholm, R.A., Snyder, S.A., 2011. Temporal variability of pharmaceuticals
and illicit drugs in wastewater and the effects of a major sporting event. Water Res.
45, 5399–5411.
Gheorghe, A., van Nuijs, A., Pecceu, B., Bervoets, L., Jorens, P.G., Blust, R., Neels, H.,
Covaci, A., 2008. Analysis of cocaine and its principal metabolites in waste and
surface water using solid-phase extraction and liquid chromatography-ion trap tandem
mass spectrometry. Anal. Bioanal. Chem. 391, 1309–1319.
Gomes, R.L., Scrimshaw, M.D., Lester, J.N., 2009. Fate of conjugated natural and
synthetic steroid estrogens in crude sewage and activated sludge batch studies.
Environ. Sci. Technol. 43, 3612–3618.
Gracia-lor, E., Zuccato, E., Castiglioni, S., 2016. Refining correction factors for back-
calculation of illicit drug use. Sci. Total Environ.
Gujer, W., 2008. System analysis for water technology. Springer.
Hall, W., Prichard, J., Kirkbride, P., Bruno, R., Thai, P.K., Gartner, C., Lai, F.Y., Ort, C.,
Mueller, J.F., 2012. An analysis of ethical issues in using wastewater. Addiction 107,
1767–1773.
Henze, M., Comeau, Y., 2008. Wastewater Characterization. Biol. Wastewater Treat.
Princ. Model. Des. 33–52.
Henze, M., Gujer, W., Mino, T., van Loosdrecht, M.C.., 2000. Activated Sludge Models
ASM1, ASM2, ASM2d AND ASM3, cientific and Technical Report No 9, IWA
Publishing. London.
Huisman, I.L., Krebs, P., Gujer, W., 2003. Integral and unified model for the sewer and
wastewater treatment plant focusing on transformations. Water Sci. Technol. 47, 65–
71.
Huisman, J.L., Gujer, W., 2002. Modelling wastewater transformation in sewers based on
ASM3. Water Sci. Technol. 45, 51–60.
Hvitved-Jacobsen, T., Vollertsen, J., Matos, J.S., 2002. The sewer as a bioreactor - A dry
weather approach. Water Sci. Technol. 45, 11–24.
64
Hvitved-Jacobsen, T., Vollertsen, J., Nielsen, A.H., 2013. Sewer Processes: Microbial and
Chemical Process Engineering of Sewer Networks, second. ed. CRC Press.
Hvitved-Jacobsen, T., Vollertsen, J., Tanaka, N., 1998. Wastewater quality changes during
transport in sewers - an integrated aerobic and anaerobic model concept for carbon
and sulfur microbial transformations. Wat. Sci. Tech. 38, 257–264.
Hyland, K.C., Dickenson, E.R. V, Drewes, E., Higgins, C.P., 2012. Sorption of ionized and
neutral emerging trace organic compounds onto activated sludge from different
wastewater treatment configurations 6, 1958–1968.
Ingram, T., Richter, U., Mehling, T., Smirnova, I., 2011. Fluid Phase Equilibria Modelling
of pH dependent n-octanol / water partition coefficients of ionizable pharmaceuticals.
Fluid Phase Equilib. 305, 197–203.
Jacobsen, B.N., Becher, G., Jensen, B.K., Monarca, S., Heidrun Scholz-Muramatsu, J.S.,
1996. Fate prediction of specific organic compouns in bioreactors. Environ. Sci.
Technol. 33, 289–296.
Jelic, A., Rodriguez-Mozaz, S., Barceló, D., Gutierrez, O., 2014. Impact of in-sewer
transformation on 43 pharmaceuticals in a pressurized sewer under anaerobic
conditions. Water Res. 68, 98–108.
Jiang, F., Leung, D.H.-W.W., Li, S., Chen, G.-H.H., Okabe, S., van Loosdrecht, M.C.M.,
2009. A biofilm model for prediction of pollutant transformation in sewers. Water
Res. 43, 3187–98.
Joss, A., Zabczynski, S., Göbel, A., Hoffmann, B., Löffler, D., McArdell, C.S., Ternes, T.
a., Thomsen, A., Siegrist, H., 2006. Biological degradation of pharmaceuticals in
municipal wastewater treatment: Proposing a classification scheme. Water Res. 40,
1686–1696.
Kappeler, J., Gujer, W., 1992. Estimation of kinetic parameters of heterotrophic biomass
under aerobic conditions and characterization of wastewater for activated sludge
modelling. Water Sci. Technol. 25, 125–139.
Kasprzyk-Hordern, B., Baker, D.R., 2012. Enantiomeric profiling of chiral drugs in
wastewater and receiving waters. Environ. Sci. Technol. 46, 1681–1691.
Keyser, W. De, Gevaert, V., Verdonck, F., Nopens, I., Baets, B. De, Vanrolleghem, P.A.,
Mikkelsen, P.S., Benedetti, L., 2010. Combining multimedia models with integrated
urban water system models for micropollutants. Water Sci. Technol. 62, 1614–1622.
Khan, U., Nicell, J.A., 2011. Refined sewer epidemiology mass balances and their
application to heroin, cocaine and ecstasy. Environ. Int. 37, 1236–1252.
Lai, F.Y., Anuj, S., Bruno, R., Carter, S., Gartner, C., Hall, W., Kirkbride, K.P., Mueller,
J.F., O’Brien, J.W., Prichard, J., Thai, P.K., Ort, C., 2015. Systematic and day -to-day
effects of chemical-derived population estimates on wastewater-based drug
epidemiology. Environ. Sci. Technol. 49, 999–1008.
Lai, F.Y., Bruno, R., Hall, W., Gartner, C., Ort, C., Kirkbride, P., Prichard, J., Thai, P.K.,
Carter, S., Mueller, J.F., 2012. Profiles of illicit drug use during annual key holiday
and control periods in Australia: Wastewater analysis in an urban, a semi-rural and a
vacation area. Addiction 108, 556–565.
Lai, F.Y.I.N., Thai, P.K., Brien, J.O., Gartner, C., Bruno, R., Kele, B., Ort, C., Prichard, J.,
Kirkbride, P., Hall, W., Carter, S., Mueller, J.F., 2013. Using quantitative wastewater
65
analysis to measure daily usage of conventional and emerging illicit drugs at an
annual music festival. Drug Alcohol Rev. 32, 594–602.
Li, M., 2012. Organic Chemistry of Drug Degradation. Royal Society of Chemistry.
Lindblom, E., Gernaey, K. V., Henze, M., Mikkelsen, P.S., 2006. Integrated modelling of
two xenobiotic organic compounds. Water Sci. Technol. 54, 213–221.
Liu, Y., Dong, Q., Shi, H., 2015. Distribution and population structure characteristics of
microorganisms in urban sewage system. Appl. Microbiol. Biotechnol. 99, 7723–
7734.
Mackay, A.A., Vasudevan, D., 2012. Polyfunctional Ionogenic Compound Sorption:
Challenges and New Approaches To Advance Predictive Models. Environ. Sci.
Technol. 46, 9209–9223.
Mathieu, C., Rieckermann, J., Berset, J.D., Schürch, S., Brenneisen, R., 2011. Assessment
of total uncertainty in cocaine and benzoylecgonine wastewater load measurements.
Water Res. 45, 6650–6660.
Mazioti, A.A., Stasinakis, A.S., Gatidou, G., Thomaidis, N.S., Andersen, H.R. , 2015.
Sorption and biodegradation of selected benzotriazoles and hydroxybenzothiazole in
activated sludge and estimation of their fate during wastewater treatment.
Chemosphere 131, 117–123.
McCall, A.-K., Scheidegger, A., Madry, M.M., Steuer, A.E., Weissbrodt, D.G.,
Vanrolleghem, P.A., Kraemer, T., Morgenroth, E., Ort, C., 2016. Influence of
Different Sewer Biofilms on Transformation Rates of Drugs. Environ. Sci. Technol.
Meirlaen, J., Assel, J. Van, Vanrolleghem, P.A., 2002. Real time control of the integrated
urban wastewater system using simultaneously simulating surrogate models. water
Sci. 45, 109–116.
Mourato, S., Matos, J., Almeida, M., Hvitved-Jacobsen, T., 2003. Modelling in-sewer
pollutant degradation processes in the Costa do Estoril sewer system. Water Sci.
Technol. 47, 93–100.
Muyzer, G., Stams, A.J.M., 2008. The ecology and biotechnology of sulphate-reducing
bacteria. Nat. Rev. Microbiol. 6, 441–454.
Nielsen, P.H., Raunkjrer, K., Norsker, N.H., Jensen, N.A., Hvitved-Jacobsen, T., 1992.
Transformation of wastewater in sewer systems - a review. Wat. Sci. Tech. 25, 17–31.
Nordin, C.F., Troutman, B.M., 1980. Longitudinal Dispersion in Rivers: The Persistence of
Skewness in Observed Data. Water Resour. Res. 16, 123–128.
Olsson, G., Jeppsson, U., 2006. Plant-wide control: dream, necessity or reality? Water Sci.
Technol. 53, 121–129.
Ort, C., 2016. Sewage Pattern Generator (SPG) [WWW Document]. URL
www.eawag.ch/spg (accessed 7.18.16).
Ort, C., 2014. Quality assurance/quality control in wastewater sampling, Future Science
Ltd.
Ort, C., Gujer, W., 2006. Sampling for representative micropollutant loads in sewer
systems. Water Sci. Technol. 54, 169–176.
Ort, C., Lawrence, M.G., Reungoat, J., Eaglesham, G., Carter, S., Keller, J., 2010a.
66
Determining the fraction of pharmaceutical residues in wastewater originating from a
hospital. Water Res. 44, 605–615.
Ort, C., Lawrence, M.G., Reungoat, J., Mueller, J.F., 2010b. Sampling for PPCPs in
Wastewater Systems: Comparison of Different Sampling Modes and Optimization
Strategies. Environ. Sci. Technol. 44, 6289–6296.
Ort, C., Lawrence, M.G., Rieckermann, J., Joss, A., 2010c. Sampling for Pharmaceuticals
and Personal Care Products (PPCPs) and Illicit Drugs in Wastewater Systems : Are
Your Conclusions Valid? A Critical Review. Environ. Sci. Technol. 44, 6024–6035.
Ort, C., Schaffner, C., Giger, W., Gujer, W., 2005. Modelling stochastic load variations in
sewer systems. Water Sci. Technol. 52, 113–122.
Ort, C., van Nuijs, A.L.N., Berset, J.D., Bijlsma, L., Castiglioni, S. , Covaci, A., de Voogt,
P., Emke, E., Fatta-Kassinos, D., Griffiths, P., Hernández, F., González-Mariño, I.,
Grabic, R., Kasprzyk-Hordern, B., Mastroianni, N., Meierjohann, A., Nefau, T.,
Östman, M., Pico, Y., Racamonde, I., Reid, M., Slobodnik, J., Terzic, S., Thomaidis,
N., Thomas, K. V., 2014. Spatial differences and temporal changes in illicit drug use
in Europe quantified by wastewater analysis. Addiction 109, 1338–1352.
Panasiuk, O., Hedström, A., Marsalek, J., Ashley, R.M., Viklander, M., 2015.
Contamination of stormwater by wastewater: A review of detection methods. J.
Environ. Manage. 152, 241–250.
Pinhancos, R., Maass, S., Ramanathan, D.M., 2011. High-resolution mass spectrometry
method for the detection, characterization and quantitation of pharmaceuticals in
water. J. Mass Spectrom. 46, 1175–1181.
Plósz, B.G., Langford, K.H., Thomas, K. V., 2012a. An activated sludge modeling
framework for xenobiotic trace chemicals (ASM-X): Assessment of diclofenac and
carbamazepine. Biotechnol. Bioeng. 109, 2757–2769.
Plósz, B.G., Langford, K.H., Thomas, K. V., 2012b. An activated sludge modeling
framework for xenobiotic trace chemicals (ASM-X): Assessment of diclofenac and
carbamazepine. Biotechnol. Bioeng. 109, 2757–2769.
Plósz, B.G., Leknes, H., Thomas, K. V., 2010. Impacts of competitive inhibition, parent
compound formation and partitioning behavior on the removal of antibiotics in
municipal wastewater treatment. Environ. Sci. Technol. 44, 734–742.
Plósz, B.G., Reid, M.J., Borup, M., Langford, K.H., Thomas, K. V., 2013.
Biotransformation kinetics and sorption of cocaine and its metabolites and the factors
influencing their estimation in wastewater. Water Res. 47, 2129–2140.
Polesel, F., 2016. Modelling the Fate of Xenobiotic Trace Chemicals via Wastewater
Treatment and Agricultural Resource Reuse, PhD thesis.
Polesel, F., Lehnberg, K., Dott, W., Trapp, S., Thomas, K. V, Gy, B., 2015. Factors
influencing sorption of ciprofloxacin onto activated sludge: Experimental assessment
and modelling implications. Chemosphere 119, 105–111.
Pomeroy, R.D., Parkhurst, J.D., 1972. Self-purification in sewers, in: Advances in Water
Pollution Research, 6th International Conference. pp. 291–308.
Postigo, C., Alda, M.L. de, Barceló, D., 2011. Evaluation of drugs of abuse use and trends
in a prison through wastewater analysis. Environ. Int. 37, 49–55.
67
Rauch, W., Bertrand-Krajewski, J.-L., Krebs, P., Mark, O., Schilling, W., Schütze, M.,
Vanrolleghem, P.A., 2002. Deterministic modelling of integrated urban drainage
systems. Environ. Sci. Technol. 45, 81–94.
Rieckermann, J., Anta, J., Scheidegger, A., Ort, C., 2011. Assessing wastewater
micropollutant loads with approximate bayesian computations. Environ. Sci. Technol.
45, 4399–4406.
Rittmann, B.E., 1995. Transformation of Organic Micropollutants by Biological Processes,
in: Handbook of Environmental Chemistry. pp. 31–60.
Rudelle, E., Vollertsen, J., Hvitved-Jacobsen, T., Nielsen, A.H., 2012. Modeling anaerobic
organic matter transformations in the wastewater phase of sewer networks. Water Sci.
Technol. 66, 1728–1734.
Saltelli, A., Ratto, M., Andres, T., Francesca Campolongo, J.C., Gatelli, D., Saisana, M.,
Tarantola, S., 2008. Global sensitivity analysis: the primer. John Wiley & Sons, West
Sussex.
Sathyamoorthy, S., Ramsburg, C.A., 2013. Assessment of quantitative structural property
relationships for prediction of pharmaceutical sorption during biological wastewater
treatment 92, 639–646.
Schröder, H.F., Gebhardt, W., Thevis, M., 2010. Anabolic, doping, and lifestyle drugs, and
selected metabolites in wastewater—detection, quantification, and behaviour
monitored by high-resolution MS and MSn before and after sewage treatment. Anal
Bioanal Chem 398, 1207–1229.
Schwarzenbach, R.P., Gschwend, P.M., Imboden, D.M., 2003. Environmental Organic
Chemistry. Wiley Interscience, Hoboken, NJ.
Senta, I., Krizman, I., Ahel, M., Terzic, S., 2014. Assessment of stability of drug
biomarkers in municipal wastewater as a factor influencing the estimation of drug
consumption using sewage epidemiology. Sci. Total Environ. 487, 659–665.
Siegrist, H., Alder, A., Gujer, W., Giger, W., 1989. Behaviour and modelling of NTA
degradation in activated sludge systems. Water Sci. Technol. 21, 315–324.
Sin, G., Gernaey, K. V., Neumann, M.B., van Loosdrecht, M.C.M., Gujer, W., 2009.
Uncertainty analysis in WWTP model applications: A critical discussion using an
example from design. Water Res. 43, 2894–2906.
Sin, G., Gernaey, K. V., Neumannc, M.B., van Loosdrecht, M.C.M., Gujerc, W., 2009.
Uncertainty analysis in WWTP model applications: A critical discussion using an
example from design. Water Res. 43, 2894–2906.
Singh, S.K., Beck, M.B., 2003. Dispersion Coefficient of Streams from Tracer Experiment
Data. J. Environ. Eng. 129, 539–546.
Snip, L.J.P., Flores-Alsina, X., Plósz, B.G., Jeppsson, U., Gernaey, K. V., 2014. Modelling
the occurrence, transport and fate of pharmaceuticals in wastewater systems. Environ.
Model. Softw. 62, 112–127.
statistikbanken [WWW Document], 2014. URL http://www.statistikbanken.dk/ (accessed
7.15.16).
Stoyer, R.L., 1970. The Pressure Pipe Wastewater Treatment System. Presents at 2nd
annual sanitary engineering research laboratory workshop on wastewater and reuse.

68
Tahoe City, CA.
Su, L., Aga, D., Chandran, K., Khunjar, W.O., 2015. Factors impacting biotransformation
kinetics of trace organic compounds in lab-scale activated sludge systems performing
nitrification and denitrification. J. Hazard. Mater. 282, 116–124.
Tan, D.T., Arnold, W.A., Novak, P.J., 2013. Impact of organic carbon on the
biodegradation of estrone in mixed culture systems. Environ. Sci. Technol. 47,
12359–65.
Tanaka, N., Hvitved-Jacobsen, T., 1998. Transformations of wastewater organic matter in
sewers under changing aerobic/anaerobic conditions. Wat. Sci. Tech. 37, 105–113.
Taylor, G., 1953. Dispersion of Soluble Matter in Solvent Flowing Slowly through a Tube.
Math. Phys. Sci. 219, 186–203.
Thai, P.K., Jiang, G., Gernjak, W., Yuan, Z., Lai, F.Y., Mueller, J.F., 2014. Effects of
sewer conditions on the degradation of selected illicit drug residues in wastewater.
Water Res. 48, 538–547.
Thomas, K. V., Bijlsma, L., Castiglioni, S., Covaci, A., Emke, E., Grabic, R., Hernández,
F., Karolak, S., Kasprzyk-Hordern, B., Lindberg, R.H., Lopez de Alda, M.,
Meierjohann, A., Ort, C., Pico, Y., Quintana, J.B., Reid, M., Rieckermann, J., Terzic,
S., van Nuijs, A.L.N., de Voogt, P., 2012. Comparing illicit drug use in 19 European
cities through sewage analysis. Sci. Total Environ. 432, 432–439.
Torresi, E., Fowler, J.S., Polesel, F., Bester, K., Andersen, H.R., Smets, B.F., Plósz, B.G.,
Christensson, M., 2016. Biofilm thickness influences biodiversity in nitrifying
MBBRs – Implications on micropollutant removal. Environ. Sci. Technol. 50, 9279–
9288.
Trapp, S., Franco, A., Mackay, D., 2010. Activity-Based Concept for Transport and
Partitioning of Ionizing Organics. Environ. Sci. Technol. 44, 6123–6129.
Trenholm, R.A., Vanderford, B.J., Snyder, S.A., 2009. On-line solid phase extraction LC-
MS/MS analysis of pharmaceutical indicators in water: A green alternative to
conventional methods. Talanta 79, 1425–1432.
U.S. EPA, 1982. Handbook for Sampling and Sample Preservation of Water and
Wastewater; 600/4-82-029; Environmental Monitoring and Support Laboratory.
van Nuijs, A.L.N., Abdellati, K., Bervoets, L., Blust, R., Jorens, P.G., Neels, H., Covaci,
A., 2012. The stability of illicit drugs and metabolites in wastewater, an important
issue for sewage epidemiology? J. Hazard. Mater. 239–240, 19–23.
van Nuijs, A.L.N., Castiglioni, S., Tarcomnicu, I., Postigo, C., de Alda, M.L., Neels, H.,
Zuccato, E., Barcelo, D., Covaci, A., 2011. Illicit drug consumption estimations
derived from wastewater analysis: A critical review. Sci. Total Environ. 409, 3564–
3577.
Vanrolleghem, P.A., Spanjers, H., Petersen, B., Ginestet, P., Takács, I., 1999. Estimating
(combinations of) activated sludge model no. 1 parameters and components by
respirometry. Wat. Sci. Tech 39, 195–214.
Vezzaro, L., Benedetti, L., Gevaert, V., De Keyser, W., Verdonck, F., De Baets, B.,
Nopens, I., Cloutier, F., Vanrolleghem, P. a., Mikkelsen, P.S., 2014. A model library
for dynamic transport and fate of micropollutants in integrated urban wastewater and
stormwater systems. Environ. Model. Softw. 53, 98–111.
69
Vollertsen, J., Hvitved-Jacobsen, T., 2002. Biodegradability of wastewater - A method for
COD-fractionation. Water Sci. Technol. 45, 25–34.
Vollertsen, J., Hvitved-Jacobsen, T., 1999. Stoichiometric and kinetic model parameters
for microbial transformation of suspended solid in combined sewer systems. Wat.
Res. 33, 3127–3141.
Vrugt, J.A., Gupta, H. V., Bouten, W., Sorooshian, S., 2003. A Shuffled Complex
Evolution Metropolis algorithm for optimization and uncertainty assessment of
hydrologic model parameters. Water Resour. Res. 39, 1201.
Wang, X., Grady, C.P.L., 1995. Effects of biosorption and dissolution on the
biodegradation of di-n-butyl phthalate 67, 863–871.
Warith, M.A., Kennedy, K., Reitsma, R., 1998. Use of sanitary sewers as wastewater pre -
treatment systems. Waste Manag. 18, 235–247.
Wicke, D., Böckelmann, U., Reemtsma, T., 2007. Experimental and modeling approach to
study sorption of dissolved hydrophobic organic contaminants to microbial biofilms.
Water Res. 41, 2202–2210.
Zhang, W., Bouwer, E.J., Ball, W.P., 1998. Bioavailability of Hydrophobic Organic
Contaminants: Effects and Implications of Sorption-Related Mass Transfer on
Bioremediation. Groundw. Monit. Remediat. 18, 126–138.
Zuccato, E., Chiabrando, C., Castiglioni, S., Bagnati, R., Fanelli, R., 2008. Estimating
Community Drug Abuse by Wastewater Analysis. Environ. Health Perspect. 116,
1027–1032.
Zuccato, E., Chiabrando, C., Castiglioni, S., Calamari, D., Bagnati, R., Schiarea, S.,
Fanelli, R., 2005. Cocaine in surface waters: a new evidence-based tool to monitor
community drug abuse. Environ. Heal. A Glob. Access Sci. Source 4, 1–7.

70
10 Papers
I Ramin, P., Brock, A.L., Polesel, F., Causanilles, A., Emke, E., de
Voogt, P., Plósz, B.G. (2016). Transformation and sorption of illicit
drug biomarkers in sewer systems : understanding the role of
suspended solids in raw wastewater. Environmental Science and
Technology. doi:10.1021 /acs.est.6b03049
II Ramin, P., Valverde-Pérez, B., Polesel, F., Locatelli, L., Plósz, B.G.
(2016). A systematic model calibration method for chemical and
biochemical transformation pathway models – The case of
transformation of heroin biomarkers in wastewater. Submitted
manuscript
III Ramin, P., Brock, A.L., Causanilles, A., Valverde-Pérez, B., Emke,
E., de Voogt, P., Polesel, F., Plósz, B.G. (2016). Transformation and
sorption of illicit drug biomarkers in sewer biofilms. Submitted
manuscript
IV Ramin, P., Vezzaro, L., Mikkelsen, P.S., Plósz, B.G. (2016). Back-
calculating illicit drug abuse rates in urban areas – Quantifying
uncertainties associated with in-sewer transformation and samplin.
Submitted manuscript.