modeling timber supply from planted forests in south america and european forestry… ·...
TRANSCRIPT

Modeling Timber Supplyfrom Planted Forests in South America
andEuropean Forestry: A Snapshot
SOFAC Speech, 7 August 2013
Drawn from a Speech Presented at:
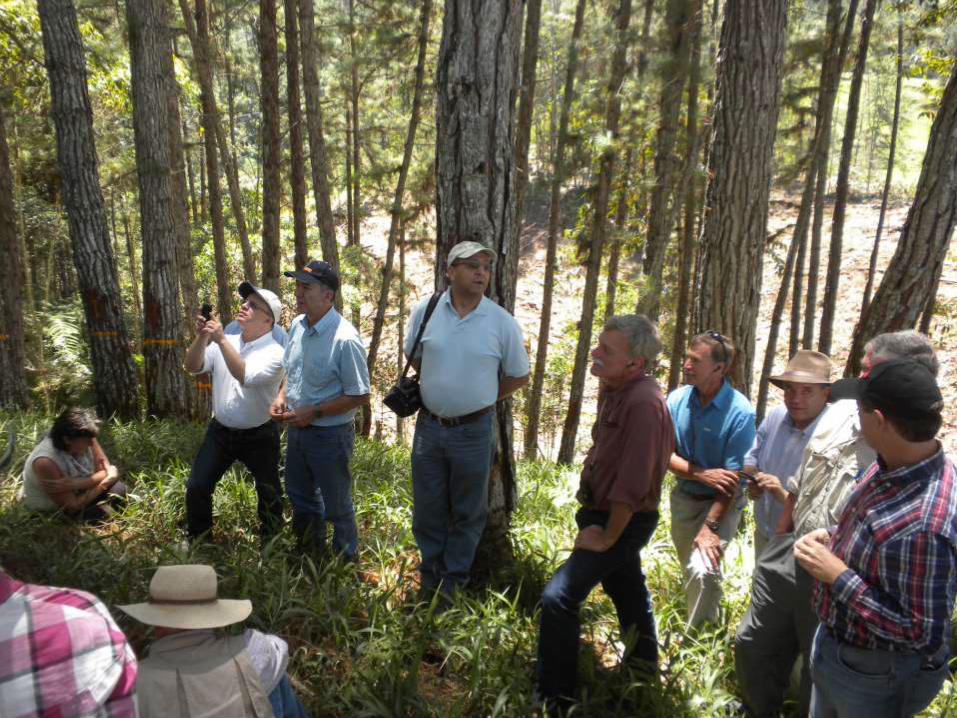
3rd International Congress on Planted Forests
Porto, Portugal
17 May 2013
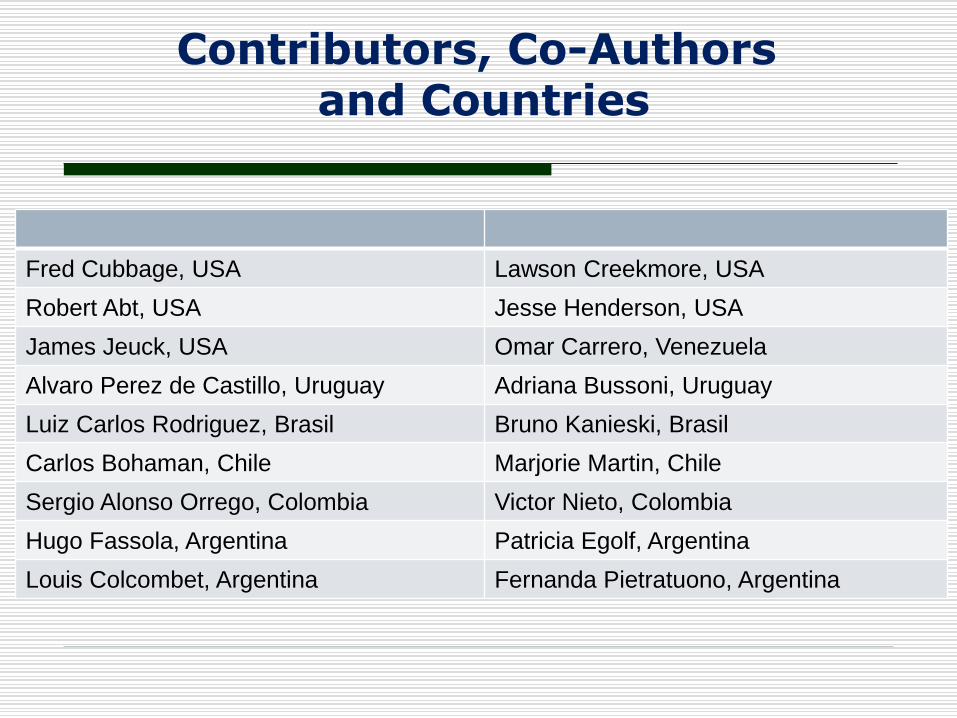
Contributors, Co-Authorsand Countries
Fred Cubbage, USA Lawson Creekmore, USA
Robert Abt, USA Jesse Henderson, USA
James Jeuck, USA Omar Carrero, Venezuela
Alvaro Perez de Castillo, Uruguay Adriana Bussoni, Uruguay
Luiz Carlos Rodriguez, Brasil Bruno Kanieski, Brasil
Carlos Bohaman, Chile Marjorie Martin, Chile
Sergio Alonso Orrego, Colombia Victor Nieto, Colombia
Hugo Fassola, Argentina Patricia Egolf, Argentina
Louis Colcombet, Argentina Fernanda Pietratuono, Argentina

Economics
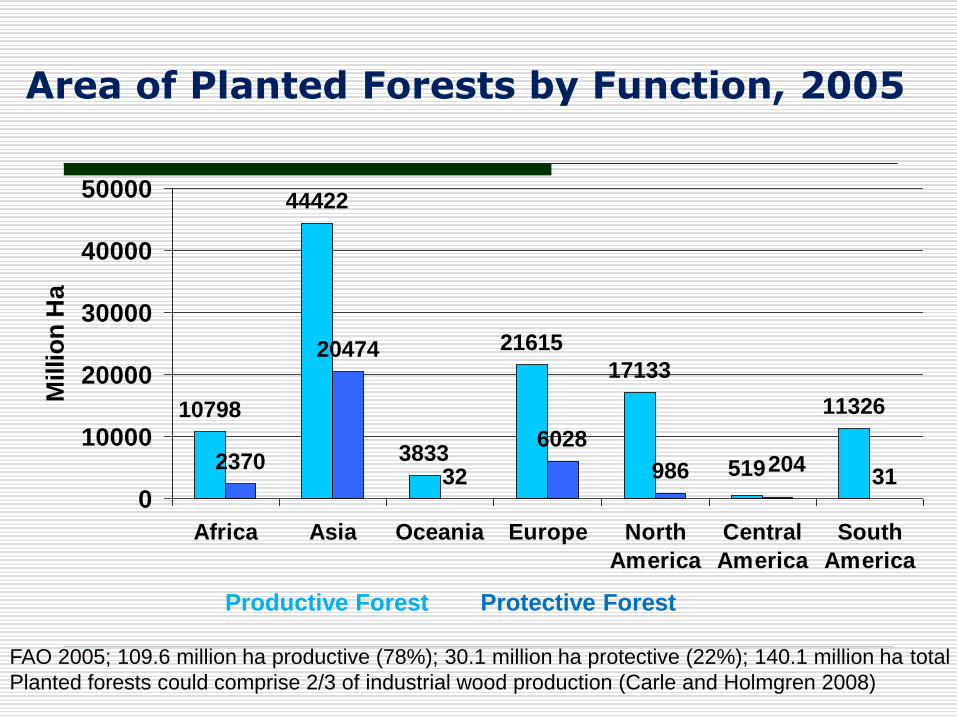
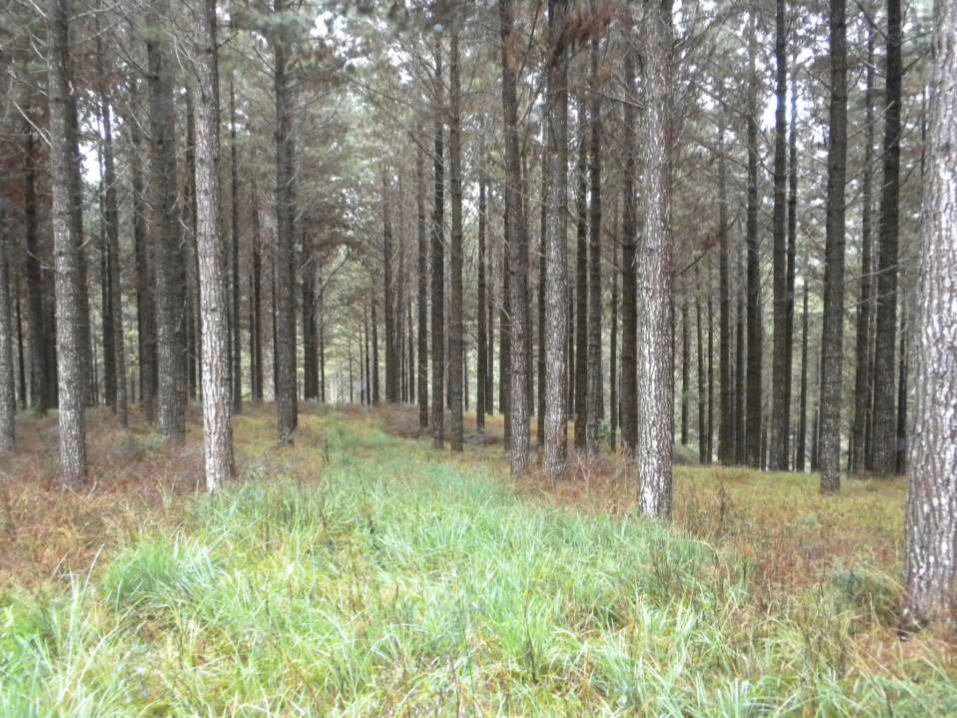
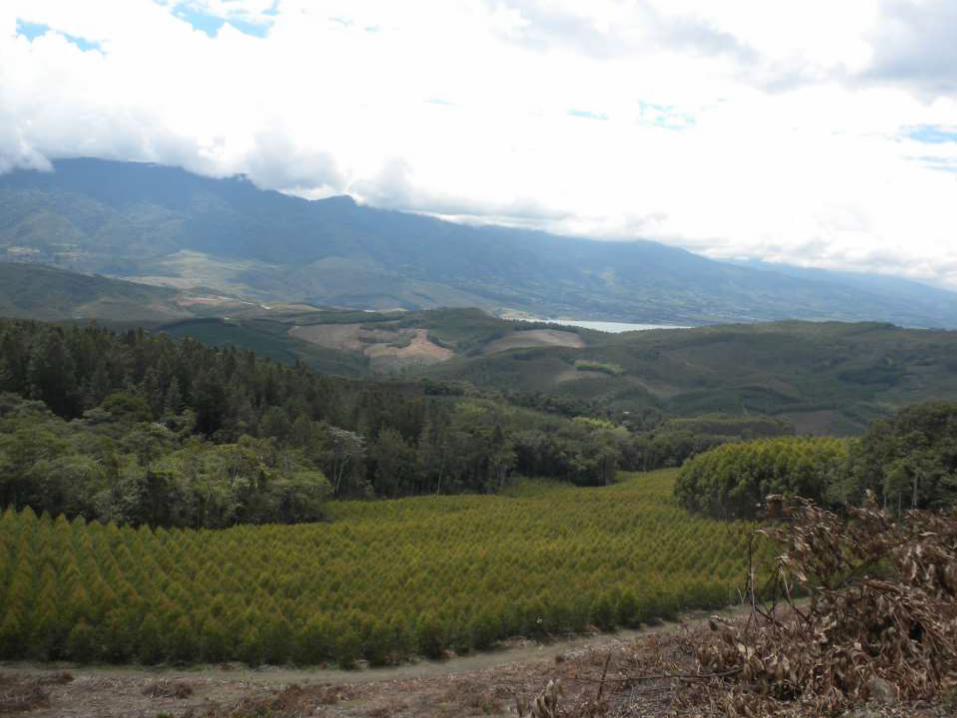
Area of Planted Forests by Function, 2005
10798
44422
3833
21615
17133
11326
2370
20474
32
6028
986 31519204
0
10000
20000
30000
40000
50000
Africa Asia Oceania Europe North
America
Central
America
South
America
Millio
n H
a
Productive Forest Protective Forest
FAO 2005; 109.6 million ha productive (78%); 30.1 million ha protective (22%); 140.1 million ha total
Planted forests could comprise 2/3 of industrial wood production (Carle and Holmgren 2008)
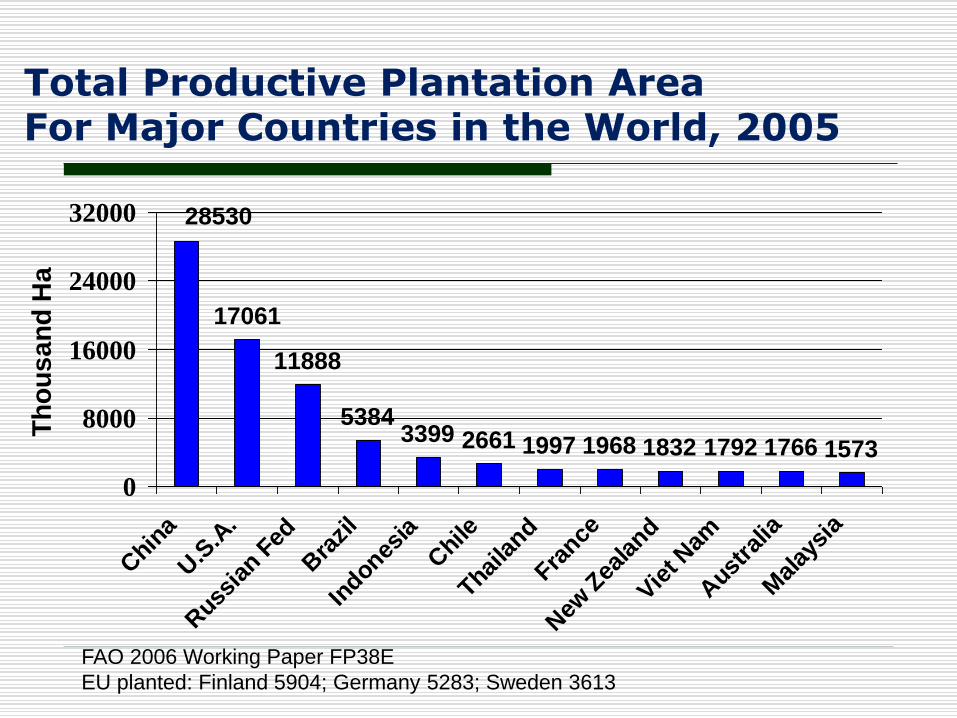
Total Productive Plantation Area For Major Countries in the World, 2005
17061
11888
53843399 2661 1997 1968 1832 1792 1766 1573
28530
0
8000
16000
24000
32000
Chin
a
U.S
.A.
Russ
ian F
ed
Bra
zil
Indones
ia
Chile
Thaila
nd
France
New
Zea
land
Vie
t Nam
Aust
ralia
Mal
aysi
a
Th
ou
sa
nd
Ha
FAO 2006 Working Paper FP38E
EU planted: Finland 5904; Germany 5283; Sweden 3613
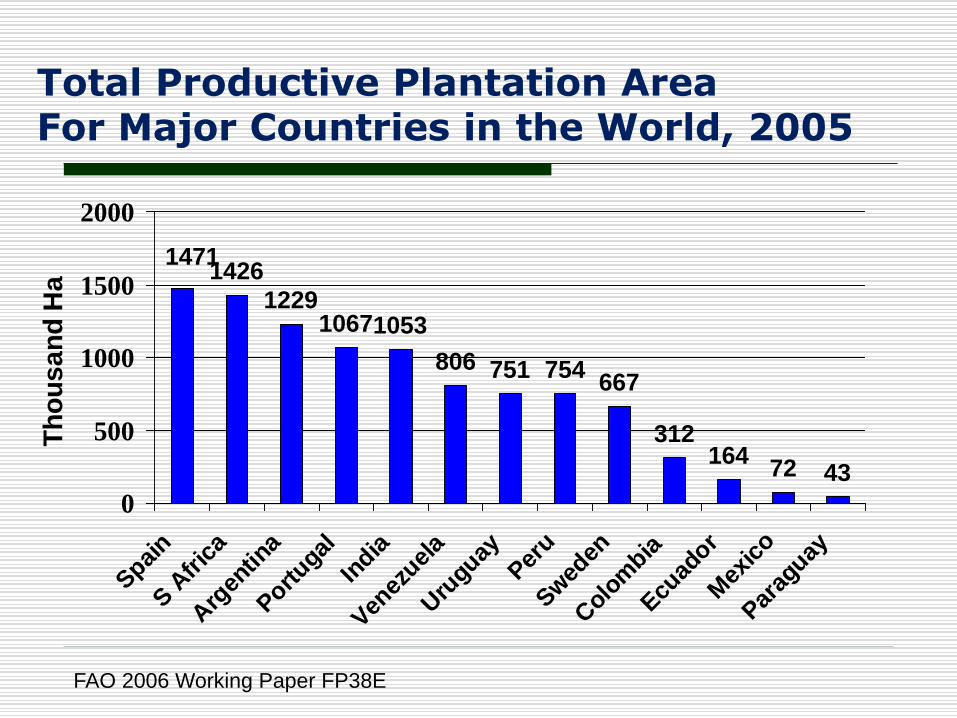
Total Productive Plantation Area For Major Countries in the World, 2005
1426
122910671053
806 751 754667
312164
72 43
1471
0
500
1000
1500
2000
Spai
n
S A
fric
a
Arg
entin
a
Port
ugal
India
Ven
ezuel
a
Uru
guayPer
u
Swed
en
Colo
mbia
Ecu
ador
Mex
ico
Par
aguay
Th
ou
sa
nd
Ha
FAO 2006 Working Paper FP38E
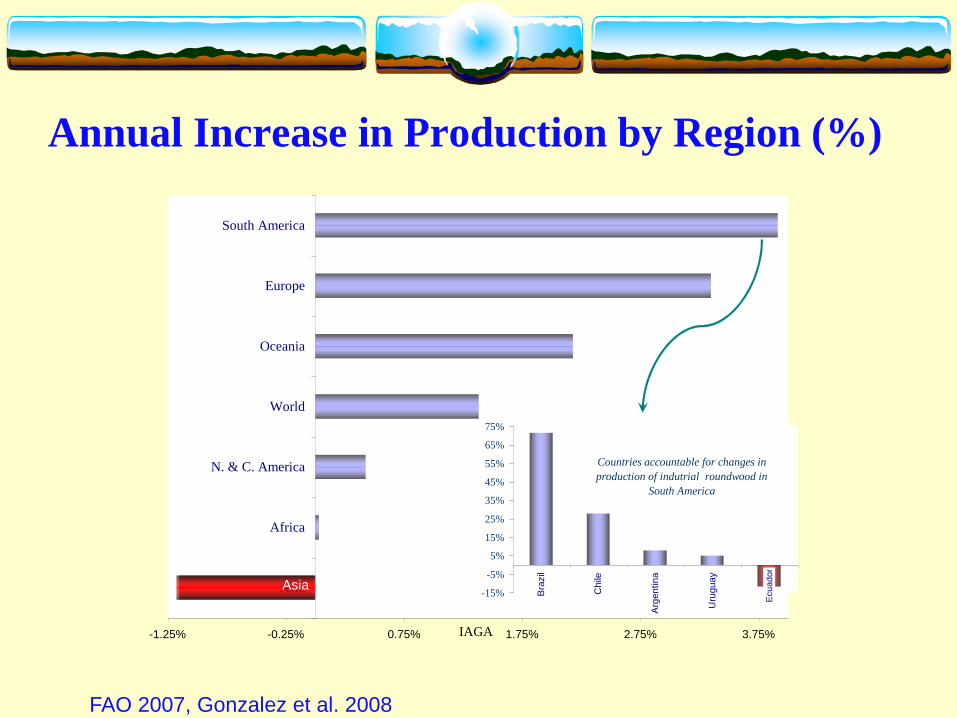
Annual Increase in Production by Region (%)
Source: Gonzalez et al. 2008, NCSU, from FAO 2007
-1.25% -0.25% 0.75% 1.75% 2.75% 3.75%
Asia
Africa
N. & C. America
World
Oceania
Europe
South America
IAGA
Asia -15%
-5%
5%
15%
25%
35%
45%
55%
65%
75%
Bra
zil
Ch
ile
Arg
en
tin
a
Uru
gu
ay
Ecu
ad
or
Countries accountable for changes in
production of indutrial roundwood in
South America
Ecu
ad
or
FAO 2007, Gonzalez et al. 2008
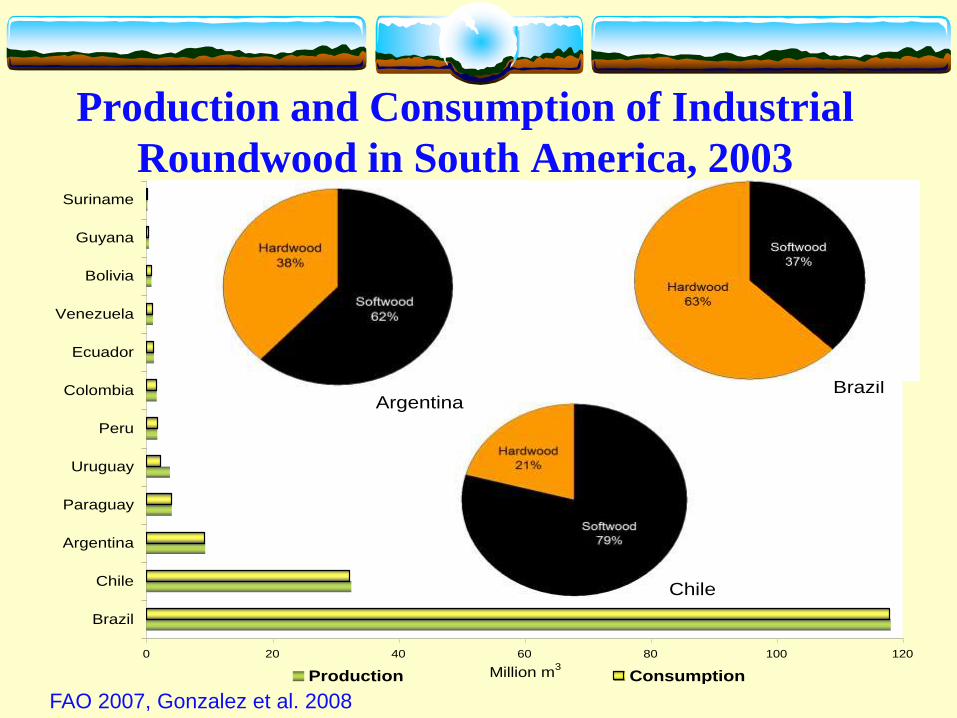
Production and Consumption of Industrial
Roundwood in South America, 2003
Source: Gonzalez et al. 2008, NCSU, from FAO 2007
0 20 40 60 80 100 120
Brazil
Chile
Argentina
Paraguay
Uruguay
Peru
Colombia
Ecuador
Venezuela
Bolivia
Guyana
Suriname
Million m3
Production Consumption
ArgentinaBrazil
Chile
FAO 2007, Gonzalez et al. 2008
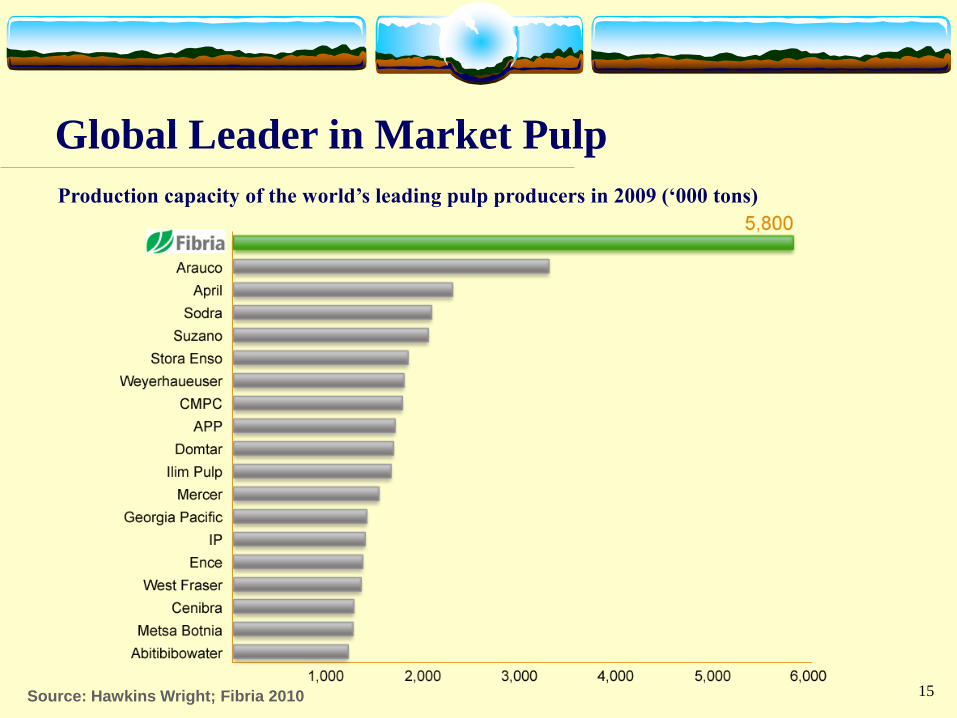
Global Leader in Market Pulp
Source: Hawkins Wright; Fibria 2010 15
Production capacity of the world’s leading pulp producers in 2009 (‘000 tons)
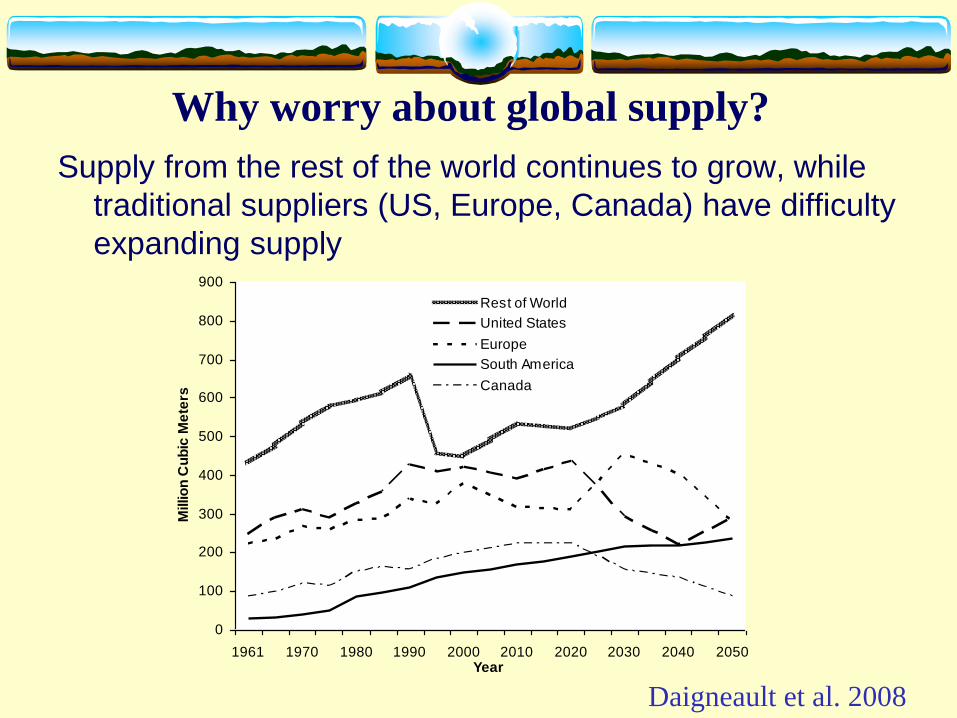
Why worry about global supply?
Supply from the rest of the world continues to grow, while
traditional suppliers (US, Europe, Canada) have difficulty
expanding supply
0
100
200
300
400
500
600
700
800
900
1961 1970 1980 1990 2000 2010 2020 2030 2040 2050Year
Millio
n C
ub
ic M
ete
rs
Rest of World
United States
Europe
South America
Canada
Daigneault et al. 2008
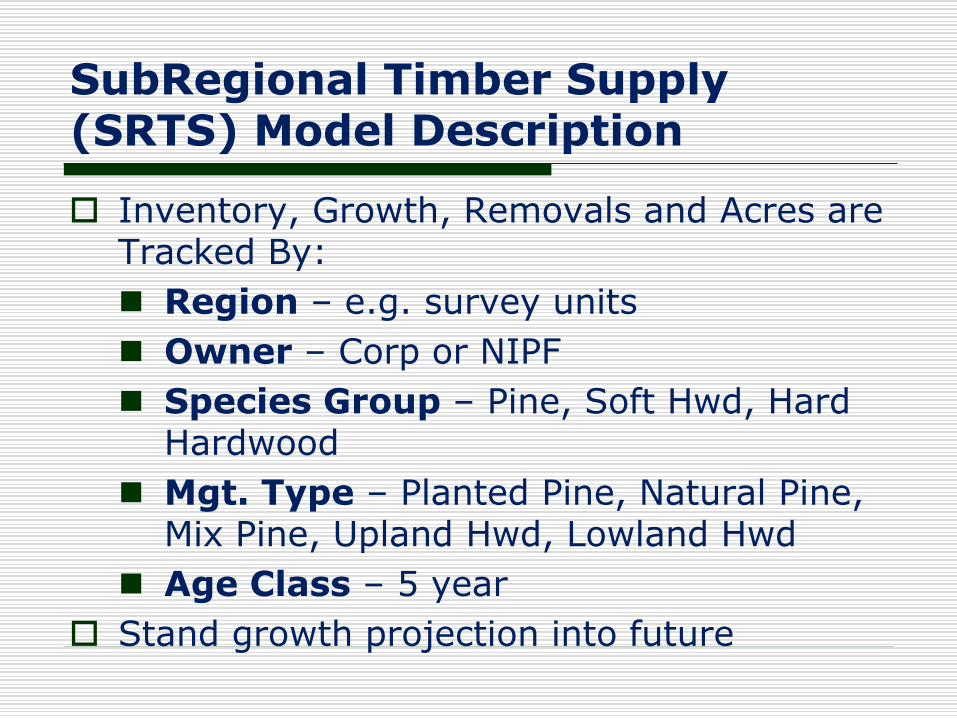
SubRegional Timber Supply (SRTS) Model Description
Inventory, Growth, Removals and Acres are Tracked By:
Region – e.g. survey units
Owner – Corp or NIPF
Species Group – Pine, Soft Hwd, Hard Hardwood
Mgt. Type – Planted Pine, Natural Pine, Mix Pine, Upland Hwd, Lowland Hwd
Age Class – 5 year
Stand growth projection into future
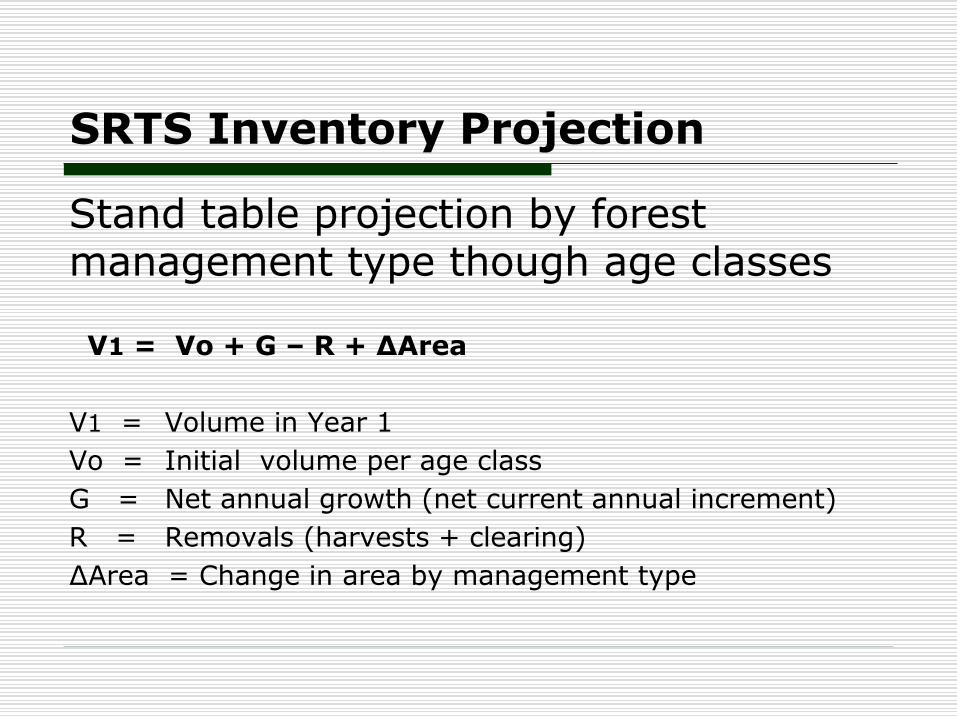
SRTS Inventory Projection
Stand table projection by forest management type though age classes
V1 = Vo + G – R + ∆Area
V1 = Volume in Year 1
Vo = Initial volume per age class
G = Net annual growth (net current annual increment)
R = Removals (harvests + clearing)
∆Area = Change in area by management type
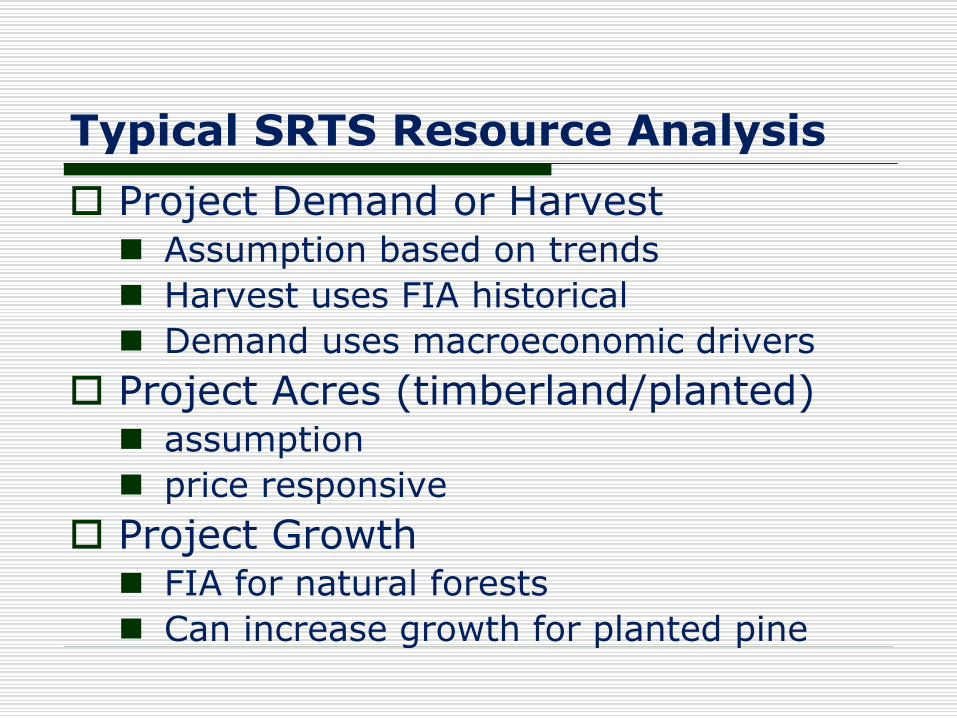
Typical SRTS Resource Analysis
Project Demand or Harvest Assumption based on trends
Harvest uses FIA historical
Demand uses macroeconomic drivers
Project Acres (timberland/planted) assumption
price responsive
Project Growth FIA for natural forests
Can increase growth for planted pine
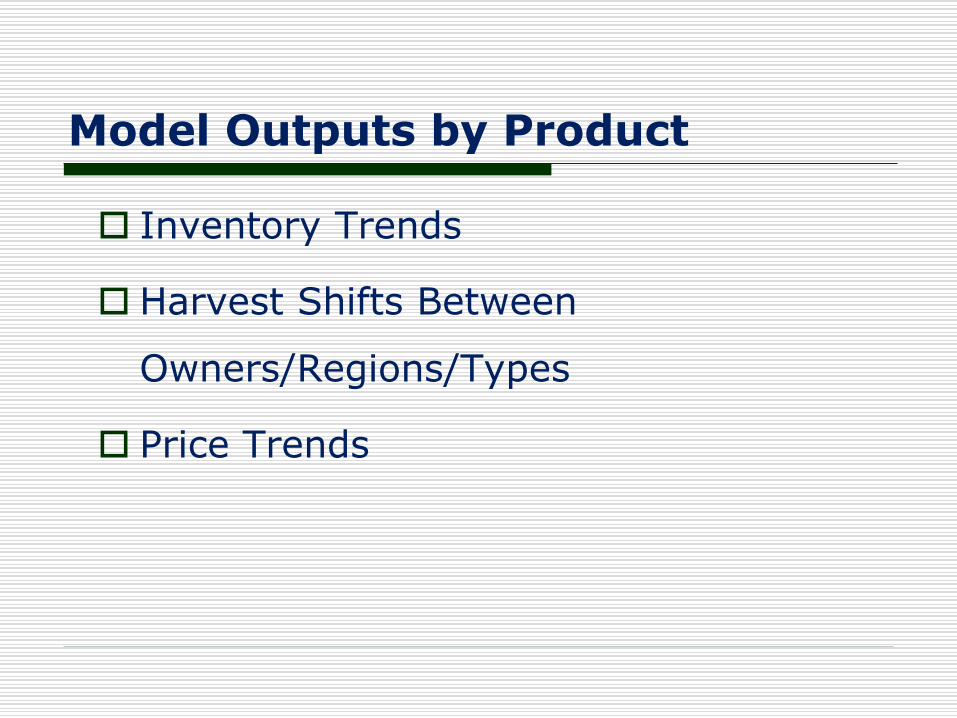
Model Outputs by Product
Inventory Trends
Harvest Shifts Between
Owners/Regions/Types
Price Trends
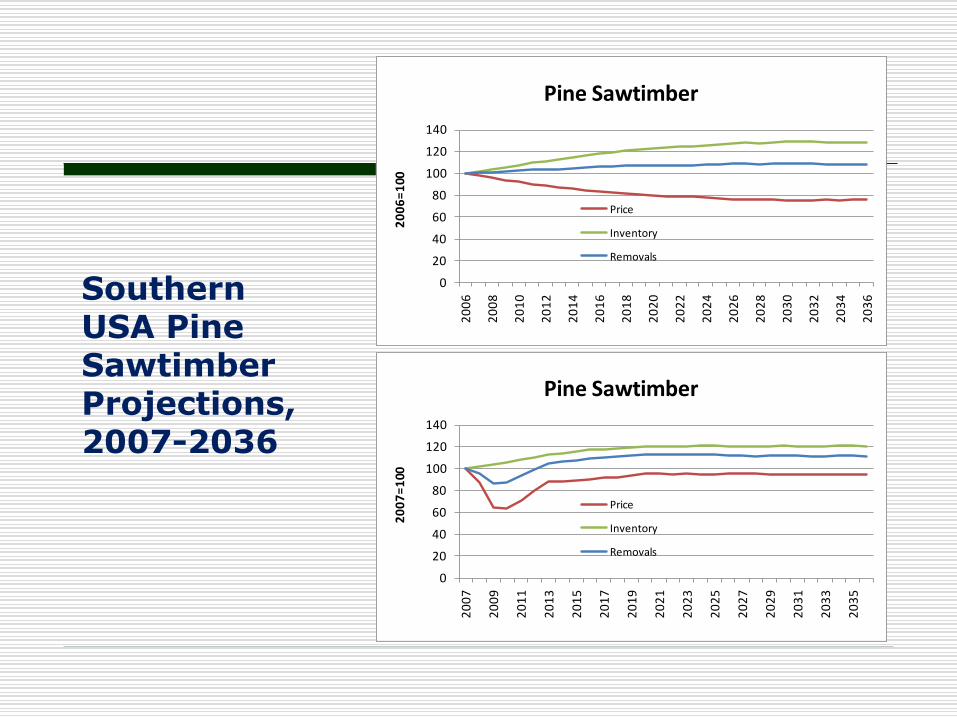
Southern USA Pine SawtimberProjections, 2007-2036
0
20
40
60
80
100
120
140
20
06
20
08
20
10
20
12
20
14
20
16
20
18
20
20
20
22
20
24
20
26
20
28
20
30
20
32
20
34
20
36
20
06
=1
00
Pine Sawtimber
Price
Inventory
Removals
0
20
40
60
80
100
120
140
20
07
20
09
20
11
20
13
20
15
20
17
20
19
20
21
20
23
20
25
20
27
20
29
20
31
20
33
20
35
20
07
=1
00Pine Sawtimber
Price
Inventory
Removals
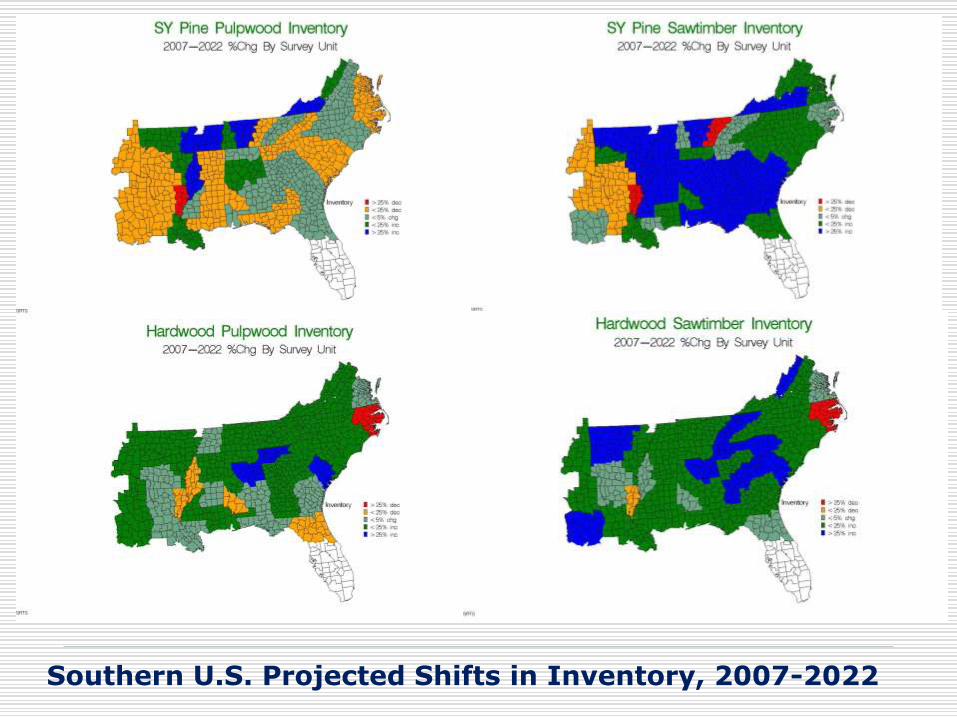
Southern U.S. Projected Shifts in Inventory, 2007-2022
Pine
Product
Inventory
Shifts
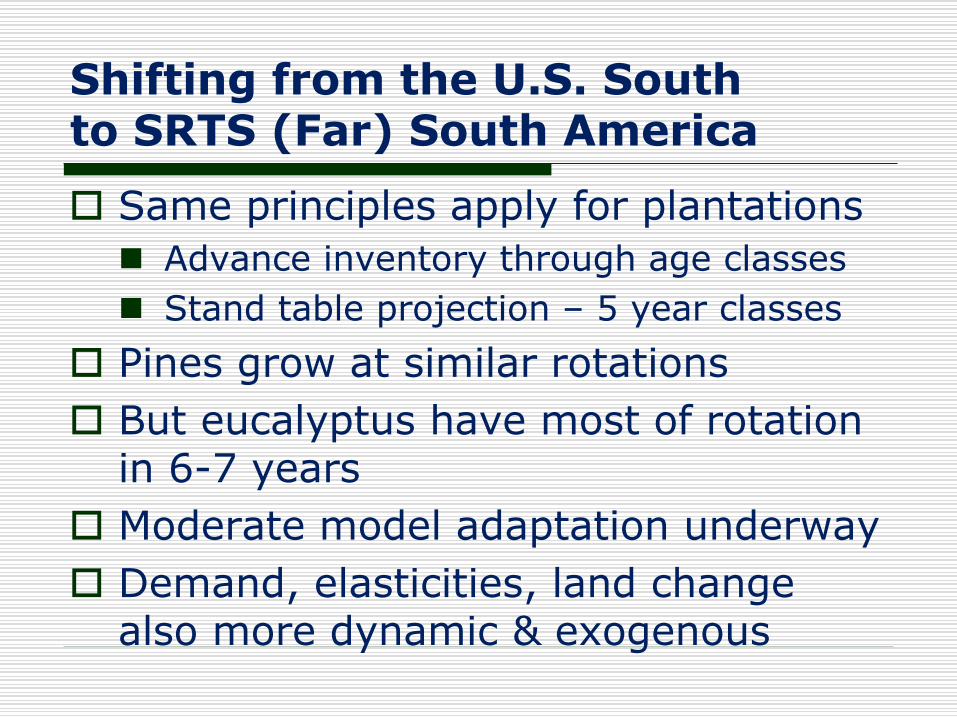
Shifting from the U.S. Southto SRTS (Far) South America
Same principles apply for plantations
Advance inventory through age classes
Stand table projection – 5 year classes
Pines grow at similar rotations
But eucalyptus have most of rotation in 6-7 years
Moderate model adaptation underway
Demand, elasticities, land change also more dynamic & exogenous
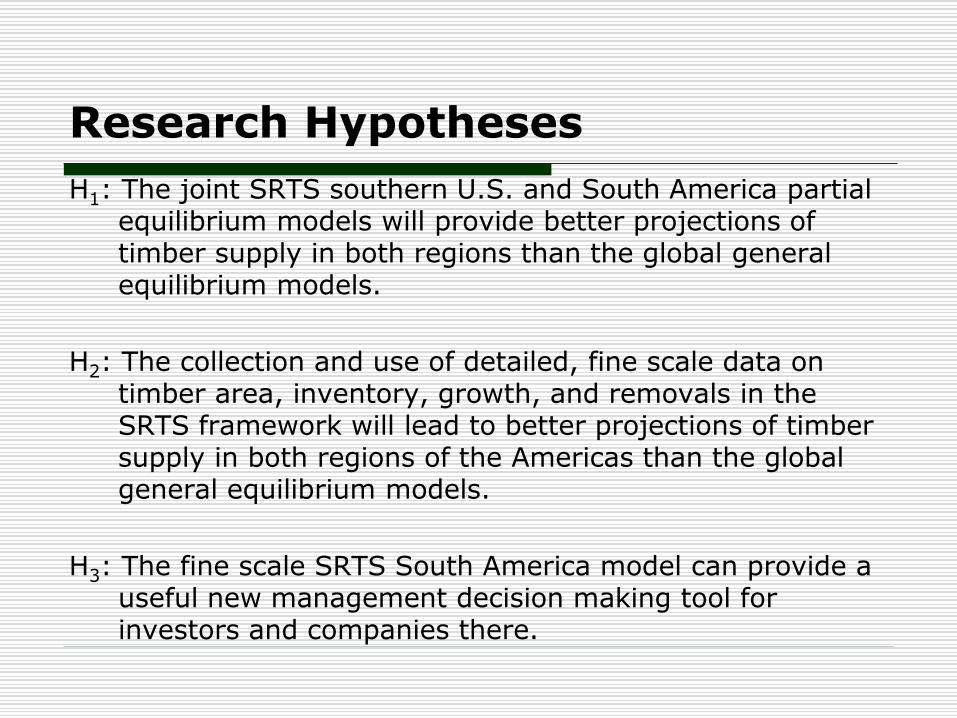
Research Hypotheses
H1: The joint SRTS southern U.S. and South America partial equilibrium models will provide better projections of timber supply in both regions than the global general equilibrium models.
H2: The collection and use of detailed, fine scale data on timber area, inventory, growth, and removals in the SRTS framework will lead to better projections of timber supply in both regions of the Americas than the global general equilibrium models.
H3: The fine scale SRTS South America model can provide a useful new management decision making tool for investors and companies there.
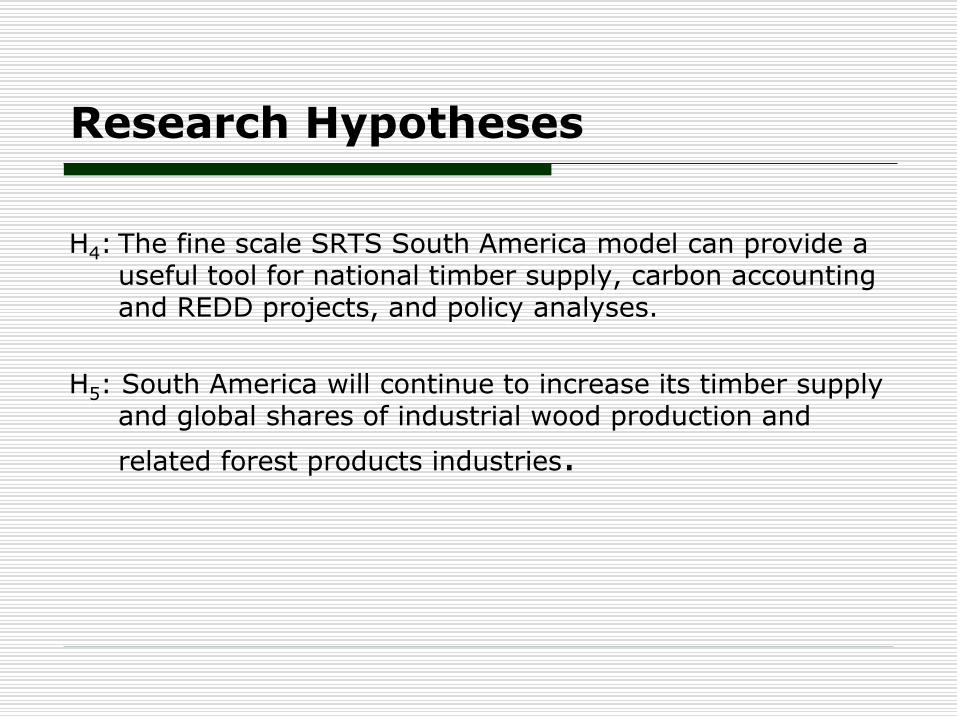
Research Hypotheses
H4: The fine scale SRTS South America model can provide a useful tool for national timber supply, carbon accounting and REDD projects, and policy analyses.
H5: South America will continue to increase its timber supply and global shares of industrial wood production and
related forest products industries.
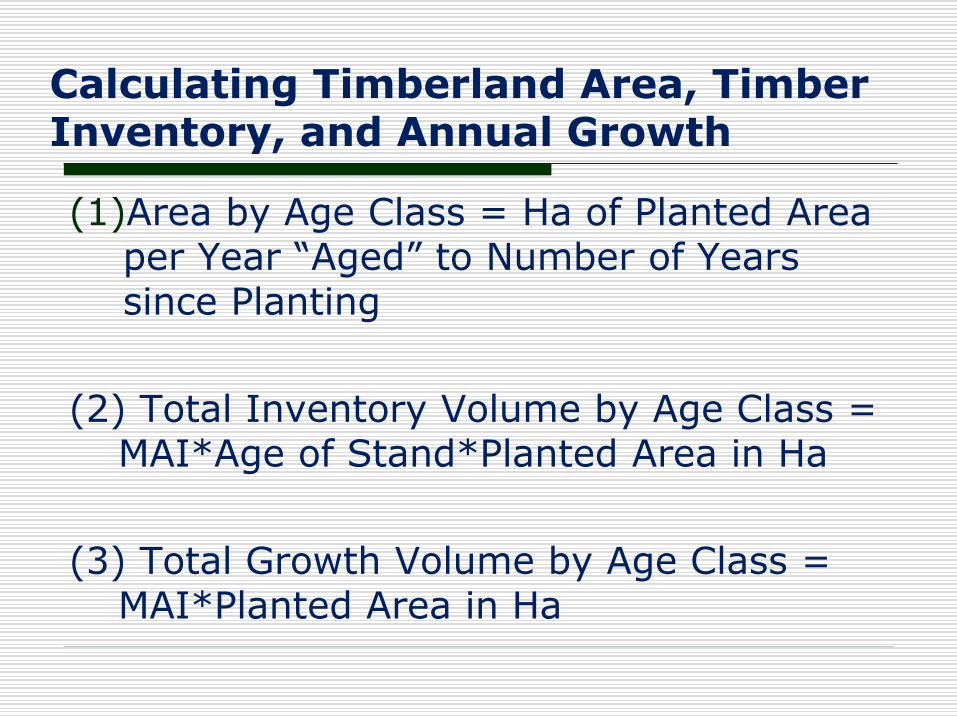
Calculating Timberland Area, Timber Inventory, and Annual Growth
(1)Area by Age Class = Ha of Planted Area per Year “Aged” to Number of Years since Planting
(2) Total Inventory Volume by Age Class = MAI*Age of Stand*Planted Area in Ha
(3) Total Growth Volume by Age Class = MAI*Planted Area in Ha
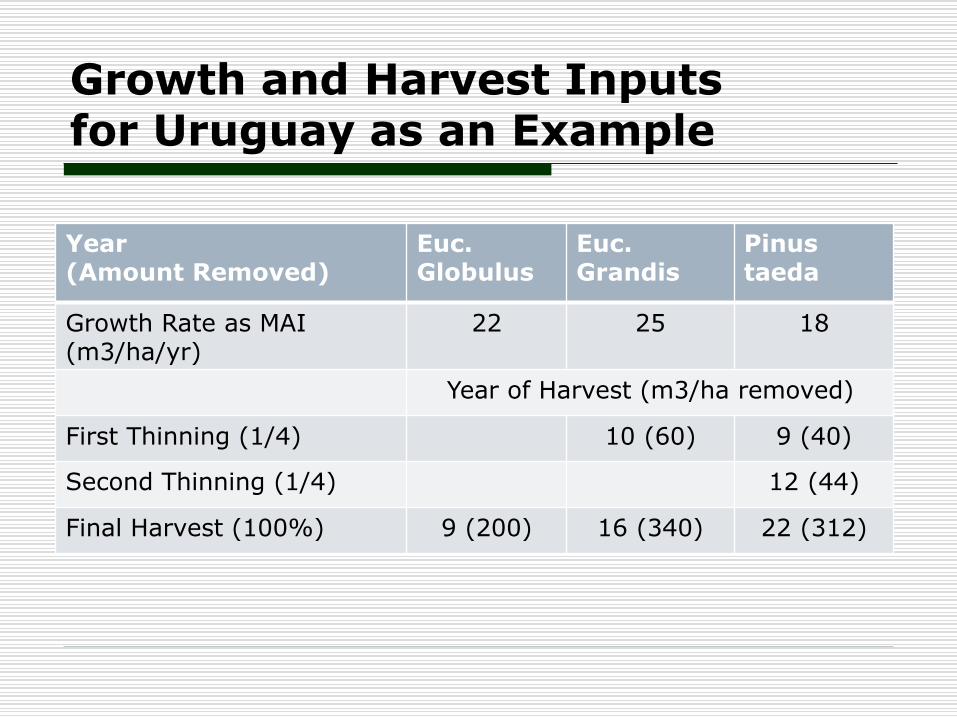
Growth and Harvest Inputsfor Uruguay as an Example
Year (Amount Removed)
Euc. Globulus
Euc. Grandis
Pinustaeda
Growth Rate as MAI (m3/ha/yr)
22 25 18
Year of Harvest (m3/ha removed)
First Thinning (1/4) 10 (60) 9 (40)
Second Thinning (1/4) 12 (44)
Final Harvest (100%) 9 (200) 16 (340) 22 (312)
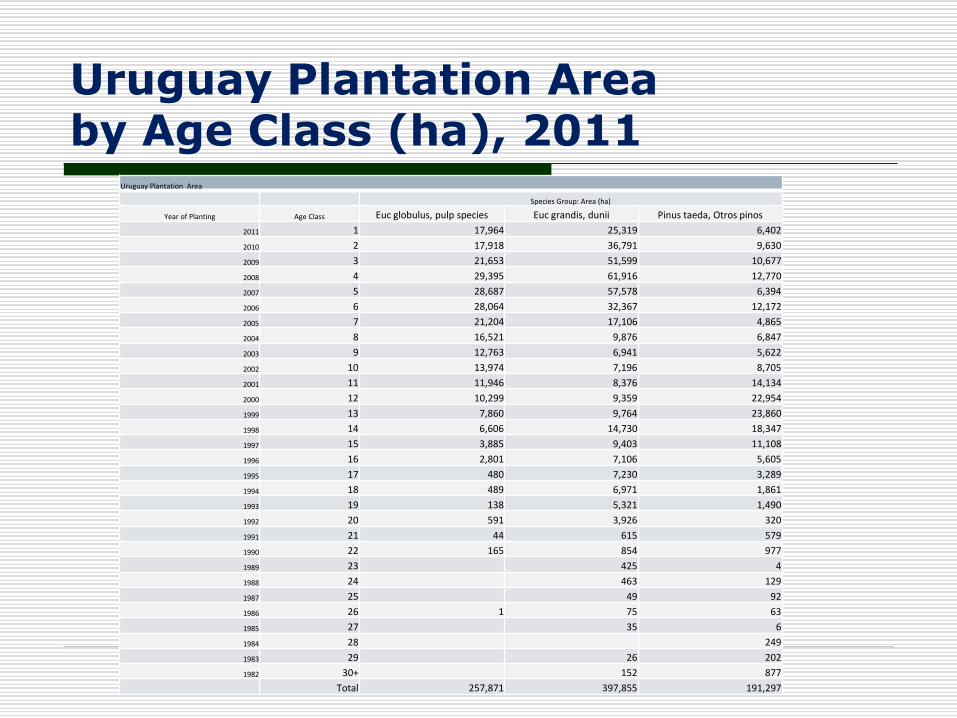
Uruguay Plantation Areaby Age Class (ha), 2011
Uruguay Plantation Area
Species Group: Area (ha)
Year of Planting Age Class Euc globulus, pulp species Euc grandis, dunii Pinus taeda, Otros pinos
2011 1 17,964 25,319 6,402
2010 2 17,918 36,791 9,630
2009 3 21,653 51,599 10,677
2008 4 29,395 61,916 12,770
2007 5 28,687 57,578 6,394
2006 6 28,064 32,367 12,172
2005 7 21,204 17,106 4,865
2004 8 16,521 9,876 6,847
2003 9 12,763 6,941 5,622
2002 10 13,974 7,196 8,705
2001 11 11,946 8,376 14,134
2000 12 10,299 9,359 22,954
1999 13 7,860 9,764 23,860
1998 14 6,606 14,730 18,347
1997 15 3,885 9,403 11,108
1996 16 2,801 7,106 5,605
1995 17 480 7,230 3,289
1994 18 489 6,971 1,861
1993 19 138 5,321 1,490
1992 20 591 3,926 320
1991 21 44 615 579
1990 22 165 854 977
1989 23 425 4
1988 24 463 129
1987 25 49 92
1986 26 1 75 63
1985 27 35 6
1984 28 249
1983 29 26 202
1982 30+ 152 877
Total 257,871 397,855 191,297
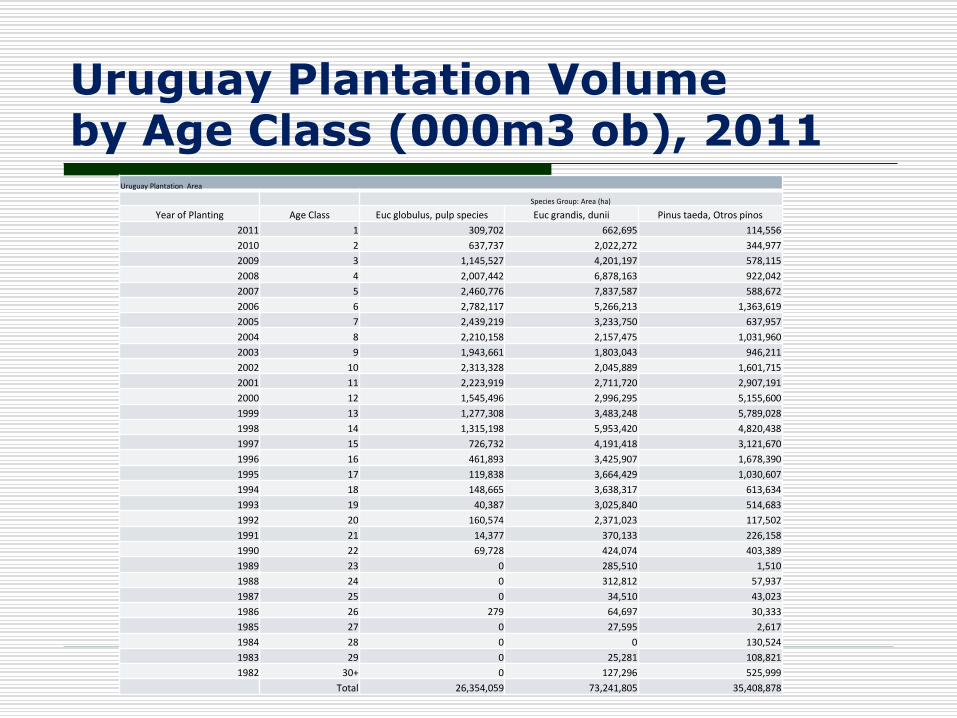
Uruguay Plantation Volume by Age Class (000m3 ob), 2011
Uruguay Plantation Area
Species Group: Area (ha)
Year of Planting Age Class Euc globulus, pulp species Euc grandis, dunii Pinus taeda, Otros pinos
2011 1 309,702 662,695 114,556
2010 2 637,737 2,022,272 344,977
2009 3 1,145,527 4,201,197 578,115
2008 4 2,007,442 6,878,163 922,042
2007 5 2,460,776 7,837,587 588,672
2006 6 2,782,117 5,266,213 1,363,619
2005 7 2,439,219 3,233,750 637,957
2004 8 2,210,158 2,157,475 1,031,960
2003 9 1,943,661 1,803,043 946,211
2002 10 2,313,328 2,045,889 1,601,715
2001 11 2,223,919 2,711,720 2,907,191
2000 12 1,545,496 2,996,295 5,155,600
1999 13 1,277,308 3,483,248 5,789,028
1998 14 1,315,198 5,953,420 4,820,438
1997 15 726,732 4,191,418 3,121,670
1996 16 461,893 3,425,907 1,678,390
1995 17 119,838 3,664,429 1,030,607
1994 18 148,665 3,638,317 613,634
1993 19 40,387 3,025,840 514,683
1992 20 160,574 2,371,023 117,502
1991 21 14,377 370,133 226,158
1990 22 69,728 424,074 403,389
1989 23 0 285,510 1,510
1988 24 0 312,812 57,937
1987 25 0 34,510 43,023
1986 26 279 64,697 30,333
1985 27 0 27,595 2,617
1984 28 0 0 130,524
1983 29 0 25,281 108,821
1982 30+ 0 127,296 525,999
Total 26,354,059 73,241,805 35,408,878
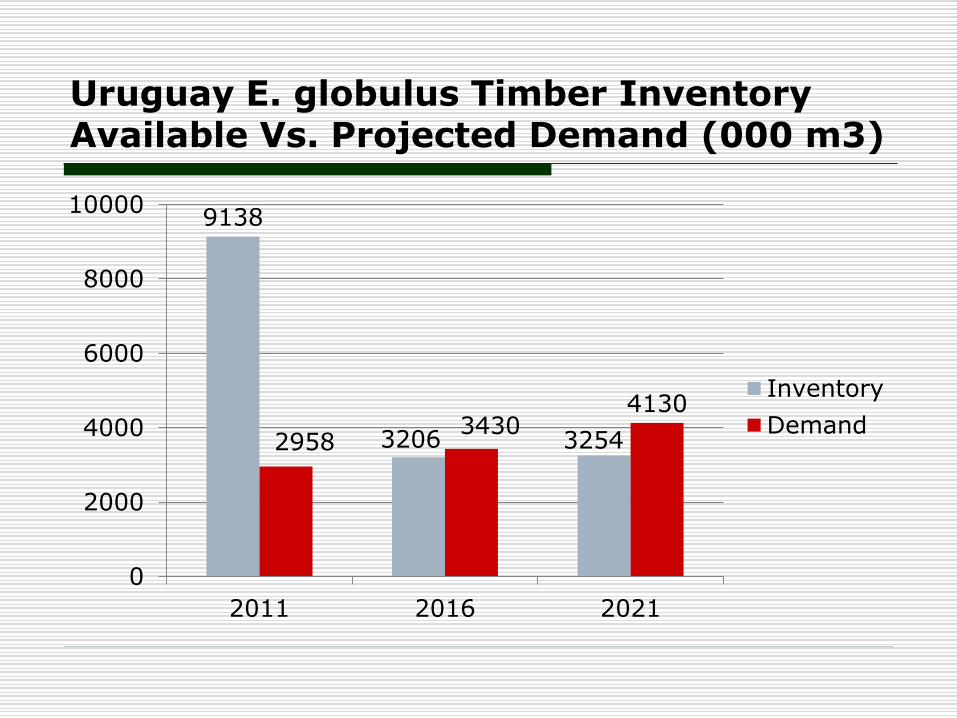
Uruguay E. globulus Timber Inventory Available Vs. Projected Demand (000 m3)
9138
3206 325429583430
4130
0
2000
4000
6000
8000
10000
2011 2016 2021
Inventory
Demand
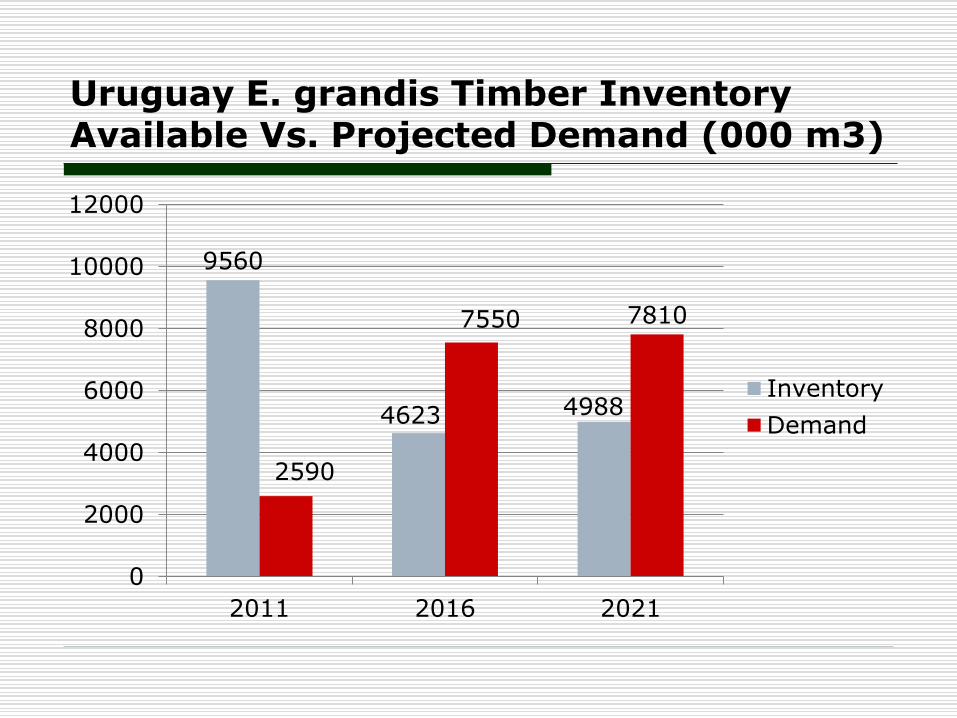
Uruguay E. grandis Timber Inventory Available Vs. Projected Demand (000 m3)
9560
4623 4988
2590
7550 7810
0
2000
4000
6000
8000
10000
12000
2011 2016 2021
Inventory
Demand
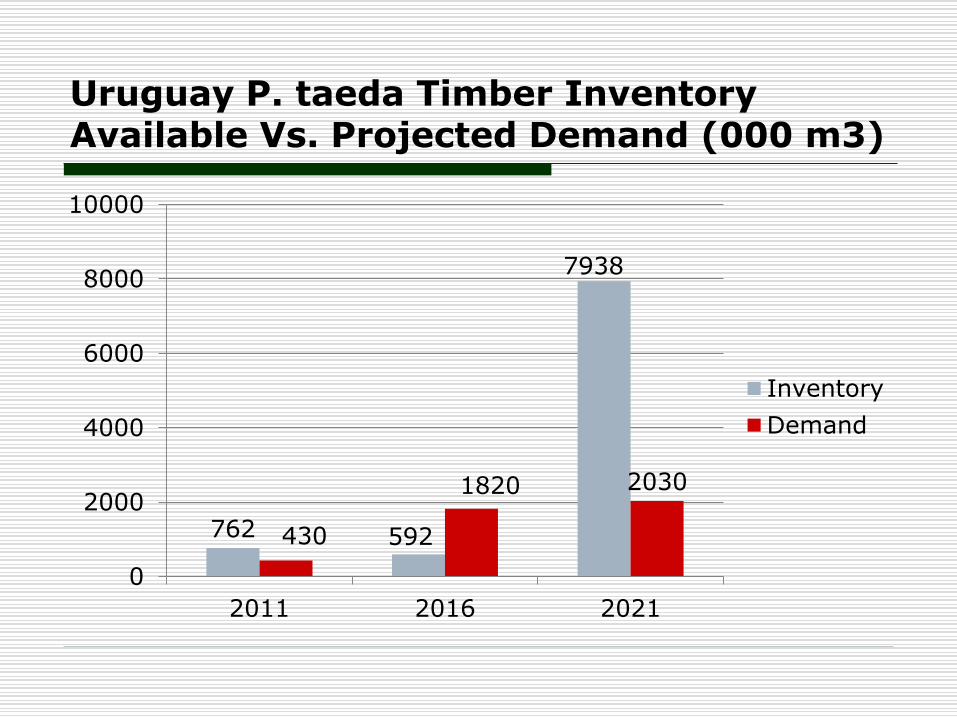
Uruguay P. taeda Timber Inventory Available Vs. Projected Demand (000 m3)
762 592
7938
430
1820 2030
0
2000
4000
6000
8000
10000
2011 2016 2021
Inventory
Demand
SOFAC March 2007
SOFAC March 2007
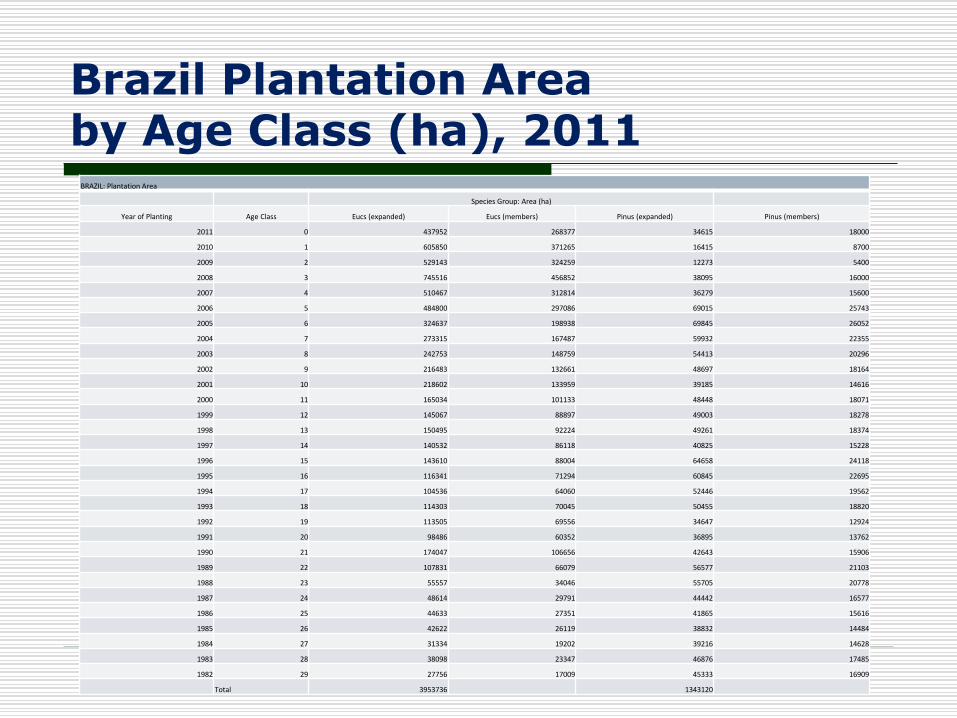
Brazil Plantation Areaby Age Class (ha), 2011
BRAZIL: Plantation Area
Species Group: Area (ha)
Year of Planting Age Class Eucs (expanded) Eucs (members) Pinus (expanded) Pinus (members)
2011 0 437952 268377 34615 18000
2010 1 605850 371265 16415 8700
2009 2 529143 324259 12273 5400
2008 3 745516 456852 38095 16000
2007 4 510467 312814 36279 15600
2006 5 484800 297086 69015 25743
2005 6 324637 198938 69845 26052
2004 7 273315 167487 59932 22355
2003 8 242753 148759 54413 20296
2002 9 216483 132661 48697 18164
2001 10 218602 133959 39185 14616
2000 11 165034 101133 48448 18071
1999 12 145067 88897 49003 18278
1998 13 150495 92224 49261 18374
1997 14 140532 86118 40825 15228
1996 15 143610 88004 64658 24118
1995 16 116341 71294 60845 22695
1994 17 104536 64060 52446 19562
1993 18 114303 70045 50455 18820
1992 19 113505 69556 34647 12924
1991 20 98486 60352 36895 13762
1990 21 174047 106656 42643 15906
1989 22 107831 66079 56577 21103
1988 23 55557 34046 55705 20778
1987 24 48614 29791 44442 16577
1986 25 44633 27351 41865 15616
1985 26 42622 26119 38832 14484
1984 27 31334 19202 39216 14628
1983 28 38098 23347 46876 17485
1982 29 27756 17009 45333 16909
Total 3953736 1343120
SOFAC March 2007
SOFAC March 2007
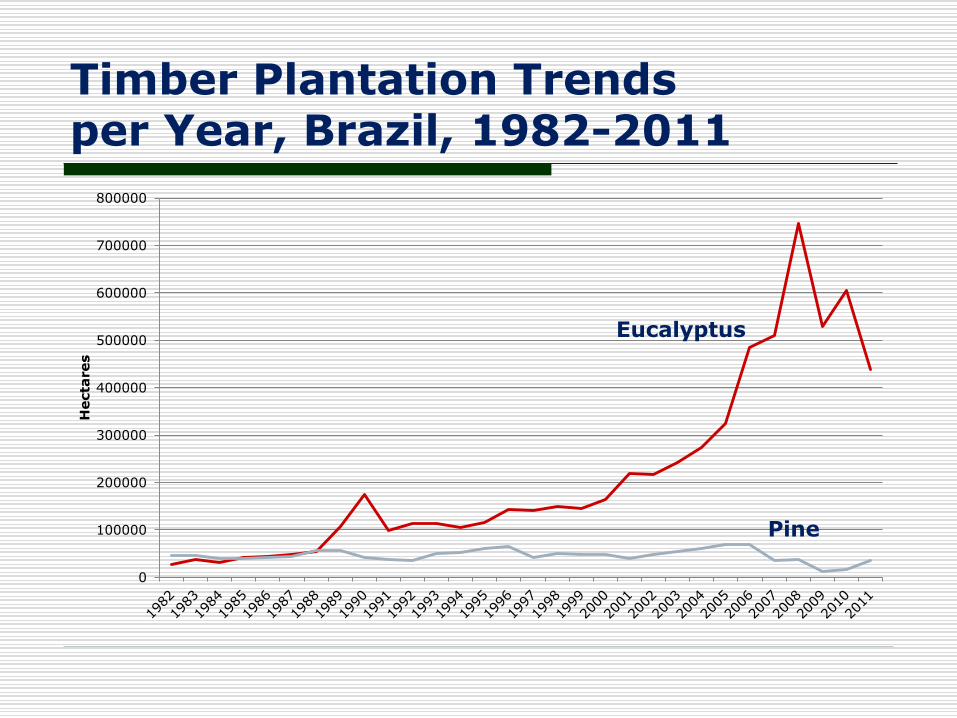
Timber Plantation Trends per Year, Brazil, 1982-2011
0
100000
200000
300000
400000
500000
600000
700000
800000
Hecta
res
Eucalyptus
Pine
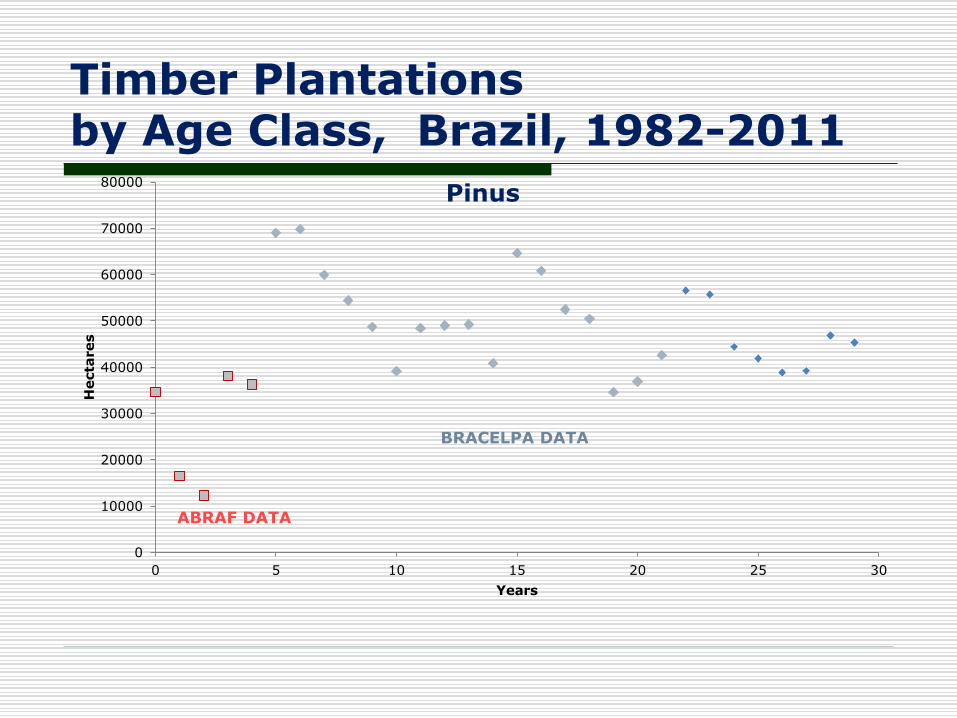
Timber Plantationsby Age Class, Brazil, 1982-2011
0
10000
20000
30000
40000
50000
60000
70000
80000
0 5 10 15 20 25 30
Hecta
res
Years
Pinus
ABRAF DATA
BRACELPA DATA
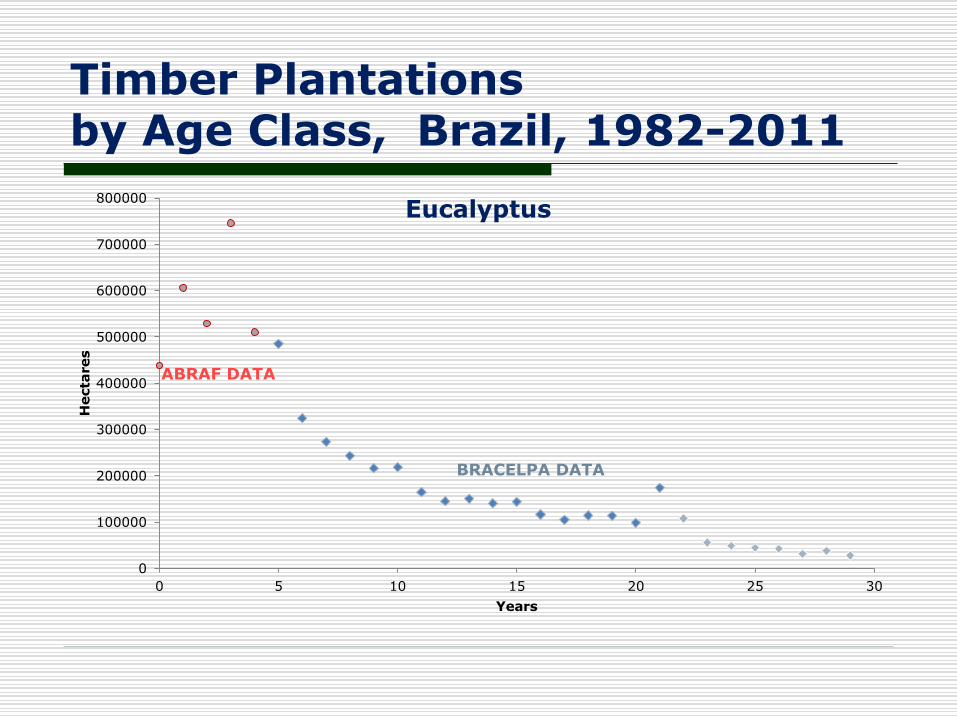
Timber Plantationsby Age Class, Brazil, 1982-2011
0
100000
200000
300000
400000
500000
600000
700000
800000
0 5 10 15 20 25 30
Hecta
res
Years
Eucalyptus
ABRAF DATA
BRACELPA DATA
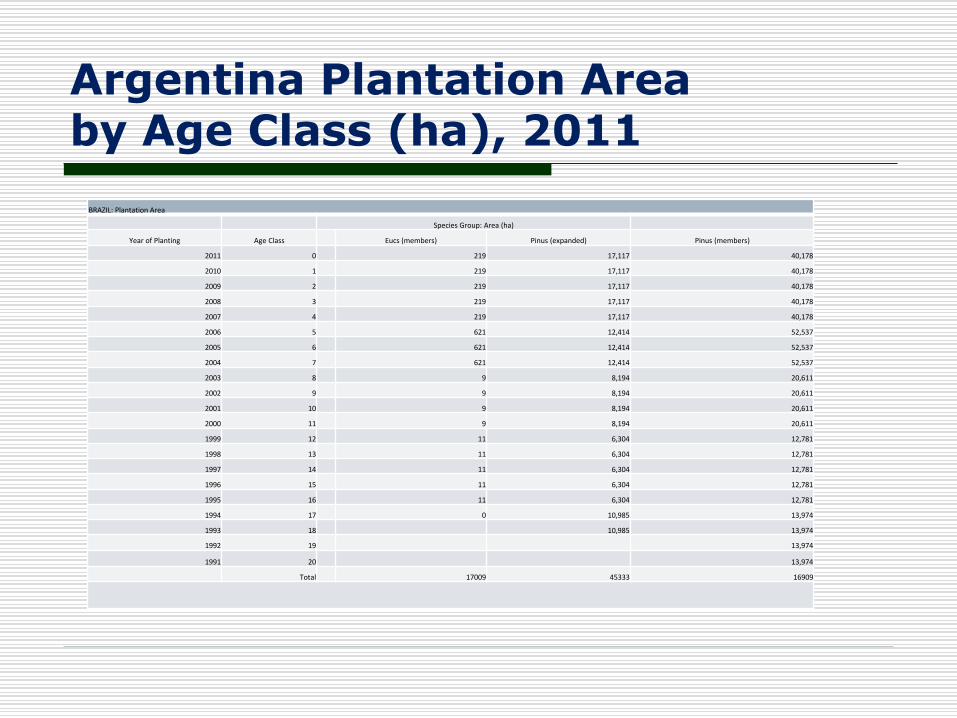
Argentina Plantation Areaby Age Class (ha), 2011
BRAZIL: Plantation Area
Species Group: Area (ha)
Year of Planting Age Class Eucs (members) Pinus (expanded) Pinus (members)
2011 0 219 17,117 40,178
2010 1 219 17,117 40,178
2009 2 219 17,117 40,178
2008 3 219 17,117 40,178
2007 4 219 17,117 40,178
2006 5 621 12,414 52,537
2005 6 621 12,414 52,537
2004 7 621 12,414 52,537
2003 8 9 8,194 20,611
2002 9 9 8,194 20,611
2001 10 9 8,194 20,611
2000 11 9 8,194 20,611
1999 12 11 6,304 12,781
1998 13 11 6,304 12,781
1997 14 11 6,304 12,781
1996 15 11 6,304 12,781
1995 16 11 6,304 12,781
1994 17 0 10,985 13,974
1993 18 10,985 13,974
1992 19 13,974
1991 20 13,974
Total 17009 45333 16909
SOFAC March 2007
SOFAC March 2007
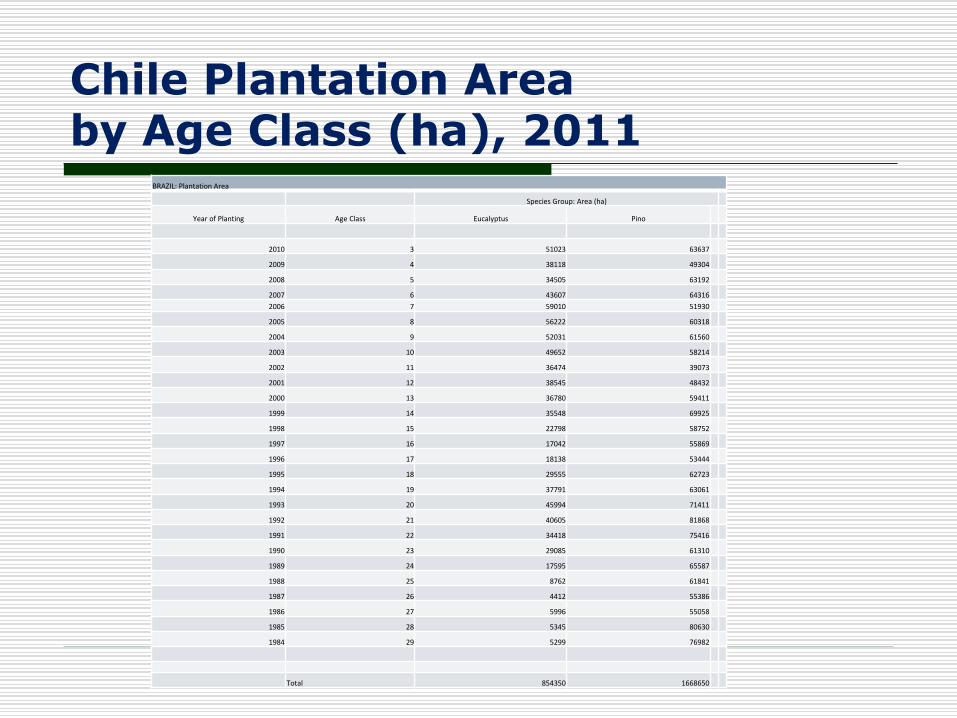
Chile Plantation Areaby Age Class (ha), 2011
BRAZIL: Plantation Area
Species Group: Area (ha)
Year of Planting Age Class Eucalyptus Pino
2010 3 51023 63637
2009 4 38118 49304
2008 5 34505 63192
2007 6 43607 64316
2006 7 59010 51930
2005 8 56222 60318
2004 9 52031 61560
2003 10 49652 58214
2002 11 36474 39073
2001 12 38545 48432
2000 13 36780 59411
1999 14 35548 69925
1998 15 22798 58752
1997 16 17042 55869
1996 17 18138 53444
1995 18 29555 62723
1994 19 37791 63061
1993 20 45994 71411
1992 21 40605 81868
1991 22 34418 75416
1990 23 29085 61310
1989 24 17595 65587
1988 25 8762 61841
1987 26 4412 55386
1986 27 5996 55058
1985 28 5345 80630
1984 29 5299 76982
Total 854350 1668650
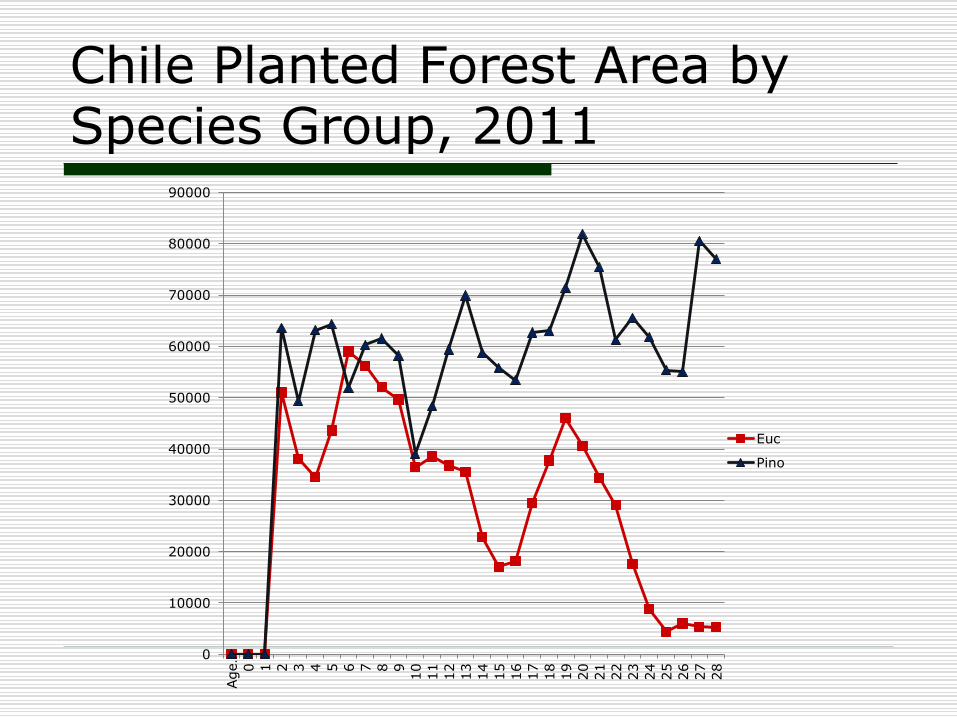
Chile Planted Forest Area by Species Group, 2011
0
10000
20000
30000
40000
50000
60000
70000
80000
90000
Age…
0 1 2 3 4 5 6 7 8 9
10
11
12
13
14
15
16
17
18
19
20
21
22
23
24
25
26
27
28
Euc
Pino
SOFAC March 2007
SOFAC March 2007
SOFAC March 2007
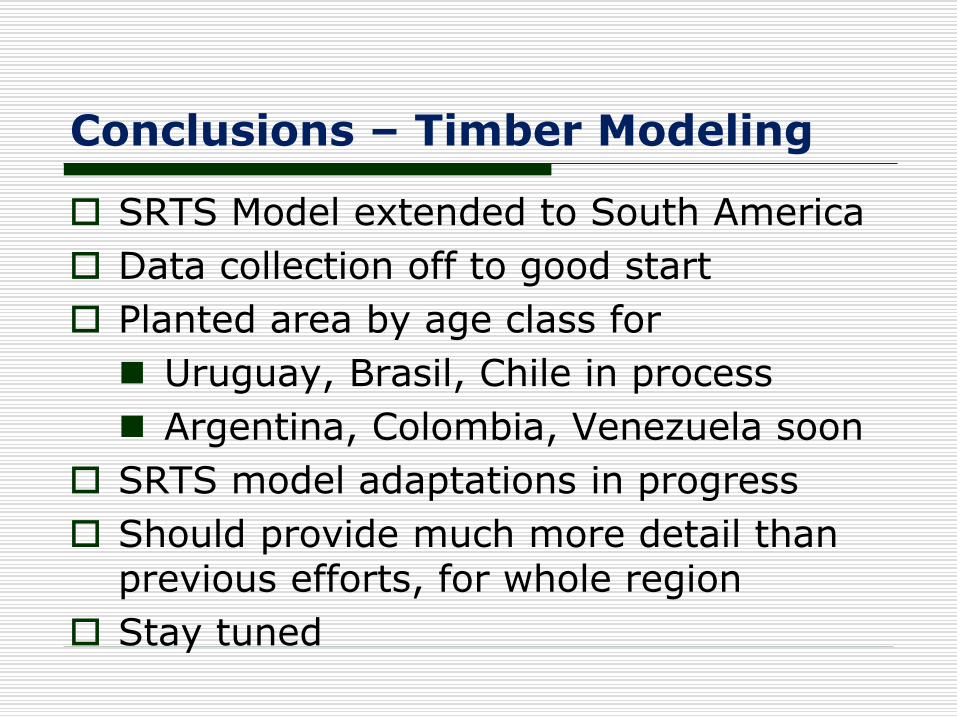
Conclusions – Timber Modeling
SRTS Model extended to South America
Data collection off to good start
Planted area by age class for
Uruguay, Brasil, Chile in process
Argentina, Colombia, Venezuela soon
SRTS model adaptations in progress
Should provide much more detail than previous efforts, for whole region
Stay tuned
SOFAC March 2007
SOFAC March 2007
SOFAC March 2007
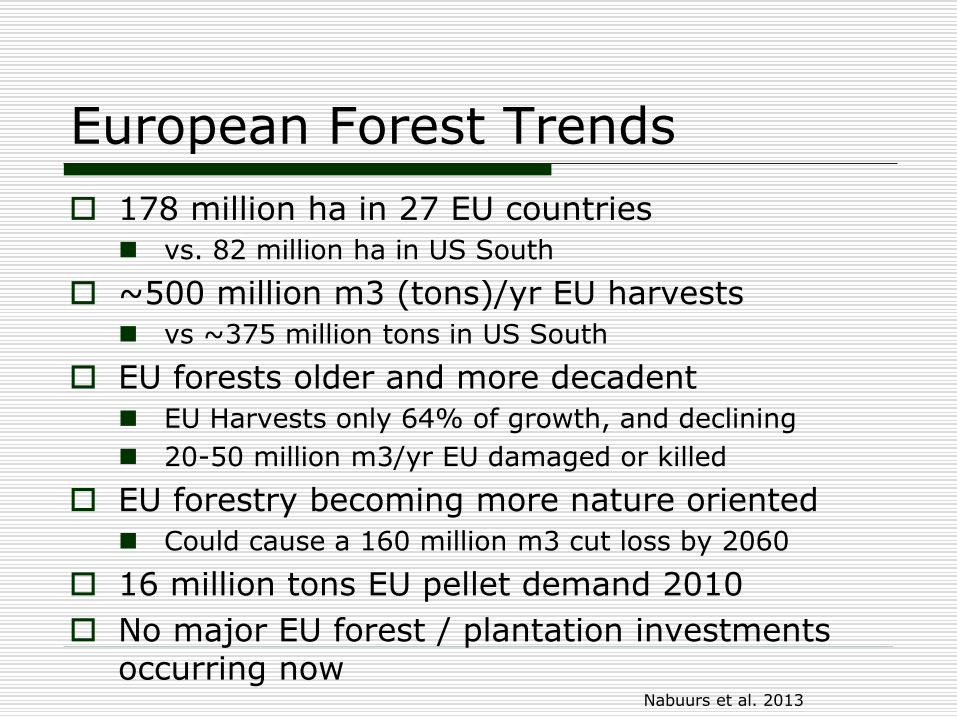
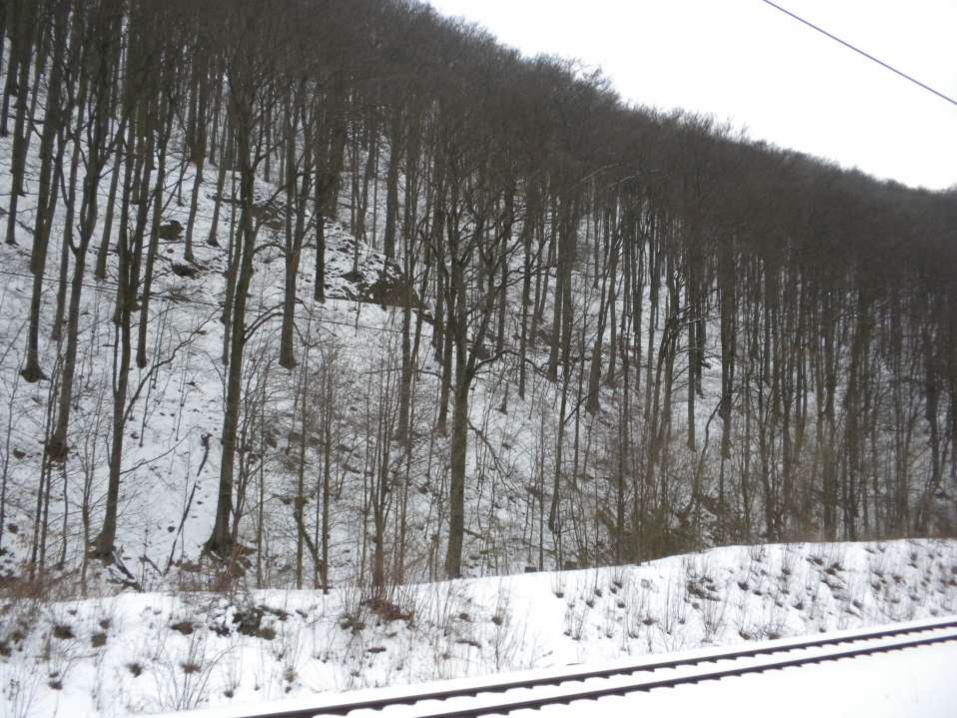
European Forest Trends
178 million ha in 27 EU countries
vs. 82 million ha in US South
~500 million m3 (tons)/yr EU harvests
vs ~375 million tons in US South
EU forests older and more decadent
EU Harvests only 64% of growth, and declining
20-50 million m3/yr EU damaged or killed
EU forestry becoming more nature oriented
Could cause a 160 million m3 cut loss by 2060
16 million tons EU pellet demand 2010
No major EU forest / plantation investments occurring now
Nabuurs et al. 2013
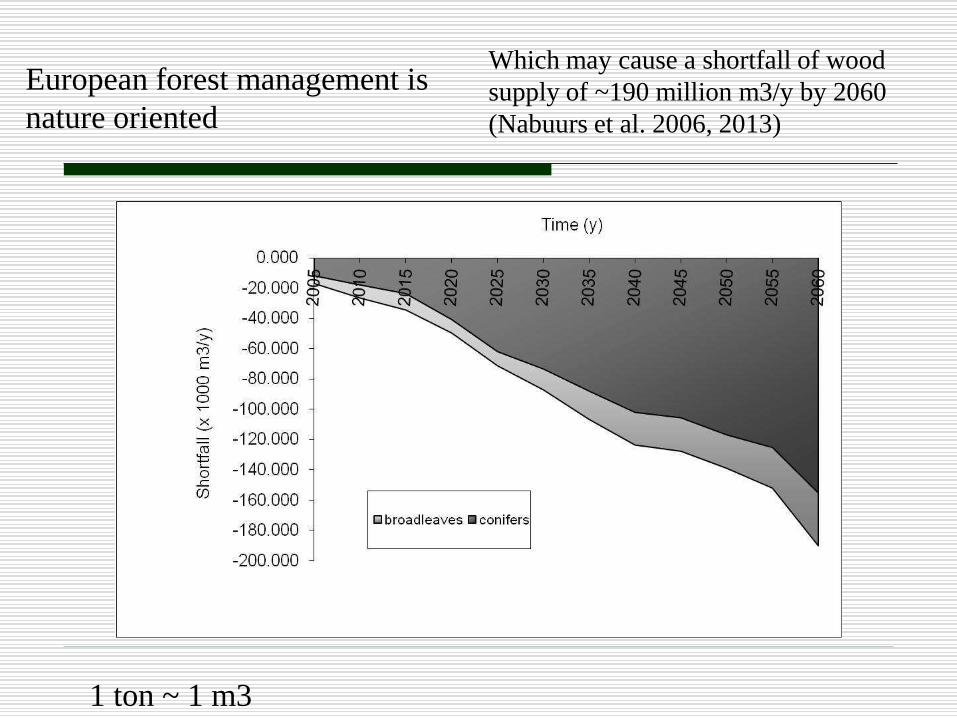
European forest management is
nature oriented
Which may cause a shortfall of wood
supply of ~190 million m3/y by 2060
(Nabuurs et al. 2006, 2013)
1 ton ~ 1 m3
SOFAC March 2007
SOFAC March 2007
SOFAC March 2007
SOFAC March 2007
SOFAC March 2007
SOFAC March 2007
SOFAC March 2007
SOFAC March 2007
SOFAC March 2007
SOFAC March 2007
SOFAC March 2007
SOFAC March 2007
Modeling Timber Supplyfrom Planted Forests in South America
andEuropean Forestry: A Snapshot
SOFAC Speech, 7 August 2013
Drawn from a Speech Presented at:
3rd International Congress on Planted Forests
Porto, Portugal
17 May 2013