modeling of corona-induced electrohydrodynamic flow …electrostatics.org/images/esa_2008_e1.pdf ·...
TRANSCRIPT

Proc. ESA Annual Meeting on Electrostatics 2008, Paper E1 1
Modeling of corona-induced electrohydrodynamic flow with
COMSOL multiphysics
Nels E. Jewell-Larsen1,2, Sergey V. Karpov1, Igor A. Krichtafovitch1, Vivi Jayanty1 , Chih-Peng Hsu2, Alexander V. Mamishev2
1Kronos Air Technologies
15241 NE 90th St. Redmond, WA 98052 USA
phone: 425-885-9739 e-mail: [email protected]
2University of Washington, Department of Electrical Engineering Seattle, WA 98195 USA
Abstract —Electrohydrodynamic (EHD) flow is a flow of electrically neutral gas caused by corona-generated ions drifting through it. Many aspects of this gas movement phenomenon such as electric field and charge distribution, fluid dynamics, and heat transfer have been investigated, and the use of accurate models have become critical in the development of com-mercial applications in this field. The purpose of the present paper is to demonstrate that corona induced airflow can be successfully modeled using COMSOL multiphysics, a com-mercial software package that performs equation-based multiphysics modeling for different physical processes by applying the finite element method to the system of partial differential equations. Governing equations, boundary conditions, and numerical results obtained with COMSOL multiphysics are presented, and compared with experimental results. Numerical results are found to be in good agreement with experimental results.
I. INTRODUCTION Electrohydrodynamic (EHD) flow is a flow of electrically neutral gas caused by corona-generated ions drifting through it. Many aspects of this gas movement phenomenon such as electric field and charge distribution, fluid dynamics, and heat transfer were exten-sively studied over a wide range of potential electrostatic fluid accelerator (EFA) applica-tions, including electronics cooling, air filtration, air movement, and many others [1-9]. However, EHD flow involves interaction between electric field, ion motion, flow of elec-trically neutral gas molecules, and is described by a system of coupled nonlinear equa-tions. Since analytical solutions can be obtained only for a very limited number of cases with the simplest geometry, numerical modeling of EHD flow has become essential for the development and optimization of technologies in the EHD field. Although several
Proc. ESA Annual Meeting on Electrostatics 2008, Paper E1 2
numerical techniques and approaches have been developed, many of them have limita-tions, use some simplifications, require prior experimental data, or are simply not con-venient to use. As the EFA field continues to evolve, there is a growing need for accurate models that can help predict device performance metrics, such as corona onset voltage, current-voltage curves, power consumption, air velocity profiles, back pressure, and heat exchange. Many previous modeling efforts only account for electrostatic interactions [10]. For accurate modeling, however, it is important to include effects of fluid dynamics and the complete space charge transport equation. Preliminary coupled-physics modeling has been conduced in one-dimensional space without accounting for charge generation showing good agreement with analytical models for a simple one-dimensional space [11]. The modeling problem becomes especially challenging for design and optimization of EFA devices with high geometric complexity. Several investigations into corona based EHD flow and convective heat transfer modeling have been presented recently, however most lack a rigorous comparison with experimental current-voltage, airflow, and air velocity profile results [4,12].
The purpose of the present paper is to demonstrate that corona based ion current and induced airflow can be successfully modeled for a complex geometry using COMSOL multiphysics, a commercial software package that performs equation-based multiphysics modeling for different physical processes by applying the finite element method. Nu-merical results are presented and compared to experimental results from a representative EHD device in order to validate the model. A brief background into corona-induced air flow is presented, followed by a description of the numerical and experimental models, and finally concluded with a comparison and discussion of numerical and experimental results.
II. BACKGROUND The mechanism of corona-induced ionic wind propulsion is illustrated in Fig. 1. Gas molecules near the corona discharge region become ionized when a high intensity elec-tric field is applied between a high tip curvature corona electrode and a low tip curvature collector electrode. In the case of a wire or rod electrode, the radius of curvature of the cross-section along the diameter of the wire or rod electrode is equivalent to the tip cur-vature of a needle electrode. The ionized gas molecules travel towards the collector elec-trode, colliding with neutral air molecules. During these collisions, momentum is im-parted from the ionized gas to the neutral air molecules, resulting in the movement of gas towards the collector electrode.
The operating voltage range for corona discharge lies between the corona onset and the air gap breakdown voltage [13]. Corona induced airflow is possible with both posi-tive and negative voltages and polarities. In general, the selection of polarity depends on a large number of factors, which include electrode material, device geometry, ozone gen-eration constraints, and others. The governing equations describing the interaction of electric charges with moving media in an electrostatic fluid accelerator have been known for a long time and comprehensive reviews and tutorials on this subject are readily avail-able [13-19].

Proc. ESA Annual Meeting on Electrostatics 2008, Paper E1 3
Fig. 1. Ion stream of a DC electrostatic air pump, where a high voltage is applied between the corona and collector electrodes.
III. NUMERICAL MODELING
A. Governing equations for electrohydrodynamic flow Electrohydrodynamic flow induced by corona discharge and is described by the follow-ing equations. The electric potential V is governed by Poisson’s equation
2
0
Vρε
∇ =− (1)
where ρ is the space charge density and 0ε is the dielectric permittivity of free space. The electric potential is defined from electric field intensity E as
VE=−∇ (2)
Electric current in the drifting zone is a combination of three effects: conduction (motion of ions under electric field relative to entire airflow), convection (transport of charges with airflow), and diffusion. Therefore, current density J is given by
E DJ E Uµ ρ ρ ρ= + − ∇ (3)
where Eµ is the air ions mobility in an electric field, U is velocity vector of airflow, and D is the diffusivity coefficient of ions. Current continuity condition gives equation for current density
0J∇ =i (4)
The fluid dynamic part of the problem is described by the Navier-Stokes equations and continuity equation for steady state incompressible air flow
2air p VU U Uρ µ ρ∇ =−∇ + ∇ − ∇i (5)
Proc. ESA Annual Meeting on Electrostatics 2008, Paper E1 4
0U∇ =i (6)
where airρ is the air density, p is the air pressure, and µ is the air dynamic viscosity. The system of equations (1), (3), (4), (5), and (6) is subject to appropriate boundary con-ditions described below for EHD device investigated in this study.
B. Space charge generation Space charge generation by corona discharge in an EFA device can be modeled by ap-plying appropriate electrostatic and charge transport boundary conditions at the surface of the corona electrode and ionization zone. A description of the boundary conditions for space charge generation estimation is described in this section. The gap between corona and collecting electrodes can be divided into two regions, the ionization and drift zones. The ionization zone exists in close proximity to the corona electrode, in which air ionization occurs, and both positive and negative ions exist. The drift region, located outside the ionization zone, contains ions of a single polarity that have been driven out of the ionization region by the electric field. When the radius of the corona electrode is much smaller than the distance between corona and collecting elec-trodes, the ionization zone forms a uniform sheath over the coronating region of the co-rona electrode surface. For the positive corona, the electric field strength Ee at the surface of a smooth corona electrode of radius Re is given by Peek’s empirical formula for air at standard conditions [13]
( )2e 0 e1 2.62 10 /E E R−= + ⋅ (7)
where the corona electrode radius Re is measured in meters and E0 = 3.31·106 V/m is the breakdown (ionizing) electric strength of air. In contrast with the drifting zone, the ioni-zation zone contains charges of both polarities. However due to the large difference in motilities between electrons and positive ions, the vast majority of the ionization region volume has a net space charge, which is positive in the case of a positive corona [20]. Thus, the model presented in this paper ignores the effect of the bipolar region of the ionization zone by assuming its bipolar region thickness is zero. At the external surface of the ionization zone, Kaptsov’s assumption is made [21], which states that the ionization zone radius and electric field strength on the wire surface re-mains approximately constant with a changing Ve once a corona is formed. This enables estimation of the surface charge density on the external surface of the corona wire by specifying electric potential Ve and assuming the electric field strength E = Ee at the sur-face of the corona wire.
C. Model geometry under test A wire-to-grid channel EFA geometry was used for this study and consists of three major components, a corona electrode, collecting mesh, and collecting side walls, as shown in Fig. 2. The corona electrode is a conductive wire with a constant radius of curvature along its length which is centered between and parallel to two conductive plates that make up the collecting side walls of the channel. A collecting mesh consisting of parallel conductive wire electrodes is placed within the channel down stream and parallel to the

Proc. ESA Annual Meeting on Electrostatics 2008, Paper E1 5
corona electrode and orthogonal to the airflow path. The electrodes in the collecting mesh are spaced close together such that the electric field strength at their surface is re-duced below the corona onset requirement, while at the same time creating only a low pressure drop to the airflow passing through the mesh.
Fig. 2. Diagram of wire-to-grid channel concept; not drawn to scale. Physical measurement of average air velocity at the output of the channel is relatively simple since the air velocity is fairly uniform across the output of the channel, which would not necessarily be the case if the grid collector electrodes were replaced with a single or multiple rod of larger diameter. A channel geometry was chosen such that it enables simple measurement of the total volume of airflow produced from the EFA de-vice, which would be difficult in the case of an open system without a channel to confine the flow. The conductive channel geometry allows for maximum collection of ions pro-duced by the corona discharge by creating a large surface over which collection can oc-cur, thus increasing the accuracy of corona current measurements during operation. By utilizing a conductive channel, the boundary conditions at the surface of the chan-nel are simplified. Had a dielectric surface been used for the channel, there would be ion adhesion to the channel wall creating a surface charge that would have to be accounted for in the numerical model. Although such modeling is possible, it adds additional com-plexity and sources of error, which should be minimized for model validation purposes.
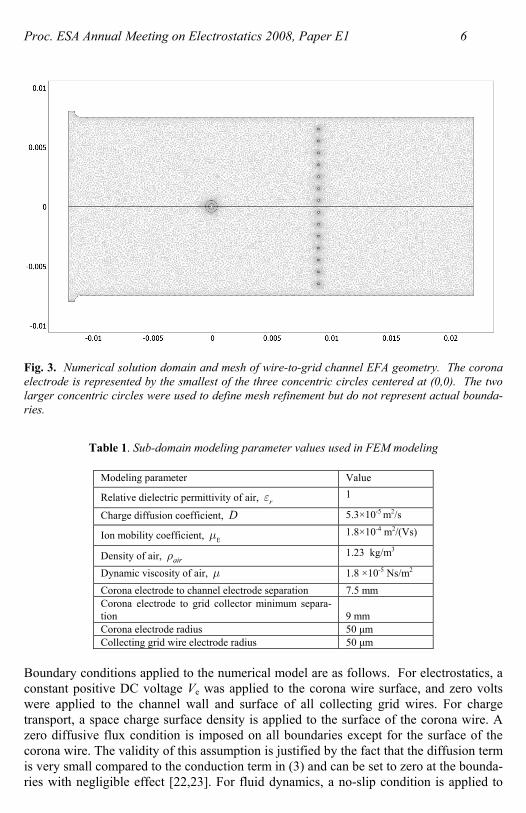
D. Numerical solution domain and boundary conditions The wire-to-grid channel EFA numerical simulation space, subdomains, boundaries, and mesh are shown in Fig. 3. A single subdomain was used for the entire simulation space which made up the inside of the channel, where the electrical, charge transport, and fluid dynamic domain equations were solved using the subdomain modeling parameter values shown in Table 1.
Proc. ESA Annual Meeting on Electrostatics 2008, Paper E1 6
Fig. 3. Numerical solution domain and mesh of wire-to-grid channel EFA geometry. The corona electrode is represented by the smallest of the three concentric circles centered at (0,0). The two larger concentric circles were used to define mesh refinement but do not represent actual bounda-ries.
Table 1. Sub-domain modeling parameter values used in FEM modeling
Modeling parameter Value
Relative dielectric permittivity of air, rε 1
Charge diffusion coefficient, D 5.3×10⁻⁵ m2/s
Ion mobility coefficient, Eµ 1.8×10⁻⁴ m2/(Vs)
Density of air, airρ 1.23 kg/m3
Dynamic viscosity of air, µ 1.8 ×10⁻⁵ Ns/m2 Corona electrode to channel electrode separation 7.5 mm Corona electrode to grid collector minimum separa-tion 9 mm Corona electrode radius 50 µm Collecting grid wire electrode radius 50 µm
Boundary conditions applied to the numerical model are as follows. For electrostatics, a constant positive DC voltage Ve was applied to the corona wire surface, and zero volts were applied to the channel wall and surface of all collecting grid wires. For charge transport, a space charge surface density is applied to the surface of the corona wire. A zero diffusive flux condition is imposed on all boundaries except for the surface of the corona wire. The validity of this assumption is justified by the fact that the diffusion term is very small compared to the conduction term in (3) and can be set to zero at the bounda-ries with negligible effect [22,23]. For fluid dynamics, a no-slip condition is applied to
Proc. ESA Annual Meeting on Electrostatics 2008, Paper E1 7
the surface of the channel, collecting grid wires, and corona electrode. Normal flow with pressure prescribed from Bernoulli’s equation was used at the channel input air bound-ary, and an outlet-flow condition and zero pressure was prescribed at the outlet air boundary. The numerical simulation space was descretized in approximately 44,000 triangular elements, with the element density being highest in the region around the co-rona electrode and in the areas of relative high space charge density and electric field intensity, as shown in Fig. 3.
IV. EXPERIMENTAL MODEL DESIGN AND TEST PROCEDURE
A. Experimental model design The wire-to-grid channel EFA geometry shown in Fig. 2 and Fig. 3 was used as a basis to construct the experimental model shown in Fig. 4. The top and bottom collecting plates were constructed of flat rectangular aluminum bar stock with a cross-section width and length of five millimeters and thirty four millimeters respectively, and an overall length of thirty centimeters. The corona and collecting electrode wires were held in place ten millimeters from the outlet plane of the device by wire spacing structures attached to either end of the top and bottom collecting plates. The wire spacing structure was made from a custom PCB board ensuring accurate mutual and absolute placement of the corona and collecting wire electrodes relative to themselves and the collecting plates. Fourteen tungsten 100 micrometer diameter collecting wires were strung one millimeter apart on center from the top to the bottom of the channel made by the collecting plates, creating a total channel gap of fifteen millimeters. A single tungsten corona wire electrode of same diameter was placed parallel to the collecting wires and centered between the collecting plates, with a distance from the collecting wires of nine millimeters, and a total coronat-ing wire length of 27.7 centimeters. To ensure proper tensioning of the corona wire dur-ing operation, a spring based wire tensioning system was used at one end of the channel.
B. Experimental test setup and procedure Current-voltage and output air velocity profile measurements were taken from the wire-to-grid channel EFA prototype using the experimental test setup shown in Fig. 4. In op-eration, the corona electrode of the prototype was connected to the output of a positive polarity high voltage power supply, and the collecting plates and wires were connected to ground. Voltage and current measurements on the corona electrode were measured using the built in current and voltage measurement capabilities of the Spellman SL high voltage power supply. All measurements were conducted in ambient air at room temperature and pressure.
Proc. ESA Annual Meeting on Electrostatics 2008, Paper E1 8
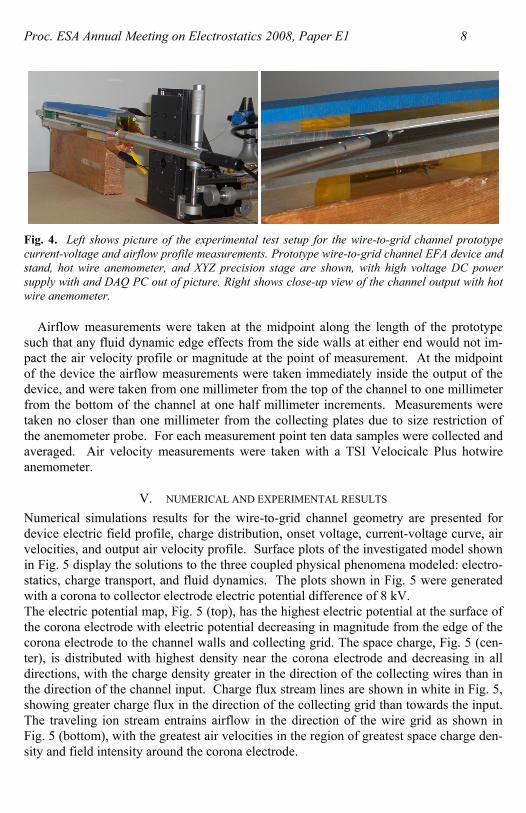
Fig. 4. Left shows picture of the experimental test setup for the wire-to-grid channel prototype current-voltage and airflow profile measurements. Prototype wire-to-grid channel EFA device and stand, hot wire anemometer, and XYZ precision stage are shown, with high voltage DC power supply with and DAQ PC out of picture. Right shows close-up view of the channel output with hot wire anemometer.
Airflow measurements were taken at the midpoint along the length of the prototype such that any fluid dynamic edge effects from the side walls at either end would not im-pact the air velocity profile or magnitude at the point of measurement. At the midpoint of the device the airflow measurements were taken immediately inside the output of the device, and were taken from one millimeter from the top of the channel to one millimeter from the bottom of the channel at one half millimeter increments. Measurements were taken no closer than one millimeter from the collecting plates due to size restriction of the anemometer probe. For each measurement point ten data samples were collected and averaged. Air velocity measurements were taken with a TSI Velocicalc Plus hotwire anemometer.
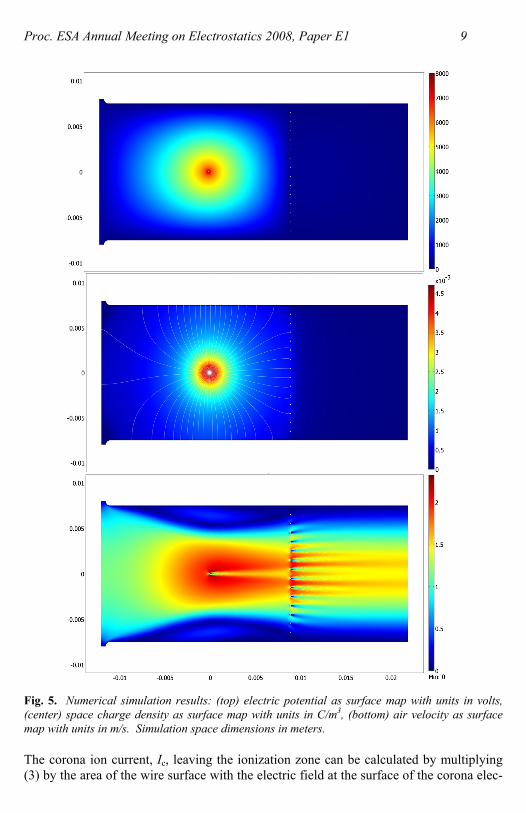
V. NUMERICAL AND EXPERIMENTAL RESULTS Numerical simulations results for the wire-to-grid channel geometry are presented for device electric field profile, charge distribution, onset voltage, current-voltage curve, air velocities, and output air velocity profile. Surface plots of the investigated model shown in Fig. 5 display the solutions to the three coupled physical phenomena modeled: electro-statics, charge transport, and fluid dynamics. The plots shown in Fig. 5 were generated with a corona to collector electrode electric potential difference of 8 kV. The electric potential map, Fig. 5 (top), has the highest electric potential at the surface of the corona electrode with electric potential decreasing in magnitude from the edge of the corona electrode to the channel walls and collecting grid. The space charge, Fig. 5 (cen-ter), is distributed with highest density near the corona electrode and decreasing in all directions, with the charge density greater in the direction of the collecting wires than in the direction of the channel input. Charge flux stream lines are shown in white in Fig. 5, showing greater charge flux in the direction of the collecting grid than towards the input. The traveling ion stream entrains airflow in the direction of the wire grid as shown in Fig. 5 (bottom), with the greatest air velocities in the region of greatest space charge den-sity and field intensity around the corona electrode.
Proc. ESA Annual Meeting on Electrostatics 2008, Paper E1 9
Fig. 5. Numerical simulation results: (top) electric potential as surface map with units in volts, (center) space charge density as surface map with units in C/m3, (bottom) air velocity as surface map with units in m/s. Simulation space dimensions in meters.
The corona ion current, Ic, leaving the ionization zone can be calculated by multiplying (3) by the area of the wire surface with the electric field at the surface of the corona elec-
Proc. ESA Annual Meeting on Electrostatics 2008, Paper E1 10
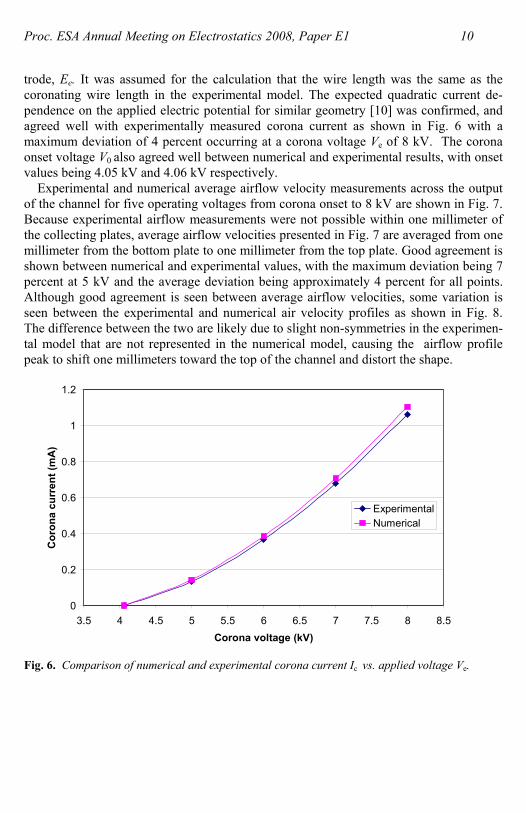
trode, Ee. It was assumed for the calculation that the wire length was the same as the coronating wire length in the experimental model. The expected quadratic current de-pendence on the applied electric potential for similar geometry [10] was confirmed, and agreed well with experimentally measured corona current as shown in Fig. 6 with a maximum deviation of 4 percent occurring at a corona voltage Ve of 8 kV. The corona onset voltage V0 also agreed well between numerical and experimental results, with onset values being 4.05 kV and 4.06 kV respectively.
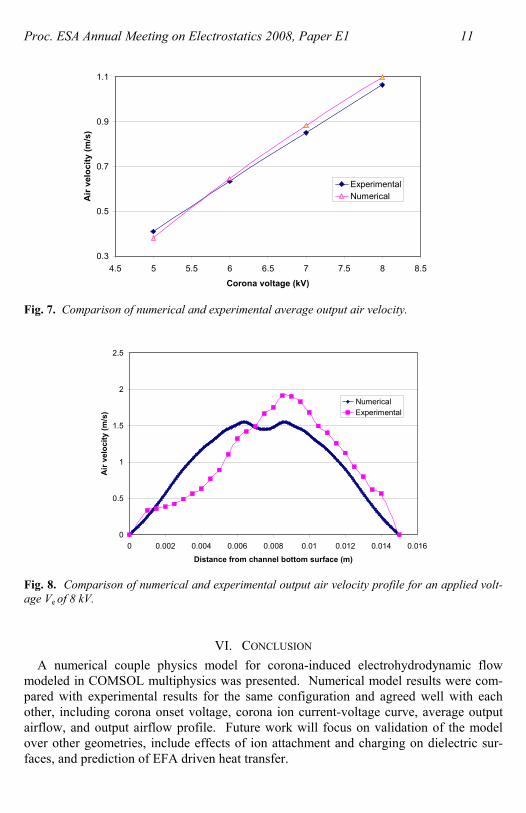
Experimental and numerical average airflow velocity measurements across the output of the channel for five operating voltages from corona onset to 8 kV are shown in Fig. 7. Because experimental airflow measurements were not possible within one millimeter of the collecting plates, average airflow velocities presented in Fig. 7 are averaged from one millimeter from the bottom plate to one millimeter from the top plate. Good agreement is shown between numerical and experimental values, with the maximum deviation being 7 percent at 5 kV and the average deviation being approximately 4 percent for all points. Although good agreement is seen between average airflow velocities, some variation is seen between the experimental and numerical air velocity profiles as shown in Fig. 8. The difference between the two are likely due to slight non-symmetries in the experimen-tal model that are not represented in the numerical model, causing the airflow profile peak to shift one millimeters toward the top of the channel and distort the shape.
0
0.2
0.4
0.6
0.8
1
1.2
3.5 4 4.5 5 5.5 6 6.5 7 7.5 8 8.5Corona voltage (kV)
Cor
ona
curr
ent (
mA
)
ExperimentalNumerical
Fig. 6. Comparison of numerical and experimental corona current Ic vs. applied voltage Ve.
Proc. ESA Annual Meeting on Electrostatics 2008, Paper E1 11
0.3
0.5
0.7
0.9
1.1
4.5 5 5.5 6 6.5 7 7.5 8 8.5
Corona voltage (kV)
Air
velo
city
(m/s
)
ExperimentalNumerical
Fig. 7. Comparison of numerical and experimental average output air velocity.
0
0.5
1
1.5
2
2.5
0 0.002 0.004 0.006 0.008 0.01 0.012 0.014 0.016
Distance from channel bottom surface (m)
Air
velo
city
(m/s
)
NumericalExperimental
Fig. 8. Comparison of numerical and experimental output air velocity profile for an applied volt-age Ve of 8 kV.
VI. CONCLUSION A numerical couple physics model for corona-induced electrohydrodynamic flow
modeled in COMSOL multiphysics was presented. Numerical model results were com-pared with experimental results for the same configuration and agreed well with each other, including corona onset voltage, corona ion current-voltage curve, average output airflow, and output airflow profile. Future work will focus on validation of the model over other geometries, include effects of ion attachment and charging on dielectric sur-faces, and prediction of EFA driven heat transfer.
Proc. ESA Annual Meeting on Electrostatics 2008, Paper E1 12
REFERENCES [1] N. E. Jewell-Larsen, "Optimization and Miniaturization of Electrostatic Air Pumps for
Thermal Management," Master thesis, University of Washington, 2004.
[2] N. E. Jewell-Larsen, P. Q. Zhang, C. P. Hsu, I. A. Krichtafovitch, and A. V. Mamishev, "Coupled-Physics Modeling of Electrostatic Fluid Accelerators for Forced Convection Cooling," 9th AIAA/ASME Joing Thermophysics and Heat Transfer Conference, 2006.
[3] C. P. Hsu, N. E. Jewell-Larsen, A. C. Rollins, I. A. Krichtafovitch, S. W. Montgomery, J. T. Dibene II, and A. V. Mamishev, "Electrostatic Fluid Accelerators Miniaturization Us-ing Microfabrication Technology," ASME International Mechanical Engineering Con-gress and Exposition, 2006.
[4] I. A. Krichtafovitch, V. L. Gorobets, S. V. Karpov, and A. V. Mamishev, "Electrostatic Fluid Accelerator and Air Purifier – the Second Wind," Annual Meeting of the Electro-statics Society of America, 2005.
[5] F. Yang, N. E. Jewell-Larsen, D. L. Brown, D. A. Parker, K. A. Pendergrass, I. A. Krichtafovitch, and A. V. Mamishev, "Corona Driven Air Propulsion For Cooling Of Electronics," 2003.
[6] K. J. Mclean, "Electrostatic Precipitators," IEE Proceedings on Science Measurement and Technology, vol. 135, no. 6, pp. 347-361, July 1988.
[7] H. J. White, Industrial Electrostatic Precipitation, Addison-Wesley, 1963.
[8] M. E. Franke and L. E. Hogue, "Electrostatic Cooling of A Horizontal Cylinder," Journal of Heat Transfer-Transactions of the Asme, vol. 113, no. 3, pp. 544-548, Aug. 1991.
[9] F. Bastien, "Acoustics and Gas Discharges: Applications to Loudspeakers," J.Phys.D: Appl.Phys., vol. 8, no. 20, pp. 1547-1557, Dec. 1987.
[10] N. E. Jewell-Larsen, E. Tran, I. A. Krichtafovitch, and A. V. Mamishev, "Design and Optimization of Electrostatic Air Pumps," IEEE Transactions on Dielectrics and Electri-cal Insulation, vol. 13, no. 1, pp. 191-2003, Feb. 2006.
[11] J. Seyed-Yagoobi, J. E. Bryan, and J. A. Castaneda, "Theoretical-Analysis of Ion-Drag Pumping," IEEE Transactions on Industry Applications, vol. 31, no. 3, pp. 469-476, May 1995.
[12] S. V. Karpov and I. A. Krichtafovitch, "Electrohydrodynamic Flow Modeling Using FEMLAB," Proceedings of the COMSOL Multiphysics Conference, Boston, MA, 2005, pp. 399-403.
[13] F. W. Peek, Dielectric Phenomena in High Voltage Engineering, New York:McGraw-Hill, 1929.
Proc. ESA Annual Meeting on Electrostatics 2008, Paper E1 13
[14] Castellanos A, "Electrohydrodynamics," International Journal of Heat and Mass Trans-fer, vol. 380, 1998.
[15] J. S. Chang and A. Watson, "Electromagnetic Hydrodynamics," IEEE Transactions on Dielectrics and Electrical Insulation, vol. 1, no. 5, pp. 871-895, 1994.
[16] F. Hauksbee, Physico-Mechanical Experiments on Various Subjects, London, England, 1709, pp. 46-47.
[17] L. B. Loeb, Fundamental Processes of Electrical Discharge in Gases, New York, Wiley & Sons Inc., 1939.
[18] M. Robinson, "Movement of Air in the Electronic Wind of Corona Discharge," AIEE Transactions, vol. 80, pp. 143-150, May 1961.
[19] O. M. Stuetzer, "Ion Drag Pressure Generation," Journal of Applied Physics, vol. 30, no. 7, pp. 984-994, July 1959.
[20] J. Chen and J. H. Davidson, "Electron Density and Energy Distributions in the Positive DC Corona: Interpretation for Corona-Enhanced Chemical Reactions (Vol 22, Pg 199, 2002)," Plasma Chemistry and Plasma Processing, vol. 22, no. 3, pp. 451, Sept. 2002.
[21] N. A. Kaptsov, Elektricheskie Yavleniya v Gazakh i Vakuume, Moscow, OGIZ, 1947.
[22] J. Q. Feng, "Application of Galerkin Finite-Element Method With Newton Iterations in Computing Steady-State Solutions of Unipolar Charge Currents in Corona Devices," Journal of Computational Physics, vol. 151, pp. 969-989, 1999.
[23] J. Q. Feng, "Electrohydrodynamic Flow Associated With Unipolar Charge Current Due to Corona Discharge From a Wire Enclosed in a Rectangular Shield," Journal of Applied Physics, vol. 86, no. 5, pp. 2412-2418, 1999.