modeling of clutch housing and facing temperature for ... of clutch housing and facing temperature...
TRANSCRIPT

1Feb 6, 2017Copyright © 2017 Mahindra & Mahindra Ltd. All rights reserved. India GT-SUITE Conference 2017, Pune
Modeling of Clutch Housing and Facing Temperature for Estimating Clutch Life of
a Manual Transmission Vehicle
Presented by:
P Srinivasan
Co-Authors:
Dr. Saravanan Muthiah
Vehicle Performance Simulation (VPS-COE)
Powertrain Division (PTD)
Mahindra & Mahindra Ltd
2Feb 6, 2017Copyright © 2017 Mahindra & Mahindra Ltd. All rights reserved. India GT-SUITE Conference 2017, Pune
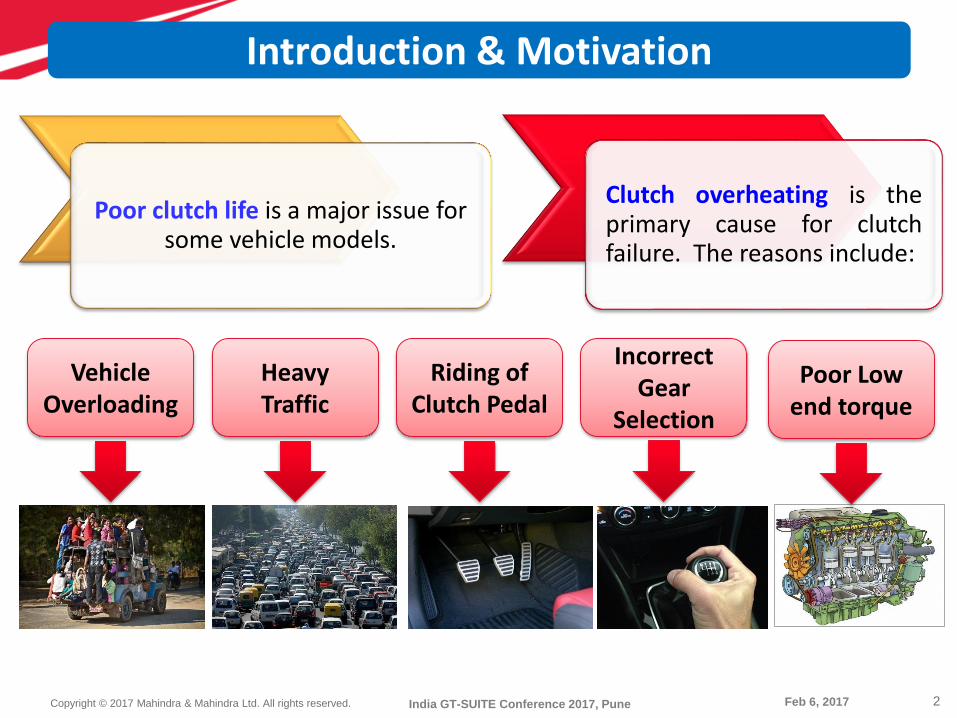
Introduction & Motivation
Poor clutch life is a major issue for some vehicle models.
Clutch overheating is theprimary cause for clutchfailure. The reasons include:
Vehicle Overloading
Heavy Traffic
Riding of Clutch Pedal
Incorrect Gear
Selection
Poor Low end torque

3Feb 6, 2017Copyright © 2017 Mahindra & Mahindra Ltd. All rights reserved. India GT-SUITE Conference 2017, Pune
Impact of Clutch Temperature:
Temp
Friction
Torque Transfer
Slip
Safe Zone
High Clutch Wear
Clutch Failure

4Feb 6, 2017Copyright © 2017 Mahindra & Mahindra Ltd. All rights reserved. India GT-SUITE Conference 2017, Pune
Impact of Clutch Temperature:
High Wear Rate
Source:Technical Handbook,Valeo TransmissionSystems.

5Feb 6, 2017Copyright © 2017 Mahindra & Mahindra Ltd. All rights reserved. India GT-SUITE Conference 2017, Pune
Objective:
Estimate temperature rise onclutch facing & clutch housing.
Optimize Clutch Design at an earlystage of Product Development inconjunction with supplier provideddata (facing temperature vs wearratio) for different clutch materials.
Objective & Scope of the Study
6Feb 6, 2017Copyright © 2017 Mahindra & Mahindra Ltd. All rights reserved. India GT-SUITE Conference 2017, Pune
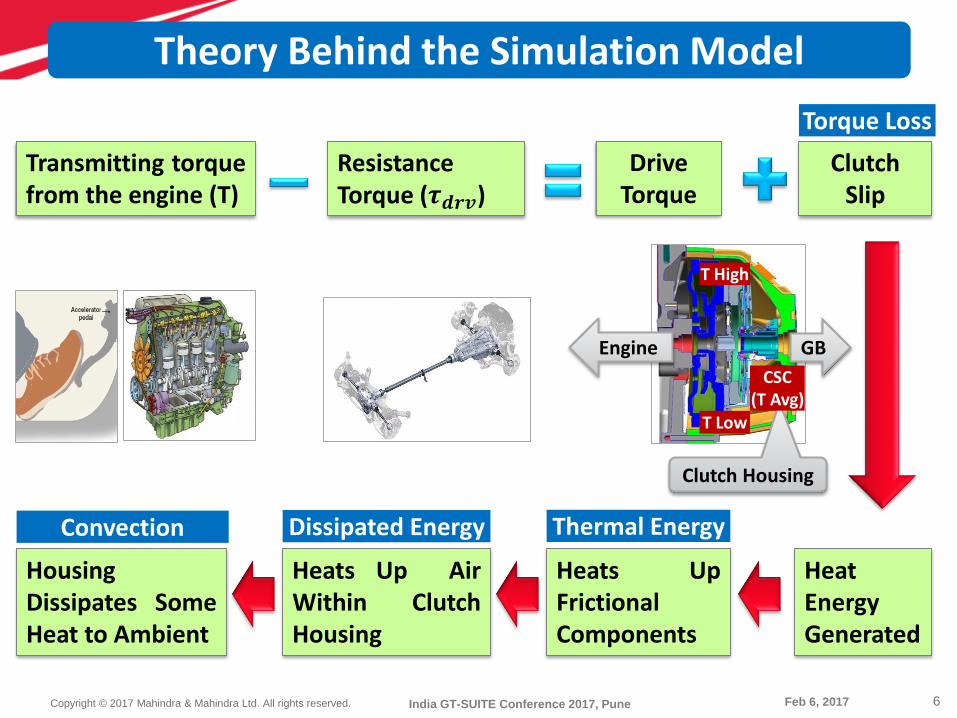
ResistanceTorque (𝝉𝒅𝒓𝒗)
Transmitting torquefrom the engine (T)
HeatEnergyGenerated
Heats UpFrictionalComponents
Heats Up AirWithin ClutchHousing
Thermal EnergyDissipated Energy
Theory Behind the Simulation Model
Clutch Slip
Drive Torque
HousingDissipates SomeHeat to Ambient
Convection
Torque Loss
Clutch Housing
GBEngine
CSC(T Avg)
T High
T Low

7Feb 6, 2017Copyright © 2017 Mahindra & Mahindra Ltd. All rights reserved. India GT-SUITE Conference 2017, Pune
𝐓. 𝐅𝐎𝐒 = 𝑵𝒇. 𝑹𝒎. µ. 𝑭𝒂LuGre Friction Model
This friction model is based on the
idea of intermeshing bristles that
transmit the friction load between
contacting bodies. The bristle
model captures micro slip and
also the drop in friction as the
sliding speed is increased.
Theory Behind the Simulation Model
T = Transmitting torque from the engine
FOS = Factor of safety is 1.3
𝑁𝑓 = Number of sliding surfaces
(Single clutch=2; Twin clutch=4)
𝑅𝑚 = Clutch mean or effective radius
µ = Friction coefficient of the clutch linings
𝐹𝑎 = Clamping load
Clamp Load – The load exerted by the diaphragm to clampthe clutch disc between pressure plate & flywheel
Step (1): The torque that a clutch can transfer from an engine isobtained by the equation below:

8Feb 6, 2017Copyright © 2017 Mahindra & Mahindra Ltd. All rights reserved. India GT-SUITE Conference 2017, Pune
𝝉𝒅𝒓𝒗
= 𝑰𝒕𝒓𝒂𝒏𝒔1 +𝑰𝒕𝒓𝒂𝒏𝒔2
𝑹𝒕2 +
𝑰𝒅𝒔𝒉
𝑹𝒕2 + +
𝑰𝒂𝒙𝒍
𝑹𝒅2𝑹𝒕
2 +𝑴𝒗𝒆𝒉𝒓𝒘𝒉𝒍
2
𝑹𝒅2𝑹𝒕
2
𝒅𝝎𝒅𝒓𝒗
𝒅𝒕
+𝑭𝒂𝒆𝒓 + 𝑭𝒓𝒐𝒍 + 𝑭𝒈𝒓𝒅
𝑹𝒅𝑹𝒕𝒓𝒘𝒉𝒍
Theory Behind the Simulation Model
𝝉𝒅𝒓𝒗 = Resistance torque
Itrans = Transmission inertia
Idsh = Driveshaft inertia
Iaxl = Axle inertia
Mveh = Vehicle mass
rwhl = Wheel dynamic rolling radius
𝑑𝜔𝑑𝑟𝑣 = Angular speed of input shaft
𝑅t = Transmission ratio
𝑅d = Final drive ratio
𝐹𝑎𝑒𝑟 = Aerodynamic resistance force
𝐹𝑟𝑜𝑙 = Rolling resistance force
𝐹𝑔𝑟𝑎𝑑 = Gradient resistance force
Step (2): Resistance torque generated by the driveline & vehicleduring vehicle launch is obtained by:

9Feb 6, 2017Copyright © 2017 Mahindra & Mahindra Ltd. All rights reserved. India GT-SUITE Conference 2017, Pune
Step (3): Clutch energy is calculated by using the below equation
𝑬 = 𝒕𝒊
𝒕𝒄
∆𝑻𝒕 . ∆ 𝝎𝒕 . 𝒅𝒕E = Clutch energy; ti = Initial temperature
tc = Critical temperature; ∆Tt = Torque range
∆ωt = Angular speed bet′n engine & gearbox
𝐷 = Outer diameter of clutch; d = Inner diameter of clutch 𝑷𝒐𝒘𝒆𝒓 =𝑬
𝒕
Theory Behind the Simulation Model
Due to clutch slip, heatenergy is generatedwhich increases theclutch facingtemperature.
The dissipated energyalso heats the air withinthe clutch housing, whichcan be measured easilyusing thermocouple.
Step (4): Clutch temperature is calc. by using thermal conductance
𝑻𝒉𝒆𝒓𝒎𝒂𝒍 𝑪𝒐𝒏𝒅𝒖𝒄𝒕𝒂𝒏𝒄𝒆 =𝑾
𝒎2 . 𝑲𝑨𝒓𝒆𝒂 =
𝝅 (𝑫2 − 𝒅2
4 . 𝑵𝒇

10Feb 6, 2017Copyright © 2017 Mahindra & Mahindra Ltd. All rights reserved. India GT-SUITE Conference 2017, Pune
Theory Behind the Simulation Model
𝑻𝒐𝒕𝒂𝒍 𝒗𝒐𝒍𝒖𝒎𝒆 𝒘𝒐𝒓𝒏 𝒐𝒇𝒇 𝒎𝒎3 = 𝑭𝒓𝒊𝒄𝒕𝒊𝒐𝒏 𝒆𝒏𝒆𝒓𝒈𝒚 𝒅𝒊𝒔𝒔𝒊𝒑𝒂𝒕𝒊𝒐𝒏 𝑴𝑱 .𝑾𝒆𝒂𝒓 𝒓𝒂𝒕𝒆𝒎𝒎3
𝑴𝑱
Step (5): Clutch wear is calculated by using the below equation:
Sample
11Feb 6, 2017Copyright © 2017 Mahindra & Mahindra Ltd. All rights reserved. India GT-SUITE Conference 2017, Pune
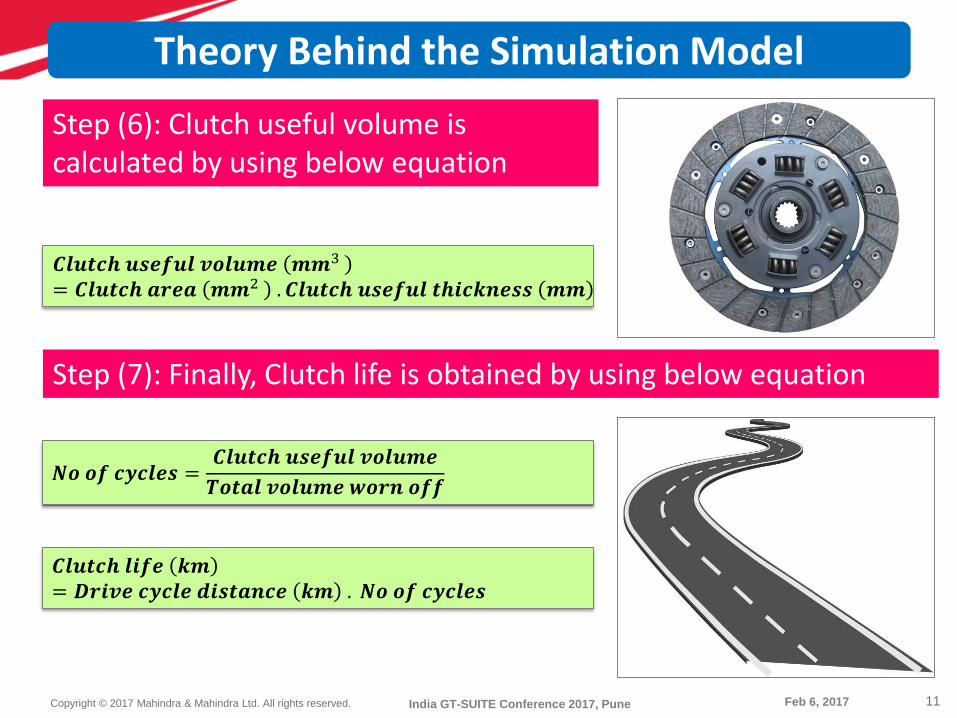
Step (7): Finally, Clutch life is obtained by using below equation
Theory Behind the Simulation Model
𝑵𝒐 𝒐𝒇 𝒄𝒚𝒄𝒍𝒆𝒔 =𝑪𝒍𝒖𝒕𝒄𝒉 𝒖𝒔𝒆𝒇𝒖𝒍 𝒗𝒐𝒍𝒖𝒎𝒆
𝑻𝒐𝒕𝒂𝒍 𝒗𝒐𝒍𝒖𝒎𝒆 𝒘𝒐𝒓𝒏 𝒐𝒇𝒇
𝑪𝒍𝒖𝒕𝒄𝒉 𝒍𝒊𝒇𝒆 𝒌𝒎= 𝑫𝒓𝒊𝒗𝒆 𝒄𝒚𝒄𝒍𝒆 𝒅𝒊𝒔𝒕𝒂𝒏𝒄𝒆 𝒌𝒎 . 𝑵𝒐 𝒐𝒇 𝒄𝒚𝒄𝒍𝒆𝒔
Step (6): Clutch useful volume is calculated by using below equation
𝑪𝒍𝒖𝒕𝒄𝒉 𝒖𝒔𝒆𝒇𝒖𝒍 𝒗𝒐𝒍𝒖𝒎𝒆 𝒎𝒎3
= 𝑪𝒍𝒖𝒕𝒄𝒉 𝒂𝒓𝒆𝒂 𝒎𝒎2 . 𝑪𝒍𝒖𝒕𝒄𝒉 𝒖𝒔𝒆𝒇𝒖𝒍 𝒕𝒉𝒊𝒄𝒌𝒏𝒆𝒔𝒔 𝒎𝒎

12Feb 6, 2017Copyright © 2017 Mahindra & Mahindra Ltd. All rights reserved. India GT-SUITE Conference 2017, Pune
Input Data Requirements

13Feb 6, 2017Copyright © 2017 Mahindra & Mahindra Ltd. All rights reserved. India GT-SUITE Conference 2017, Pune
Clutch Drive Cycle Input Data
• Drive cycle data (~27 km) was collected in Chennai city during peak traffic
• ~ 30 repeated launches in 1200 sec was observed (~1.2 km), which means every 40 sec/launch occurs.

14Feb 6, 2017Copyright © 2017 Mahindra & Mahindra Ltd. All rights reserved. India GT-SUITE Conference 2017, Pune
Clutch Thermal Simulation Model

15Feb 6, 2017Copyright © 2017 Mahindra & Mahindra Ltd. All rights reserved. India GT-SUITE Conference 2017, Pune
Clutch Thermal Simulation Model
Conduction
Clutch Housing Ambient
Convection
Convection

16Feb 6, 2017Copyright © 2017 Mahindra & Mahindra Ltd. All rights reserved. India GT-SUITE Conference 2017, Pune
Simulation Model

17Feb 6, 2017Copyright © 2017 Mahindra & Mahindra Ltd. All rights reserved. India GT-SUITE Conference 2017, Pune
Passenger Vehicle(SUV) was used fortesting.
The thermocouplewas inserted inClutch housing &temperature wasmeasured.
Test data collectionwas started oncethe air within theclutch housingreached 80 deg. C.
Vehicle Testing
Cross Section View of Clutch
Clutch Housing
GBEngine

18Feb 6, 2017Copyright © 2017 Mahindra & Mahindra Ltd. All rights reserved. India GT-SUITE Conference 2017, Pune
Vehicle/Engine Speed Comparisons

19Feb 6, 2017Copyright © 2017 Mahindra & Mahindra Ltd. All rights reserved. India GT-SUITE Conference 2017, Pune
Clutch Temperature Simulation Results
• Simulation model predicts both clutch facing and housingtemperatures
• Out of which the clutch housing temperature can be measuredeasily during testing

20Feb 6, 2017Copyright © 2017 Mahindra & Mahindra Ltd. All rights reserved. India GT-SUITE Conference 2017, Pune
Simulation Vs Test Results
• Clutch temperature simulation model shows an excellentcorrelation (> 90%) with the test results.
21Feb 6, 2017Copyright © 2017 Mahindra & Mahindra Ltd. All rights reserved. India GT-SUITE Conference 2017, Pune
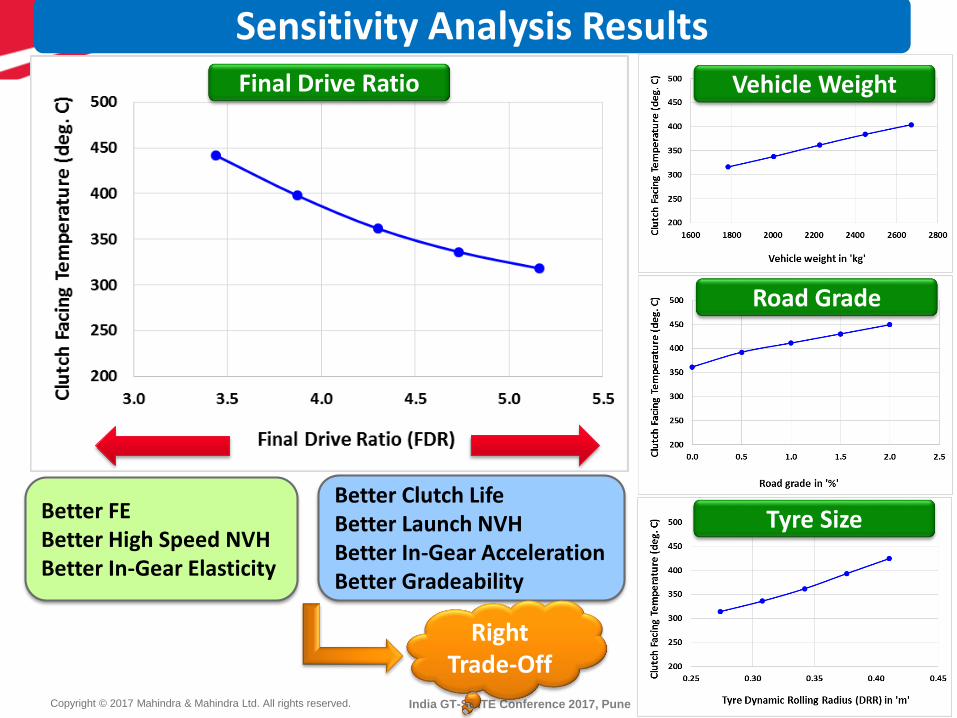
Final Drive Ratio
Tyre Size
Vehicle Weight
Road Grade
Sensitivity Analysis Results
Better Clutch LifeBetter Launch NVHBetter In-Gear AccelerationBetter Gradeability
Better FEBetter High Speed NVHBetter In-Gear Elasticity
Right Trade-Off
22Feb 6, 2017Copyright © 2017 Mahindra & Mahindra Ltd. All rights reserved. India GT-SUITE Conference 2017, Pune
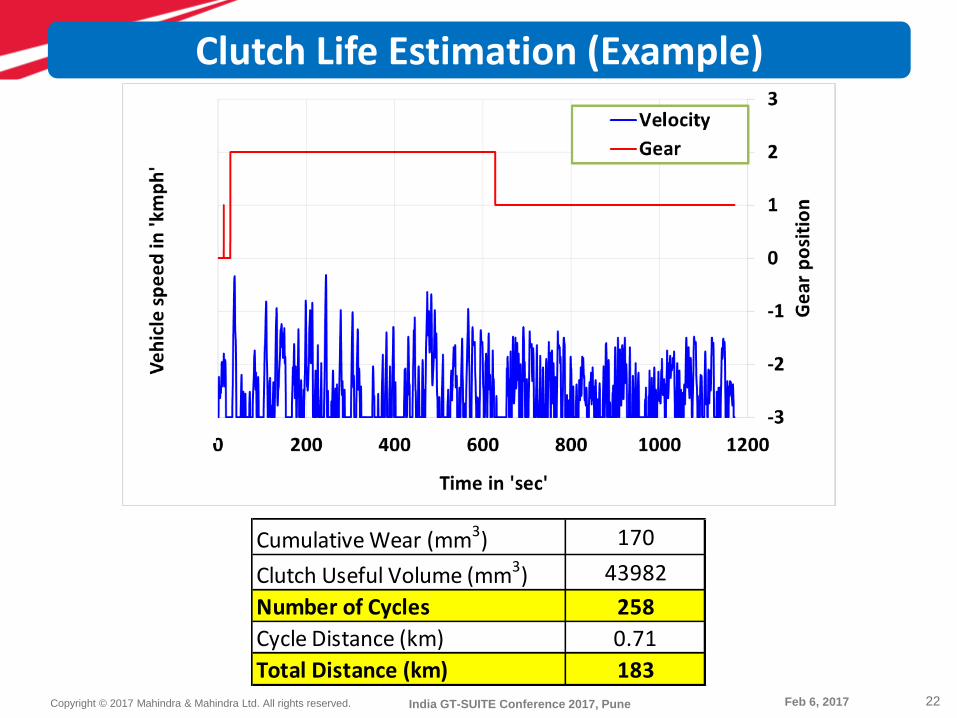
Clutch Life Estimation (Example)
Cumulative Wear (mm3) 170
Clutch Useful Volume (mm3) 43982
Number of Cycles 258
Cycle Distance (km) 0.71
Total Distance (km) 183

23Feb 6, 2017Copyright © 2017 Mahindra & Mahindra Ltd. All rights reserved. India GT-SUITE Conference 2017, Pune
Different Facing Material
Optimize the Target Performance based on
Benchmark
Optimize the Clutch Design
Applications

24Feb 6, 2017Copyright © 2017 Mahindra & Mahindra Ltd. All rights reserved. India GT-SUITE Conference 2017, Pune
Clutch overheating is the primary cause for clutch failure.
By using 1-D thermal modeling, clutch facing & housingtemperature are simulated.
Simulation results show an excellent correlation (> 90%)with the test data.
FDR has a huge impact on Clutch wear, FE, Drivability & NVH.Hence, doing a right trade-off is very critical at an earlydesign stage.
Conclusion
25Feb 6, 2017Copyright © 2017 Mahindra & Mahindra Ltd. All rights reserved. India GT-SUITE Conference 2017, Pune
T. K. Garrett, K. Newton & W. Steeds., The Motor Vehicle, 13th Edition, ISBN 07506-4449-4: 750-759, 2001.
Bosch Automotive Handbook, 6th Edition, SAE, Robert Bosch GmbH, ISBN 0-7680-1513-8, 2004.
Virendra Kumar, Gopal Sahu, Prakash, Ritesh, Shailendra, “Review on Wear Analysis of Different Types of Clutch Material,” International Journal of Research in Advent Technology, E-ISSN: 2321-9637, 2015.
Shaohua Sun, Yulong Lei, Yao Fu, Cheng Yang and ShunBo Li, “Analysis of Thermal Load for Dry Clutch under the Frequent Launching Condition,” SAE Technical Paper 2013-01-0814.
K.C. Lathiya, N.P. Badola, C.L. Unhad, B.D. Dhamecha, “A Literature Review on Failure in Single Plate Clutch System,” International Journal for Scientific Research & Development, ISSN: 2321-0613, 2014.
Technical Handbook, Valeo Transmission Systems.
GT-SUITE User Guide, GT-ISE v2016.
Ricardo Victorino Coelho, Tulio Gustavo Lima, “Clutch 430 Heavy Duty,” SAE Technical Paper 2011-36-0257.
References

26Feb 6, 2017Copyright © 2017 Mahindra & Mahindra Ltd. All rights reserved. India GT-SUITE Conference 2017, Pune
GT Support Team (North America) / ESI-Group (Pune)
Clutch Team
Engine Calibration Team
Acknowledgements

27Feb 6, 2017Copyright © 2017 Mahindra & Mahindra Ltd. All rights reserved. India GT-SUITE Conference 2017, Pune
Thank you for your attention !