mobile site impact on user engagement
TRANSCRIPT
1
{ }
2
Are you wrestling with the key decision of whether to invest in a mobile e-commerce website experience? This paper clearly outlines why the question you should be asking yourself is “When do we go mobile?” rather than “Should we go mobile?” To give you a sense of the reality vs mobile media hype, you’ll see a YOY Q2 comparison for mobile traffic trends. We’ll also present our in-depth research findings on mobile site adoption, conversions, AOVs and search advertising so you can see why all ecommerce businesses should consider mobile advertising regardless of their mobile experience. Plus, find strategic questions to help you evaluate whether investing in a mobile experience is the right move for your business, now and during the fiercely competitive Q4 holiday season.
3 Executive Summary
5 Mobile Traffic Growth
6 Traffic Share by Device Category
6 Law of Small Numbers in Mobile Investment Scenario
8 Paid Traffic Share by Device Category
9 Mobile Conversion Rates
11 Paid Traffic Conversion Rates
12 AOV Trends
12 AOV vs Conversion Rates
12 AOV by Device Category
13 Paid Traffic AOV by Device Category
13 Mobile Search Advertising
14 Mobile Friendly Site Adoption
15 Mobile Friendly User Experience - a Competitive Necessity
15 Strategic Questions for E-commerce Sites with Non-Mobile Friendly User Experience

3
“Mobile” has been a buzz word in ecommerce marketing for the past several years as the Google
Trends graphs below clearly indicate.
Figure 1 Google Trends for "mobile"
Figure 2 Google Trends for "cross device"
It’s understandable for marketers and senior executives to become enamored with the buzz when
you read statistics like these:
U.S. adults now spend more time on the Internet on smartphones than on PCs, research
giant Nielsen finds.
87% of smartphone and/or tablet owners use their devices to shop.
Americans use on average 3+ devices to access the web …53% of digital media time on
mobile devices1.
Mobile e-commerce grew 50% year-over-year.
Mobile accounted for more than one in four US e-commerce orders this holiday season
[2013].
Tablet/smartphone share of e-commerce orders grew from 8% in 2012 to 11% in 2013.
iOS devices made up 83% of mobile e-commerce sales.
65% of marketing emails were opened on mobile devices during Q4 2013.
More than half of Amazon customers shopped using a mobile device this holiday2.
However, some clients are wrestling with whether to invest in mobile, and we wanted to get a
sense of the reality vs the buzz.
1 MASTER CROSS-DEVICE ADVERTISING IN ABOUT 10 MINUTES – Conversant whitepaper, 2014 2 MERCHANT SURVEY 2014 – the e-tailing group
4
So we did a Q2 YOY comparison of mobile traffic trends based on a sample of our client base. The
sampling rate was 33% and the data set included hundreds of millions of sessions.
After analyzing the data, the key question for ecommerce sites that don’t have a mobile-friendly
user experience should be “When do we go mobile?” not “Should we go mobile?”
Here’s why:
1. Mobile friendly user experience improves mobile conversion rates.
2. Mobile friendly user experiences appear to “cure” AOV degradation.
3. Paid Search Mobile traffic converts at significantly higher rates than other Mobile traffic.
4. 4 out of 10 sites have mobile-friendly user sites, with almost half already planning the next
evolution of their mobile experience.
Read on for more critical research findings as well as for the strategic questions retailers should be
considering to help guide their initial mobile investment decisions.

5
Mobile is clearly the fastest growing segment of web traffic as the data from statcounter and our
client sample indicates. However, our data and other published benchmarks suggest that part of
this phenomenon is the law of small numbers.
Figure 3 Based on Page views - statcounter.com
Figure 4 Session Based, NetElixir Client Sample

6
When you look at the traffic share by device in Figure 5, you see
the law of small numbers in action.
Figure 5 Session Based, NetElixir Client Sample
In Q2, mobile traffic was less than 10%, while non-desktop (smartphones + tablets) totaled 29% of
visits.
While the 9% mobile traffic share was almost double the previous year, when making your mobile
investment decisions, you need to understand the potential impact on your business. After all, it’s
about the math.
Mobile traffic share varies from
6% to 27% of all traffic.

7
Let’s say you are deciding whether it is more profitable to invest in desktop or non-desktop
medium, and your session share is similar to the Q2 mix for our client sample (See column 1
below). And let’s assume that investing in desktop will increase conversion rates by 10%. In order
for a non-desktop investment to have the same impact, your conversion rate would have to
increase by approximately 42%. If you look at mobile only, conversions would have to almost
double (188% increase) to match the expected purchase lift the 10% increase in desktop
conversions provides.
session
share conv rate
xaction
index
new conv
rate
new
xaction
index
change in
xactions
chg in
conv rate
desktop 62% 5.41% 33 6.0% 37 3.34 10%
mobile 9% 2.02% 2 5.8% 5 3.34 188%
non dt 38% 2.11% 8 3.0% 11 3.34 42%
Table 1 – Conversion Rate Impact Comparison
A real-life example of this small-numbers phenomenon saw one firm show an 86% increase in
mobile conversion rates and a 23% gain in mobile visitors. These are substantial increases, yet
mobile revenue only constituted slightly more than 1% of total income. For the entire dataset,
mobile revenue average contribution was just 4% and ranged from .01% to 14%.

8
Mobile plays a more important role in Paid Traffic than
sitewide traffic, as Q2 saw 15% of paid visits from
mobile devices.
Figure 6 Paid Search Sessions by Device Category
Given that this statistic greatly depends on mobile advertising strategy, the range varies
dramatically, with the lowest contribution to Paid Traffic at 2.3% and the maximum at 24.6%.
Interestingly, the percentage of Mobile Paid Traffic did not vary dramatically for clients with a
mobile-friendly experience vs. those without. By mobile friendly, we mean either a dedicated
mobile site (i.e. m.domainname.com or domainname.com/mobile/) or a responsive design site.
Mobile traffic is more important in the
Paid Search segment, regardless of the
mobile-friendly experience.

9
Here are the conversion rates by device for the YOY Q2 period.
All Accounts Mobile Friendly
Accounts
Accounts
Without Mobile
Friendly Sites
2014 2013 2014 2013 2014 2013
All Traffic 4.04 3.62 4.47 3.95 1.61 1.68
Desktop 5.41 4.58 6.22 5.22 2.16 2.07
Mobile 2.02 1.42 2.67 1.91 .37 .25
Tablet 2.19 1.95 2.54 2.19 1.1 1.09
Table 2 Conversion Rates by Device Category
Mobile’s conversion rate growth of 42% YOY was by
far the fastest. In addition, our dataset shows a
conversion rate for mobile-friendly sites of 2.67%,
which is over 7x greater than accounts without mobile-friendly experiences.
We do have to apply the caveat that comparing conversion rates is always tricky because it’s
virtually impossible to create 2 segments of identical businesses.
In order to control for these business differences, we indexed the conversion rates to the overall
sitewide conversion rate. The data showed that businesses with a mobile-friendly experience had
a mobile conversion rate of 60%, while those without only had a 23% mobile conversion rate.
In addition, the conversion rates for mobile friendly sites improved YOY for both the absolute
number and indexed to the sitewide rates.
This clearly shows the type of impact a mobile-friendly user experience can have towards
converting mobile users.
Even with mobile friendly experiences,
conversion rates of non-PC users remain
far short of PC users.

10
All Accounts Mobile Friendly Non-Mobile Friendly
2014 2013 2014 2013 2014 2013
all traffic 100% 100% 100% 100% 100% 100%
desktop 134% 127% 139% 132% 134% 123%
mobile 50% 39% 60% 48% 23% 15%
tablet 54% 54% 57% 55% 68% 65%
Table 3 Conversion Rates by Device Category Indexed to Total Conversion Rate
If we go a step further and revisit our point earlier about the
timing of mobile investments, the data shows that the
business with non-mobile friendly sites would have seen a
5.2% increase in revenue if they had implemented a mobile
friendly experience. We used the indexed value ratio of 2.6 to
increase the conversion rate from .37% to .97% and held AOV and sessions constant.
Sites without a mobile friendly
experience could have increased
Q2 revenue by 5% with a mobile
friendly site.
11
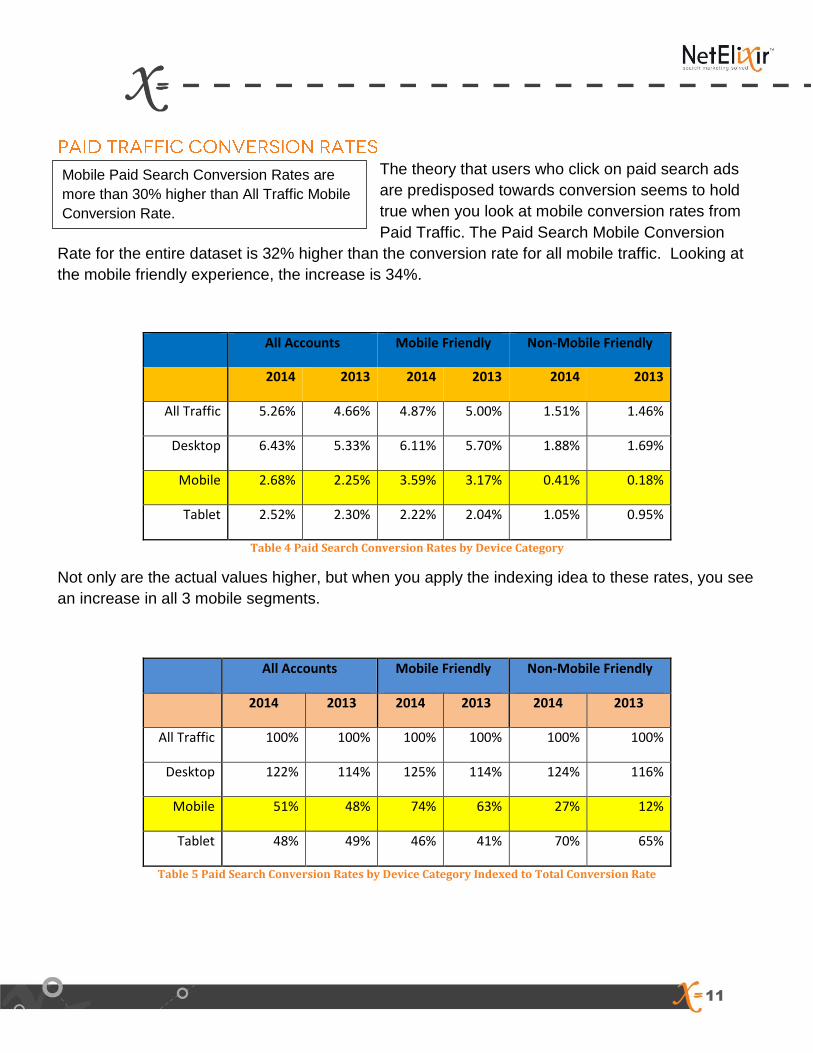
The theory that users who click on paid search ads
are predisposed towards conversion seems to hold
true when you look at mobile conversion rates from
Paid Traffic. The Paid Search Mobile Conversion
Rate for the entire dataset is 32% higher than the conversion rate for all mobile traffic. Looking at
the mobile friendly experience, the increase is 34%.
All Accounts Mobile Friendly Non-Mobile Friendly
2014 2013 2014 2013 2014 2013
All Traffic 5.26% 4.66% 4.87% 5.00% 1.51% 1.46%
Desktop 6.43% 5.33% 6.11% 5.70% 1.88% 1.69%
Mobile 2.68% 2.25% 3.59% 3.17% 0.41% 0.18%
Tablet 2.52% 2.30% 2.22% 2.04% 1.05% 0.95%
Table 4 Paid Search Conversion Rates by Device Category
Not only are the actual values higher, but when you apply the indexing idea to these rates, you see
an increase in all 3 mobile segments.
All Accounts Mobile Friendly Non-Mobile Friendly
2014 2013 2014 2013 2014 2013
All Traffic 100% 100% 100% 100% 100% 100%
Desktop 122% 114% 125% 114% 124% 116%
Mobile 51% 48% 74% 63% 27% 12%
Tablet 48% 49% 46% 41% 70% 65%
Table 5 Paid Search Conversion Rates by Device Category Indexed to Total Conversion Rate
Mobile Paid Search Conversion Rates are
more than 30% higher than All Traffic Mobile
Conversion Rate.

12
One hypothesis we had going into this study was that
there is a negative correlation between average order
value and conversion rates. The theory being that
higher average order values reflect more considered
and lengthy purchase decisions. This theory was partially validated, as the correlation factor for all
visits and AOV was fairly strong at -.25. Not surprisingly, for mobile traffic, the correlation was
stronger at -.44. The AOV in our dataset ranged from $29 to $573.
However, when we removed the outlier $573 AOV site from the mix, the maximum AOV drops all
the way to $215. As you might anticipate, the correlation between AOV and conversion rate
deteriorated. For all traffic, the factor was -.05, which is still the negative correlation you might
expect, but considerably weaker. What was interesting to note is that the mobile traffic’s
correlation factor was still fairly strong at -.39. So one possible conclusion is that businesses that
sell more expensive, highly considered purchases have additional challenges when it comes to
making users comfortable pulling the conversion trigger on a mobile device.
When you compare AOVs by device, our data indicates
that having a mobile friendly experience can achieve
AOV levels that are just as good as or even slightly
higher than desktop shoppers. In addition, non-mobile
friendly sites appear to have a negative impact on the
basket size of mobile shoppers.
Q2 2014 Mobile Friendly Non-Mobile Friendly
All Traffic $70 $145
Desktop $72 $147
Mobile $73 $103
Tablet $53 $137
Table 6 Average Order Value (AOV) by Device Category
Sites selling bigger ticket purchase items
have more difficult challenges converting
mobile visitors.
Mobile friendly user experiences appear
to pose a cure for AOV degradation
among mobile users.
13
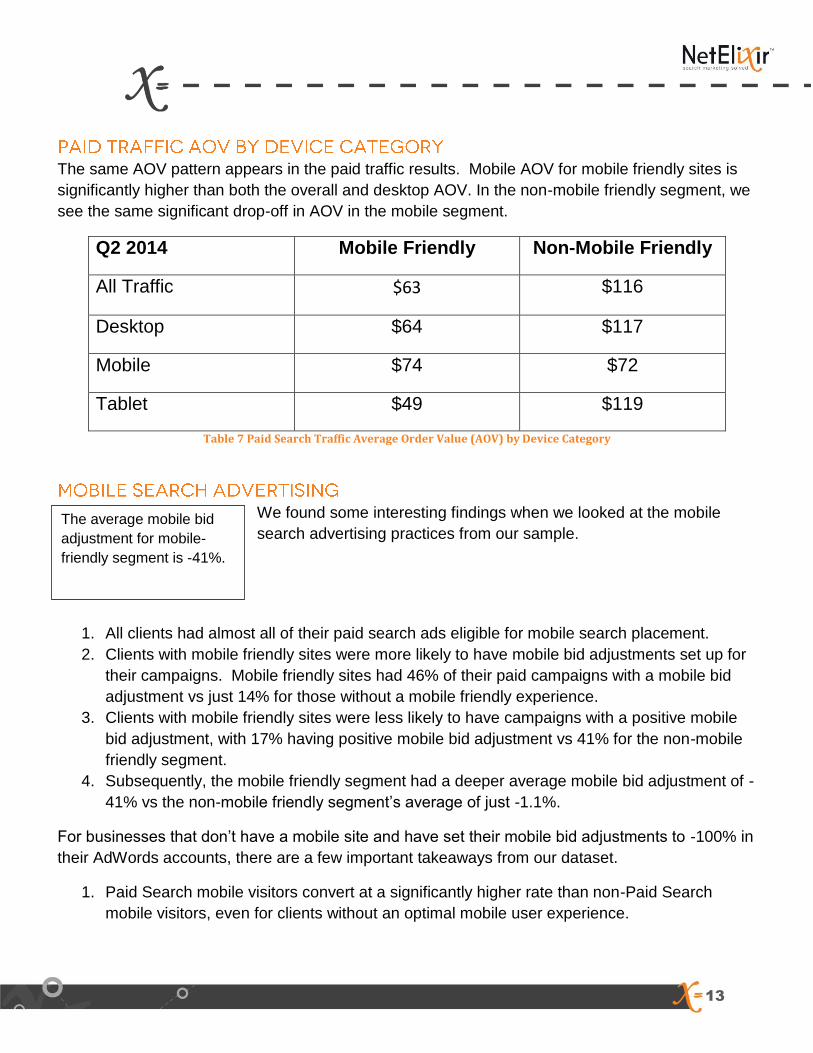
The same AOV pattern appears in the paid traffic results. Mobile AOV for mobile friendly sites is
significantly higher than both the overall and desktop AOV. In the non-mobile friendly segment, we
see the same significant drop-off in AOV in the mobile segment.
Q2 2014 Mobile Friendly Non-Mobile Friendly
All Traffic $63 $116
Desktop $64 $117
Mobile $74 $72
Tablet $49 $119
Table 7 Paid Search Traffic Average Order Value (AOV) by Device Category
We found some interesting findings when we looked at the mobile
search advertising practices from our sample.
1. All clients had almost all of their paid search ads eligible for mobile search placement.
2. Clients with mobile friendly sites were more likely to have mobile bid adjustments set up for
their campaigns. Mobile friendly sites had 46% of their paid campaigns with a mobile bid
adjustment vs just 14% for those without a mobile friendly experience.
3. Clients with mobile friendly sites were less likely to have campaigns with a positive mobile
bid adjustment, with 17% having positive mobile bid adjustment vs 41% for the non-mobile
friendly segment.
4. Subsequently, the mobile friendly segment had a deeper average mobile bid adjustment of -
41% vs the non-mobile friendly segment’s average of just -1.1%.
For businesses that don’t have a mobile site and have set their mobile bid adjustments to -100% in
their AdWords accounts, there are a few important takeaways from our dataset.
1. Paid Search mobile visitors convert at a significantly higher rate than non-Paid Search
mobile visitors, even for clients without an optimal mobile user experience.
The average mobile bid
adjustment for mobile-
friendly segment is -41%.
14
2. When considering the timing and investment level to either launch a dedicated mobile site
or a responsive design site, don’t forget to consider the incremental growth enabling mobile
search advertising can deliver. In our data set, the maximum contribution to Q2 revenue
that mobile paid search traffic contributed was 9% while the average was 3%.
3. If your current mobile AOV falls short of your sitewide AOV, like our non-mobile friendly
segment experiences, make sure to consider the possible AOV lift you may get in that
segment from implementing a more friendly experience.
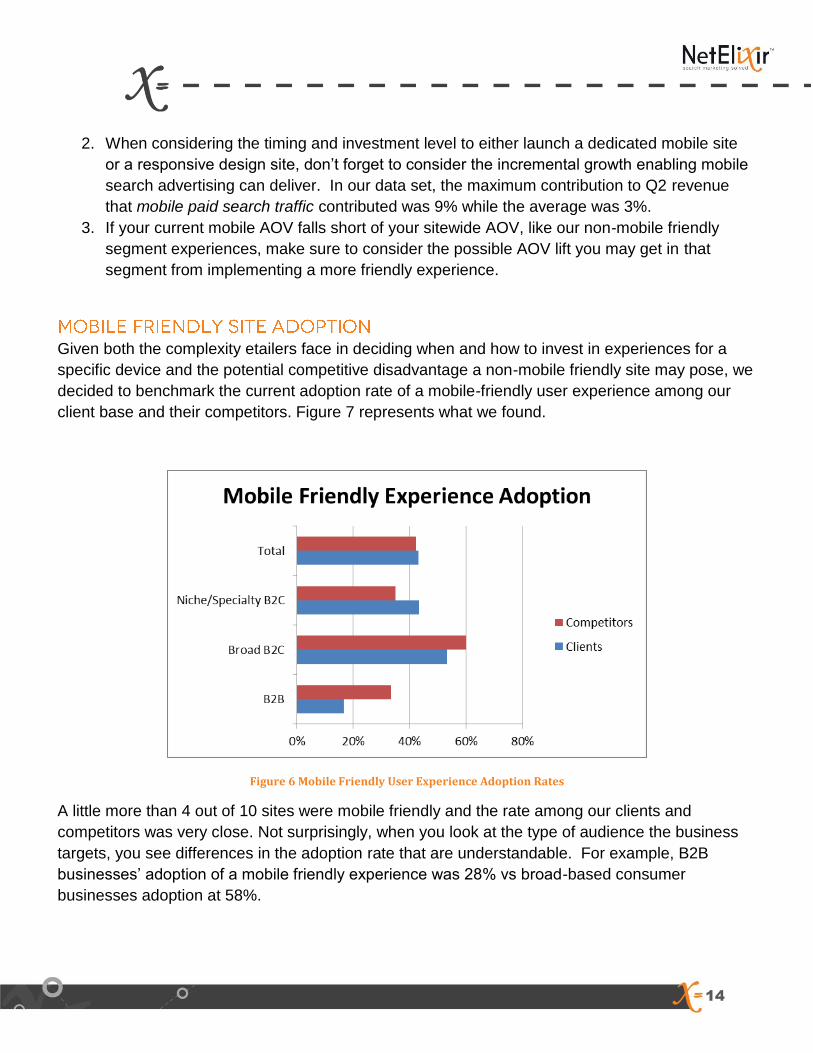
Given both the complexity etailers face in deciding when and how to invest in experiences for a
specific device and the potential competitive disadvantage a non-mobile friendly site may pose, we
decided to benchmark the current adoption rate of a mobile-friendly user experience among our
client base and their competitors. Figure 7 represents what we found.
Figure 6 Mobile Friendly User Experience Adoption Rates
A little more than 4 out of 10 sites were mobile friendly and the rate among our clients and
competitors was very close. Not surprisingly, when you look at the type of audience the business
targets, you see differences in the adoption rate that are understandable. For example, B2B
businesses’ adoption of a mobile friendly experience was 28% vs broad-based consumer
businesses adoption at 58%.

15
Long term, we don’t think etailers (B2C particularly) can survive without a mobile-friendly user
experience. For those businesses that don’t have a mobile friendly site, it’s a question of “when”
rather than “if”.
In fact, the complexity of non-PC browsing behavior threatens to distort the competitive landscape
the Internet has represented for the past 15 years or so. In the past, small, start-up players could
compete with deep-pocketed brands by having a better site experience and SEO. Now, it is clear
that companies with deep pockets have a potential advantage because of their ability to fund
smartphone-specific user experiences, tablet-specific user experiences, and PC-specific
experiences.
Here are a few questions to consider when planning the timing of your mobile website investment.
How important are non-PC users to your traffic and what are the various trends? How does your mobile conversion rate and AOV compare to your desktop rate? How important is mobile to your industry? How many of your competitors have mobile presences already?
Can you launch a fully functional mobile user experience in time for the holidays? o If not, can you deliver limited functionality that addresses most common tasks your
mobile users are performing on your site? o Can services like mshopper or shopify help you get to a mobile site faster?
Are there opportunities to increase conversions among PC or tablet users that could have a more profitable impact or are easier to implement?i
Studies show the majority of people prefer mobile apps over mobile web browsing, especially
when they have an established relationship with the brand. But…
Is a mobile app a faster time-to-market option? Is the nature of your business better suited to having a mobile app? Are the majority of your Q4 customers repeat customers? Do you get a lot of one-time, gift type purchases during Q4?

16
Call NetElixir at 609-356-5112 or visit www.netelixir.com
Follow us on Twitter @NetElixir
For over 10 years, NetElixir has been helping hundreds of online retailers succeed in their search
marketing efforts. Our services cover PPC management, SEO, Product Listing Ads & CSEs,
Mobile Advertising, Social Media Marketing, Web Analytics and Google Analytics Consulting.
NetElixir University is our complimentary educational program that provides businesses with
proven strategies and analytical tools for running successful search marketing campaigns.
Through webinars, workshops and data-driven whitepapers, our goal is to train 10,000 businesses
on the best practices of search marketing.
© NetElixir 2014 All Rights Reserved
i At etail east, one of the keynotes started with the speaker demonstrating how a particular etailer’s product detail pages did not
work with his iPad in the same way it worked from a PC.