mnroad testing protocols volume 1 - minnesota …dotapp7.dot.state.mn.us/research/pdf/199722.pdf ·...
TRANSCRIPT
Number 97-22
L4 nA

---
---
----
----
Techniicall R e p rt Docurrnentation PaggI---,. ---.----.. ---.-.-I.-,."._- ,
1. Report No. 13. Recipienl's Acmsion No.
MdROAD TESTING PROTOCOLS -- VO~.I
.---I---------..
7. Author(s)
George Cochran, et.al.
9. Perfoiming Organization Name anti Address
Office,of Minnesota Road Research 1400 Gervais Avenue Mapkwood, MN 55 109
12. Sponsoring Organization Name aid Addrcss
Minnesota Department of Transportation 395 John Ireland Boulevard Mail Stop 330 St. Paul, Minnesota 55 155
16.Abstlact (Limit: 200 words)
t---..-.--.,,-..,.--- ,-
8. Pt:lftmning Organization Rt:port No.
~ ._
10. I'rojectn"ask/Work Unit No.
11. Coiimct (C) or Grant (G)No.
'This report presents a series of testing protocols used at the Minnesota Road Research Project QMn/ROAI3), the Minnesota Department of Transportation's (MdDOT) pavemt:nt testing facility. 'Ibis reporl helps establish a history of the tests conducted and testing procedures, and alrm serves as a reference for researchers outsidle of'M d 3 0 T to compare the values found in independent or cooperative stiidies to MnROAD test results ilnd procedures.
'The following protocols are included: 0 pavement condition testing plan and testing protocols 'b deflection test protocols 1' subsurface temperature testing protoc:ols 1' frozen soil measurements testung protocols 1' traffiicmeasurements testing protocob; 0 mate.riall samples testing protocols 0 soil moisture measurements testing protocols 0 climilte data testing protocols 0 bituminous testing protocols. .---17. Document halysis/Descriptors
1LldRom pavement testing testing protocols
I---,
19. Security Class (this report)
Unclassified IJnclassified
,.- -18. AvailabilifyStatement
NCPrestricliowns. Document available from: National 'l'edinical In�ormatiomiServices, Springfield,Virginia 22161 -
,---I-


Voluime 1.
Interim Report 1993 to 1996
Prepared by:
George Cochran Dave Palmquist .fohn Sieluneier Greg Johnson Tom Bumham Craig Sclhrader Ruth Rotxrson
Clffice of Minnesota Road Research 1400 Gervais Avenue
Maplewood, IVIN 55 109
Dr. David Newcomb
Uiiiiversity of Minnesota Department of Civil Engineering 500 Plllsbury Drive SI'I
Minneapolis, IMV 55455
December 1997
Published by:
Minxiesota llepartrnent of Translportatitrn Clffice of Research Administration
Mail Stop 300 395 John I[reland Boulevard
St. Paul, MN 55155
The opinions, findings, and conclasions expressed in this publication an: tlhose of the authors and do not necessarily represeut those of the Minnesota Department #of'Transportation.


‘Theauthors would like to acknowledge the help of Jennifer Taylor of 1he Minnesota Department
of Transportation’s Ofice of Materials and Road Research, and the staff of the Minnesota
Delpartrent of Transportation’s Office of Research Administratitwirl, whose work was ins1rumental
in the publication of this report.


CONTENTS
TITLE PAGE
INTRODUCTION . . . . . . . . . . . . . . . . . . . . . . . . . . . . . . . . . . . . . . . . . . . . . . . . . . . 1
lPAWzILIENTCONDITIIO-NTESTING PI.,AN AND TEiSTING E'RO'I"OCO1,S . . . . . . . 3
:DEFI,ECTION TEST :PROTOCOLS . . . . . . . . . . . . . . . . . . . . . . . . . . . . . . . . . . . . . . . 5
Flexible Pavement Sections . . . . . . . . . . . . . . . . . . . . . . . . . . . . . . . . . . . . . . . . . 6
RigidSection!; . . . . . . . . . . . . . . . . . . . . . . . . . . . . . . . . . . . . . . . . . . . . . . . . . . . 8
Calibration . . . . . . . . . . . . . . . . . . . . . . . . . . . . . . . . . . . . . . . . . . . . . . . . . . . . . 11
References . . . . . . . . . . . . . . . . . . . . . . . . . . . . . . . . . . . . . . . . . . . . . . . . . . . . . . 12
SLJBSIJRFACE TENPEILATLI~RETESTI-NGP:WOTOC:OI,S . . . . . . . . . . . . . . . . . . . . 15
FR.OZEN SOIL MEASUREMENTS TESTING PROTOCOLS . . . . . . . . . . . . . . . . . . . 19
TRIAITIC MEASURIEMEIVTS TES'TI:NGPROTOCOL,$ . . . . . . . . . . . . . . . . . . . . . . . 21
FieldTesting . . . . . . . . . . . . . . . . . . . . . . . . . . . . . . . . . . . . . . . . . . . . . . . . . . . . . 22
OfficeProcedures . . . . . . . . . . . . . . . . . . . . . . . . . . . . . . . . . . . . . . . . . . . . . . . 22
MATERIAL SAMPL,ES 'TES'TING PIROTOCOLS . . . . . . . . . . . . . . . . . . . . . . . . . . . . . 25
SoilsTests . . . . . . . . . . . . . . . . . . . . . . . . . . . . . . . . . . . . . . . . . . . . . . . . . . . . . 26
Concrete Tests . . . . . . . . . . . . . . . . . . . . . . . . . . . . . . . . . . . . . . . . . . . . . . . . . . . 27
Plate Bearing Tests . . . . . . . . . . . . . . . . . . . . . . . . . . . . . . . . . . . . . . . . . . . . . . 29
SOIL MOISTURE MEASVTREIWENTS TESTING PROTOCZO:I,S . . . . . . . . . . . . . . . 31
CL,IMATE DATA TIIiSTING PROTOCOLS . . . . . . . . . . . . . . . . . . . . . . . . . . . . . . . . . 35
HITUMINOU S TESTING PRIITOCOLS . . . . . . . . . . . . . . . . . . . . . . . . . . . . . . . . . . . . 37
i


WROAII Testing Protocols - Volrnrne 1
IntrocfuctioII
The Minnesota Department of Transportation (MnDO'T) is in tlne process of' compiling a list of
testing protocols used ai the Minnesola Road Research Prlaject ('Mn/ln/lr<OAD) There art: two main
reasons that this is being done
The first, is to establish a history so there i s a reference of exactly cvhrch iests were conducted and
%hat testing procedures were used The second, is to serve as a r.elerc:nce for researchers outside
of M[n/DOT to compare the values found irr independent or cooperative studies to MdROAD tesl
results and procedures
It is important to do this now because it will be more diffificult to do with the passage of time.
TJltimately what we will have ir; a list of every kind of test c:onduc;tc:d, either in the field or the
laboratory, and a refkrence for that testing procrdure.
George Cochran Manager, Physical Research Section Office of Minnesota Road P,esearc;h
I


Pavement Condition ‘I’estiixrg,
David E’almquist
Mn/MOAD conducts a variety sfstandard tests l o monitor the condition of the pavement. These
tests include. ride performance, crack maps and dlistress surveys, trmsverse profiles arid iut
depths, faulting, and Giction tt:r;ts. These tests are done iIt various t rmm throughout the year.
David IDalmquist Office (sfMinnesota Road Research
1400 Gervais Avenue Maplewood, MN 55109
(6 12)7’79-5507 [email protected]
-- --
---
----
--
--
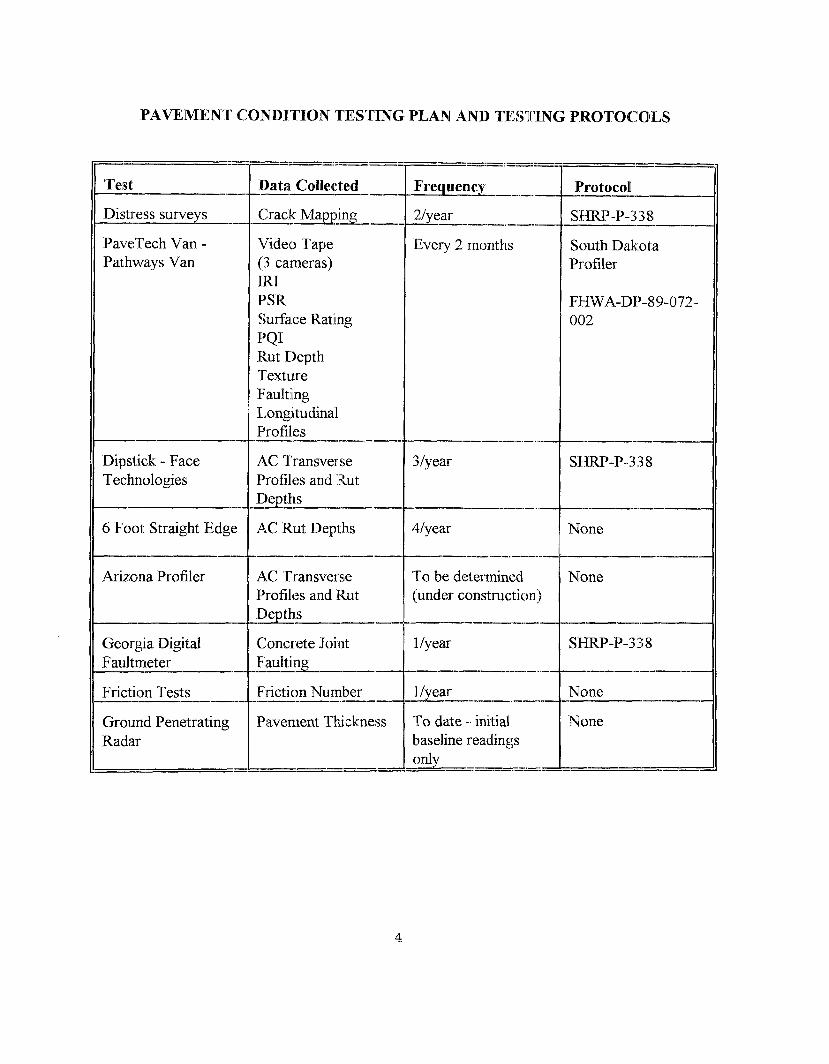
PAVEMENT ~C:ONDITIOI\TTESTING PLAN AND TEi311”1NGPROTOCOILS
-----_.I__ ~----.
Data Collecrrted
/I Distress surveys Crack Mapping... 11 PaveTech Van - Video Tape
(3 carneras) 1RI E’SR Surface Katiing I’Q1 Rut Depth Texture FauXting L,ongitudinal Profiles _...- - ~ -
--. 2lvear
South Dakota Profiler
FFlWA-DIP-89-072-002
I Dipstick - Face Technologies
6 Fool: Straight Edge
Arizona Profiler AC ‘Transverse Profiles and Rut
I F - - 11 Georgia Digital Concrete Joitrt11 Faultmeter ,.--.
Friction Friction Number I-‘Tests - _ - I ~ _ .
Ground Penetrating Radar
SIIRP-P-338
None
‘To be determined None (under construction)
I-
SWRP-P-31%8
None-----.-.--
-None
.._--.I-..---. - ---I_--.--..-. ”_
4

Ikflectioxi Tests - Falling Weight Deflecrtorneter
Illavid Van Deusea
In many current pavement management and I esearch programs bea jxig capacity is determined using
a falling weight deflea om1::ter (IFUVD). The deflection data from this cam k9e used to obtain information
regarding the relative strlmgths of the various layers within the 15 t~-ucture.Testing that is clone over
the course of seasonal periods can bt: used to track changes in layex strength These data are an
essential part of the developmenl of mechanistic design procedure, wkiic:h is om.: of the primary goals
of the ILlinnesota Road R.eseart:h Project ( M O A D ) .
FTVD testing at MdROAI:) has treen conducted during different stages of construction: (embankment
(subgrade), granular and/or stabilized base, and finished pavemerr~surface construction Since the
pavement surface layers have been constructed the emphasis is.
i ) the determination of seasonal changes anal spatial variability O E pavement strength, and
2) specific research studies on dynamic sensor response, 1emptmture efyects on dcflection and
response, and localized fiilures
David Van Deusen Offict: ofMinnesota Road Research
1400 Gerviis Avenue Maplewood, MN 5 5 109
(6 X 2)7’79-55 14 [email protected]
John Siekmeier Office of IVliwmesota Road Research
I400 Gervaiis Avenue Mlaplewood, MN 55 109
(6 12)7’79-5299 [email protected]

TEtl$l'INQ;PROTOCOL - MM/ROAD IDEFLEC'II'IOWTEST
TYP'ES 0 1 7 TESTING
Routine or Inventoiry
Tests are conducted at pre-defined locations wiihin each test seclion 'These are points that have
been tested numerous i imes evcry yeair since prior to construction.
Specific Sensor Tesiing
'The I W D is positioncd aver a specific: sensor. Data from the sensor is collected simultaneously
using one of the mobrile data acquisition systems The deflection data can be used to estimate the
particular response that the sensor i s measuring The objectives d t lh i r r type oftest are to (1)
determine how an indiviidwal sensor is performing and (2) track pawrnient response changes along
with pavement structurall changes
Tempeirature Effects Testing
These tests are done throughout the course of a day in such a way i.lisnl, data from specific test
points are collected a1 difrerent temperatures.
Special Research Studies
Examples are the Load Response and the Curl and Warp projects a.mently being conducted by
the University of Minnesota, Department of Civil Engineering. The FVVD testing is done at
specific: times and locatiorrs and serves as either the main focus or supporting data for the study.
FLEXBLE PAWMlENS' SECTIONS
'Thetesting protocol for routine inventory tests is similar to the L'I'PP FW testing protocol ( I ) with
a few exceptions as noied in this document Routine FWD testing on the M f l O A D flexible sections
consists of deflection testing at 10 stations spaced at 50-foot intervals Four different transverse
offsets fiom the centerhe are tested. The FWD data files contairi dala fi-omthe 10 statioris along a
given longitudinal offset 'These c;enterliline ofFsets are:
Mainline, -9.8 fed, offset code I , driving lane, outer wheel. track,
6
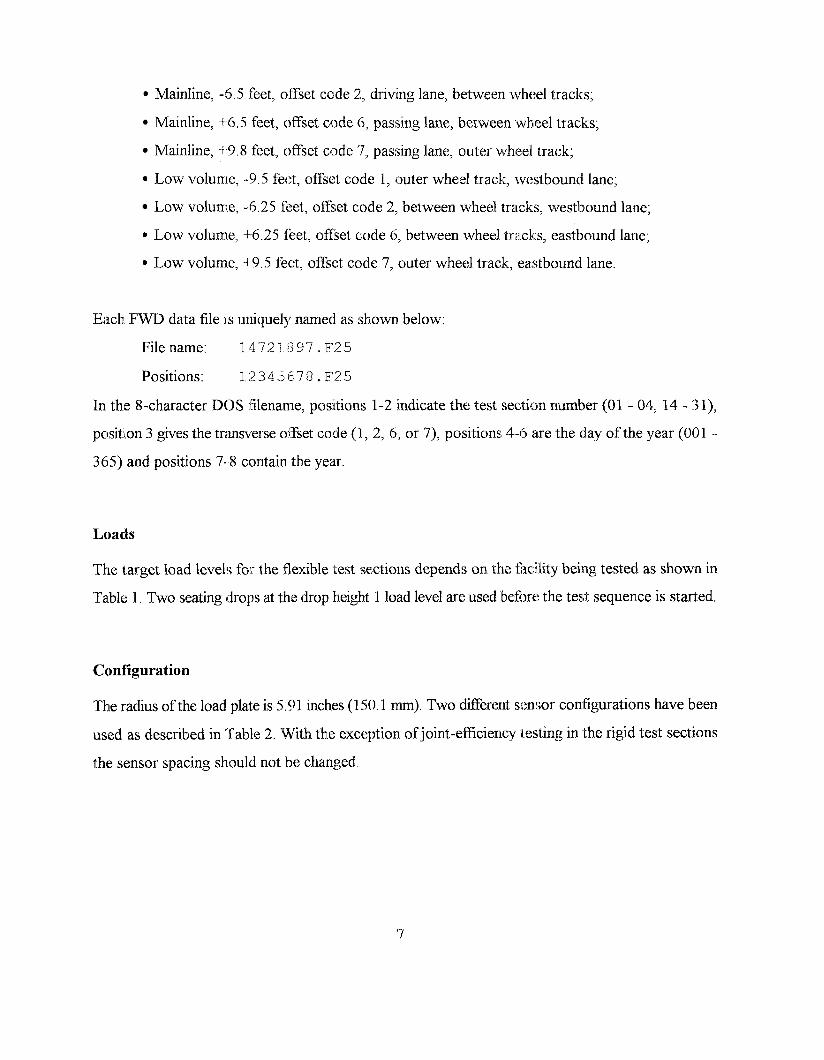
Mainline, -6.5 feet, &set code 2, driving lane, betwetxi wheel tracks;
Mainline, .-f-6.5feet, offset,code 6 , passing lane, betwee,nwheel tracks;
Mainline, 1.9.8fi:et, offset code '7, passing lane, outer wheel track;
Low volume, -9.5 feet, offset code 1, outer wheel track, westbound lane;
Low volume, ,-6.25 fket, oEset code 2, between wheel tracks;, westbound lane;
Low volume, -1-6.25fket, off%etcode 6, between wheel trma.cks,eastbound lane; .Low volume, 4-9.5feet, offset code 7, outer wheel!track, eastbound lane.
Eizch FWD data file i s uniquely named as shown below:
File name: 14 '7 2:l. 8 97 ,. F2 5
Positions: 12345678 F25
In the 8-character DOS filename, pasntions 1-2 indicate the test section number (01 - 04, 14 - 3 1 ) ,
position 3 gives the transverse oJ3Fset code ( I , 2, 6, or 7), positions 4-45 are the day of the year (001 -'
365) and positions 7-4)contain the year.
Loads
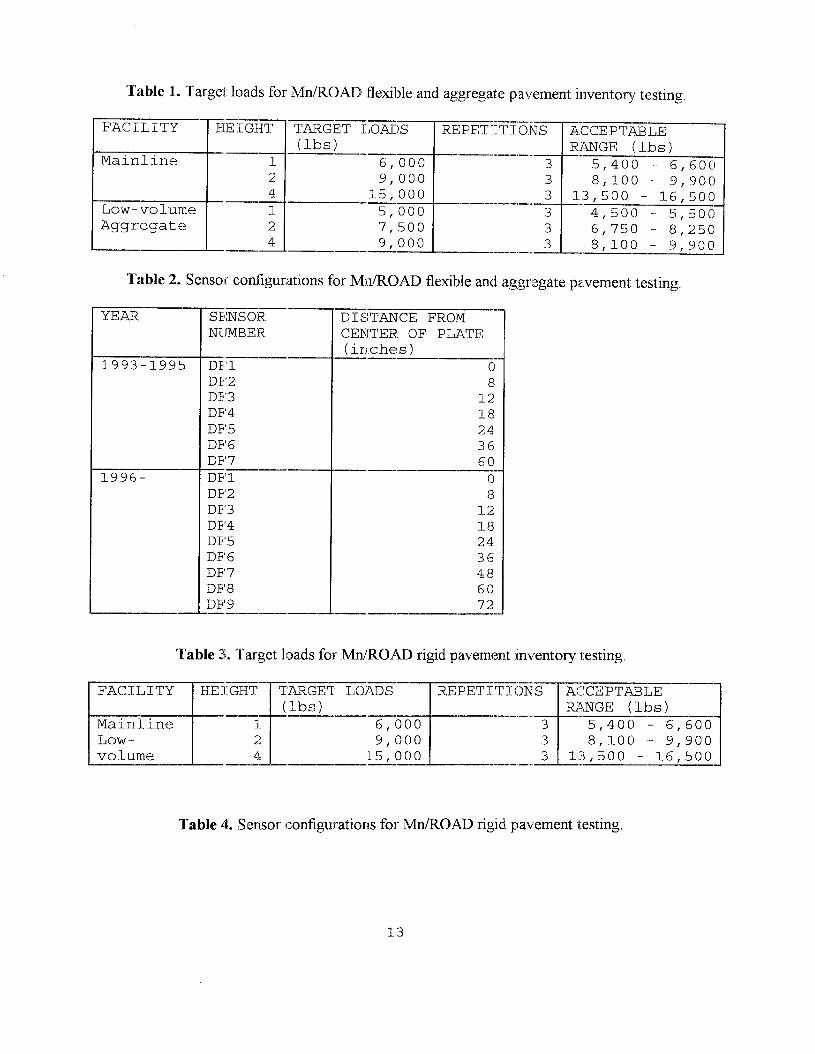
The target load level:; for the flexible test sections depends on the fiicdity being tested as shown in
'Talble 1. Two seating drops at the: drop height 1 load level are used befbre the test sequence i s started.
Configuration
"hie raclius ofthe load plate is 5.511 inches (150.1 mn).Two difYererrt sensor configurations have been
used as described in 'Table 2. With the exception ofjoint-eficienc;ylest,ingin the rigid test sections
the sensor spacing should riot be changed.
'7
Test Acceptance
The data are evaluated by ihe operator duluring the testing Normally, daia for a given 1est are rejected
and a re-test is performed in accordance with the guidelines set forth in the LTPP FWD manual ( I )
However, testing on the niairilxne is done only chning traffic: diversxoris Due to the largc number of
tests required these tolerances are occiisionally loosened and a re.test is not done if time constrain1s
are severe
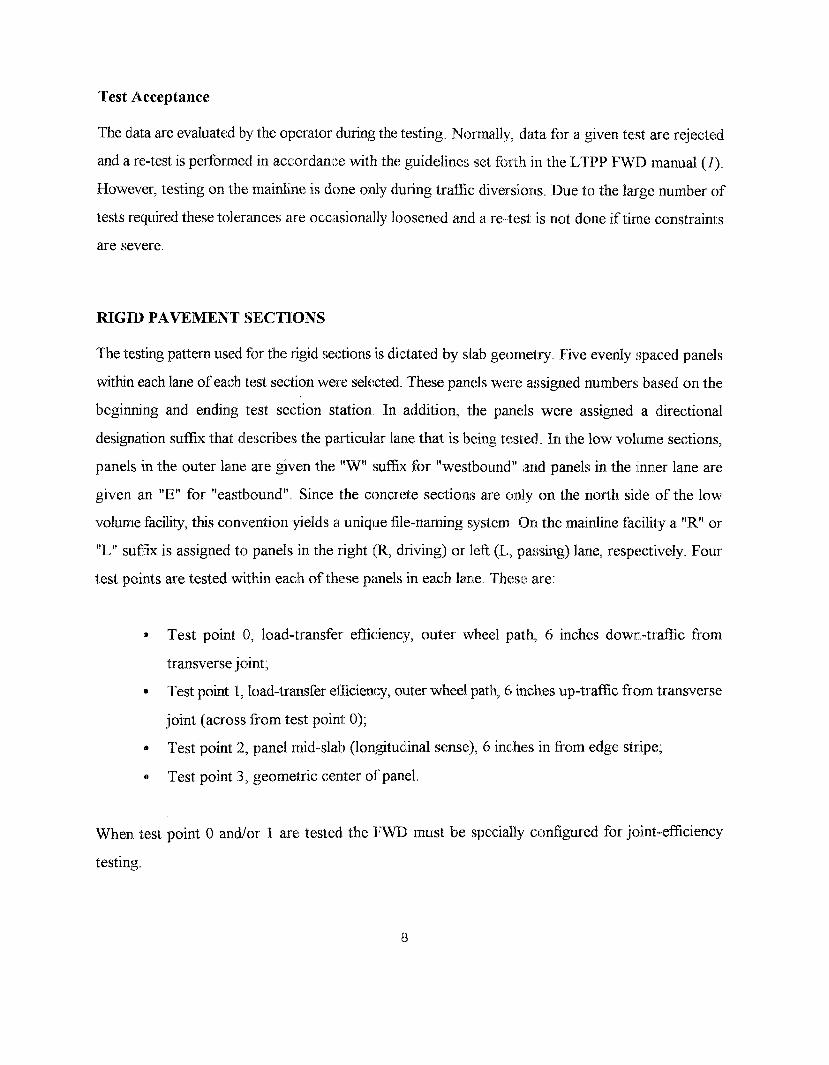
RIGID PAVEMENT SECTIONS
The testing pattern used for the rigid sections is dictated by slab geometry Five evenly spaced panels
within each lane of-eachtest section wer;e selected These panels were assigned numbers based on the
beginning and ending 1cst section st ation In addition, 1he panels were assigned a directional
designation suffix that describes the particular lane that is being tested In the low volrime sections,
panels in the outer lane are given the "W" suffix for "westbound" arid panels in the mner lane are
given an "E" for "eastbound" Since the concrete sections axe oinly on ihe north side of the low
volume facility, this convention yields a unique file-naming system O m the mainline facAi1.y a "R" or
"L" suffix is assigned to panels in the right (R, driving) or I& (L, pa:tsing) lane, respectively Foum
test points are tested within each of 1hese panels in each lane Thew are
e Test point 0,bad-transfei efficiency, outer wheel path, 6 inches down-trafic from
transverse joint,
1' 'Test point 1, load-transfer efficiency, outer wheel path, 6 inches up-traffic from transverse
joint (across from test poini 0),
6) Test point 2, panel mid-slah (longitudinal sense), 6 inches in from edge stmpe,
11 Test point 3 , geometric cerit ex of panel
When test point 0 and/or I are tested the I W D must be specially configured for joint-efficiency
testing.

The file naming schcme for rigid seciions is similar to that used rn the flexible sections In the file
name, positions 1-2 indicate the test section number, position 3 can b t > t erther "J" for joxrat testing, "2"
for test point 2 tests or "3"Ibr te!jt poinl 3 tests Positions 4-6 give thie day-of-year and ]positions7-8
contain the year In general, when the FWD operator saves rigid section deflt:ction data, data from
both lanes can be contained in the same file The directional designation suffixes are entered on the
subsection line that irmmediately precedes the station identiiier line within the data fileti
Loads
'The target load levels for both mainline and low-volume rigid test swkions is the same as those for
the mainline flexible sectioins as shown i m Table 3. 'Two seating drops at drop height 1 load level are
used before the test sequmce is started.
Configuration
Thle radius of the load plat-e is IS0 1 rnm ( 5 91 inches) DiRexeni smaor configurations have been
used as described in Table 4 Wiih the exception ofjoint-efficiency testing the sensor spacing should
not bt: changed For jount-efl�icier:rxcytesting the 203 mm-offsel sensor is nxoved behind the plate at 305
mrn as shown in Table 4
'TestAcceptance
'The data are evaluated by Ihe operator dlxiring the testing. Normally, data for a given tesi are rejected
and a retest is perfomred in accordance with the guidelines set forth in the LTPP FWD manual ( I ) .
However, testing on the mainline is done only during traf5ic; diver:;ioins Due to the large number of
tests required these tolerances are occasionally loosened and a r e-test is not. done if time constraints
are severe.

AGGmGATE SURFACED SECT[ON$
The testing protocol for routine inventoiy tests on the aggregate ses;tbom is similar to the flexible test
section protocol with a few exceptions. Routine FWI) testing on thc: MnROfdI flexible sections
consists of deflection testing a1 10 stalions spaced at 50-foot intervals
Each FWD data file i s uniquely named In the 8-character r>OSfilename, positions 1-2 indicate the
test section number, position 3 gives the transverse offset code ( I , 2,? t i , or 7), positions 4-6 are the
day of1he year and positions 7 -8 contain the year
Loadls
‘Thetarget load levels for the aggregate test sections are shown in “FailAe1. ‘Twoseating drops at the
drop height 1 load level are used befoi~t:the test sequence 1s; started.
Configuration
‘Theradius ofthe load plate IS 1SO.I mmi l(5.91inches). Two different s m m configurationshave been
used as described in 7’abXe 2.
Test Acceptance
The dala are evaluated by the operator during the Iesting Normally, data for a given test are rejected
and a re--testi s perfomred in accordance with the guidelines set folrth in [heLTPP FW) manual ( I )
However, test results on lighter structures (such as aggregate o r chip-sealed pavements) are: affected
by the su~acecondition ofthe section. Ilue 1.0 the variability in surfac-,econdition (ruts, dust, gravel,
washboarding, etc.) the tolerances are occasionally loosened
10

CALIBRATION
F'WD Machine
Both reference and relative calibrations of the F W load cell and gcophones are performed at leas1
once per year in accordamce with the guidelines set forth in the LTPP FMrD mariual ( I ) . 'The
calibrations are performed in the North Central region FWD calibration center at !he MnDOT
Laboratory in Maplewosd, MN.
Paivement Surface l'emlperatare
During deflection tests, pavemertt surface temperatures are measured using an infrared thermometer
mounted on the FWII trailer. The inIrared thermometer on each of the MII/ROAD machines is
calibrated using a specially developed demp~:rature-sensingplate. 'Ifre plate consists of'a 19.05 mm
(0 75-inch) thick, 203.2 nim (IS-.inc;h)isquare plate with four thermocouple pairs embedded Just
beneath the top and bottom surfzices. 'The wire pairs are arranged in such a way that temperature
gradient and variation effects can be a~xounted for
Tcl cailibrate the infrared .thennometer the plate i s placed in ,a. refrigerator for a period of time prior
to the test. 'The plate is then pla,ced beneath the infrared thc;irno~~neterand allowed to warm to the
amibient room temperature:. Both the plate arrd infi-ared tempemtures art: recorded periodically. The
next step is to place a heat sourcc beneath the plate. Periodic tc:mpei-ati.m: rnea.su:rementsizrc: recorded
as the temperature of the plate rises. In doing this a source tempt:ra.trxre span from about 0 to 50 "C
can be attained.
'These data are used to derive a calibration curve fiom whiclil the c;oc:fficierits required by the FWD
fielld software can be a;alcuIated.I t is re~ommendedthat this procedure be done on a yearly basis.
11

REFERENCES
“MANUAL FOR IFW TESTING TN THE LONG TERM EDAVEIMENTPERIFORMANCE
S‘TUDY.”PCS/I.aw Engineering, Braun tniertec Pavement, h e . , Version 2.0, 1993.
-----
Table 1. Target.loads for MnIRC1A.D flexible and aggregate pavement inventory testing.
.---
1 5 , 0 0 0 5 0 0 0 '7 ,5 00
._ .-_I-
Table 2. Sensor configurations fbr Mx.1/KOA.D flexible and aggregate pavement testing.
D I S T A N C E FROM CENTER OF PLATE (inches)
0 8
3.2 3. a 2 4 36 6 0 0
DF'2 (3 DF':3 1.:2 DF'4 1.13 DF'5 24 DF'6 36 DF'7 4.13 D F t3 6 0 DF'3 7 %
Table 3.Target loads for M R Q A D rigid pavement inventory testing
E'A(JII, ITY
p l a in l ineFL o w -1 vol-urne
Table 4. Smsor configurations for Mn/ROAD rigid pavement testing.
3.3

14

Subsurface Temperatures - Thermocouples
Greg Johnson
The sensor installed at 1Lln/lROAIC) to measure the ternperatuxe in a pavement system is a
thermocouple The thermocoirples are a type 'Ir (Copper-Constamkan). The sensors are placed at
discrete depths, and at specific offsets, wii hin the pavement profile in each section
Greg .fohnson Office of Minnesota Road R.esearc:h
I400 Gervais Avenue Maplewood, MN 55 109
(612)779-5938 gj [email protected]
1.5

SUBSI.JRFACETEMBEIZATUIWS
In each test section ithere is an installatiori of thermocouples (tree) lcrcated in the outer wheel path
These thermocouples are typically placed according to following pllawi The top thermoc:ouple 1s 25
rnm (1 in) from the pavement surface 'The next is at the xnidpr~intfor the pavenrent structure
approximately 75 mm (3 in) The final thermocouple in the pavement layer is located 25mm (1 in)
fiom the bottom of the pavement Then there are 'sensors installed t)e:lovvthe pavement surface in the
base and subgradelocdall.ed305 rnm (12 in), 457 mm (18 in), 610 inn1 (24 in), 915 rnm (30 in), 1220
mm (48 in), and 2438 rrm (96 in) Depending on the pavement layex thickness, therc may also be
another sensor located within the pavement, or befween the bottom oll-the pavement and the 305 rnm
(12 in) sensor,for betler rt:soluiion 1111 some test sections there are also trees of sensors located at
centerline, shoulder, ;md embankment
Location
Centerline
Outer Wheel Path
Shoulder
Embankment
--------I._- IBfEFet from Centerline
-0.00 m (-0.0 R)
-2.95 m (-10 ft)
-4 90 m (-16 fi.)
-7 40 rn (-25 It>
These sensors are automatically sampled every 15 minutes and stored inthe MnROAD database. The
data acquisition units used to sample the sensors are Optim 3008 Megadacs base unit with a
AD816TC card and a .P816 reference panel into which the thmmxouple are connected. These data
acquisition units are located in cabinets next 4.0 the test sections being sampled. The ca1:)inetshave a
heater amd cooling fans to help maintain an acceptable operating temperature. 'The reference panels
in which the reference thermistor and t.hethermocouple wires arc;: attxhed to the data acquisition
equipment are insulated with 50 mm (2 in.) of polystyrene insula.tion to minimize temperature
gradients. Each channel in the data acquisition units has an individtial amplifier and a micro-voltage
offset due to manufact,uringand temperature effects. These 1ic;ro-vsh.ageoffsets are balanced out
on these amplifiersbefore every reading.

A test is currently being conducted tc, detcrmixu: the accuracy ST t ht: thermocouple wire and data
acquisition units The thexrriocouple wire reads -0 3 to -0 2 degrees C low of a checked point of 0 0
degrees C We are irr process of testing the data acquisition equxpnient by placing an ice bath (0 0
degrees C) in the cabinets and letting,the data acquisition equipment read the temperature over it
period of 3 days to look fix-offset due to cabmet lemperature fluctuations and drift in the amplifiers
The results are published in a May of 1997 report The reports acc;uri3cY slatement will apply to all
of the thermocouple data in the MdROAI) database after Ilece~ribtrrX 5 , 1995
A procedure is being written 10 scan all1 the thermocouple data before it is loaded into the database
table to check for values vvhich are statistical outlyers. This will be accc9rnplish1edby chccking all the
themlocouple sensors at a certain depth range against each other zmd1those that are over 3 standard
deviations beyond thc average value ft om all tht: sensors in that grwij will be tagged and checked
manually before the data is loaded
'The thermocouples temperature data is critical in enviroriimental faactors aft3ecting the pavement
structure during freezdthaw, determination of the soil modulus, curling. and warping sIu t k s on the
concrete, thermal cracking, andl most (1ther research.
1.7


Frozen Soil Layers - Resistivity I’irc),be
Greg Johnson
A resistivity probe (RP) uses resistancx readings to determine the I,sycmof the subsurface that are
frozen. In each of the 40 test sectionsat Mn&OtUl there is one RP ins1alled in the outer wheel path,
arid in some sections, an RP is also located at the centerline, shoulder, and erwwbankrncnt
Greg Johnson Office (ofMinnesota Road Research
1400 Gervais Avenue Maplewood, MN 5 5 109
(6 12)7’79-5938 [email protected]
19

FROZEN SOIL MICASUREhlEN'IiS
Specific locations of the resistivity probes (IWs) in each of the 40 test sections at Mn/RC)AD are:
Location OEset from Centerlirie
Centerline -0.00 m (-0.0 it> Outer Wheel Path -2.95 m (,-loft)
Shoulder -4.90 m (-16 ft) ]Embankment -7.60 m (-25 ft)
A resistivity probe consists of a PVC pipe, 50 mrn (2 in ) in diameter, with rings installed at regular
intervals along the length ofthe pipe The rings are made with copper wire wrapped around the pipe
at 50 mm (2 in ) intervals One wre, from a multi-cmductor catblc, is corinected to each fing The EW
IS constructed as such to place a cmstani amplitude current between twor rings and measure the drop
m voltage between them The resulting data i s used to determine wh6:rc the soil is frozen and thawed
'This determinationis based on thc significant difference between the v~ohimeresistivity of'frozen soil
and unfrozen soil
Data from the R1,is read manually every other week from Decerml.~erthrough Ezebniary From then
until there is no longer h s i in the soil, the W s are read 3 times per week The data is collected with
a Campbell CRI 0 data liogger and two AM4 16 multiplexers The CR 10 measures the resistance
between all the adjacent rings and stoles the result 'These results are downloaded and placed into the
Mn/ROAD database
The data is analyzed to determinelhe zone where frozen soil i s located, and is used for environmental
research, FWD calculations, and other research When the resistame between individual rings is
greater than twice the resistance of baseline readings taken when ihs: :mil was unfrozen, Ihe soil is
considered frozen This rcsult i:; checked by comparing the N' resulls to the thermocouples and
watermark blocks in the test cell A controlled laboratory test is underway to verify this procedure
2 0

Traffic Measurements - Weigh In Motion
David I’almquist
The Weigh In Motion (WIM) system documents all traffic, approxiimately 20,000 vehicles daily,
that travels over MdROhD The opexatiori and performance of‘the W M system is verified by a
program which involves both field and office procedures I;ield procedures are done primarily on
an as needed basis while the office proceduies are conducted on a coritinuous;basis
David I’almquist (Officecsf Minnesota Road Research
I400 Gervais Avenue: Maplewood, pvIp\[5510!?
(6 L2)7’79-5507 [email protected] mnus
2:1

TESTING I'ROTOCOL AT WXM
FEI,ID TESTING
Purpose of Testing
e Verifl- scale calibration.
VerifL speed and axle spaci~ing.
5 Axle Semi Test Truck
Same axle configuration as the most significant 1ruck usin)?,the faciility 0 1,oad to 75 or 80 kips as th[atis where most of the ESM,';;coime fi-om 1' Perform nins at the same speeds as the trucks using the facility 0 Have a minimum of LO runs in each lane
Freqireincy of Testing 0 Prior to the opening of the innainlrnetesl road
* LJpon the 1 einstdation of new or refurbished sc:ales.
Q For a special project.
Conformity with Testing Standards
We do not cod'orm to ASTlLf E 1318 which COII(;QII~ W1Rd AS'TM E 13 18 requires an
extensivek~okat the road profile and weighing selected traffic stream vehicles both with
the WIM and staticallly VVc are unable to do this
OFFICE PROCEDURES
IPurpose of testing . Provide the means to verifi data am a continuing basis
Establish credibility SO that llhe users will have confidencc: in the data
2 2,
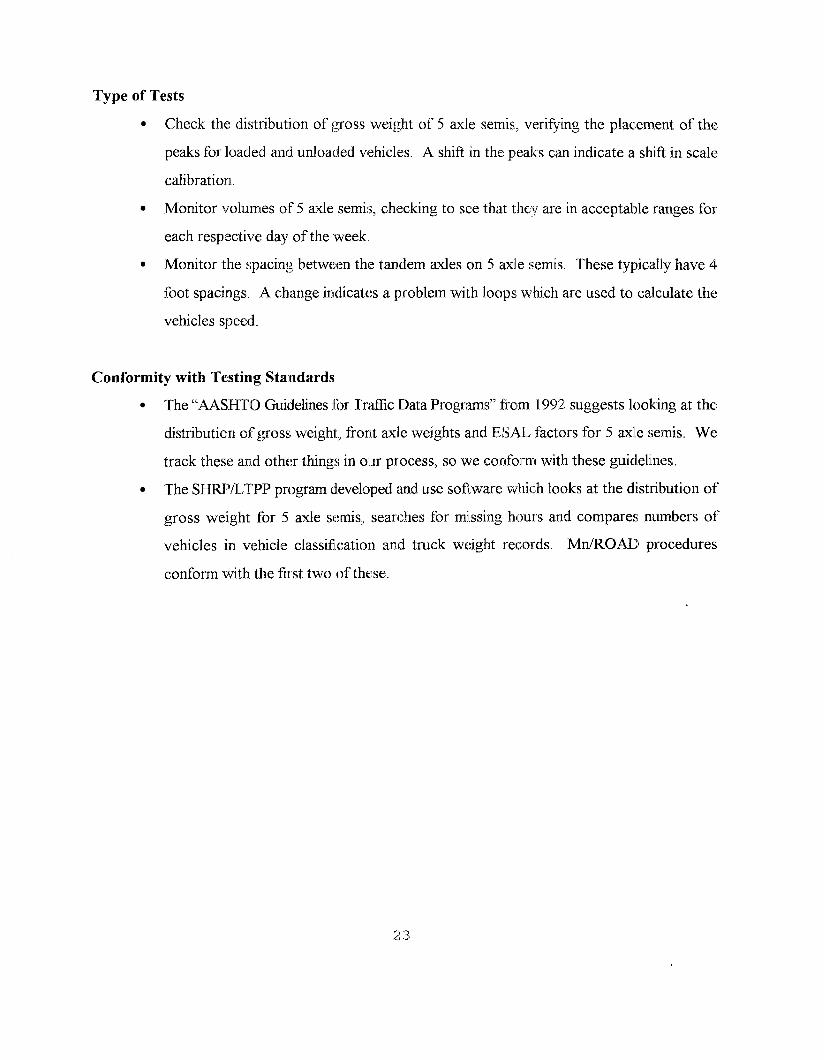
Type of Tests
Check the distribution of gross weight of 5 axle semis, verifying the placement of‘the
peaks for loaded and unloaded vehicles A shiA in the peaks can indicate ii shifi in scale
calibration
Monitor volumes of5 axle:semis, checking to see that they are in acceptahle ranges for
each respective day of the week
Monitor the spacing between the tandem axles on 5 axle semis These typically have 4
foot spacings A change indicatm a problem with loops which are used to calculate the
vehicles speed.
Conformity with Testiinig Staindards;
The ‘‘AASI-I’I’OGuidelines :hr ’I”r;xflicData Programs” ffalin 1992 suggests looking at the
distribution of gross weight,,frorat axle weights and EZSAL factors for 5 axlle :;emis. We
track these and other things in our process, so we c:ornfc~irmiwith these guidelines.
The SHRIVL‘IPP program developed and use software which looks at the distribution of‘
gross weight for 5 axle scr:mis, searches for missing ~ W . N I Sand compare!; numbers of
vehicles in vehicle classifkatioxi and truck weight records. MrdROAII) procedures
conform with the first two of these.
2 3


Testing;Material Samples
'Tom I3uisnham
The following describes the protocols, used for testing the :;oil and (;onCrete material sarnples taken
from the Mn/ROAI) project. Both ,standard and modified versilms of ASTM, AASHTO, and
MdDOT testing standards were utilized. Modikations are noted
Tom IY,umnharn Office of Minnesota Road Research
I400 Gervais Avenue Maplewood, n/lN 55x09
(6 12)7'79-5605 [email protected] mn.us
2 5

P”R0’I’OCC)LFOIR TI’ESTXNGMATIERIAL SAMPLES
SOILS TESTS
Atterberg Limits: inicliiding liquid limit, plastiic: limit, plasticity irtdex,.
Standards. AASHTO T89-(30(Liquid limit)
AASHTO T90-437(Plastic: limit and Plastic;ity hidex)
Density: including welt and diry weiglht
1’ Standard MdDO1’ procedure
Samples are meaisuretl to determine volume Weight of sample
is measured at a-iginal moisture content (we1 density), then
weighed after saiimple has been oven. dried1 crverxiight (dry density)
Gradation: including sieve analysis of fine and coarse aggregates, particle size analysis of
soils.
Standard: AASHTO T27-88 (Sieve iimalysis)
AASHTO T88-90 (Particle size analysis)
Resiliemt Modulus
Standard: SlCIlRP Protocol “46, Mn/I)OT modified
Mbdifications - Load cell within triaxial charribcr. Test perfformed
at moisture content of 100% of optimum msistirre content and at
maximum density
Organic Content
0 Siandard AASHTQ T267-I36 (Determnation o f oxganilc: content in soils by loss
on ignition), MnADO’rmodified
M1)difications-. I to 2 gram sample, 445” C: fin- 6 hours
500” C for 1 hour.
2 6

Proctor Curve Foriwnrilation
Standard AASHTO T99 -90 (Used fix-Mn/ROAID subgxade soils)
A.ASH1’0 TI 80-90 (Used for Mn/R.OAD barn and subbase materials)
Resistance (R-value)
Standard AASHTO T 190 (Resistance R-value and exlpansion pressure of
compacted sails), Mn/DO’T’modified
IUodifications - Compacted specimen preparation done in 4 lifts; 3 lifts
with 10 tamps per lift at 100 psi, final lift with I00 tamps at 250 psi
Final result is R-value at 240 psi
Moisture Content
Standard: MSHTO T26!5-86
Specific Gravity of Soils
Standard: AASHTO T 100-90
Unconfined Compressive Strength (cohesive soils)
0 Standard: AASHTC) TZOEI-90
CONCRETE TESTS
Slump
m Standard: AASH’TC) T 1X 9
Aiir Content, Unit Weiglhit
w Standard: h l h S H T 0 T121
2 ‘7

Compressive Strenl$h off Cyllindeir
Standard: ASTM C39, 6"x12" cylinder
Splittiirig Tensile Strength of Cylinder
Standard: AS'TM (2496-436,6"x12" cylinder
Flexural Strength of SimpPe Beam: third,-pointloading
9 Standard: ASTM C78-84, 6"x6"x21 beam
Flexural Strength of Simple Beam: ci:enter-paimt loading
0 Standard: ASTM C293-71!),6"x6"x:30" beam
Corn~piressiveStrength1 of 4" Nomimail Diameter Cores
11 Standard: ASTM C42-87
Splitting Tensile Strength of 4" Nonrrinal Diameter Cores
81 Standard: ASTM C:496-86
Static Modulus of Ellasl.iicity and Poisson's Ratio in Compre~siion
Standard: ASTM C469-87a
Note: Per�brmed at test age:; of28, 180, 365 days.
Air Voids Analysis of Cores
0 Standard: ASTM 0457-90
Petrognaphic Analysis of Cores
Standard: A.S'TMC856-83'

Rapid Freezing and 'I'haiwingof Beams: Method A
Standard ASTM (2666 - Proc A
PLATE BEARING TESTS
Static Plate Load (13eairimg) 'Test
Standard AS'TM J[) 1196.64, Mn/aOT modified
jModifications .. Deflections measured by B a l k elman beams.
29


Soil Moisture I- Time IBomain Refleetometer and Watermark Blocks
Craig Sehrader
Mn/RQD currently IXSW two instruments to rrreasure in situ sod nicristure, the time domain
reflectometer and the watermark [email protected] time domain reflectometer (TIIR) measures liquid
volumetric soil water cmntent, and thc: watermark block (W)meamms soil water potential as
negative pressure.
Craig Schrader Qffice of Minnesota Road Resear~h~
1400 Gervais Avenue Maplewood, MN 55I.09
(612)779-5526 schratkr@rnnroad dot.state.mn.us
TIME: DOMAIN RIKFK,E:CTC)ME?’IER,TDR
The MdROAD TDR system wits designed specificallyfor the ILln/RCDAD project using state of‘tht:
art technology for the time of‘design (circ,a 1990-91) ‘rlhe waveguide (sensor) is a two-prong
balanced waveguide 200 rnrn in length liG/8 coaxial cable runs frorn cabinets along the roadside to
the waveguide which i s buried at prescribed depths (0 30,O 45,O 01,1301,l 22,l 52, and 2 44 m) A
standard installation was always located at the outer wheel path to ~Xledriving lane in all 40 test cells
and selected test cell!, also have TDlR locatxons at the centerline, shoidder, and embankment The
transition from the coaxial cable lo the waveguide went through an irnpcdance matching transformer
(balun)to minimize signal loss The balun used was a TP103 impe6lancc matching transformer This
was consideredto be the best balun availi3bleat the time The R W 8 coaxial was chosen for the same
reason, to minimize sigrial attenuation
Measurements are taken manually approximately every two weeks tlmughout the season and more
often during spring thaw. A Tektronix .I :502Ccable tester is used for this purpose. A laptop computer
is intefiaced to the Tektolwxto electronically caphxn: the trace seen a L .the waveguide. Axialysis of the
trace is performed back at the laboratory usig a computer program to deternine the inflection points
of the trace. The distance betmeen the inflection points is used to calc;ulatethe dielectric value of the
soil being measured. The stand.ardLedieu equation is used fbr the a.nalysisof coarse textured soils.
A calibration was obtained for the andysis of clay loam sixbgrade ssils, as it appeared that the
universal equation failed in soils with higher clay contents.
Currently there i s SOIYK: concern that the unusually long cable r~iinsused in some arms of the
Mn/R.C)ADproject have had a delettxious effect on the soil moisture rea,dings. Work is currently
being done to determine the effect of c;a.ble length on the accuracy of TIDR moisture measurements.
Also, .thewaveguide will likely be reconfigured fox :fixtureinstallations. ‘]!:‘heimstrumenta8,ioruindustry
i s developing less expen:;ive automated installations. Currently it casts in excess of $10,000 to
automa.tea single site with ‘TDR.techncslogy, which to date has resti-iictr:d the use of anitoimation.
3 2

WATERMARK BI,OC:I<, WM
The Watermark sensor is an online sensor which is polled approximately every 15 xniriutes. The data
is collected by an Bptirn 3008 Mega.dac base unit and uses an r i g : 3 8 8 4 M card to read the
resistance of the WM sensor. 'The sensor reads out in centibars and has a working rmge of 0-200
centibars.Data within the working range is sent to one table of the I\/lidROADdatabase and values
falling outside this range a.re sent to a! second table. At the time ofinstalla,tion a certain amount 0.F
optimism existed about the efExtivenc:ss of the WM. It was thoughit that by calibrating the WM in
the specific soils in which it would be installcd t h t it could be used its a reasonable measurement o f
liquid volumetric water content. The inoislure potential was calibraied against a moisture release
curve to achieve the measure of water content. Subsequent work has cast some suspicion on whether
the initial calibration will hold up against repeattd freeze-thaw cyc;lles. Laboratory testing will look
into this question.
Interestinglyenough, ihe WM has proven to be a usehi instrument in kost measurements. As the soil
freezes and consequently the WM, the readings change dram,atit;ally iindicating a phase change in the
soil water. The WM 1s being used as an ancillary measuremen1 for frost penetration along with the
Resistivity Probe.
3 3

Climate Data - Weather Statianirxs
Craig Schrader
Climate data is being collected at two locations on the Mn/ROAIC) sile. A Campell Scientific Inc
weather station is located on the west end of the site near Cell 8, axid approximately two miles away
to the east, a Vaisala weather station is located near the Weigh in I\/1CoSiornbuilding.
Craig Schrader Ofice ([ifMinnesota Road Research
1400 Gervais Avenue Maplewood, MN 5S109
(6 12)7’79-5526 [email protected]
Ruth Roberson Ofice of Minnesota Road 1lesearc;h
1400 Gervais Avenue Maplewood, MN 55109
(612) 779-52 14 roberson@mnroad dot.state.mn.us
3 5

CLCMA'I'EDATA
WEATHER STATlONS
The Campbell Scientific Inc. weather station and the Vaisala weather station both collect climate
data a t the Mn/ROAD site every 15 mlinut.es.
Camplbell Scientific Inc. Weather Station
Climate data is currently being collected on the west end ofthe Mra/ROAD Project ncar Cell 8 by
the Campbell Scienticc Inc weather station This station collects the following dala.
Air tempe,:ratureat I.5 m ellevation. Vaisala Humidity - 'Temperature Meteorological
Probe. Temperature accuracy 3: 0.5 "C
Relative humidity located with air temperature. See ahwe Humidity accuiracy 2: 2.0%
I3arometric pressure.
Wind speed at 3 meters.,R 'M. Young model 05 103 Wind IMonitor. Range 0-60 d s .
Wind dire&), at 3 meters. R.M. Young model 05 103 VVirid Monitor.
Heated pr ecipitatiorx gauge:.
Incoming solar radiation mc::asu.r(:s0.3 to 3 um.
Vaisala Weather Sttition
'The Vaisala weather station i s located on Ihe east end of the MnllROAl) site, near the Weigh in
Motion building. This station collects the fcdlowiing data:
0 Air temperature.
11 Relative humidity.
4) Barometric pressure.
11 Wind speed arid direction
11 Precipitation is measured with a heated tipping bucltet precipitation gauge
* Incoming solar radiation and reflected solar radiation.

Bituminous Mixture Testing
David Newcomb
There were eight asphalt mixtures used in thc original construclion a1 MnAR0A.D A soft and a stiff
asphalt binder were used rn rnixtures having four different asphalt contents Tesling of these was
accomplished in pre-construction, cons1ruciion, and post-coiistruct.ion conditions Testing included
volurnetric characteristics, moisture sensitivity, resilient modulus, arid creep behavior
Dr David Newcomb University of Minnesota Department of'Civil Engineering
5100PiXlsbury Drive SE Minneapolis, IMN 554§5
(612)626-033 1 newcoOOl(&jtcu r n edu
3 '7

T;able 1. Mn/ROAD Bituminous 'I'est.ing Protocols
I TEST 1 PROTOCOL
Theoretical Maximum Specific Gravity of ASTM 11204I
Bitumiinous Paving IMixtures
1 Gradation of Extracted Aggregate I ASTMD5444

. . . .
' \ , ' 1 :