moisture sensing at mnroad working document
TRANSCRIPT
Working Document, December 2013
Moisture Sensing Documentation
General Overview The goal of this paper and companion documents is to provide an understanding of the moisture sensing used at MnROAD and to provide a useable tool in analyzing the effects of moisture in roadway structure. Objectives for this “general paper” include providing a discussion of the types of moisture sensing used at MnROAD, a brief description of the technology involved, a description of the data collected and stored, a list of the calibration functions used, and how to apply calibration functions to MnROAD raw data.
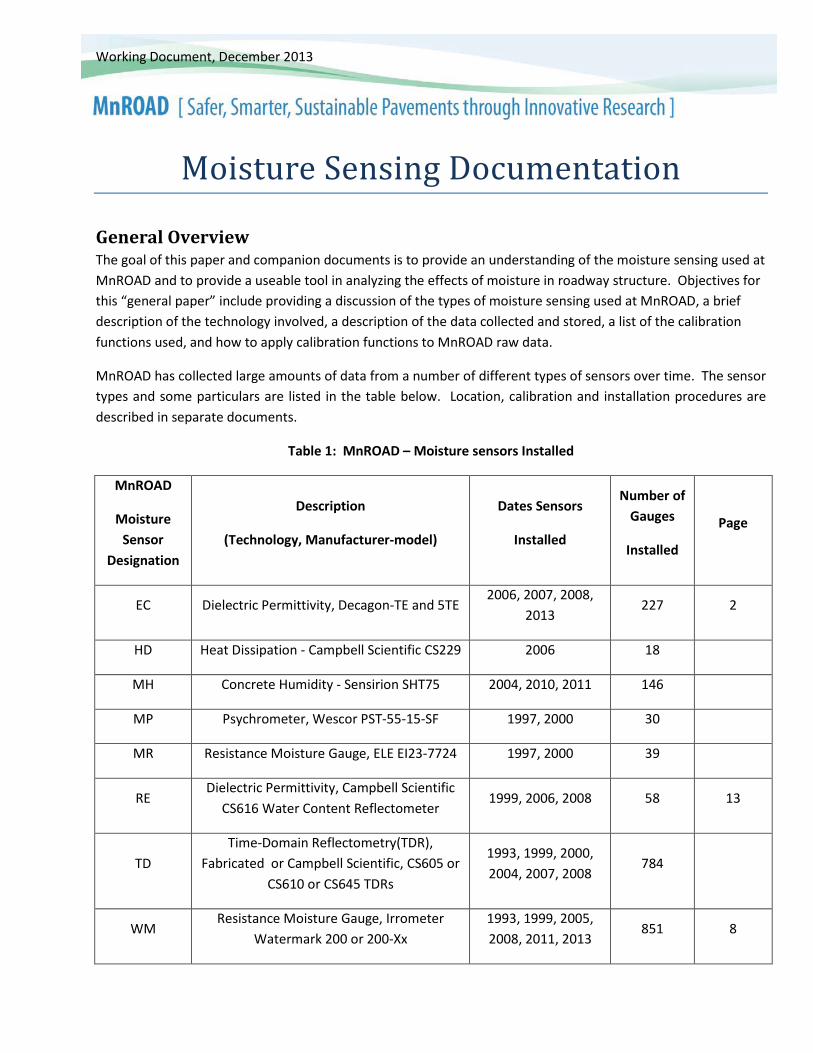
MnROAD has collected large amounts of data from a number of different types of sensors over time. The sensor types and some particulars are listed in the table below. Location, calibration and installation procedures are described in separate documents.
Table 1: MnROAD – Moisture sensors Installed
MnROAD
Moisture Sensor
Designation
Description
(Technology, Manufacturer-model)
Dates Sensors
Installed
Number of Gauges
Installed
Page
EC Dielectric Permittivity, Decagon-TE and 5TE 2006, 2007, 2008,
2013 227 2
HD Heat Dissipation - Campbell Scientific CS229 2006 18
MH Concrete Humidity - Sensirion SHT75 2004, 2010, 2011 146
MP Psychrometer, Wescor PST-55-15-SF 1997, 2000 30
MR Resistance Moisture Gauge, ELE EI23-7724 1997, 2000 39
RE Dielectric Permittivity, Campbell Scientific
CS616 Water Content Reflectometer 1999, 2006, 2008 58 13
TD Time-Domain Reflectometry(TDR),
Fabricated or Campbell Scientific, CS605 or CS610 or CS645 TDRs
1993, 1999, 2000, 2004, 2007, 2008
784
WM Resistance Moisture Gauge, Irrometer
Watermark 200 or 200-Xx 1993, 1999, 2005, 2008, 2011, 2013
851 8

Page 2 of 14
Many of the sensors identified in Table 1 were developed for use in industries unrelated to road research. These sensors or technologies were conscripted for use in roadway pavements, base, and sub-base materials. There are several questions that often come up with regard to all sensors installed in a roadway test section: Why were these sensors chosen for the particular test cell? What are the installation site (test cell) characteristics? Where are the sensors located within the test cell? At what elevations and in what materials are the sensors located? What were the pre-installation procedures? What were the installation methods? How is the data collected? Is the data raw or is it processed in the data collector? How is the data stored and disseminated? Many of the questions above are addressed in this document though not all are answered completely. There are several companion documents to address other concerns.
Database Parameters Each of the sensors above has data parameters associated with them. Table 2 lists these parameters. Each sensor value is associated with a location (Cell), a sequence number (more specificity with respect to location), the time the data was generated, and a value.
(Note: Many of the sensors identified with two letters above have multiple data elements associated with them. For example, the EC sensors collect three data elements. These elements are: electrical conductivity (EC_Values table), temperatures (ET_Values table) and volumetric water content (EW_Values Table).)
Each table in the MnROAD database has the following generic output.
Table 2: Database Parameters
Database Fields name
Description (expected range)
Cell Unique Cell Number Seq Unique sensor number for a given cell and sensor model Day Date (DD-MMM-YYYY)
Hour Hour – 24 hour clock (0-23) Qhr Quarter Hour (0,1,2,3) related to 0,15,30,45 minutes
Minute Minute (0-59) Value XX_Values
Each sensor model will be addressed in its own section of this “general” document. Background information will be provided on the sensor’s intended use and how it is used by MnROAD. A calibration procedure will be identified and documented. The calibration function for various materials will be listed and the functions applied to representative data sets and analyzed. A summary of the analysis and recommendations will complete the section.

Page 3 of 14
Overview of MnROAD Sensor Models
EC , Decagon ECH2O-TE and 5TE MnROAD has been using Decagon ECH2O-TE sensors for moisture information since 2006 and 5TE sensors since 2008. Decagon Inc. manufactures instrumentation and data loggers for the agriculture, food, and other industries.
The ECH2O-TE and 5TE sensors provide three outputs: Volumetric water content (VWC), electrical conductivity (EC), and temperature (TC). VWC and EC raw data values are produced from an encapsulated capacitance circuit with external electrodes. The sensor circuit uses dielectric permittivity to measure water content and electrical conductivity of base and sub-base materials. Permittivity is a measure of how an electric field affects and is affected by a dielectric. The base and sub-base materials are the dielectric and the sensor’s circuit and electrodes provide the electrical field and measure and collect the dielectric’s response to the electrical field. Temperature raw data values are from a thermistor encapsulated with the other circuitry. Calibration functions for each of the outputs may be applied within the data logging software or in post-processing.
MnROAD uses Campbell Scientific data loggers (CR 1000) and multiplexors for data collection. Data collection is continuous at 15-minute intervals. Since January of 2010, MnROAD stores raw data in its database and applies calibration functions during post processing. Database values, prior to January 2010, are values processed with various calibration equations and caution should be used when accepting this data. An effort to reestablish raw data is underway for the pre-2010 data.
For the most part, pre-2010 moisture content and electrical conductivity data are calculated using generic calibration functions provided by the Manufacturer. Decagon provides a generic calibration function for volumetric water content (VWC) in mineral soils. With the generic function, Decagon says that a precision of ±3 to 4 percent may be achieved. They have also published a calibration method. With a material specific calibration, a precision of ±1 to 2 percent may be achieved.
A calibration approach for engineered base and sub-base materials was developed by MnROAD staff based upon Decagon’s recommended calibration procedure. Table 3 reports the calibration functions for many of the MnROAD base and sub-base materials where the Decagon sensors were used.
Figure 1: Decagon, ECH2O-TE and 5TE

Page 4 of 14
Table 3: Calibration Equations
MnROAD Model
Sensor
MnROAD Material
Calibration Equation
EW
TE Generic (2006) VWC= 0.00109 RAW - 0.629 Sand VWC= 0.0009 RAW - 0.4929 Clay VWC = 0.0009 RAW - 0.4693
Select Granular VWC = 0.0011 RAW - 0.6615 Class-3 VWC = 0.0009 RAW - 0.5149 Class-4 VWC = 0.0008 RAW - 0.4120 Class-5 VWC = 0.0007 RAW - 0.3524 Class-6 VWC = 0.0011 RAW - 0.6787
5TE Generic (2008) VWC = 0.00109 RAW - 0.629
Sand VWC = 0.0004 RAW - 0.0780 Clay VWC = 0.0003 RAW - 0.0021
Select Granular VWC = 0.0005 RAW - 0.0908 Class-3 VWC = 0.0004 RAW - 0.0481 Class-4 VWC = 0.0004 RAW - 0.0520 Class-5 VWC = 0.0003 RAW - 0.0239 Class-6 VWC = 0.0006 RAW - 0.1438
Class-7 (Reclaimed HMA) VWC = 0.0006 RAW – 0.1358
Further definition of the base and sub-base materials listed in Table 3 is provided in the following tables; gradations are reported in Table 4 and Proctor Densities in Table 4.
Table 4: Base and Sub-base Gradations
MnROAD Unbound Base Materials Sub-grade Materials
Select Granular
Class-3 Special Class-4 Class-5 Class-6 Class-7
Special Clay Sand
Sieves Size
(Passing) Spec Field Spec Field Spec Field Spec Field Spec Field Spec Field Field Field
2” 100 100 100 100 100 100 100 100 100 1” 100 100 99.3 100 100 100 99 100 100
3/4”
Wel
l gra
ded
99 97.5 99 97 97.3 96 99 98
3/8” 88 93.9 92 81 72.4 68 95 96
4 74 35-100 84.7 35-
100 82 30-80 70 35-70 49.6 15-45 46 90 86
10 60 20-100 72.9 20-
100 66 20-65 59 20-55 31.5 10-30 26 84
20 39 44 42 13 78
40 24 5-50 31.3 5-35 26 10-35 24 10-30 14.6 5-25 7 69 39
60 16 15 15 5 61
100 12 13.3 11 10 8.9 4 52 8
200 <12 8.9 5-10 8.8 4-10 8.7 3-10 7.6 3-7 6.1 <12 2.5 43 4.6
Page 5 of 14
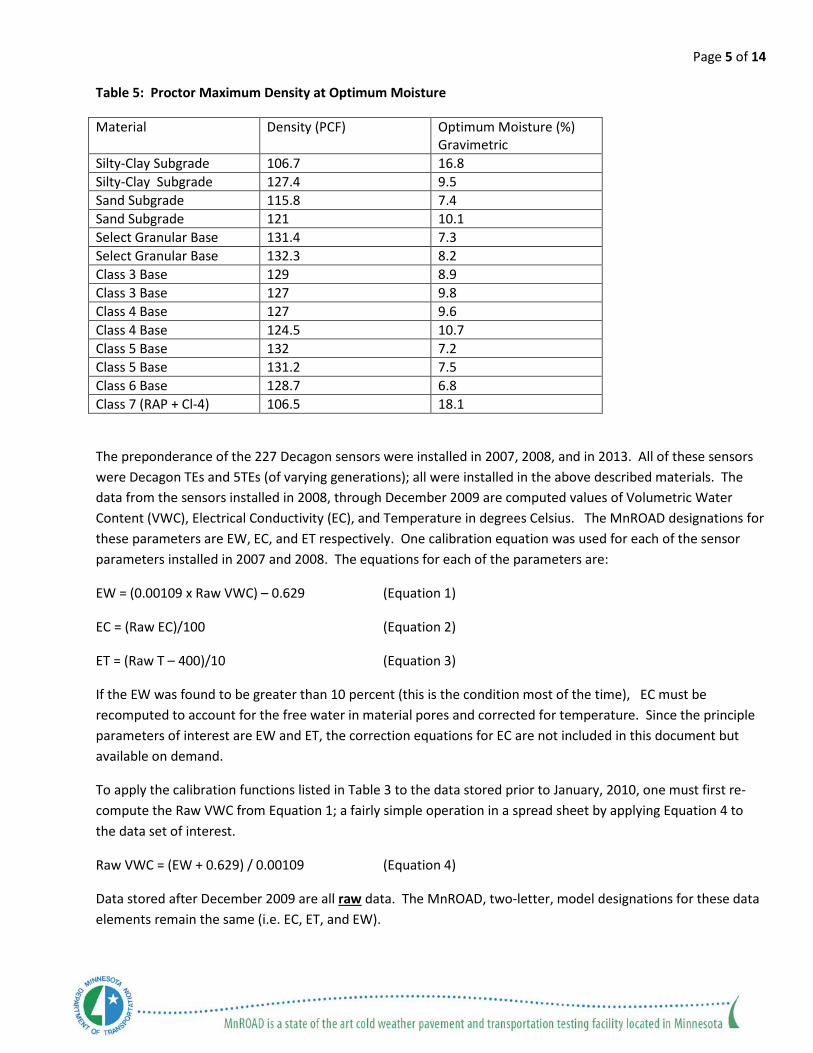
Table 5: Proctor Maximum Density at Optimum Moisture
Material Density (PCF) Optimum Moisture (%) Gravimetric
Silty-Clay Subgrade 106.7 16.8 Silty-Clay Subgrade 127.4 9.5 Sand Subgrade 115.8 7.4 Sand Subgrade 121 10.1 Select Granular Base 131.4 7.3 Select Granular Base 132.3 8.2 Class 3 Base 129 8.9 Class 3 Base 127 9.8 Class 4 Base 127 9.6 Class 4 Base 124.5 10.7 Class 5 Base 132 7.2 Class 5 Base 131.2 7.5 Class 6 Base 128.7 6.8 Class 7 (RAP + Cl-4) 106.5 18.1
The preponderance of the 227 Decagon sensors were installed in 2007, 2008, and in 2013. All of these sensors were Decagon TEs and 5TEs (of varying generations); all were installed in the above described materials. The data from the sensors installed in 2008, through December 2009 are computed values of Volumetric Water Content (VWC), Electrical Conductivity (EC), and Temperature in degrees Celsius. The MnROAD designations for these parameters are EW, EC, and ET respectively. One calibration equation was used for each of the sensor parameters installed in 2007 and 2008. The equations for each of the parameters are:
EW = (0.00109 x Raw VWC) – 0.629 (Equation 1)
EC = (Raw EC)/100 (Equation 2)
ET = (Raw T – 400)/10 (Equation 3)
If the EW was found to be greater than 10 percent (this is the condition most of the time), EC must be recomputed to account for the free water in material pores and corrected for temperature. Since the principle parameters of interest are EW and ET, the correction equations for EC are not included in this document but available on demand.
To apply the calibration functions listed in Table 3 to the data stored prior to January, 2010, one must first re-compute the Raw VWC from Equation 1; a fairly simple operation in a spread sheet by applying Equation 4 to the data set of interest.
Raw VWC = (EW + 0.629) / 0.00109 (Equation 4)
Data stored after December 2009 are all raw data. The MnROAD, two-letter, model designations for these data elements remain the same (i.e. EC, ET, and EW).
Page 6 of 14
When the Raw VWC is reestablished for each of the data points in the data set, it is a simple operation to apply the appropriate calibration function. That is, if you know in which material strata the sensors of interest are installed.
EC (EW) Data Example The range of raw data from a Decagon sensor is quite wide. The 5TE sensor has a wider range than the TE. The following table shows the range of the raw data for each of the materials with custom calibrations. The raw data values are reported for VWC = 0 and VWC = 50%. These data points are extremes. None of these materials should ever have 0 percent water and only the Clay subgrade should have a void ratio high enough to allow 50 percent water content.
Table 6: Raw Data Range for MnROAD Base and Sub-base Materials
Material 0 % Water Content (VWC)
50 % Water Content (VWC)
TE Sensor Sand Subgrade 548 1103 Clay Subgrade 521 1077 Select Granular Base 601 1056 Class-3 Base 572 1128 Class-4 Base 515 1140 Class-5 Base 503 1217 Class-6 Base 617 1072 5TE Sensor Sand Subgrade 195 1445 Clay Subgrade 7 1674 Select Granular Base 182 1182 Class-3 Base 120 1370 Class-4 Base 130 1380 Class-5 Base 80 1746 Class-6 Base 240 1073 Class-7 Base 226 1060 Source: Computed data from Custom Calibration Equations for Illustration
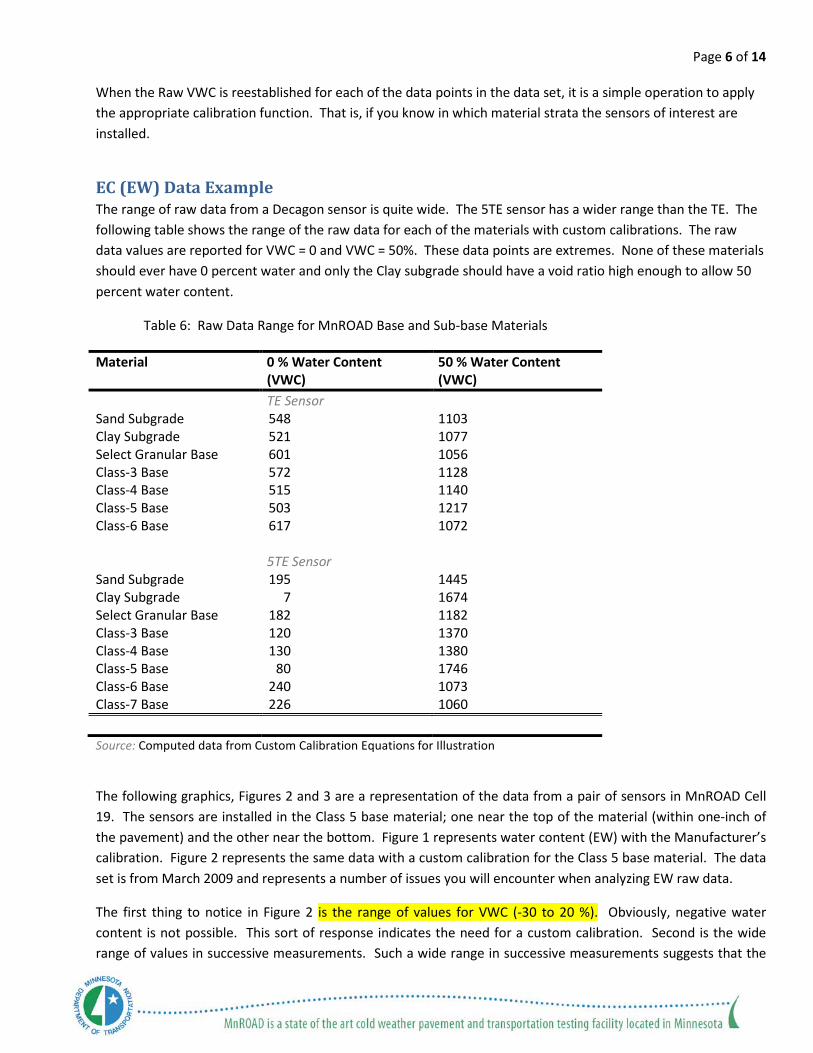
The following graphics, Figures 2 and 3 are a representation of the data from a pair of sensors in MnROAD Cell 19. The sensors are installed in the Class 5 base material; one near the top of the material (within one-inch of the pavement) and the other near the bottom. Figure 1 represents water content (EW) with the Manufacturer’s calibration. Figure 2 represents the same data with a custom calibration for the Class 5 base material. The data set is from March 2009 and represents a number of issues you will encounter when analyzing EW raw data.
The first thing to notice in Figure 2 is the range of values for VWC (-30 to 20 %). Obviously, negative water content is not possible. This sort of response indicates the need for a custom calibration. Second is the wide range of values in successive measurements. Such a wide range in successive measurements suggests that the
Page 7 of 14
material, acting as a dielectric, is not homogeneous. One possible answer is free water on the sensor electrodes and vibration from the traffic above changing the physical character of the base in contact with the sensor. Poor compaction around the sensor can result in abnormally high void ratio and therefor high VWC.
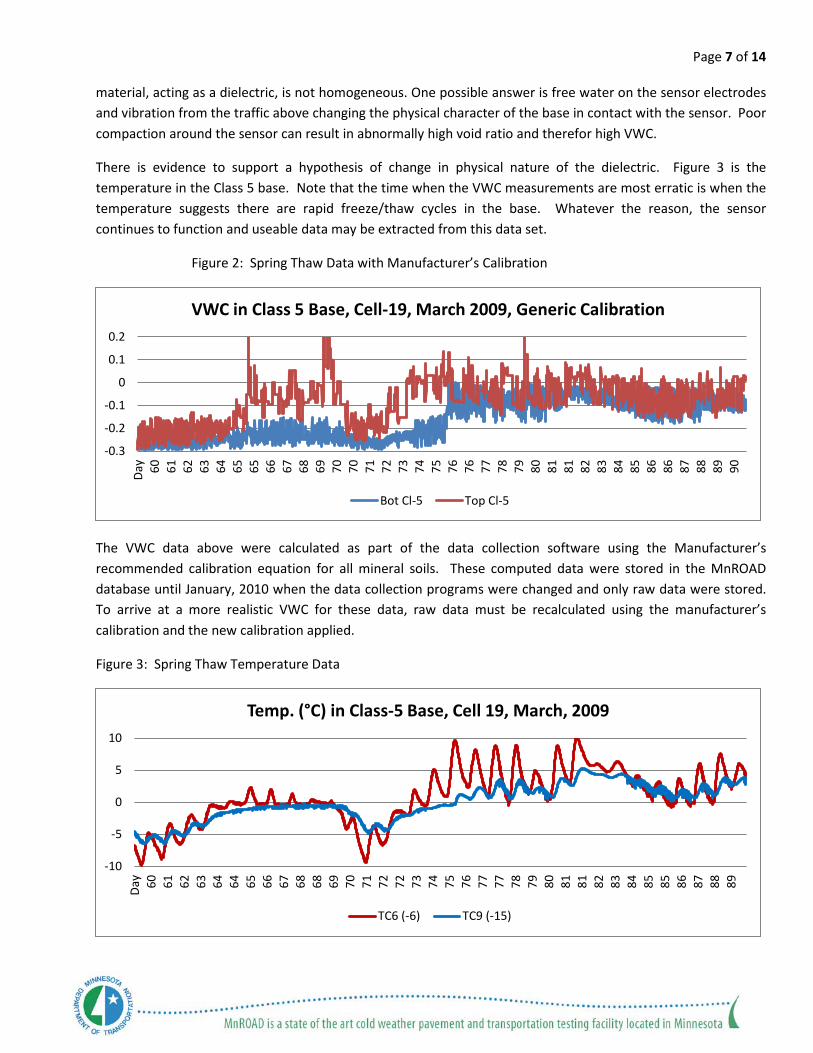
There is evidence to support a hypothesis of change in physical nature of the dielectric. Figure 3 is the temperature in the Class 5 base. Note that the time when the VWC measurements are most erratic is when the temperature suggests there are rapid freeze/thaw cycles in the base. Whatever the reason, the sensor continues to function and useable data may be extracted from this data set.
Figure 2: Spring Thaw Data with Manufacturer’s Calibration
The VWC data above were calculated as part of the data collection software using the Manufacturer’s recommended calibration equation for all mineral soils. These computed data were stored in the MnROAD database until January, 2010 when the data collection programs were changed and only raw data were stored. To arrive at a more realistic VWC for these data, raw data must be recalculated using the manufacturer’s calibration and the new calibration applied.
Figure 3: Spring Thaw Temperature Data
-0.3
-0.2
-0.1
0
0.1
0.2
Day 60 61 62 63 64 65 65 66 67 68 69 70 70 71 72 73 74 75 76 76 77 78 79 80 81 81 82 83 84 85 86 86 87 88 89 90
VWC in Class 5 Base, Cell-19, March 2009, Generic Calibration
Bot Cl-5 Top Cl-5
-10
-5
0
5
10
Day 60 61 62 63 64 64 65 66 67 68 68 69 70 71 72 72 73 74 75 76 77 77 78 79 80 81 81 82 83 84 85 85 86 87 88 89
Temp. (°C) in Class-5 Base, Cell 19, March, 2009
TC6 (-6) TC9 (-15)
Page 8 of 14
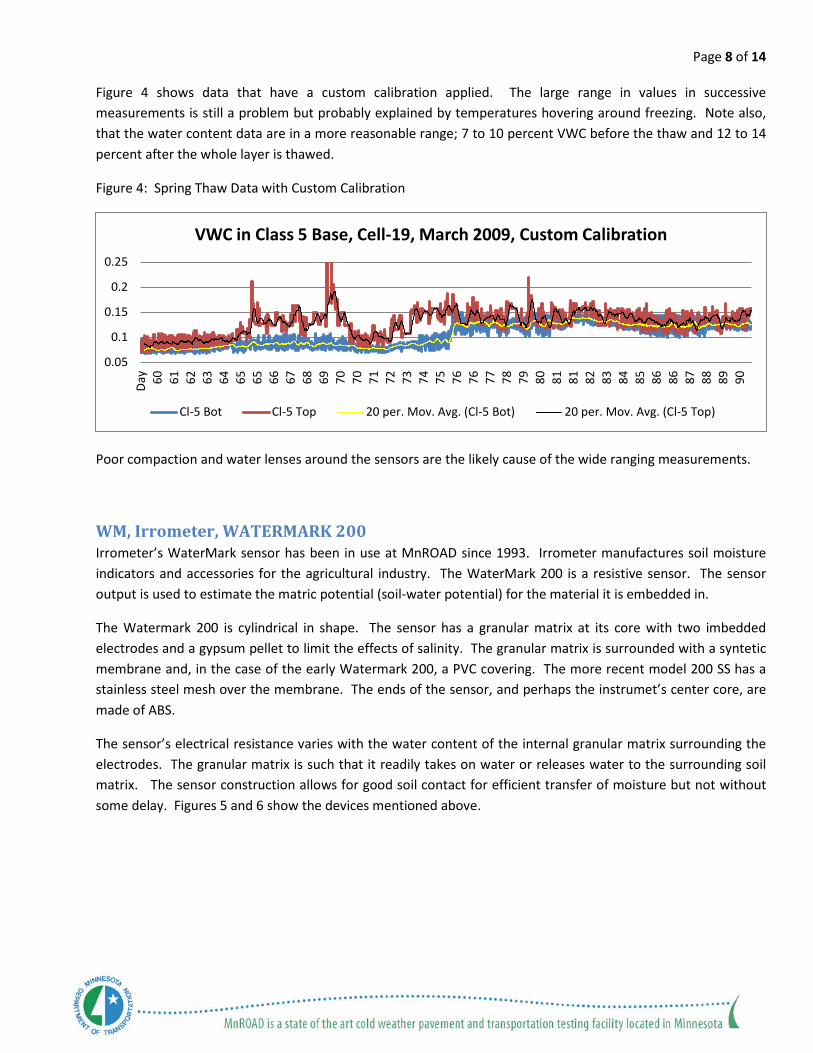
Figure 4 shows data that have a custom calibration applied. The large range in values in successive measurements is still a problem but probably explained by temperatures hovering around freezing. Note also, that the water content data are in a more reasonable range; 7 to 10 percent VWC before the thaw and 12 to 14 percent after the whole layer is thawed.
Figure 4: Spring Thaw Data with Custom Calibration
Poor compaction and water lenses around the sensors are the likely cause of the wide ranging measurements.
WM, Irrometer, WATERMARK 200 Irrometer’s WaterMark sensor has been in use at MnROAD since 1993. Irrometer manufactures soil moisture indicators and accessories for the agricultural industry. The WaterMark 200 is a resistive sensor. The sensor output is used to estimate the matric potential (soil-water potential) for the material it is embedded in.
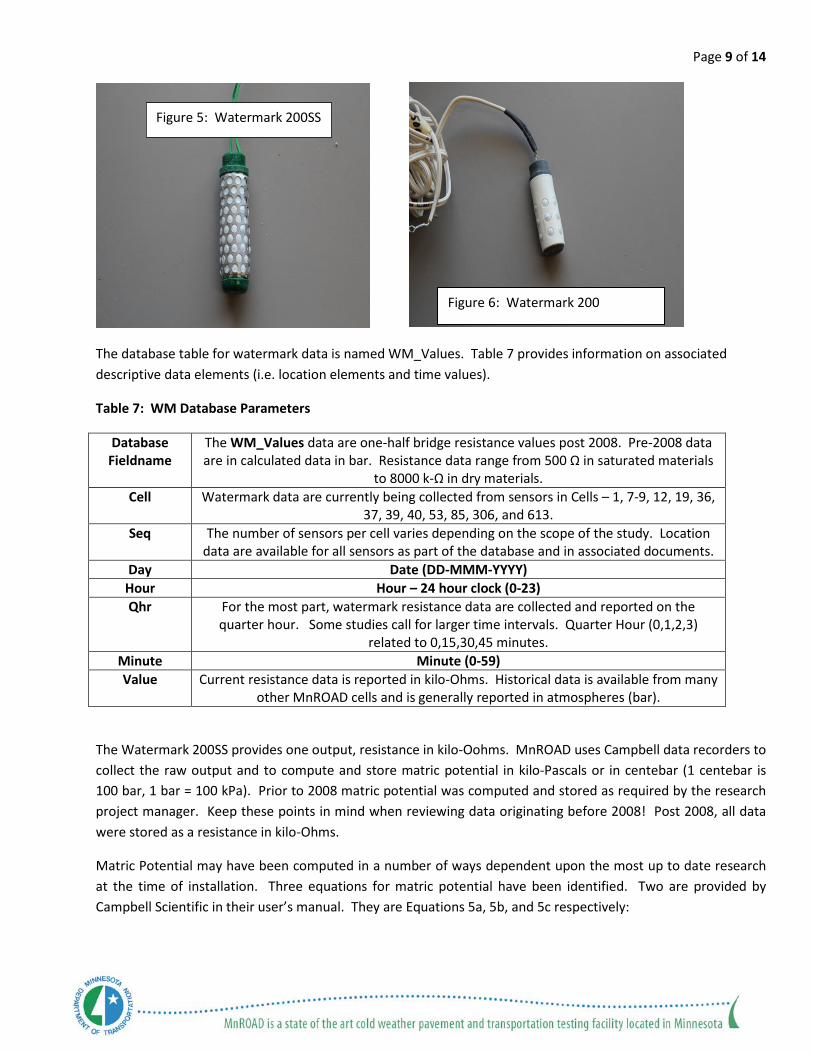
The Watermark 200 is cylindrical in shape. The sensor has a granular matrix at its core with two imbedded electrodes and a gypsum pellet to limit the effects of salinity. The granular matrix is surrounded with a syntetic membrane and, in the case of the early Watermark 200, a PVC covering. The more recent model 200 SS has a stainless steel mesh over the membrane. The ends of the sensor, and perhaps the instrumet’s center core, are made of ABS.
The sensor’s electrical resistance varies with the water content of the internal granular matrix surrounding the electrodes. The granular matrix is such that it readily takes on water or releases water to the surrounding soil matrix. The sensor construction allows for good soil contact for efficient transfer of moisture but not without some delay. Figures 5 and 6 show the devices mentioned above.
0.05
0.1
0.15
0.2
0.25
Day 60 61 62 63 64 65 65 66 67 68 69 70 70 71 72 73 74 75 76 76 77 78 79 80 81 81 82 83 84 85 86 86 87 88 89 90
VWC in Class 5 Base, Cell-19, March 2009, Custom Calibration
Cl-5 Bot Cl-5 Top 20 per. Mov. Avg. (Cl-5 Bot) 20 per. Mov. Avg. (Cl-5 Top)
Page 9 of 14
The database table for watermark data is named WM_Values. Table 7 provides information on associated descriptive data elements (i.e. location elements and time values).
Table 7: WM Database Parameters
Database Fieldname
The WM_Values data are one-half bridge resistance values post 2008. Pre-2008 data are in calculated data in bar. Resistance data range from 500 Ω in saturated materials
to 8000 k-Ω in dry materials. Cell Watermark data are currently being collected from sensors in Cells – 1, 7-9, 12, 19, 36,
37, 39, 40, 53, 85, 306, and 613. Seq The number of sensors per cell varies depending on the scope of the study. Location
data are available for all sensors as part of the database and in associated documents. Day Date (DD-MMM-YYYY)
Hour Hour – 24 hour clock (0-23) Qhr For the most part, watermark resistance data are collected and reported on the
quarter hour. Some studies call for larger time intervals. Quarter Hour (0,1,2,3) related to 0,15,30,45 minutes.
Minute Minute (0-59) Value Current resistance data is reported in kilo-Ohms. Historical data is available from many
other MnROAD cells and is generally reported in atmospheres (bar).
The Watermark 200SS provides one output, resistance in kilo-Oohms. MnROAD uses Campbell data recorders to collect the raw output and to compute and store matric potential in kilo-Pascals or in centebar (1 centebar is 100 bar, 1 bar = 100 kPa). Prior to 2008 matric potential was computed and stored as required by the research project manager. Keep these points in mind when reviewing data originating before 2008! Post 2008, all data were stored as a resistance in kilo-Ohms.
Matric Potential may have been computed in a number of ways dependent upon the most up to date research at the time of installation. Three equations for matric potential have been identified. Two are provided by Campbell Scientific in their user’s manual. They are Equations 5a, 5b, and 5c respectively:
Figure 6: Watermark 200
Figure 5: Watermark 200SS

Page 10 of 14
Equation 5a: SWP = ((7.407*R21)-3.704) where R21 is the Resistance normalized to 21 degrees Celsius using the expression R21= (Rs/(1-(0.0018*ΔT))).
Equation 5b: SWP = Rs/ [0.001306 *(1.062*(34.21-Ts+0.0106*Ts^2))-Rs], where Rs is the sensor output in kilo-Ohms and Ts is the soil temperature in degrees Celsius, Thompson Armstrong, 1987.
Equation 5c: SMP = (4.093 + (3.213 * kΩ)) / (1-(0.009733 * kΩ – (0.01205 * Ts))), where kΩ is the sensor output and Ts is the soil temperature in degrees Celsius, Shock, 1998.
The soil-water potentials or soil matric potentials calculated from the equations above are in kilo-Pascal (kPa).
A lot of work was done within MnROAD in the 1990s to try to use watermark data as a quality indicator of volumetric water content (VWC). It was found that, in general, every sensor required a specific calibration for every material that it was embedded in. There is little or no data available from calibrations done on watermark sensors prior to 2008. MnROAD continued to use the watermark sensor for its one saving attribute. It spikes significantly (increases in resistance) when it freezes. The sensor became MnROAD’s frost sensor.
Since that time, the manufacturer has improved construction procedures such that variability in output from sensor to sensor does not require individual sensor calibrations. Sensor to material calibration is still necessary. While the sensor appears to continue to function when frozen, it is certainly does not provide for reliable measure of soil-water potential.
To determine VWC from SWP or SMP, a soil moisture release curve (aka soil-moisture characteristic curve or water retention curve) must be developed for each base or sub-base material. The curves are developed by simultaneous measurement/calculation of SMP and measurement of VWC. The curve will take the form described by the following logarithmic expression. Equation 6: ΘV = α * ln |X| + δ, where ΘV is volumetric water content, α and δ are curve constants, and |X| is the absolute value of SMP from Equation 5c.
Two laboratory methods were used to develop the material moisture release characteristics: a bucket test and a hanging column test. These tests are documented in a separate calibration document. The outcomes from the two tests are used to find the most descriptive curves for each material tested.
Table 8: 2013 Soil-Moisture Release Curves for MnROAD Base and Sub-base Materials (200SS bucket test only).
MnROAD Model
Sensor Calibration
Test
MnROAD Material
Soil-Moisture Release Function
WM (200SS)
Bucket Test
Sand VWC= -0.057 * ln |SWP|+ 0.266, R2 = 0.55 Clay VWC= - 0.097* ln |SWP|+ 0.5838, R2 = 0.92
Select Granular VWC = - 0.036 * ln |SWP|+ 0.2277, R2 = 0.81 Class-3 VWC = - -0.073* ln |SWP|+0.337, R2= 0.95 Class-4 Class-5 VWC = - 0.057* ln |SWP|+ 0.2888, R2 = 0.78 Class-6 OGAB VWC = - 0.065 * ln |SWP|+ 0.2674, R2 = 0.79
Page 11 of 14
In the early 1990’s, a MnROAD consultant (Soil Environment Inc.) developed moisture release characteristics for several common MnROAD base materials. Their curves were of the form in Equation 7:
Equation 7: M.C. = A + B (log (Tension)), where “A” and “B” are constants, Tension (T) in bar (100kPa), and Moisture Content (M.C.) is gravimetric moisture content.
Table 9: 1993 Soil Moisture Release Curves for MnROAD Base Materials (200 Bucket Test).
MnROAD Model
Sensor Calibration
Test
MnROAD Material
Soil-Moisture Release Function
WM (200)
Bucket Test
Sand Clay
Select Granular Class-3 GMC = 0.073 + (-0.017 * log (T)), R2 = .99 Class-4 GMC = 0.066 + (-0.023 * log (T)), R2 = .97 Class-5 GMC = 0.058 + (-0.018 * log (T)), R2 = .98 Class-6 GMC = 0.029 + (-0.016 * log (T)), R2 = .96 OGAB
Example of MnROAD WM Moisture Data The raw data in the MnROAD data base is recorded in 15 minute intervals in kilo-Ohms. The upper limit specified within the Campbell data logger programs is 8000 kΩ. Any reading above this limit will result in a reading of ±7999. Malfunctioning sensors will also have this reading. There are times when the ±7999 reading will occur randomly and sometimes in groups of three to ten within a good data set. Users may choose to eliminate these “over the limit” readings to maintain continuity in the data set.
The range of the raw data from the Watermark 200 SS is extremely wide. Raw data is in kilo-Ohms (kΩ). Saturated materials may cause the sensor to measure at less than 500 Ohms (0.5 kΩ) and very dry materials greater than 1 MΩ (1000 kΩ).
There are a number of steps in computing water content using the resistance data from a Watermark sensor. The following graphics are used to show the outcome of each step.
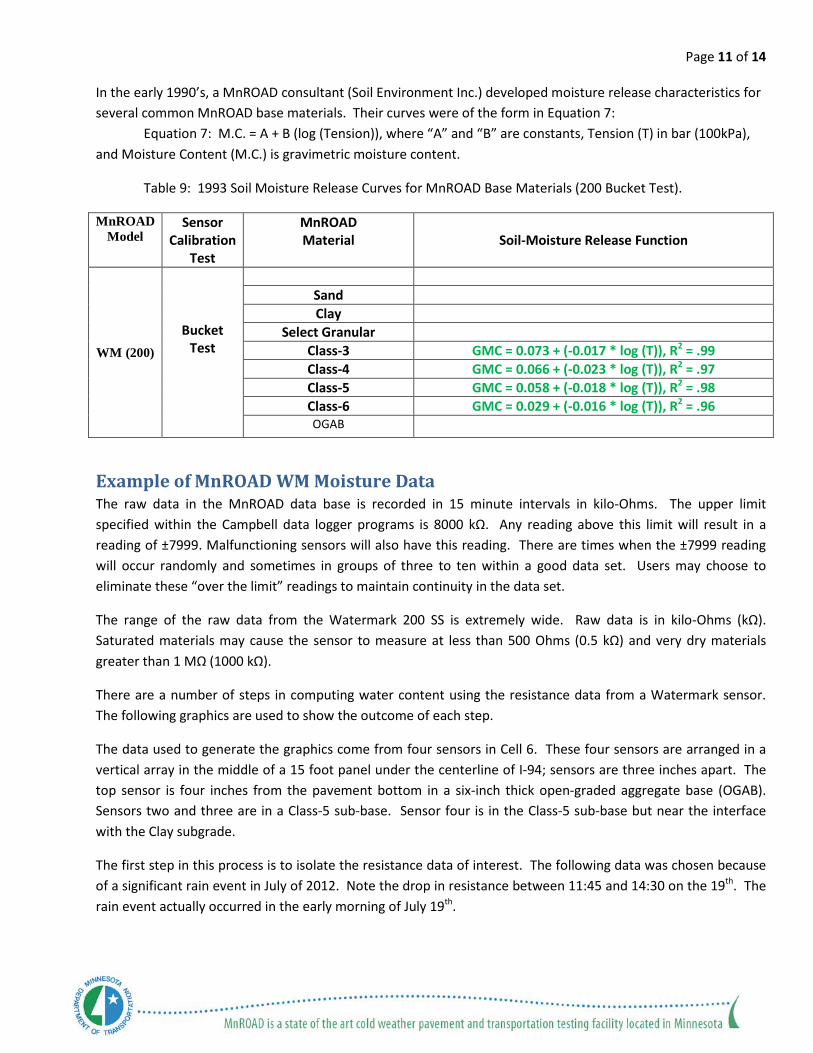
The data used to generate the graphics come from four sensors in Cell 6. These four sensors are arranged in a vertical array in the middle of a 15 foot panel under the centerline of I-94; sensors are three inches apart. The top sensor is four inches from the pavement bottom in a six-inch thick open-graded aggregate base (OGAB). Sensors two and three are in a Class-5 sub-base. Sensor four is in the Class-5 sub-base but near the interface with the Clay subgrade.
The first step in this process is to isolate the resistance data of interest. The following data was chosen because of a significant rain event in July of 2012. Note the drop in resistance between 11:45 and 14:30 on the 19th. The rain event actually occurred in the early morning of July 19th.
Page 12 of 14
Figure 7: Watermark Resistance Output
The second step in the calculation of water content using the Watermark sensor is to correct the resistance data for change in temperature. At MnROAD, temperature data are likely available for any depth needed. Note the gentle curves in the resistance data above. This change in resistance is due to change in temperature.
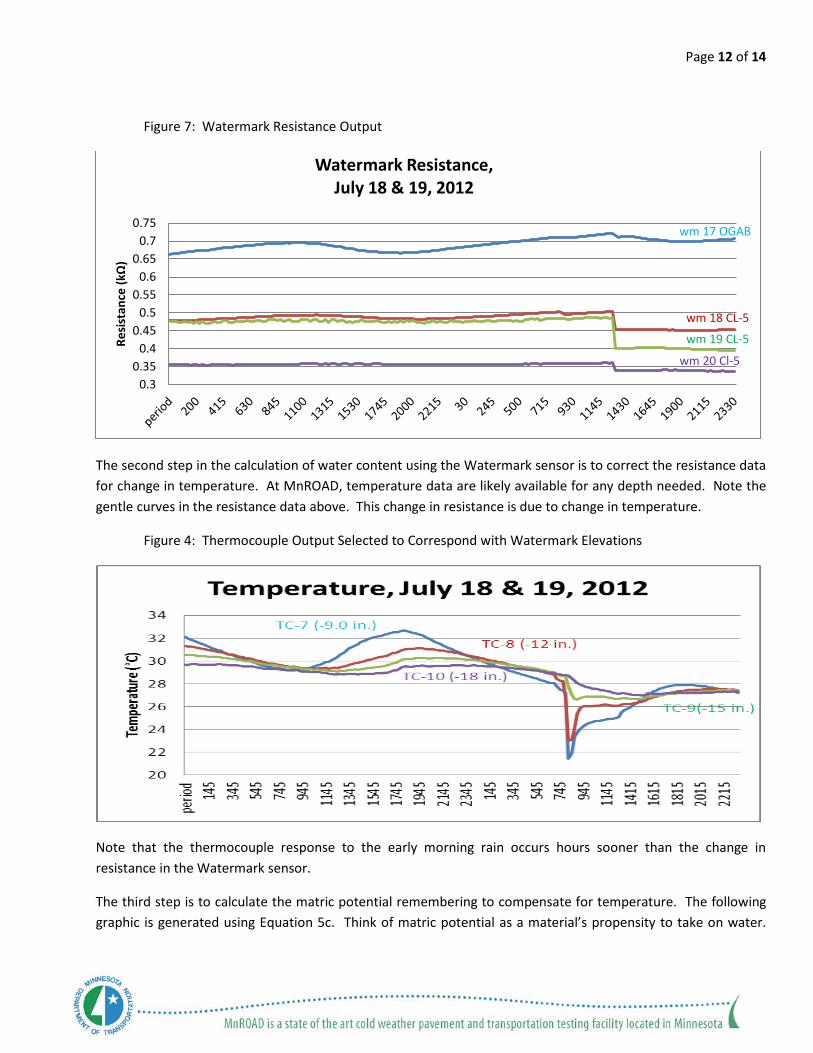
Figure 4: Thermocouple Output Selected to Correspond with Watermark Elevations
Note that the thermocouple response to the early morning rain occurs hours sooner than the change in resistance in the Watermark sensor.
The third step is to calculate the matric potential remembering to compensate for temperature. The following graphic is generated using Equation 5c. Think of matric potential as a material’s propensity to take on water.
wm 17 OGAB
wm 18 CL-5
wm 19 CL-5
wm 20 Cl-5
0.30.35
0.40.45
0.50.55
0.60.65
0.70.75
Resi
stan
ce (k
Ω)
Watermark Resistance, July 18 & 19, 2012
Page 13 of 14
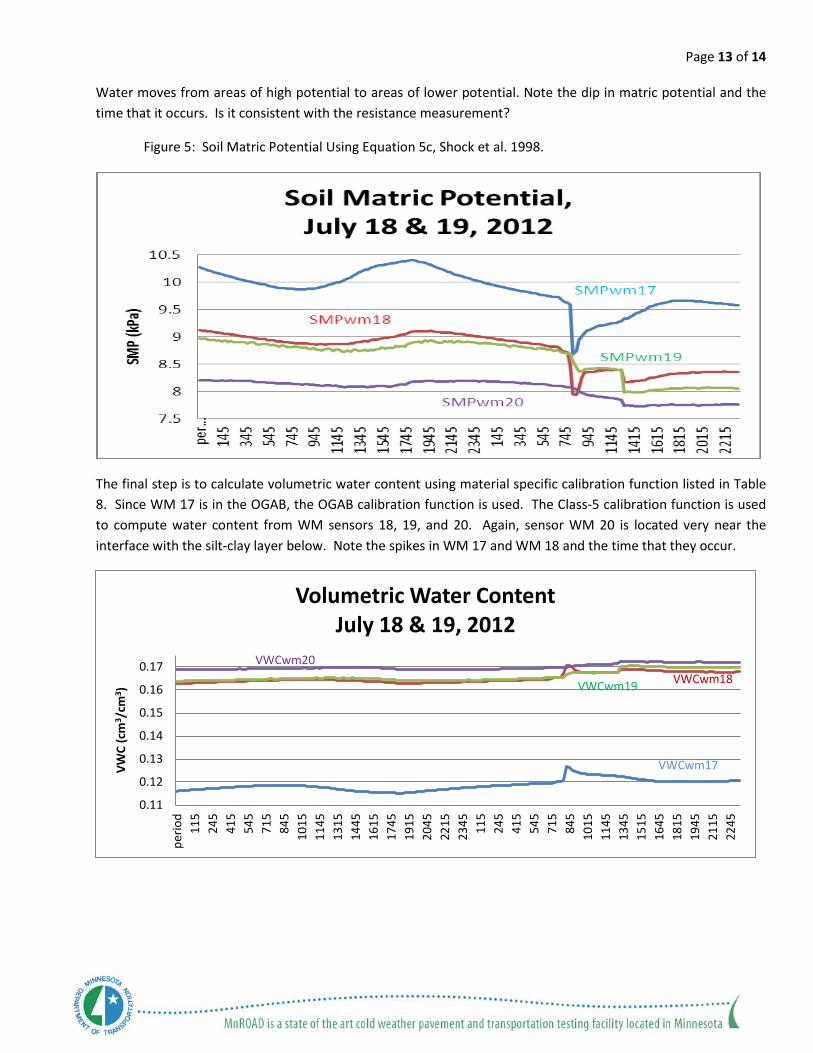
Water moves from areas of high potential to areas of lower potential. Note the dip in matric potential and the time that it occurs. Is it consistent with the resistance measurement?
Figure 5: Soil Matric Potential Using Equation 5c, Shock et al. 1998.
The final step is to calculate volumetric water content using material specific calibration function listed in Table 8. Since WM 17 is in the OGAB, the OGAB calibration function is used. The Class-5 calibration function is used to compute water content from WM sensors 18, 19, and 20. Again, sensor WM 20 is located very near the interface with the silt-clay layer below. Note the spikes in WM 17 and WM 18 and the time that they occur.
VWCwm17
VWCwm18 VWCwm19
VWCwm20
0.11
0.12
0.13
0.14
0.15
0.16
0.17
perio
d11
524
541
554
571
584
510
1511
4513
1514
4516
1517
4519
1520
4522
1523
45 115
245
415
545
715
845
1015
1145
1345
1515
1645
1815
1945
2115
2245
VWC
(cm
3 /cm
3 )
Volumetric Water Content July 18 & 19, 2012

Page 14 of 14