mitochondrial-dependentca2 handlinginhuntington’s ... · mitochondrial-dependentca2...
TRANSCRIPT
Neurobiology of Disease
Mitochondrial-Dependent Ca2� Handling in Huntington’sDisease Striatal Cells: Effect of Histone Deacetylase Inhibitors
Jorge M. A. Oliveira,1,2,4 Sylvia Chen,2 Sandra Almeida,4 Rebeccah Riley,2 Jorge Goncalves,1 Catarina R. Oliveira,4
Michael R. Hayden,3 David G. Nicholls,2 Lisa M. Ellerby,2 and A. Cristina Rego4
1Servico de Farmacologia da Faculdade de Farmacia, Centro de Estudos de Quımica Organica, Fitoquımica e Farmacologia, Universidade do Porto, 4050-047 Porto, Portugal, 2Buck Institute for Age Research, Novato, California 94945, 3Department of Medical Genetics, Center for Molecular Medicine andTherapeutics, University of British Columbia, Vancouver, British Columbia, Canada V5Z 4H4, and 4Center for Neuroscience and Cell Biology and Faculty ofMedicine, University of Coimbra, 3004-504 Coimbra, Portugal
Evidence suggests that neuronal dysfunction in Huntington’s disease (HD) striatum involves deficits in mitochondrial function and inCa 2� handling. However, the relationship between mitochondria and Ca 2� handling has been incompletely studied in intact HD striatalcells. Treatment with histone deacetylase (HDAC) inhibitors reduces cell death in HD models, but the effects of this promising therapy oncellular function are mostly unknown. Here, we use real-time functional imaging of intracellular Ca 2� and mitochondrial membranepotential to explore the role of in situ HD mitochondria in Ca2� handling. Immortalized striatal (STHdh) cells and striatal neurons fromtransgenic mice, expressing full-length mutant huntingtin (Htt), were used to model HD. We show that (1) active glycolysis in STHdh cellsoccludes the mitochondrial role in Ca2� handling as well as the effects of mitochondrial inhibitors, (2) STHdh cells and striatal neurons in theabsence of glycolysis are critically dependent on oxidative phosphorylation for energy-dependent Ca2� handling, (3) expression of full-lengthmutant Htt is associated with deficits in mitochondrial-dependent Ca2� handling that can be ameliorated by treatment with HDAC inhibitors(treatment with trichostatin A or sodium butyrate decreases the proportion of STHdh cells losing Ca2� homeostasis after Ca2�-ionophorechallenging, and accelerates the restoration of intracellular Ca2� in striatal neurons challenged with NMDA), and (4) neurons with differentresponse patterns to NMDA receptor activation exhibit different average somatic areas and are differentially affected by treatment with HDACinhibitors, suggesting subpopulation or functional state specificity. These findings indicate that neuroprotection induced by HDAC inhibitorsinvolves more efficient Ca2� handling, thus improving the neuronal ability to cope with excitotoxic stimuli.
Key words: Huntington’s disease; striatal neurons; excitotoxicity; mitochondria; calcium; HDAC inhibitors
IntroductionHuntington’s disease (HD) is an autosomal-dominant neurode-generative disorder, characterized by a selective and progressiveloss of GABAergic medium spiny neurons (MSNs) in the stria-tum (Vonsattel and DiFiglia, 1998). HD is caused by a mutantform of the huntingtin (Htt) protein with an expanded polyglu-tamine (polyQ) tract (Huntington’s Disease Collaborative Re-search Group, 1993). Proteins with expanded polyQ tracts are acommon feature in at least nine human neurodegenerative dis-orders. However, the different protein context in which thepolyQ tract is inserted determines the brain regions and neuronsthat are affected (Gusella and Macdonald, 2000). Significantly,mice expressing full-length mutant Htt were shown to reproduce
quantitative striatal loss, a hallmark of the human condition(Slow et al., 2003).
The mechanisms by which mutant Htt exerts its deleteriouseffects on MSNs are poorly understood (Tobin and Signer, 2000).Mitochondrial dysfunction (Beal, 2005), abnormalities in Ca 2�
handling (Bezprozvanny and Hayden, 2004) and in transcrip-tional regulation (Cha, 2000; Bates, 2001; Sugars and Rubinsz-tein, 2003), all seem to contribute for HD pathogenesis. A linkbetween mitochondrial dysfunction and abnormalities in Ca 2�
handling is supported by studies with isolated mitochondria, sug-gesting that a direct interaction with mutant Htt can impair mi-tochondrial Ca 2� handling (Panov et al., 2002). However,whether mitochondrial-dependent Ca 2� handling is impaired inintact HD striatal cells is mostly unknown. Abnormalities in tran-scriptional regulation in HD are proposed to stem from inhibi-tion of histone acetyltransferases by mutant Htt, an effect coun-teracted by histone deacetylase (HDAC) inhibitors, whichincrease the levels of histone acetylation (Steffan et al., 2000).Importantly, HDAC inhibitors have shown efficacy in severalanimal models of HD, improving survival, motor performance,and striatal atrophy (Beal and Ferrante, 2004). However, HDACinhibitors seem to be neuroprotective even in the absence of apolyQ expansion background, being able to reduce neuronal
Received Aug. 12, 2005; revised accepted Aug. 29, 2006.This work was supported by the HighQ Foundation (AC Rego-Grant) and Fundacao para a Ciencia e a Tecnologia
I&D 226/94, POCTI-QCAIII, POCI/SAU-NEU/57310/2004. J.M.A.O. is grateful to the Calouste Gulbenkian Foundationfor financial support. D.G.N. was supported by National Institute of Neurological Disorders and Stroke Grant RO1NSO4 1908. L.M.E. was supported by National Institutes of Health Grant NS40251A and is grateful to the HereditaryDisease Foundation and HighQ Foundation for their support.
Correspondence should be addressed to Prof. A. Cristina Rego, Institute of Biochemistry, Faculty of Medicine,Center for Neuroscience and Cell Biology, University of Coimbra, Rua Larga, 3004-504 Coimbra, Portugal. E-mail:[email protected].
DOI:10.1523/JNEUROSCI.3004-06.2006Copyright © 2006 Society for Neuroscience 0270-6474/06/2611174-13$15.00/0
11174 • The Journal of Neuroscience, October 25, 2006 • 26(43):11174 –11186
death induced by a mitochondrial inhibitor and by excitotoxicstimuli (Ryu et al., 2003; Kanai et al., 2004).
In the present study, we examined the contribution of in situmitochondria for Ca 2� handling in intact striatal cells expressingfull-length mutant Htt, thus modeling both the selective striatalpathology and the full protein context of the HD mutation. De-tailed functional information was obtained by real-time fluores-cence microscopy at single-cell resolution. Functional experi-ments using immortalized striatal cell lines (STHdh cells) andprimary striatal neurons revealed deficits in mitochondrial-dependent Ca 2� handling in cells expressing mutant Htt. Thesedeficits were taken to reflect early, nonlethal, neuronal dysfunc-tion in HD striatum. Because dysfunction precedes neuronaldeath and likely accounts for many HD symptoms (Hughes,2002), improving neuronal function is an important therapeuticgoal. Therefore, we tested whether treatment with HDAC inhib-itors, previously shown to reduce cell death in HD models (Bealand Ferrante, 2004), was able to improve function in HD cellularmodels exhibiting early signs of neuronal dysfunction. Real-timemonitoring of the ability of STHdh cells and striatal neurons tocope with energy-demanding intracellular Ca 2� elevations (i.e.,Ca 2� excitotoxicity) evidenced more efficient Ca 2� handling af-ter treatment with HDAC inhibitors, thus supporting improvedneuronal function.
Materials and MethodsMaterials. Fura-2 AM, fura-4F AM, fluo-5F AM, rhodamine-123(Rh123), tetramethylrhodamine methyl ester (TMRM �) and4-bromocalcimycin (4Br-A23187) were from Invitrogen (Carlsbad, CA).Culture media and supplements were from Invitrogen, unless otherwisestated. For primary antibodies, anti-Htt mAB2166 and anti-NMDAR2Bwere from Chemicon (Temecula, CA), anti-Htt BKP1 was from M. R.Hayden’s laboratory, anti-acetylated-histone-H3 was from Upstate Bio-technology (Lake Placid, NY), and anti-�-tubulin and anti-�-tubulinwere from Sigma (St. Louis, MO). DMEM, NMDA, (5R,10S)-(�)-5-methyl-10,11-dihydro[a,d]cyclohepten-5,10-imine hydrogen maleate(MK-801), sodium butyrate (SB), trichostatin A (TSA), oligomycin,rotenone, carbonylcyanide-p-(trifluoromethoxyphenyl)hydrazone(FCCP), and other reagents were from Sigma.
Immortalized striatal cell lines. STHdh cells expressing wild-type Htt(Q7 cells) or expressing mutant Htt (Q111 cells) (Trettel et al., 2000)were generously provided by Dr. Marcy MacDonald (MassachusettsGeneral Hospital, Charleston, MA). Briefly, cells were grown at 33°C inDMEM supplemented with 10% fetal bovine serum (FBS), 4 mM glu-tamine, 100 U/ml penicillin, 0.1 mg/ml streptomycin, and 400 �g/mlgeneticin in a humidified atmosphere of 95% air/5% CO2. STHdh cells(0.5 � 10 4) were plated on 22-mm-diameter glass coverslips and usedafter 48 h in functional imaging experiments.
Primary striatal neurons. Primary striatal cultures were generated fromthe offspring of crosses between heterozygous male YAC128 HD trans-genic mice (Slow et al., 2003) and wild-type females from the same ge-netic background (FVB/N). All procedures were approved by the Insti-tutional Animal Care and Use Committee. Striatal cultures wereprepared similarly to previously described procedures (Mao and Wang,2001) with minor adaptations. Briefly, striata from embryonic day 16(E16) to E17 embryos were dissected in HBSS while tail DNA was beingused for genotyping by PCR (supplemental Fig. 3A, available at www.jneurosci.org as supplemental material). Striata were pooled accordingto genotype, finely minced, and dissociated with 0.25% trypsin-EDTA.After enzyme inhibition with 10% FBS in Neurobasal medium, cells wereplated in polyethyleneimine-coated glass-bottomed eight-well chambers(LabTek, Naperville, IL) at a density of 2.5 � 10 5 cells per well. Cultureswere maintained in Neurobasal medium supplemented with 1% glu-tamax, 2% B27, 1% FBS, 100 U/ml penicillin, and 0.1 �g/ml streptomy-cin. Cytosine arabinoside (10 �M) was added to inhibit growth of non-neuronal cells. Cultures were maintained at 37°C in a humidified
atmosphere of 5% CO2/95% air and used for experiments at 13 d in vitro(DIV).
Western blotting. Both STHdh cells and primary striatal neurons wererinsed in ice-cold PBS and collected in radioimmunoprecipitation assaybuffer (50 mM Tris-HCl, pH 8.0, 150 mM NaCl, 0.1% SDS, 1% sodiumdeoxycholate, 1% NP-40) with protease inhibitors. Samples were sheeredwith a 26-gauge needle and three freeze–thaw cycles followed by centrif-ugation at 16,000 � g for 10 min (4°C). Protein concentrations of thesupernatants were determined using the bicinchoninic acid method(Bio-Rad, Hercules, CA). STHdh cellular extracts were resolved in 6.5–15% SDS-PAGE page and electroblotted onto polyvinylidene difluoridemembranes. Neuronal extracts were resolved in 4 –12% Bis-Tris precastgels (Invitrogen) and blotted onto nitrocellulose membranes. Mem-branes were probed with primary antibodies, and secondary antibodieswere used for development with enhanced chemifluorescence or chemi-luminescence (Amersham Biosciences, Buckinghamshire, UK) forSTHdh cells or striatal neurons, respectively. Western blots were scannedand analyzed quantitatively by densitometry with NIH ImageJ software.
Monitoring of dynamic changes in intracellular free Ca2� concentration([Ca2�]i) and mitochondrial membrane potential (��m) in STHdh cells.Single-cell imaging was performed with an imaging system composed byan inverted epifluorescence microscope (Eclipse TE300; Nikon, Tokyo,Japan) equipped with a 20� air objective, a monochromator (Poly-chrome II; TILL Photonics, Martinsried, Germany), a CCD camera(C6790; Hamamatsu Photonics, Hamamatsu, Japan), and a computerwith analysis software (Aquacosmos, Hamamatsu Photonics). Cells wereloaded with either the high affinity Ca 2� probe fura-2 (5 �M) or theintermediate-affinity Ca 2� probe fura-4F (5 �M), allowing for detectionof small or large changes in [Ca 2�]i, respectively. Loading of the Ca 2�
probe was performed simultaneously with the ��m-sensitive probe (10�M Rh123; quench mode) for 1 h at room temperature in buffer contain-ing the following (in mM): 135 NaCl, 5 KCl, 0.4 KH2PO4, 1.8 CaCl2, 1MgSO4, 20 HEPES, and 5.5 glucose, pH 7.4. In experiments aiming ateliminating glycolysis in STHdh cells, glucose was replaced by pyruvate(10 mM) plus 2-deoxy-D-glucose (DDG) (2 mM). After rinsing with freshbuffer, coverslips were mounted in a nonperfused 600 �l chamber andthermostatized at 30°C. This lower temperature minimized movement ofSTHdh cells, which, at higher temperatures, compromised accurate flu-orescence imaging in long-term experiments. Fura-4F (or fura-2) wasexcited at 340 and 380 nm, whereas Rh123 was excited at 485 nm. For allprobes, �515 nm emission was collected by means of a long-pass filter.Individual whole cells were identified as regions of interest (ROIs) for thedetermination of fluorescence time courses. The area over the nucleus(nuclear area) was also identified as an additional ROI for the monitoringof extramitochondrial Rh123 fluorescence. In situ calibration of Ca 2�
responses was performed at the end of every individual experiment, bydetermining maximal and minimal 340/380 ratios for each individualcell. This was achieved by adding a high concentration of Ca 2� iono-phore (30 �M 4Br-A23187) in buffer with 1.8 mM Ca 2�, followed byCa 2�-free buffer with 5 mM EGTA. Maximal mitochondrial depolariza-tion (��m collapse) was also performed in every individual experimentby adding protonophore (1 �M FCCP), which was always preceded byoligomycin (2 �g/ml) to prevent ATP synthase reversal. Additional de-tails on the analysis of Ca 2� responses and Rh123 fluorescence changesin STHdh cells are provided below (under Data analysis).
Monitoring of [Ca2�]i, ��m, and somatic swelling in striatal neurons.Single-cell imaging was performed in a Zeiss Pascal confocal Axiovert100 M inverted microscope with a 20� air objective and argon (488 nm)and helium–neon (543 nm) lasers. The intermediate-affinity Ca 2� probefluo-5F (Kd � 2.3 �M) was found to be the best compromise solution forthe detection of small Ca 2� rises and the avoidance of probe saturation.The ��m probe TMRM �, used in quench mode (Ward et al., 2000),allowed estimation of mitochondrial depolarization and repolarization,and distinguishing between loss of the Ca 2� probe attributable to mem-brane rupture and a true Ca 2� recovery. Cells were simultaneouslyloaded with fluo-5F AM (0.5 �M) and TMRM � (50 nM) for 30 min at37°C in buffer containing the following (in mM): 120 NaCl, 3.5 KCl,0.4 KH2PO4, 1.3 CaCl2, 20 TES (N-Tris[hydroxy-methyl]methyl-2-aminoethane sulfonic acid), 5 NaHCO3, 1.2 mM NaSO4, and 15 mM
Oliveira et al. • Mitochondrial-Dependent Ca2� Handling in HD Models J. Neurosci., October 25, 2006 • 26(43):11174 –11186 • 11175

glucose, pH 7.4. At the end of the incubation, cells were washed threetimes with fresh buffer containing 50 nM TMRM � in which glucose wasreplaced with 10 mM pyruvate to accentuate the mitochondrial role in themaintenance of neuronal homeostasis. Experiments were performed inthis buffer at 37°C. Cells were excited at 488 nm for fluo-5F (emission,505–530 nm) and at 543 nm for TMRM � (emission, �560 nm). Indi-vidual cell somata were identified as ROIs for the determination of fluo-rescence time courses. Somatic swelling was estimated by the area anal-ysis of cell somata in transmission images acquired throughout theexperiments. NMDA receptor (NMDAR) activation was achieved with100 �M NMDA/10 �M glycine in the absence of Mg 2�.
Treatment with HDAC inhibitors (iHDAC treatment). For both HD cellmodels, single concentrations of HDAC inhibitors were chosen in pre-liminary experiments on the basis of “maximal effective concentrationdevoid of any obvious toxicity.” Q7 and Q111 STHdh cells, 24 h afterplating, were incubated with 10 nM TSA or 1 mM SB for 24 h and used inexperiments. The 24 h incubation time was chosen because it is theapproximate doubling time of these cell lines under our growth condi-tions, and hence sufficient for changes in gene transcription to take place(as confirmed by microarray experiments) (our unpublished data).These concentrations had no significant effect on the viability of STHdhcells (determined by lactate dehydrogenase leakage) (data not shown),consistently with being even lower than those reported as “subapoptotic”in other neural cell lines (Ajamian et al., 2004), and effectively increasedhistone acetylation (see Fig. 4 A, B). Striatal neurons from YAC128 miceand wild-type littermates, at 6 DIV, were incubated with 50 nM TSA or500 �M SB for 7 DIV and used in experiments. These concentrations areone-half of the maximal used without obvious toxic effects in cerebellargranule neurons, in which the protracted 7 DIV incubation time wasshown to maximize protection from excitotoxicity (Kanai et al., 2004).Toxic effects were also not observed in our striatal cultures, consistentlywith the mitochondrial quenching of the ��m-sensitive probe TMRM �
and a low resting [Ca 2�]i detected by fluo-5F. Treatment with HDACinhibitors increased histone acetylation without affecting the mutant HDtransgene expression in YAC128 neurons (supplemental Fig. 3C, avail-able at www.jneurosci.org as supplemental material). All functional ex-periments were performed without HDAC inhibitors in the loading andassay buffers.
Data analysis. Values in figures and text are presented as mean andSEM (except for data in Fig. 3, for which SD was used to improve errorbar visibility) of the indicated number of independent experiments (n).Differences among group means were assessed with t test when com-paring two groups or with ANOVAs when comparing three or moregroups. The Newman–Keuls test was used for post hoc evaluations.Differences for all statistical tests were considered statistically signif-icant when p � 0.05.
For the analysis of Ca 2� responses in STHdh cells, background-corrected 340/380 fura-4F or fura-2 ratios were normalized to the max-imal (100 U) and minimal (0 U) ratios determined for each single cellduring in situ calibration. Left yy-axis of Ca 2� graphs are scaled withthese normalized values, where 50 U should correspond to the Ca 2�
probe Kd, regardless of its absolute value. Because of uncertainties in thevalidity of Kd values for different cell types, we present an approximatelog [Ca 2�]i scale in the right yy-axis. These approximate scales span amaximum of 2 log10 U in both directions from the Kd, because thiscorresponds to the approximate Ca 2� concentration response range offura-4F and fura-2 (Haugland, 2002). We assumed intermediate Kd val-ues of �1 and �0.16 �M for fura-4F and fura-2, respectively (Haugland,2002; Wokosin et al., 2004).
Changes in Rh123 whole-cell fluorescence in STHdh, indicative of��m, were expressed as F�/F0 ratios or arbitrary fluorescence units. F�/F0
ratios were calculated, after background correction, dividing the whole-cell Rh123 fluorescence obtained at every time point (F�) by the initialfluorescence (F0). We noticed a less stable whole-cell Rh123 fluorescencebaseline in experiments performed in glucose buffer after rotenone ad-dition (see Fig. 1C,F ). We found that monitoring Rh123 fluorescence inthe nuclear area provided a more stable baseline, improving detection ofrotenone-induced mitochondrial depolarization. These measurementsin the nuclear area are expressed either in arbitrary fluorescence units in
comparison with whole-cell measurements (see Figs. 1, 2), or normalizedbetween initial fluorescence (0 U) and maximal fluorescence (100 U) (seeFig. 3).
Nonlinear regression was used for comparing the susceptibility of stri-atal neurons to ATP depletion (see Fig. 5B). The increasing number ofneurons with elevated [Ca 2�]i was modeled by a four-parameter logisticequation of the following form: y � 100/(1 � 10 (T50 x ) � slope), where yrepresents the number of neurons with elevated [Ca 2�]i (in percentageof total), x represents time, slope represents the steepness of the curve,and T50 represents the time required for 50% of the neurons to elevate[Ca 2�]i as a result of ATP depletion.
With the exception of factorial ANOVAs (performed with STATIS-TICA 7.0; StatSoft, Tulsa, OK), all other statistical analyses includingnonlinear regression were performed using GraphPad (San Diego, CA)Prism 4.0.
ResultsMitochondrial ATP synthesis is not essential for Ca 2�
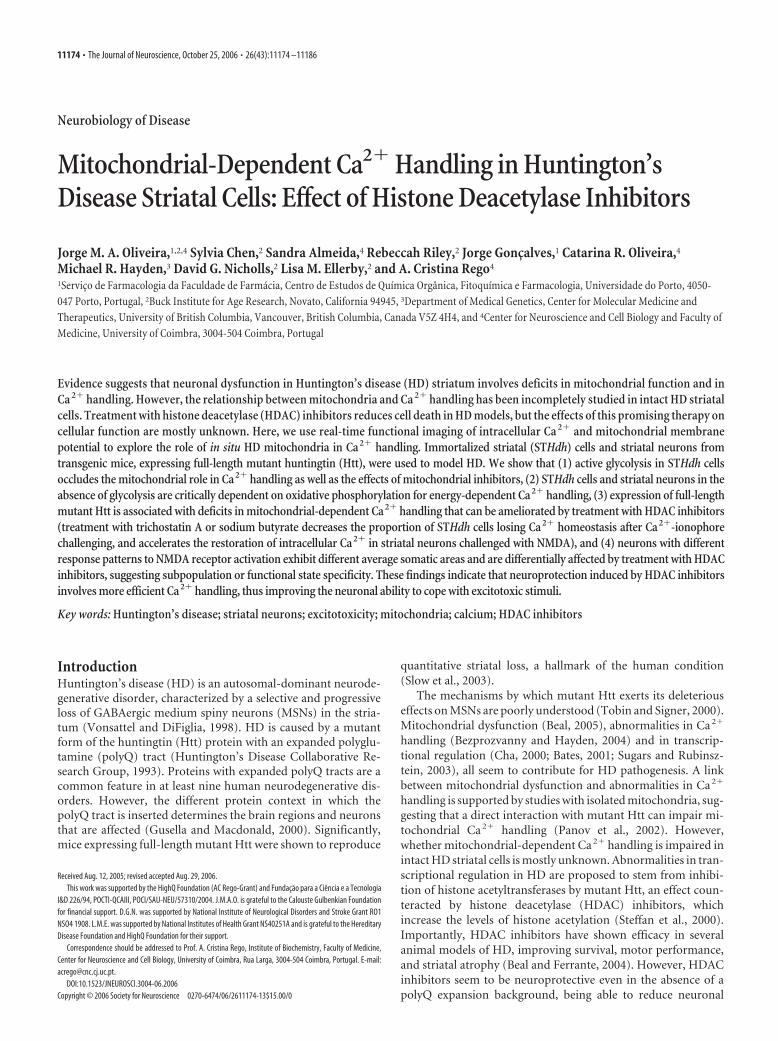
handling in STHdh cells with active glycolysisEfficient handling of increases in [Ca 2�]i is a critical process toavoid Ca 2�-induced toxicity. To test for functional differences inCa 2� handling between STHdh cells expressing wild-type Htt(Q7) and STHdh cells expressing mutant Htt (Q111), we chal-lenged the cells with the Ca 2� ionophore 4Br-A23187 (Abramovand Duchen, 2003). When glucose (5.5 mM) was used as energysubstrate (Fig. 1), both Q7 and Q111 cells responded to 4Br-A23187 (7 �M) with an increase in [Ca 2�]i that was followed by afull recovery. [Ca 2�]i was rectified to baseline values, remainingstable even after ATP synthase inhibition (2 �g/ml oligomycin)and ��m collapse with FCCP (1 �M), which fully dequenchedRh123 from mitochondria (Fig. 1A,Di–iii). These results suggestthat, when glycolysis is active, mitochondrial ATP synthesis is notessential to restore Ca 2� homeostasis in the presence of Ca 2�
ionophore. Indeed, full Ca 2� recovery is also observed when ATPsynthase is inhibited before 4Br-A23187 challenge (Fig. 1B,Ei–iii). Strikingly, cells fully recover even when rotenone (2 �M, amitochondrial complex I inhibitor) precedes 4Br-A23187 chal-lenging (Fig. 1C,Fi–iii). Rotenone evokes only minor mitochon-drial depolarization, which does not increase throughout 4Br-A23187 exposure, until ATP synthase is inhibited andpronounced Rh123 dequenching is observed (Fig. 1C,Fiii, thinline). These results support the hypothesis that rotenone reversesATP synthase, arresting mitochondrial ATP synthesis and induc-ing glycolytic ATP consumption to maintain ��m. Hence, whenglucose is available for STHdh cells, abundant glycolytic ATPefficiently supports energy-demanding Ca 2�-buffering mecha-nisms, occluding the mitochondria role in Ca 2� handling.
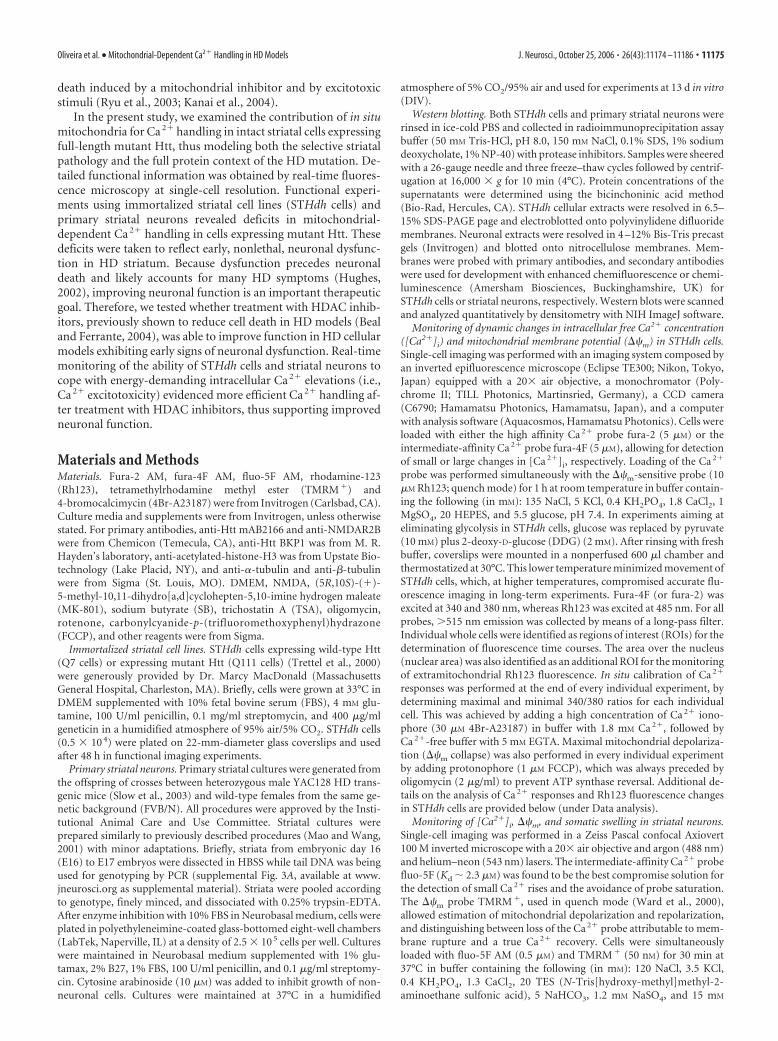
Inhibition of glycolysis highlights the mitochondrial role inCa 2� handling, rendering STHdh cells critically dependent onoxidative phosphorylationTo highlight the mitochondrial role in Ca 2� handling, we re-placed glucose with pyruvate (10 mM). Likely because of abun-dant glycogen stores in STHdh cells, replacement of glucose bypyruvate alone was not sufficient to prevent glycolysis (supple-mental Fig. 1, available at www.jneurosci.org as supplementalmaterial). Therefore, DDG (2 mM; a competitive inhibitor ofglucose metabolism) was also added to the assay buffer to maxi-mize glycolysis inhibition. In experiments identical to those per-formed with glucose (Fig. 1) except for the replacement withpyruvate plus DDG, STHdh cells were more vulnerable to 4Br-A23187 challenging, exhibiting a clear dependence on mitochon-drial ATP synthesis (i.e., oxidative phosphorylation) (Fig. 2). Inthe absence of mitochondrial inhibitors (Fig. 2A,D), a secondary
11176 • J. Neurosci., October 25, 2006 • 26(43):11174 –11186 Oliveira et al. • Mitochondrial-Dependent Ca2� Handling in HD Models
[Ca 2�]i rise indicative of failure to maintain Ca 2� homeostasis(i.e., Ca 2� deregulation) occurred with a variable delay from the4Br-A23187 challenging. Secondary [Ca 2�]i rises were followedby mitochondrial depolarization with clear direct correlation inboth Q7 and Q111 cells (significant Pearson correlation betweenthe onset of [Ca 2�]i rise and the onset of Rh123 dequenching;Q7: slope � 1.07 0.07, r � 0.9667, p � 0.001, n � 20 cells;Q111: slope � 1.06 0.04, r � 0.9848, p � 0.001, n � 20 cells).ATP synthase inhibition (oligomycin; 20 min after 4Br-A23187
challenge) caused the entire cell popula-tion to elevate [Ca 2�]i synchronously (Fig.2 A, Di), indicating that maintenance ofCa 2� homeostasis primarily dependedon oxidative phosphorylation. Indeed, oli-gomycin-evoked mitochondrial hyperpo-larization (Fig. 2 A, Dii,iii) (increasedRh123 quenching as ongoing proton reen-try through ATP synthase is blocked) evi-dences ongoing ATP synthesis (Ward etal., 2000). Furthermore, when either oligo-mycin or rotenone precedes 4Br-A23187challenging (Fig. 2 B, E or C,F, respec-tively), synchronous loss of Ca 2� ho-meostasis occurs in the entire Q7 andQ111 cell population, revealing a criticaldependence on mitochondrial ATP.
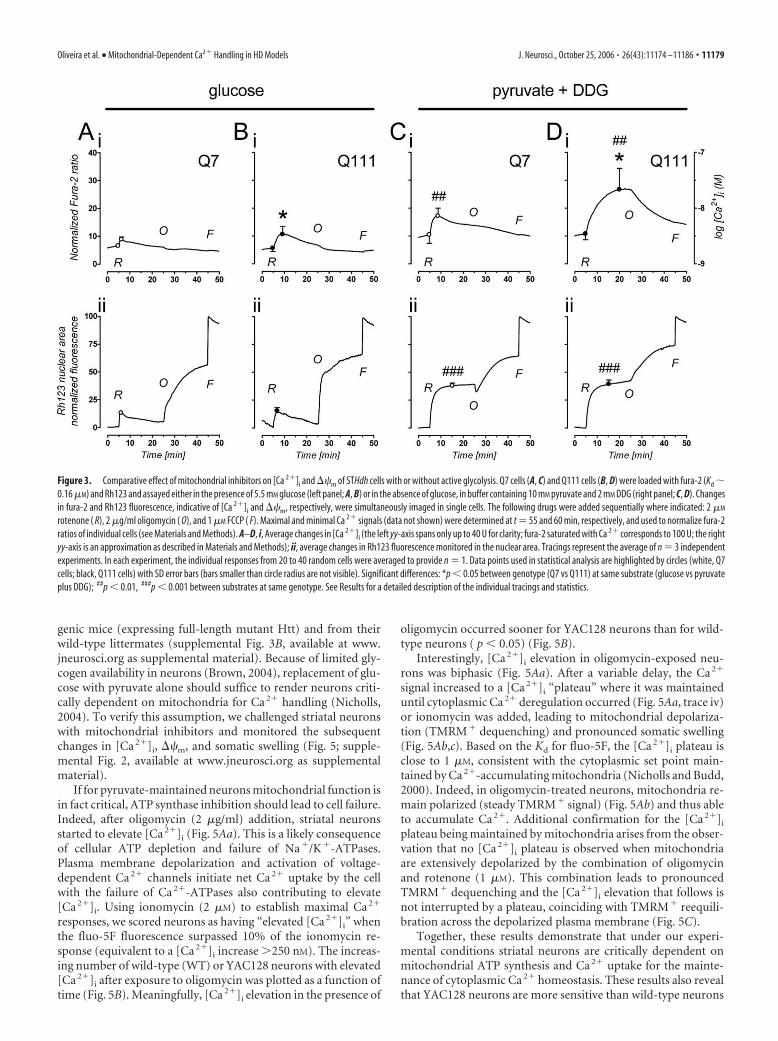
Active glycolysis attenuates the effect ofmitochondrial inhibitors in STHdh cellsMitochondria hyperpolarization by oligo-mycin and especially the depolarization byrotenone, were more pronounced in theabsence of glycolysis (compare Figs. 1,2A–Fii,iii). Because differential suscepti-bility to mitochondrial inhibitors is oftenused to estimate mitochondrial impair-ment in cellular disease models, namely inthe STHdh cells used in the present study(Gines et al., 2003a; Ruan et al., 2004; Maoet al., 2006), we further explored the effectof rotenone with and without active glyco-lysis. The high-affinity Ca 2� probe fura-2was used to improve the detection of small[Ca 2�]i changes evoked by rotenone in Q7and Q111 cells, also loaded with Rh123 forsimultaneous monitoring of ��m changes(Fig. 3). Two-factor (genotype by sub-strate) ANOVA revealed no effect of geno-type (Q7 vs Q111; F(1,8) � 0.07, p � 0.05)on basal [Ca 2�]i before rotenone addition.However, baseline [Ca 2�]i levels were sig-nificantly influenced by the energy sub-strate (glucose vs pyruvate plus DDG;F(1,8) � 15.2, p � 0.01), causing cells withactive glycolysis to rest at lower [Ca 2�]i
levels (Fig. 3A–Di; data points: circles att � 4.9 min). Analysis of the maximal levelof [Ca 2�]i achieved after rotenone addi-tion (Fig. 3A–Di; data points: circles atCa 2� peaks) revealed higher increasesabove basal in cells assayed with pyruvateplus DDG (significant effect of substrate:F(1,8) � 16.9, p � 0.01). For both energy
substrates, rotenone evoked a larger [Ca 2�]i increase in Q111cells than in Q7 cells (significant effect of genotype, F(1,8) � 10.1;p � 0.05). Analysis of the maximal effect achieved with rotenone(Fig. 3A–Dii; data points: circles at maximal rotenone effects)evidenced a significant attenuation of mitochondrial depolariza-tion by active glycolysis in both Q7 and Q111 cells (significanteffect of substrate, F(1,8) � 221.0, p � 0.001; no genotype effect,F(1,8) � 1.1, p � 0.05). The extensive mitochondrial depolariza-tion achieved with oligomycin in cells with active glycolysis (Fig.
Figure 1. Ca 2� handling and ��m in STHdh cells with active glycolysis. Q7 cells (top panel; A–C) and Q111 cells (bottompanel; D–F ) were loaded with fura-4F (Kd � 1 �M) and Rh123 for the simultaneous monitoring of changes in [Ca 2�]i and ��m,respectively, and assayed in the presence of 5.5 mM glucose. Where indicated, the following drugs were added: 7 �M 4Br-A23187(Br), 2 �g/ml oligomycin ( O), 1 �M FCCP ( F), and 2 �M rotenone ( R). Maximal ( M) and minimal (m) Ca 2� signals were used tonormalize fura-4F ratios of individual cells; the right yy-axis is an approximation (see Materials and Methods). A–F, i, IndividualCa 2� responses of 10 representative cells; ii, individual changes in Rh123 whole-cell F�/F0 fluorescence ratios for the same singlecells; iii, average change in Rh123 fluorescence in the nuclear area (thin line), in comparison with the average change in whole-cellRh123 fluorescence (dotted line; may appear as a thicker line because of the 0.1 Hz image acquisition frequency). In eachindividual experiment, 20 – 40 random single cells were analyzed; only 10 are shown for clarity but are representative of n � 3independent experiments. See Results for a detailed description of the individual tracings.
Oliveira et al. • Mitochondrial-Dependent Ca2� Handling in HD Models J. Neurosci., October 25, 2006 • 26(43):11174 –11186 • 11177
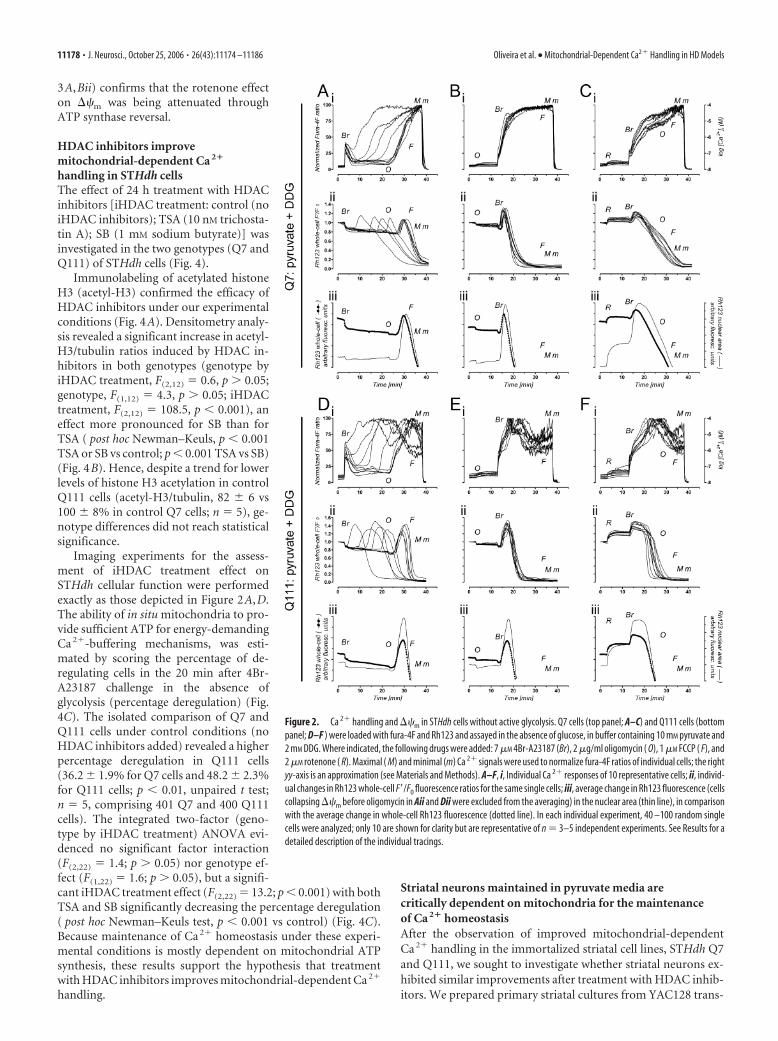
3A,Bii) confirms that the rotenone effecton ��m was being attenuated throughATP synthase reversal.
HDAC inhibitors improvemitochondrial-dependent Ca 2�
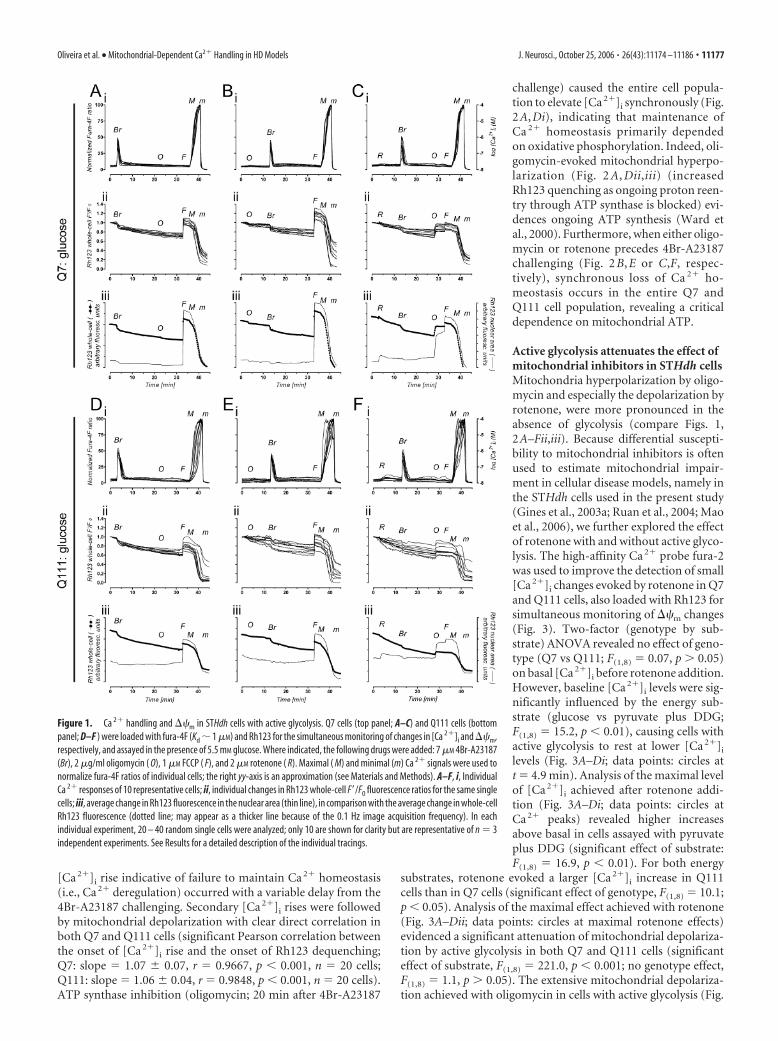
handling in STHdh cellsThe effect of 24 h treatment with HDACinhibitors [iHDAC treatment: control (noiHDAC inhibitors); TSA (10 nM trichosta-tin A); SB (1 mM sodium butyrate)] wasinvestigated in the two genotypes (Q7 andQ111) of STHdh cells (Fig. 4).
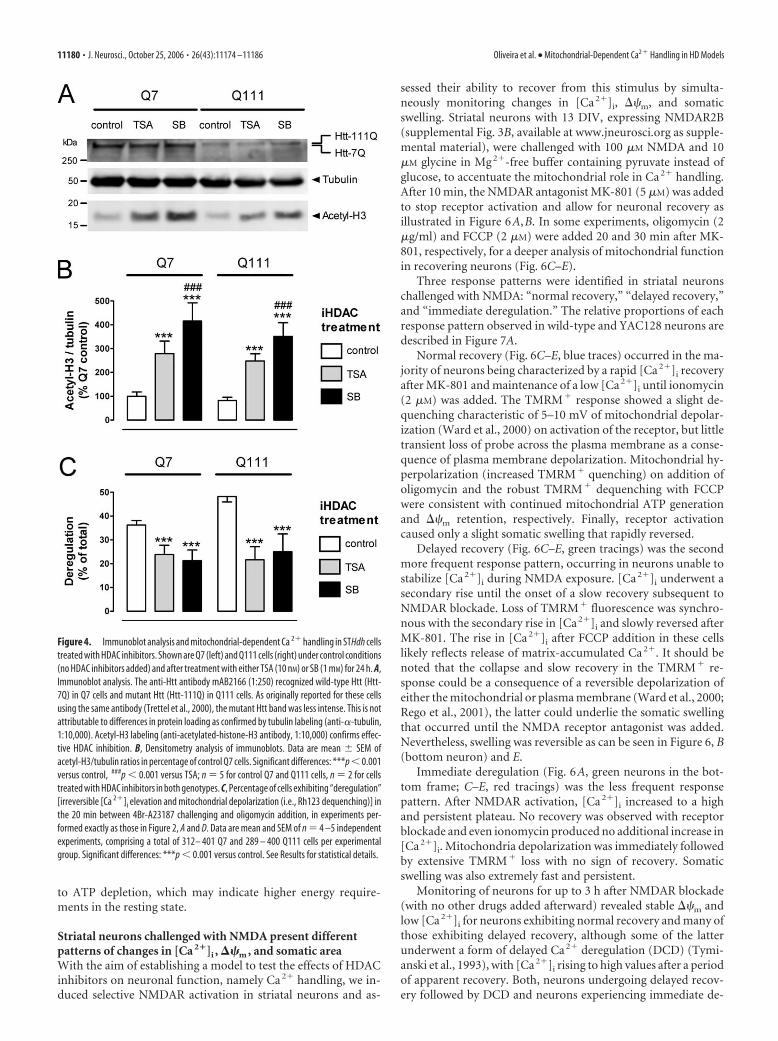
Immunolabeling of acetylated histoneH3 (acetyl-H3) confirmed the efficacy ofHDAC inhibitors under our experimentalconditions (Fig. 4A). Densitometry analy-sis revealed a significant increase in acetyl-H3/tubulin ratios induced by HDAC in-hibitors in both genotypes (genotype byiHDAC treatment, F(2,12) � 0.6, p � 0.05;genotype, F(1,12) � 4.3, p � 0.05; iHDACtreatment, F(2,12) � 108.5, p � 0.001), aneffect more pronounced for SB than forTSA ( post hoc Newman–Keuls, p � 0.001TSA or SB vs control; p � 0.001 TSA vs SB)(Fig. 4B). Hence, despite a trend for lowerlevels of histone H3 acetylation in controlQ111 cells (acetyl-H3/tubulin, 82 6 vs100 8% in control Q7 cells; n � 5), ge-notype differences did not reach statisticalsignificance.
Imaging experiments for the assess-ment of iHDAC treatment effect onSTHdh cellular function were performedexactly as those depicted in Figure 2A,D.The ability of in situ mitochondria to pro-vide sufficient ATP for energy-demandingCa 2�-buffering mechanisms, was esti-mated by scoring the percentage of de-regulating cells in the 20 min after 4Br-A23187 challenge in the absence ofglycolysis (percentage deregulation) (Fig.4C). The isolated comparison of Q7 andQ111 cells under control conditions (noHDAC inhibitors added) revealed a higherpercentage deregulation in Q111 cells(36.2 1.9% for Q7 cells and 48.2 2.3%for Q111 cells; p � 0.01, unpaired t test;n � 5, comprising 401 Q7 and 400 Q111cells). The integrated two-factor (geno-type by iHDAC treatment) ANOVA evi-denced no significant factor interaction(F(2,22) � 1.4; p � 0.05) nor genotype ef-fect (F(1,22) � 1.6; p � 0.05), but a signifi-cant iHDAC treatment effect (F(2,22) � 13.2; p � 0.001) with bothTSA and SB significantly decreasing the percentage deregulation( post hoc Newman–Keuls test, p � 0.001 vs control) (Fig. 4C).Because maintenance of Ca 2� homeostasis under these experi-mental conditions is mostly dependent on mitochondrial ATPsynthesis, these results support the hypothesis that treatmentwith HDAC inhibitors improves mitochondrial-dependent Ca 2�
handling.
Striatal neurons maintained in pyruvate media arecritically dependent on mitochondria for the maintenanceof Ca 2� homeostasisAfter the observation of improved mitochondrial-dependentCa 2� handling in the immortalized striatal cell lines, STHdh Q7and Q111, we sought to investigate whether striatal neurons ex-hibited similar improvements after treatment with HDAC inhib-itors. We prepared primary striatal cultures from YAC128 trans-
Figure 2. Ca 2� handling and ��m in STHdh cells without active glycolysis. Q7 cells (top panel; A–C) and Q111 cells (bottompanel; D–F ) were loaded with fura-4F and Rh123 and assayed in the absence of glucose, in buffer containing 10 mM pyruvate and2 mM DDG. Where indicated, the following drugs were added: 7 �M 4Br-A23187 (Br), 2 �g/ml oligomycin ( O), 1 �M FCCP ( F), and2 �M rotenone ( R). Maximal ( M) and minimal (m) Ca 2� signals were used to normalize fura-4F ratios of individual cells; the rightyy-axis is an approximation (see Materials and Methods). A–F, i, Individual Ca 2� responses of 10 representative cells; ii, individ-ual changes in Rh123 whole-cell F�/F0 fluorescence ratios for the same single cells; iii, average change in Rh123 fluorescence (cellscollapsing ��m before oligomycin in Aii and Dii were excluded from the averaging) in the nuclear area (thin line), in comparisonwith the average change in whole-cell Rh123 fluorescence (dotted line). In each individual experiment, 40 –100 random singlecells were analyzed; only 10 are shown for clarity but are representative of n � 3–5 independent experiments. See Results for adetailed description of the individual tracings.
11178 • J. Neurosci., October 25, 2006 • 26(43):11174 –11186 Oliveira et al. • Mitochondrial-Dependent Ca2� Handling in HD Models
genic mice (expressing full-length mutant Htt) and from theirwild-type littermates (supplemental Fig. 3B, available at www.jneurosci.org as supplemental material). Because of limited gly-cogen availability in neurons (Brown, 2004), replacement of glu-cose with pyruvate alone should suffice to render neurons criti-cally dependent on mitochondria for Ca 2� handling (Nicholls,2004). To verify this assumption, we challenged striatal neuronswith mitochondrial inhibitors and monitored the subsequentchanges in [Ca 2�]i, ��m, and somatic swelling (Fig. 5; supple-mental Fig. 2, available at www.jneurosci.org as supplementalmaterial).
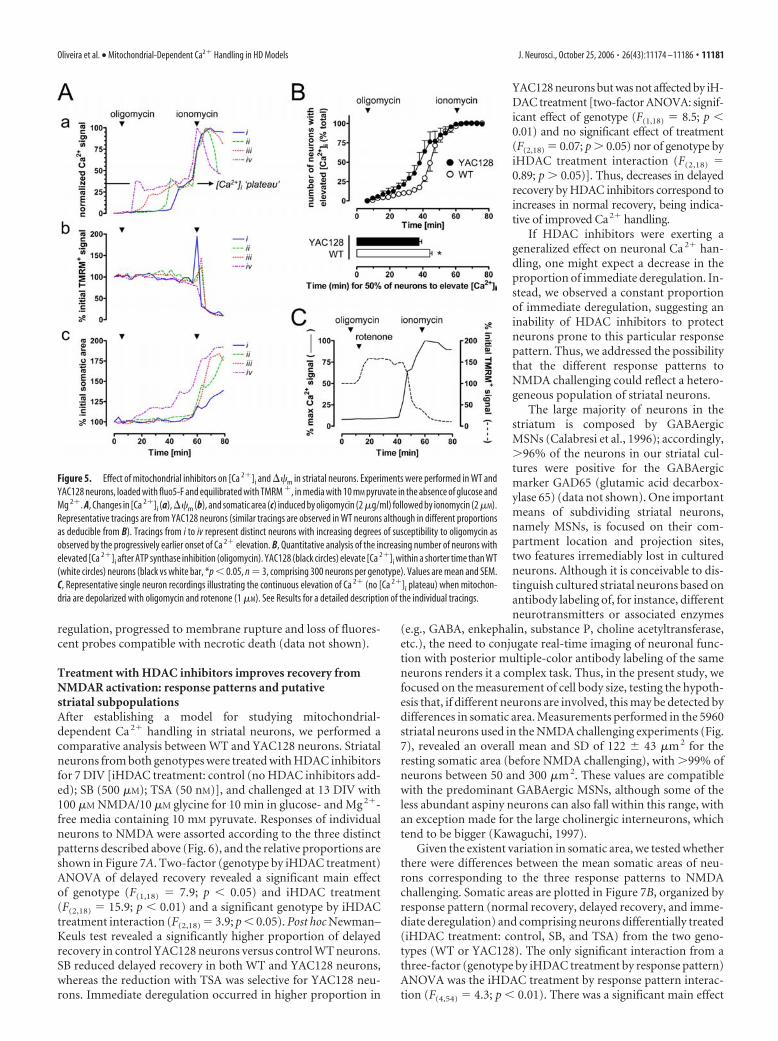
If for pyruvate-maintained neurons mitochondrial function isin fact critical, ATP synthase inhibition should lead to cell failure.Indeed, after oligomycin (2 �g/ml) addition, striatal neuronsstarted to elevate [Ca 2�]i (Fig. 5Aa). This is a likely consequenceof cellular ATP depletion and failure of Na�/K�-ATPases.Plasma membrane depolarization and activation of voltage-dependent Ca 2� channels initiate net Ca 2� uptake by the cellwith the failure of Ca 2�-ATPases also contributing to elevate[Ca 2�]i. Using ionomycin (2 �M) to establish maximal Ca 2�
responses, we scored neurons as having “elevated [Ca 2�]i” whenthe fluo-5F fluorescence surpassed 10% of the ionomycin re-sponse (equivalent to a [Ca 2�]i increase �250 nM). The increas-ing number of wild-type (WT) or YAC128 neurons with elevated[Ca 2�]i after exposure to oligomycin was plotted as a function oftime (Fig. 5B). Meaningfully, [Ca 2�]i elevation in the presence of
oligomycin occurred sooner for YAC128 neurons than for wild-type neurons ( p � 0.05) (Fig. 5B).
Interestingly, [Ca 2�]i elevation in oligomycin-exposed neu-rons was biphasic (Fig. 5Aa). After a variable delay, the Ca 2�
signal increased to a [Ca 2�]i “plateau” where it was maintaineduntil cytoplasmic Ca 2� deregulation occurred (Fig. 5Aa, trace iv)or ionomycin was added, leading to mitochondrial depolariza-tion (TMRM� dequenching) and pronounced somatic swelling(Fig. 5Ab,c). Based on the Kd for fluo-5F, the [Ca 2�]i plateau isclose to 1 �M, consistent with the cytoplasmic set point main-tained by Ca 2�-accumulating mitochondria (Nicholls and Budd,2000). Indeed, in oligomycin-treated neurons, mitochondria re-main polarized (steady TMRM� signal) (Fig. 5Ab) and thus ableto accumulate Ca 2�. Additional confirmation for the [Ca 2�]i
plateau being maintained by mitochondria arises from the obser-vation that no [Ca 2�]i plateau is observed when mitochondriaare extensively depolarized by the combination of oligomycinand rotenone (1 �M). This combination leads to pronouncedTMRM� dequenching and the [Ca 2�]i elevation that follows isnot interrupted by a plateau, coinciding with TMRM� reequili-bration across the depolarized plasma membrane (Fig. 5C).
Together, these results demonstrate that under our experi-mental conditions striatal neurons are critically dependent onmitochondrial ATP synthesis and Ca 2� uptake for the mainte-nance of cytoplasmic Ca 2� homeostasis. These results also revealthat YAC128 neurons are more sensitive than wild-type neurons
Figure 3. Comparative effect of mitochondrial inhibitors on [Ca 2�]i and ��m of STHdh cells with or without active glycolysis. Q7 cells (A, C) and Q111 cells (B, D) were loaded with fura-2 (Kd �0.16 �M) and Rh123 and assayed either in the presence of 5.5 mM glucose (left panel; A, B) or in the absence of glucose, in buffer containing 10 mM pyruvate and 2 mM DDG (right panel; C, D). Changesin fura-2 and Rh123 fluorescence, indicative of [Ca 2�]i and ��m, respectively, were simultaneously imaged in single cells. The following drugs were added sequentially where indicated: 2 �M
rotenone ( R), 2 �g/ml oligomycin ( O), and 1 �M FCCP ( F). Maximal and minimal Ca 2� signals (data not shown) were determined at t � 55 and 60 min, respectively, and used to normalize fura-2ratios of individual cells (see Materials and Methods). A–D, i, Average changes in [Ca 2�]i (the left yy-axis spans only up to 40 U for clarity; fura-2 saturated with Ca 2� corresponds to 100 U; the rightyy-axis is an approximation as described in Materials and Methods); ii, average changes in Rh123 fluorescence monitored in the nuclear area. Tracings represent the average of n � 3 independentexperiments. In each experiment, the individual responses from 20 to 40 random cells were averaged to provide n � 1. Data points used in statistical analysis are highlighted by circles (white, Q7cells; black, Q111 cells) with SD error bars (bars smaller than circle radius are not visible). Significant differences: *p � 0.05 between genotype (Q7 vs Q111) at same substrate (glucose vs pyruvateplus DDG); ##p � 0.01, ###p � 0.001 between substrates at same genotype. See Results for a detailed description of the individual tracings and statistics.
Oliveira et al. • Mitochondrial-Dependent Ca2� Handling in HD Models J. Neurosci., October 25, 2006 • 26(43):11174 –11186 • 11179
to ATP depletion, which may indicate higher energy require-ments in the resting state.
Striatal neurons challenged with NMDA present differentpatterns of changes in [Ca 2�]i , ��m , and somatic areaWith the aim of establishing a model to test the effects of HDACinhibitors on neuronal function, namely Ca 2� handling, we in-duced selective NMDAR activation in striatal neurons and as-
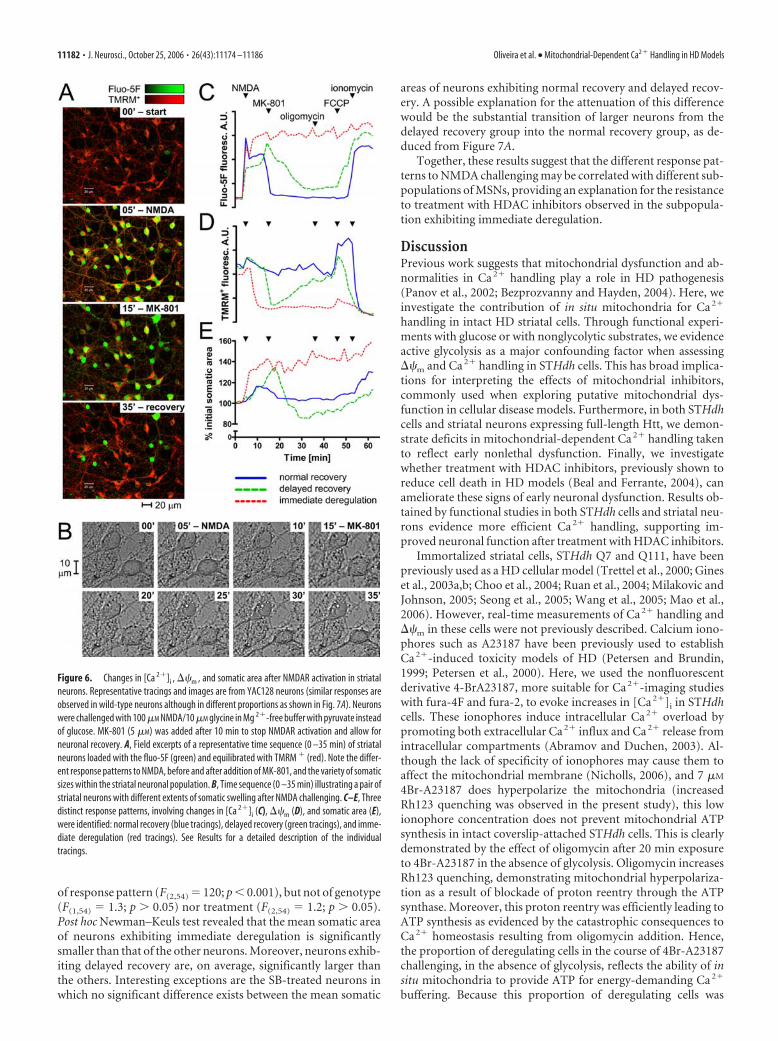
sessed their ability to recover from this stimulus by simulta-neously monitoring changes in [Ca 2�]i, ��m, and somaticswelling. Striatal neurons with 13 DIV, expressing NMDAR2B(supplemental Fig. 3B, available at www.jneurosci.org as supple-mental material), were challenged with 100 �M NMDA and 10�M glycine in Mg 2�-free buffer containing pyruvate instead ofglucose, to accentuate the mitochondrial role in Ca 2� handling.After 10 min, the NMDAR antagonist MK-801 (5 �M) was addedto stop receptor activation and allow for neuronal recovery asillustrated in Figure 6A,B. In some experiments, oligomycin (2�g/ml) and FCCP (2 �M) were added 20 and 30 min after MK-801, respectively, for a deeper analysis of mitochondrial functionin recovering neurons (Fig. 6C–E).
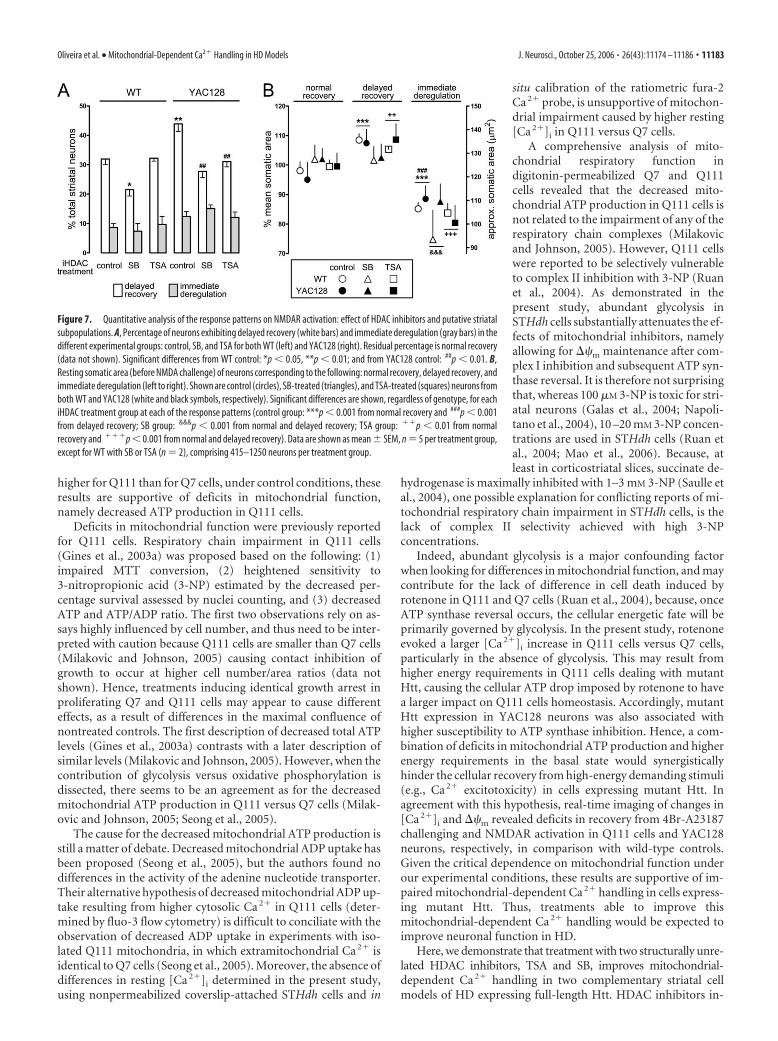
Three response patterns were identified in striatal neuronschallenged with NMDA: “normal recovery,” “delayed recovery,”and “immediate deregulation.” The relative proportions of eachresponse pattern observed in wild-type and YAC128 neurons aredescribed in Figure 7A.
Normal recovery (Fig. 6C–E, blue traces) occurred in the ma-jority of neurons being characterized by a rapid [Ca 2�]i recoveryafter MK-801 and maintenance of a low [Ca 2�]i until ionomycin(2 �M) was added. The TMRM� response showed a slight de-quenching characteristic of 5–10 mV of mitochondrial depolar-ization (Ward et al., 2000) on activation of the receptor, but littletransient loss of probe across the plasma membrane as a conse-quence of plasma membrane depolarization. Mitochondrial hy-perpolarization (increased TMRM� quenching) on addition ofoligomycin and the robust TMRM� dequenching with FCCPwere consistent with continued mitochondrial ATP generationand ��m retention, respectively. Finally, receptor activationcaused only a slight somatic swelling that rapidly reversed.
Delayed recovery (Fig. 6C–E, green tracings) was the secondmore frequent response pattern, occurring in neurons unable tostabilize [Ca 2�]i during NMDA exposure. [Ca 2�]i underwent asecondary rise until the onset of a slow recovery subsequent toNMDAR blockade. Loss of TMRM� fluorescence was synchro-nous with the secondary rise in [Ca 2�]i and slowly reversed afterMK-801. The rise in [Ca 2�]i after FCCP addition in these cellslikely reflects release of matrix-accumulated Ca 2�. It should benoted that the collapse and slow recovery in the TMRM� re-sponse could be a consequence of a reversible depolarization ofeither the mitochondrial or plasma membrane (Ward et al., 2000;Rego et al., 2001), the latter could underlie the somatic swellingthat occurred until the NMDA receptor antagonist was added.Nevertheless, swelling was reversible as can be seen in Figure 6, B(bottom neuron) and E.
Immediate deregulation (Fig. 6A, green neurons in the bot-tom frame; C–E, red tracings) was the less frequent responsepattern. After NMDAR activation, [Ca 2�]i increased to a highand persistent plateau. No recovery was observed with receptorblockade and even ionomycin produced no additional increase in[Ca 2�]i. Mitochondria depolarization was immediately followedby extensive TMRM� loss with no sign of recovery. Somaticswelling was also extremely fast and persistent.
Monitoring of neurons for up to 3 h after NMDAR blockade(with no other drugs added afterward) revealed stable ��m andlow [Ca 2�]i for neurons exhibiting normal recovery and many ofthose exhibiting delayed recovery, although some of the latterunderwent a form of delayed Ca 2� deregulation (DCD) (Tymi-anski et al., 1993), with [Ca 2�]i rising to high values after a periodof apparent recovery. Both, neurons undergoing delayed recov-ery followed by DCD and neurons experiencing immediate de-
Figure 4. Immunoblot analysis and mitochondrial-dependent Ca 2� handling in STHdh cellstreated with HDAC inhibitors. Shown are Q7 (left) and Q111 cells (right) under control conditions(no HDAC inhibitors added) and after treatment with either TSA (10 nM) or SB (1 mM) for 24 h. A,Immunoblot analysis. The anti-Htt antibody mAB2166 (1:250) recognized wild-type Htt (Htt-7Q) in Q7 cells and mutant Htt (Htt-111Q) in Q111 cells. As originally reported for these cellsusing the same antibody (Trettel et al., 2000), the mutant Htt band was less intense. This is notattributable to differences in protein loading as confirmed by tubulin labeling (anti-�-tubulin,1:10,000). Acetyl-H3 labeling (anti-acetylated-histone-H3 antibody, 1:10,000) confirms effec-tive HDAC inhibition. B, Densitometry analysis of immunoblots. Data are mean SEM ofacetyl-H3/tubulin ratios in percentage of control Q7 cells. Significant differences: ***p � 0.001versus control, ###p � 0.001 versus TSA; n � 5 for control Q7 and Q111 cells, n � 2 for cellstreated with HDAC inhibitors in both genotypes. C, Percentage of cells exhibiting “deregulation”[irreversible [Ca 2�]i elevation and mitochondrial depolarization (i.e., Rh123 dequenching)] inthe 20 min between 4Br-A23187 challenging and oligomycin addition, in experiments per-formed exactly as those in Figure 2, A and D. Data are mean and SEM of n � 4 –5 independentexperiments, comprising a total of 312– 401 Q7 and 289 – 400 Q111 cells per experimentalgroup. Significant differences: ***p � 0.001 versus control. See Results for statistical details.
11180 • J. Neurosci., October 25, 2006 • 26(43):11174 –11186 Oliveira et al. • Mitochondrial-Dependent Ca2� Handling in HD Models
regulation, progressed to membrane rupture and loss of fluores-cent probes compatible with necrotic death (data not shown).
Treatment with HDAC inhibitors improves recovery fromNMDAR activation: response patterns and putativestriatal subpopulationsAfter establishing a model for studying mitochondrial-dependent Ca 2� handling in striatal neurons, we performed acomparative analysis between WT and YAC128 neurons. Striatalneurons from both genotypes were treated with HDAC inhibitorsfor 7 DIV [iHDAC treatment: control (no HDAC inhibitors add-ed); SB (500 �M); TSA (50 nM)], and challenged at 13 DIV with100 �M NMDA/10 �M glycine for 10 min in glucose- and Mg 2�-free media containing 10 mM pyruvate. Responses of individualneurons to NMDA were assorted according to the three distinctpatterns described above (Fig. 6), and the relative proportions areshown in Figure 7A. Two-factor (genotype by iHDAC treatment)ANOVA of delayed recovery revealed a significant main effectof genotype (F(1,18) � 7.9; p � 0.05) and iHDAC treatment(F(2,18) � 15.9; p � 0.01) and a significant genotype by iHDACtreatment interaction (F(2,18) � 3.9; p � 0.05). Post hoc Newman–Keuls test revealed a significantly higher proportion of delayedrecovery in control YAC128 neurons versus control WT neurons.SB reduced delayed recovery in both WT and YAC128 neurons,whereas the reduction with TSA was selective for YAC128 neu-rons. Immediate deregulation occurred in higher proportion in
YAC128 neurons but was not affected by iH-DAC treatment [two-factor ANOVA: signif-icant effect of genotype (F(1,18) � 8.5; p �0.01) and no significant effect of treatment(F(2,18) � 0.07; p � 0.05) nor of genotype byiHDAC treatment interaction (F(2,18) �0.89; p � 0.05)]. Thus, decreases in delayedrecovery by HDAC inhibitors correspond toincreases in normal recovery, being indica-tive of improved Ca2� handling.
If HDAC inhibitors were exerting ageneralized effect on neuronal Ca 2� han-dling, one might expect a decrease in theproportion of immediate deregulation. In-stead, we observed a constant proportionof immediate deregulation, suggesting aninability of HDAC inhibitors to protectneurons prone to this particular responsepattern. Thus, we addressed the possibilitythat the different response patterns toNMDA challenging could reflect a hetero-geneous population of striatal neurons.
The large majority of neurons in thestriatum is composed by GABAergicMSNs (Calabresi et al., 1996); accordingly,�96% of the neurons in our striatal cul-tures were positive for the GABAergicmarker GAD65 (glutamic acid decarbox-ylase 65) (data not shown). One importantmeans of subdividing striatal neurons,namely MSNs, is focused on their com-partment location and projection sites,two features irremediably lost in culturedneurons. Although it is conceivable to dis-tinguish cultured striatal neurons based onantibody labeling of, for instance, differentneurotransmitters or associated enzymes
(e.g., GABA, enkephalin, substance P, choline acetyltransferase,etc.), the need to conjugate real-time imaging of neuronal func-tion with posterior multiple-color antibody labeling of the sameneurons renders it a complex task. Thus, in the present study, wefocused on the measurement of cell body size, testing the hypoth-esis that, if different neurons are involved, this may be detected bydifferences in somatic area. Measurements performed in the 5960striatal neurons used in the NMDA challenging experiments (Fig.7), revealed an overall mean and SD of 122 43 �m 2 for theresting somatic area (before NMDA challenging), with �99% ofneurons between 50 and 300 �m 2. These values are compatiblewith the predominant GABAergic MSNs, although some of theless abundant aspiny neurons can also fall within this range, withan exception made for the large cholinergic interneurons, whichtend to be bigger (Kawaguchi, 1997).
Given the existent variation in somatic area, we tested whetherthere were differences between the mean somatic areas of neu-rons corresponding to the three response patterns to NMDAchallenging. Somatic areas are plotted in Figure 7B, organized byresponse pattern (normal recovery, delayed recovery, and imme-diate deregulation) and comprising neurons differentially treated(iHDAC treatment: control, SB, and TSA) from the two geno-types (WT or YAC128). The only significant interaction from athree-factor (genotype by iHDAC treatment by response pattern)ANOVA was the iHDAC treatment by response pattern interac-tion (F(4,54) � 4.3; p � 0.01). There was a significant main effect
Figure 5. Effect of mitochondrial inhibitors on [Ca 2�]i and ��m in striatal neurons. Experiments were performed in WT andYAC128 neurons, loaded with fluo5-F and equilibrated with TMRM �, in media with 10 mM pyruvate in the absence of glucose andMg 2�. A, Changes in [Ca 2�]i (a),��m (b), and somatic area (c) induced by oligomycin (2 �g/ml) followed by ionomycin (2 �M).Representative tracings are from YAC128 neurons (similar tracings are observed in WT neurons although in different proportionsas deducible from B). Tracings from i to iv represent distinct neurons with increasing degrees of susceptibility to oligomycin asobserved by the progressively earlier onset of Ca 2� elevation. B, Quantitative analysis of the increasing number of neurons withelevated [Ca 2�]i after ATP synthase inhibition (oligomycin). YAC128 (black circles) elevate [Ca 2�]i within a shorter time than WT(white circles) neurons (black vs white bar, *p � 0.05, n � 3, comprising 300 neurons per genotype). Values are mean and SEM.C, Representative single neuron recordings illustrating the continuous elevation of Ca 2� (no [Ca 2�]i plateau) when mitochon-dria are depolarized with oligomycin and rotenone (1 �M). See Results for a detailed description of the individual tracings.
Oliveira et al. • Mitochondrial-Dependent Ca2� Handling in HD Models J. Neurosci., October 25, 2006 • 26(43):11174 –11186 • 11181
of response pattern (F(2,54) � 120; p � 0.001), but not of genotype(F(1,54) � 1.3; p � 0.05) nor treatment (F(2,54) � 1.2; p � 0.05).Post hoc Newman–Keuls test revealed that the mean somatic areaof neurons exhibiting immediate deregulation is significantlysmaller than that of the other neurons. Moreover, neurons exhib-iting delayed recovery are, on average, significantly larger thanthe others. Interesting exceptions are the SB-treated neurons inwhich no significant difference exists between the mean somatic
areas of neurons exhibiting normal recovery and delayed recov-ery. A possible explanation for the attenuation of this differencewould be the substantial transition of larger neurons from thedelayed recovery group into the normal recovery group, as de-duced from Figure 7A.
Together, these results suggest that the different response pat-terns to NMDA challenging may be correlated with different sub-populations of MSNs, providing an explanation for the resistanceto treatment with HDAC inhibitors observed in the subpopula-tion exhibiting immediate deregulation.
DiscussionPrevious work suggests that mitochondrial dysfunction and ab-normalities in Ca 2� handling play a role in HD pathogenesis(Panov et al., 2002; Bezprozvanny and Hayden, 2004). Here, weinvestigate the contribution of in situ mitochondria for Ca 2�
handling in intact HD striatal cells. Through functional experi-ments with glucose or with nonglycolytic substrates, we evidenceactive glycolysis as a major confounding factor when assessing��m and Ca 2� handling in STHdh cells. This has broad implica-tions for interpreting the effects of mitochondrial inhibitors,commonly used when exploring putative mitochondrial dys-function in cellular disease models. Furthermore, in both STHdhcells and striatal neurons expressing full-length Htt, we demon-strate deficits in mitochondrial-dependent Ca 2� handling takento reflect early nonlethal dysfunction. Finally, we investigatewhether treatment with HDAC inhibitors, previously shown toreduce cell death in HD models (Beal and Ferrante, 2004), canameliorate these signs of early neuronal dysfunction. Results ob-tained by functional studies in both STHdh cells and striatal neu-rons evidence more efficient Ca 2� handling, supporting im-proved neuronal function after treatment with HDAC inhibitors.
Immortalized striatal cells, STHdh Q7 and Q111, have beenpreviously used as a HD cellular model (Trettel et al., 2000; Gineset al., 2003a,b; Choo et al., 2004; Ruan et al., 2004; Milakovic andJohnson, 2005; Seong et al., 2005; Wang et al., 2005; Mao et al.,2006). However, real-time measurements of Ca 2� handling and��m in these cells were not previously described. Calcium iono-phores such as A23187 have been previously used to establishCa 2�-induced toxicity models of HD (Petersen and Brundin,1999; Petersen et al., 2000). Here, we used the nonfluorescentderivative 4-BrA23187, more suitable for Ca 2�-imaging studieswith fura-4F and fura-2, to evoke increases in [Ca 2�]i in STHdhcells. These ionophores induce intracellular Ca 2� overload bypromoting both extracellular Ca 2� influx and Ca 2� release fromintracellular compartments (Abramov and Duchen, 2003). Al-though the lack of specificity of ionophores may cause them toaffect the mitochondrial membrane (Nicholls, 2006), and 7 �M
4Br-A23187 does hyperpolarize the mitochondria (increasedRh123 quenching was observed in the present study), this lowionophore concentration does not prevent mitochondrial ATPsynthesis in intact coverslip-attached STHdh cells. This is clearlydemonstrated by the effect of oligomycin after 20 min exposureto 4Br-A23187 in the absence of glycolysis. Oligomycin increasesRh123 quenching, demonstrating mitochondrial hyperpolariza-tion as a result of blockade of proton reentry through the ATPsynthase. Moreover, this proton reentry was efficiently leading toATP synthesis as evidenced by the catastrophic consequences toCa 2� homeostasis resulting from oligomycin addition. Hence,the proportion of deregulating cells in the course of 4Br-A23187challenging, in the absence of glycolysis, reflects the ability of insitu mitochondria to provide ATP for energy-demanding Ca 2�
buffering. Because this proportion of deregulating cells was
Figure 6. Changes in [Ca 2�]i , ��m , and somatic area after NMDAR activation in striatalneurons. Representative tracings and images are from YAC128 neurons (similar responses areobserved in wild-type neurons although in different proportions as shown in Fig. 7A). Neuronswere challenged with 100 �M NMDA/10 �M glycine in Mg 2�-free buffer with pyruvate insteadof glucose. MK-801 (5 �M) was added after 10 min to stop NMDAR activation and allow forneuronal recovery. A, Field excerpts of a representative time sequence (0 –35 min) of striatalneurons loaded with the fluo-5F (green) and equilibrated with TMRM � (red). Note the differ-ent response patterns to NMDA, before and after addition of MK-801, and the variety of somaticsizes within the striatal neuronal population. B, Time sequence (0 –35 min) illustrating a pair ofstriatal neurons with different extents of somatic swelling after NMDA challenging. C–E, Threedistinct response patterns, involving changes in [Ca 2�]i (C), ��m (D), and somatic area (E),were identified: normal recovery (blue tracings), delayed recovery (green tracings), and imme-diate deregulation (red tracings). See Results for a detailed description of the individualtracings.
11182 • J. Neurosci., October 25, 2006 • 26(43):11174 –11186 Oliveira et al. • Mitochondrial-Dependent Ca2� Handling in HD Models
higher for Q111 than for Q7 cells, under control conditions, theseresults are supportive of deficits in mitochondrial function,namely decreased ATP production in Q111 cells.
Deficits in mitochondrial function were previously reportedfor Q111 cells. Respiratory chain impairment in Q111 cells(Gines et al., 2003a) was proposed based on the following: (1)impaired MTT conversion, (2) heightened sensitivity to3-nitropropionic acid (3-NP) estimated by the decreased per-centage survival assessed by nuclei counting, and (3) decreasedATP and ATP/ADP ratio. The first two observations rely on as-says highly influenced by cell number, and thus need to be inter-preted with caution because Q111 cells are smaller than Q7 cells(Milakovic and Johnson, 2005) causing contact inhibition ofgrowth to occur at higher cell number/area ratios (data notshown). Hence, treatments inducing identical growth arrest inproliferating Q7 and Q111 cells may appear to cause differenteffects, as a result of differences in the maximal confluence ofnontreated controls. The first description of decreased total ATPlevels (Gines et al., 2003a) contrasts with a later description ofsimilar levels (Milakovic and Johnson, 2005). However, when thecontribution of glycolysis versus oxidative phosphorylation isdissected, there seems to be an agreement as for the decreasedmitochondrial ATP production in Q111 versus Q7 cells (Milak-ovic and Johnson, 2005; Seong et al., 2005).
The cause for the decreased mitochondrial ATP production isstill a matter of debate. Decreased mitochondrial ADP uptake hasbeen proposed (Seong et al., 2005), but the authors found nodifferences in the activity of the adenine nucleotide transporter.Their alternative hypothesis of decreased mitochondrial ADP up-take resulting from higher cytosolic Ca 2� in Q111 cells (deter-mined by fluo-3 flow cytometry) is difficult to conciliate with theobservation of decreased ADP uptake in experiments with iso-lated Q111 mitochondria, in which extramitochondrial Ca 2� isidentical to Q7 cells (Seong et al., 2005). Moreover, the absence ofdifferences in resting [Ca 2�]i determined in the present study,using nonpermeabilized coverslip-attached STHdh cells and in
situ calibration of the ratiometric fura-2Ca 2� probe, is unsupportive of mitochon-drial impairment caused by higher resting[Ca 2�]i in Q111 versus Q7 cells.
A comprehensive analysis of mito-chondrial respiratory function indigitonin-permeabilized Q7 and Q111cells revealed that the decreased mito-chondrial ATP production in Q111 cells isnot related to the impairment of any of therespiratory chain complexes (Milakovicand Johnson, 2005). However, Q111 cellswere reported to be selectively vulnerableto complex II inhibition with 3-NP (Ruanet al., 2004). As demonstrated in thepresent study, abundant glycolysis inSTHdh cells substantially attenuates the ef-fects of mitochondrial inhibitors, namelyallowing for ��m maintenance after com-plex I inhibition and subsequent ATP syn-thase reversal. It is therefore not surprisingthat, whereas 100 �M 3-NP is toxic for stri-atal neurons (Galas et al., 2004; Napoli-tano et al., 2004), 10 –20 mM 3-NP concen-trations are used in STHdh cells (Ruan etal., 2004; Mao et al., 2006). Because, atleast in corticostriatal slices, succinate de-
hydrogenase is maximally inhibited with 1–3 mM 3-NP (Saulle etal., 2004), one possible explanation for conflicting reports of mi-tochondrial respiratory chain impairment in STHdh cells, is thelack of complex II selectivity achieved with high 3-NPconcentrations.
Indeed, abundant glycolysis is a major confounding factorwhen looking for differences in mitochondrial function, and maycontribute for the lack of difference in cell death induced byrotenone in Q111 and Q7 cells (Ruan et al., 2004), because, onceATP synthase reversal occurs, the cellular energetic fate will beprimarily governed by glycolysis. In the present study, rotenoneevoked a larger [Ca 2�]i increase in Q111 cells versus Q7 cells,particularly in the absence of glycolysis. This may result fromhigher energy requirements in Q111 cells dealing with mutantHtt, causing the cellular ATP drop imposed by rotenone to havea larger impact on Q111 cells homeostasis. Accordingly, mutantHtt expression in YAC128 neurons was also associated withhigher susceptibility to ATP synthase inhibition. Hence, a com-bination of deficits in mitochondrial ATP production and higherenergy requirements in the basal state would synergisticallyhinder the cellular recovery from high-energy demanding stimuli(e.g., Ca 2� excitotoxicity) in cells expressing mutant Htt. Inagreement with this hypothesis, real-time imaging of changes in[Ca 2�]i and ��m revealed deficits in recovery from 4Br-A23187challenging and NMDAR activation in Q111 cells and YAC128neurons, respectively, in comparison with wild-type controls.Given the critical dependence on mitochondrial function underour experimental conditions, these results are supportive of im-paired mitochondrial-dependent Ca 2� handling in cells express-ing mutant Htt. Thus, treatments able to improve thismitochondrial-dependent Ca 2� handling would be expected toimprove neuronal function in HD.
Here, we demonstrate that treatment with two structurally unre-lated HDAC inhibitors, TSA and SB, improves mitochondrial-dependent Ca 2� handling in two complementary striatal cellmodels of HD expressing full-length Htt. HDAC inhibitors in-
Figure 7. Quantitative analysis of the response patterns on NMDAR activation: effect of HDAC inhibitors and putative striatalsubpopulations. A, Percentage of neurons exhibiting delayed recovery (white bars) and immediate deregulation (gray bars) in thedifferent experimental groups: control, SB, and TSA for both WT (left) and YAC128 (right). Residual percentage is normal recovery(data not shown). Significant differences from WT control: *p � 0.05, **p � 0.01; and from YAC128 control: ##p � 0.01. B,Resting somatic area (before NMDA challenge) of neurons corresponding to the following: normal recovery, delayed recovery, andimmediate deregulation (left to right). Shown are control (circles), SB-treated (triangles), and TSA-treated (squares) neurons fromboth WT and YAC128 (white and black symbols, respectively). Significant differences are shown, regardless of genotype, for eachiHDAC treatment group at each of the response patterns (control group: ***p � 0.001 from normal recovery and ###p � 0.001from delayed recovery; SB group: &&&p � 0.001 from normal and delayed recovery; TSA group: ��p � 0.01 from normalrecovery and ���p � 0.001 from normal and delayed recovery). Data are shown as mean SEM, n � 5 per treatment group,except for WT with SB or TSA (n � 2), comprising 415–1250 neurons per treatment group.
Oliveira et al. • Mitochondrial-Dependent Ca2� Handling in HD Models J. Neurosci., October 25, 2006 • 26(43):11174 –11186 • 11183
creased histone H3 acetylation, evidencing effective HDAC inhi-bition in our study. The lack of differences in basal histone H3acetylation between cells expressing full-length mutant Htt andcells expressing wild-type Htt is consistent with no large geneexpression changes in early HD pathogenesis modeled with full-length Htt (Chan et al., 2002). Still, in the absence of differencesin basal histone acetylation, the effects of HDAC inhibitors in thepresent study cannot simply be ascribed to the reestablishment ofhistone acetylation levels. This does not implicate that such rees-tablishment does not play a role in the protective effects of HDACinhibitors, particularly in models of advanced HD exhibiting re-duced histone acetylation levels (Steffan et al., 2000). However,beyond the simple restoration of “normal” gene expression lev-els, HDAC inhibitors may act to enhance the expression of genesand proteins that exert therapeutically useful effects on neuronalfunction. In agreement with this hypothesis, HDAC inhibitorsimproved mitochondrial-dependent Ca 2� handling also in cellsthat do not express mutant Htt. The only exception was the lackof effect of TSA over wild-type striatal neurons. Possibly, theextent of gene/protein changes evoked by TSA in striatal neuronswas smaller than that evoked by SB, in agreement with TSA af-fecting 10 times less genes than SB in colon cells (Mariadason etal., 2000). Moreover, small changes in gene expression inducedby TSA in striatal neurons may only be relevant when Ca 2� han-dling is impaired as in the case of YAC128 neurons.
The precise identification of the key gene and protein expres-sion changes associated with the neuroprotective effects ofHDAC inhibitors is likely to be complex and is beyond the scopeof the present study, focused on the functional consequences ofthe treatment in HD cells exhibiting early signs of dysfunction.Nevertheless, microarray screens targeted at key genes involvedin mitochondrial function and Ca 2� homeostasis are currentlybeing conducted (our unpublished data). In addition to the func-tional data gathered in the present study, previous evidences sup-port improved mitochondrial function and/or protection fromexcitotoxicity after treatment with HDAC inhibitors. Neuronaldeath induced by mitochondrial complex II inhibition is reducedby the HDAC inhibitor SB (Ferrante et al., 2003; Ryu et al., 2003).HDAC inhibitors potentiate the activity of the transcription fac-tor cAMP response element-binding protein (CREB) (Michael etal., 2000), and CREB-dependent gene transcription enhances mi-tochondrial respiration through the induction of cytochrome c(Herzig et al., 2000). Furthermore, treatment with HDAC inhib-itors was correlated with increased mitochondrial activity and/ormass in X-linked adrenoleukodystrophy cellular models(McGuinness et al., 2003). In addition, TSA and/or SB are able toreduce the death of cultured cortical or cerebellar granule neu-rons exposed to excitotoxic stimuli, namely to the glutamate an-alog homocysteate (Ryu et al., 2003) or SYM-2081 [(2S,4R)-4-methylglutamate], an inhibitor of excitatory amino acidtransporters and an agonist of low-affinity kainate receptors (Ka-nai et al., 2004).
The increased and selective vulnerability of HD striatal neu-rons has been ascribed to a higher ability of mutant Htt to poten-tiate the NMDAR responses mediated by the NR1/NR2B subtypeexpressed particularly in striatal MSNs (Li et al., 2003; Bezproz-vanny and Hayden, 2004). Still, the contribution of mitochon-drial dysfunction for disturbed Ca 2� handling, as a downstreammechanism from NMDAR activation, cannot be ruled out andhas not been explored in detail in intact HD neurons (i.e., in situmitochondria in a striatal neuronal context expressing mutantHtt). Although some studies addressed the relationship between
Ca 2� and ��m using isolated mitochondria from HD cells(Panov et al., 2002; Choo et al., 2004; Brustovetsky et al., 2005), sofar only one study addressed the changes in ��m resulting fromNMDAR activation in striatal neurons from HD mice (Zeron etal., 2004). However, changes in [Ca 2�]i and ��m were separatelydetermined in different neurons, not allowing for a detailed anal-ysis of the interaction between these two parameters. Further-more, the use of the low-affinity Ca 2� probe, Mag-fura-2 (Kd �25 �M), and supramaximal NMDA concentrations (0.5 or 3 mM)also prevented the characterization of Ca 2� signals in neuronsexperiencing moderate Ca 2� elevations and normal recovery af-ter NMDA challenge.
In the present study, using pyruvate instead of glucose, wehave accentuated the cellular bioenergetic consequences of mito-chondrial dysfunction in HD neurons. Furthermore, the simul-taneous monitoring of three interrelated cellular parameters:changes in [Ca 2�]i, ��m, and somatic swelling, allowed for adetailed characterization of the homeostatic changes occurring inneurons. Clearly, cultured striatal neurons do not respond ho-mogeneously to NMDAR activation. Three different responsepatterns were identified (normal recovery, delayed recovery, andimmediate deregulation) in a population almost exclusively com-posed by GABAergic striatal neurons with somatic areas compat-ible with MSNs. The unaltered proportion of neurons exhibitingimmediate deregulation after treatment with HDAC inhibitorsand the smaller somatic area observed for these neurons, suggestthat they may belong to a subpopulation resistant to treatment.Significantly, subpopulations of MSNs with different susceptibil-ities to HD have been identified in studies of autopsy materialfrom HD patients (Reiner et al., 1988). It would be of great inter-est to know whether different subpopulations present differentsomatic increases of HD mutation length (Kennedy et al., 2003).
Although we have not performed a detailed biochemical char-acterization of the neurons exhibiting different response pat-terns, the present study has the advantage of correlating morpho-logical criteria (somatic area) with functional data (real-timemonitoring of changes in [Ca 2�]i, ��m, and somatic swelling).Thus, we advance the provocative hypothesis that, even if allneurons belong to the same population, sufficient functional dif-ferences exist in the ability to handle NMDAR activation to assignthem to different functional states. Indeed, for the same stimulus,neurons exhibiting immediate deregulation will probably un-dergo necrosis, whereas neurons exhibiting delayed recovery aremore likely to survive or undergo apoptosis, because the restora-tion of ��m allows for the ATP synthesis needed for programmedcell death (Ankarcrona et al., 1995). Analysis of qualitative differ-ences in recovery is advantageous to obtain relevant informationon early neuronal dysfunction that may escape detection whenfocusing exclusively on cell death. Admitting that striatal neuronsexhibiting immediate deregulation resemble advanced HD,whereas delayed recovery are better representatives of early HD,our data suggest one important therapeutic inference: treatmentwith HDAC inhibitors is likely to be more beneficial in earlystages of HD.
In summary, functional data presented in this study have im-portant implications for understanding early neuronal dysfunc-tion in HD striatum, involving deficits in mitochondrial functionand Ca 2� handling. The increased Ca 2�-handling efficiency aftertreatment with HDAC inhibitors may be therapeutically usefulfor counteracting neuronal dysfunction in the course of HDpathology.
11184 • J. Neurosci., October 25, 2006 • 26(43):11174 –11186 Oliveira et al. • Mitochondrial-Dependent Ca2� Handling in HD Models
ReferencesAbramov AY, Duchen MR (2003) Actions of ionomycin, 4-BrA23187 and a
novel electrogenic Ca 2� ionophore on mitochondria in intact cells. CellCalc 33:101–112.
Ajamian F, Salminen A, Reeben M (2004) Selective regulation of class I andclass II histone deacetylases expression by inhibitors of histone deacety-lases in cultured mouse neural cells. Neurosci Lett 365:64 – 68.
Ankarcrona M, Dypbukt JM, Bonfoco E, Zhivotovsky B, Orrenius S, LiptonSA, Nicotera P (1995) Glutamate-induced neuronal death: a successionof necrosis or apoptosis depending on mitochondrial function. Neuron15:961–973.
Bates GP (2001) Huntington’s disease. Exploiting expression. Nature 413:691, 693– 694.
Beal MF (2005) Mitochondria take center stage in aging and neurodegen-eration. Ann Neurol 58:495–505.
Beal MF, Ferrante RJ (2004) Experimental therapeutics in transgenic mousemodels of Huntington’s disease. Nat Rev Neurosci 5:373–384.
Bezprozvanny I, Hayden MR (2004) Deranged neuronal calcium signalingand Huntington disease. Biochem Biophys Res Commun 322:1310 –1317.
Brown AM (2004) Brain glycogen re-awakened. J Neurochem 89:537–552.Brustovetsky N, LaFrance R, Purl KJ, Brustovetsky T, Keene CD, Low WC,
Dubinsky JM (2005) Age-dependent changes in the calcium sensitivityof striatal mitochondria in mouse models of Huntington’s Disease. J Neu-rochem 93:1361–1370.
Calabresi P, Pisani A, Mercuri NB, Bernardi G (1996) The corticostriatalprojection: from synaptic plasticity to dysfunctions of the basal ganglia.Trends Neurosci 19:19 –24.
Cha JH (2000) Transcriptional dysregulation in Huntington’s disease.Trends Neurosci 23:387–392.
Chan EY, Luthi-Carter R, Strand A, Solano SM, Hanson SA, DeJohn MM,Kooperberg C, Chase KO, DiFiglia M, Young AB, Leavitt BR, Cha JH,Aronin N, Hayden MR, Olson JM (2002) Increased huntingtin proteinlength reduces the number of polyglutamine-induced gene expressionchanges in mouse models of Huntington’s disease. Hum Mol Genet11:1939 –1951.
Choo YS, Johnson GV, MacDonald M, Detloff PJ, Lesort M (2004) Mutanthuntingtin directly increases susceptibility of mitochondria to thecalcium-induced permeability transition and cytochrome c release. HumMol Genet 13:1407–1420.
Ferrante RJ, Kubilus JK, Lee J, Ryu H, Beesen A, Zucker B, Smith K, KowallNW, Ratan RR, Luthi-Carter R, Hersch SM (2003) Histone deacetylaseinhibition by sodium butyrate chemotherapy ameliorates the neurode-generative phenotype in Huntington’s disease mice. J Neurosci23:9418 –9427.
Galas MC, Bizat N, Cuvelier L, Bantubungi K, Brouillet E, Schiffmann SN,Blum D (2004) Death of cortical and striatal neurons induced by mito-chondrial defect involves differential molecular mechanisms. NeurobiolDis 15:152–159.
Gines S, Seong IS, Fossale E, Ivanova E, Trettel F, Gusella JF, Wheeler VC,Persichetti F, Macdonald ME (2003a) Specific progressive cAMP reduc-tion implicates energy deficit in presymptomatic Huntington’s diseaseknock-in mice. Hum Mol Genet 12:497–508.
Gines S, Ivanova E, Seong IS, Saura CA, Macdonald ME (2003b) EnhancedAkt signaling is an early pro-survival response that reflects N-methyl-D-aspartate receptor activation in Huntington’s disease knock-in striatalcells. J Biol Chem 278:50514 –50522.
Gusella JF, Macdonald ME (2000) Molecular genetics: unmasking poly-glutamine triggers in neurodegenerative disease. Nat Rev Neurosci1:109 –115.
Haugland RP (2002) Fluorescent Ca 2� indicators excited with UV light. In:Handbook of fluorescent probes and research products, pp 776 –781.Eugene, OR: Molecular Probes.
Herzig RP, Scacco S, Scarpulla RC (2000) Sequential serum-dependent ac-tivation of CREB and NRF-1 leads to enhanced mitochondrial respirationthrough the induction of cytochrome c. J Biol Chem 275:13134 –13141.
Hughes RE (2002) Polyglutamine disease: acetyltransferases awry. Curr Biol12:R141–R143.
Huntington’s Disease Collaborative Research Group (1993) A novel genecontaining a trinucleotide repeat that is expanded and unstable on Hun-tington’s disease chromosomes. The Huntington’s Disease CollaborativeResearch Group. Cell 72:971–983.
Kanai H, Sawa A, Chen RW, Leeds P, Chuang DM (2004) Valproic acid
inhibits histone deacetylase activity and suppresses excitotoxicity-induced GAPDH nuclear accumulation and apoptotic death in neurons.Pharmacogenomics J 4:336 –344.
Kawaguchi Y (1997) Neostriatal cell subtypes and their functional roles.Neurosci Res 27:1– 8.
Kennedy L, Evans E, Chen CM, Craven L, Detloff PJ, Ennis M, Shelbourne PF(2003) Dramatic tissue-specific mutation length increases are an earlymolecular event in Huntington disease pathogenesis. Hum Mol Genet12:3359 –3367.
Li L, Fan M, Icton CD, Chen N, Leavitt BR, Hayden MR, Murphy TH, Ray-mond LA (2003) Role of NR2B-type NMDA receptors in selective neu-rodegeneration in Huntington disease. Neurobiol Aging 24:1113–1121.
Mao L, Wang JQ (2001) Upregulation of preprodynorphin and preproen-kephalin mRNA expression by selective activation of group I metabo-tropic glutamate receptors in characterized primary cultures of rat striatalneurons. Brain Res Mol Brain Res 86:125–137.
Mao Z, Choo YS, Lesort M (2006) Cystamine and cysteamine prevent3-NP-induced mitochondrial depolarization of Huntington’s diseaseknock-in striatal cells. Eur J Neurosci 23:1701–1710.
Mariadason JM, Corner GA, Augenlicht LH (2000) Genetic reprogram-ming in pathways of colonic cell maturation induced by short chain fattyacids: comparison with trichostatin A, sulindac, and curcumin andimplications for chemoprevention of colon cancer. Cancer Res 60:4561– 4572.
McGuinness MC, Lu JF, Zhang HP, Dong GX, Heinzer AK, Watkins PA,Powers J, Smith KD (2003) Role of ALDP (ABCD1) and mitochondriain X-linked adrenoleukodystrophy. Mol Cell Biol 23:744 –753.
Michael LF, Asahara H, Shulman AI, Kraus WL, Montminy M (2000) Thephosphorylation status of a cyclic AMP-responsive activator is modulatedvia a chromatin-dependent mechanism. Mol Cell Biol 20:1596 –1603.
Milakovic T, Johnson GV (2005) Mitochondrial respiration and ATP pro-duction are significantly impaired in striatal cells expressing mutant hun-tingtin. J Biol Chem 280:30773–30782.
Napolitano M, Centonze D, Gubellini P, Rossi S, Spiezia S, Bernardi G, Gu-lino A, Calabresi P (2004) Inhibition of mitochondrial complex II altersstriatal expression of genes involved in glutamatergic and dopaminergicsignaling: possible implications for Huntington’s disease. Neurobiol Dis15:407– 414.
Nicholls DG (2004) Mitochondrial dysfunction and glutamate excitotoxic-ity studied in primary neuronal cultures. Curr Mol Med 4:149 –177.
Nicholls DG (2006) Simultaneous monitoring of ionophore- and inhibitor-mediated plasma and mitochondrial membrane potential changes in cul-tured neurons. J Biol Chem 281:14864 –14874.
Nicholls DG, Budd SL (2000) Mitochondria and neuronal survival. PhysiolRev 80:315–360.
Panov AV, Gutekunst CA, Leavitt BR, Hayden MR, Burke JR, Strittmatter WJ,Greenamyre JT (2002) Early mitochondrial calcium defects in Hunting-ton’s disease are a direct effect of polyglutamines. Nat Neurosci5:731–736.
Petersen A, Brundin P (1999) Effects of ciliary neurotrophic factor on exci-totoxicity and calcium-ionophore A23187-induced cell death in culturedembryonic striatal neurons. Exp Neurol 160:402– 412.
Petersen A, Castilho RF, Hansson O, Wieloch T, Brundin P (2000) Oxida-tive stress, mitochondrial permeability transition and activation ofcaspases in calcium ionophore A23187-induced death of cultured striatalneurons. Brain Res 857:20 –29.
Rego AC, Ward MW, Nicholls DG (2001) Mitochondria control AMPA/kainate receptor-induced cytoplasmic calcium deregulation in rat cere-bellar granule cells. J Neurosci 21:1893–1901.
Reiner A, Albin RL, Anderson KD, D’Amato CJ, Penney JB, Young AB(1988) Differential loss of striatal projection neurons in Huntington dis-ease. Proc Natl Acad Sci USA 85:5733–5737.
Ruan Q, Lesort M, Macdonald ME, Johnson GV (2004) Striatal cells frommutant huntingtin knock-in mice are selectively vulnerable to mitochon-drial complex II inhibitor-induced cell death through a non-apoptoticpathway. Hum Mol Genet 13:669 – 681.
Ryu H, Lee J, Olofsson BA, Mwidau A, Dedeoglu A, Escudero M, FlemingtonE, Azizkhan-Clifford J, Ferrante RJ, Ratan RR (2003) Histone deacety-lase inhibitors prevent oxidative neuronal death independent of ex-panded polyglutamine repeats via an Sp1-dependent pathway. Proc NatlAcad Sci USA 100:4281– 4286.
Saulle E, Gubellini P, Picconi B, Centonze D, Tropepi D, Pisani A, Morari M,
Oliveira et al. • Mitochondrial-Dependent Ca2� Handling in HD Models J. Neurosci., October 25, 2006 • 26(43):11174 –11186 • 11185
Marti M, Rossi L, Papa M, Bernardi G, Calabresi P (2004) Neuronalvulnerability following inhibition of mitochondrial complex II: a possibleionic mechanism for Huntington’s disease. Mol Cell Neurosci 25:9 –20.
Seong IS, Ivanova E, Lee JM, Choo YS, Fossale E, Anderson M, Gusella JF,Laramie JM, Myers RH, Lesort M, MacDonald ME (2005) HD CAGrepeat implicates a dominant property of huntingtin in mitochondrialenergy metabolism. Hum Mol Genet 14:2871–2880.
Slow EJ, van Raamsdonk J, Rogers D, Coleman SH, Graham RK, Deng Y, OhR, Bissada N, Hossain SM, Yang YZ, Li XJ, Simpson EM, Gutekunst CA,Leavitt BR, Hayden MR (2003) Selective striatal neuronal loss in aYAC128 mouse model of Huntington disease. Hum Mol Genet12:1555–1567.
Steffan JS, Kazantsev A, Spasic-Boskovic O, Greenwald M, Zhu YZ, Gohler H,Wanker EE, Bates GP, Housman DE, Thompson LM (2000) The Hun-tington’s disease protein interacts with p53 and CREB-binding proteinand represses transcription. Proc Natl Acad Sci USA 97:6763– 6768.
Sugars KL, Rubinsztein DC (2003) Transcriptional abnormalities in Hun-tington disease. Trends Genet 19:233–238.
Tobin AJ, Signer ER (2000) Huntington’s disease: the challenge for cell bi-ologists. Trends Cell Biol 10:531–536.
Trettel F, Rigamonti D, Hilditch-Maguire P, Wheeler VC, Sharp AH, Per-
sichetti F, Cattaneo E, Macdonald ME (2000) Dominant phenotypesproduced by the HD mutation in STHdh(Q111) striatal cells. Hum MolGenet 9:2799 –2809.
Tymianski M, Charlton MP, Carlen PL, Tator CH (1993) Source specificityof early calcium neurotoxicity in cultured embryonic spinal neurons.J Neurosci 13:2085–2104.
Vonsattel JP, DiFiglia M (1998) Huntington disease. J Neuropathol ExpNeurol 57:369 –384.
Wang J, Gines S, Macdonald ME, Gusella JF (2005) Reversal of a full-lengthmutant huntingtin neuronal cell phenotype by chemical inhibitors ofpolyglutamine-mediated aggregation. BMC Neurosci 6:1.
Ward MW, Rego AC, Frenguelli BG, Nicholls DG (2000) Mitochondrialmembrane potential and glutamate excitotoxicity in cultured cerebellargranule cells. J Neurosci 20:7208 –7219.
Wokosin DL, Loughrey CM, Smith GL (2004) Characterization of a range offura dyes with two-photon excitation. Biophys J 86:1726 –1738.
Zeron MM, Fernandes HB, Krebs C, Shehadeh J, Wellington CL, Leavitt BR,Baimbridge KG, Hayden MR, Raymond LA (2004) Potentiation ofNMDA receptor-mediated excitotoxicity linked with intrinsic apoptoticpathway in YAC transgenic mouse model of Huntington’s disease. MolCell Neurosci 25:469 – 479.
11186 • J. Neurosci., October 25, 2006 • 26(43):11174 –11186 Oliveira et al. • Mitochondrial-Dependent Ca2� Handling in HD Models