missing data: focusing on the wrong factors could ... · missing data: focusing on the wrong...
TRANSCRIPT
Missing Data: Focusing on the Wrong Factors Could Contribute to Student Loan Distress
Paul Combe & Julie Ryder Lammers1
Current data on student loan debt is inadequate to address how borrowers are
really faring in repaying their loans, only highlighting extreme hardship in student borrowing. To some degree, current loan data is analogous to mortality rates. Mortality rates do not provide anything other than a stark number of how many people have died. What is actually important is to understand why they died. What caused it? Is there something that could have been done to prevent it? If there was earlier detection, could a cure have been found? Similarly, all the Cohort Default Rate (CDR), or percentage of borrowers who default within three years of the start of repayment, explains is how many people have already fallen off the cliff of default within a narrow time frame. What is needed is more data about what caused the default, what could have been done to prevent it, if we could have detected the problem earlier and found a cure, and if we could have prevented the problem from occurring all together. Unfortunately, all that is really tracked is the number of loans that have died. We could be much more successful in ensuring the successful repayment of assets in student lending if there was more done to make sure problems did not occur in the first place and if we held schools, lenders, and the U.S. Department of Education accountable for metrics that help, rather than add to, the distress of borrowers.
Changing the data that are tracked, published, and discussed in student lending will show that more people are being impacted by student loan repayment struggles than just those in the default number. Understanding data more clearly is not the be-all and end-all to fixing the problem, but transparency in data spurs action. Moving the conversation about student debt beyond just default could have far reaching impacts on the economy by highlighting the need for early prevention programs that alleviate the negative financial impacts of student loan debt on the post-college life of a very large number of borrowers.
I. INTRODUCTION
You get what you measure. The federal government tracks data on student
1. Paul Combe is the President and CEO of American Student Assistance. Julie Ryder Lammers is the Director of Government Relations at American Student Assistance.
600 SUFFOLK UNIVERSITY LAW REVIEW [Vol. XLVIII:599
loans with an emphasis on total indebtedness and default rates, and as a result, those two data points are the main influencers of the policy debate surrounding student debt. In order to change the focus of the discussion and to increase student repayment success, there must be a push to collect and publish data on the entire range of student loan repayment statuses, including delinquency, deferment, forbearance, and repayment.
Student loan repayment success and default rates are not the binary sides of a coin. The national three-year student loan CDR for fiscal year 2011 was 13.7%.2 As the only published data on borrower status, this implies that the other 86.3% of student loan borrowers are not having difficulty repaying their loans. It is widely understood that this is not the case. The vast majority of student loan borrowers may not currently be in default, but a study by the Institute for Higher Education Policy recently found that only 37% of federal student loan borrowers were in timely and ongoing repayment after five years.3 The gap between borrowers in timely and ongoing repayment and those who have defaulted does not show up in a CDR calculation, but the majority of these borrowers may be struggling to pay, are not amortizing their loans, and their balances will continue to grow with capitalized interest, forcing them deeper into debt. Additionally, there may be many student loan borrowers in that 37% who find the process of repaying very difficult to successfully manage month to month, particularly considering the ripple effect that paying student loans has on an individual’s ability to afford other purchases and economic life decisions.4 There is no quantifiable information on the impact debt has on the borrower as a consumer and the economy at large because of how current data are published.
The U.S. Department of Education currently measures and publishes loan information through the National Student Loan Data System (NSLDS)5 based on loan repayment status.6 The NSLDS data categorizes how many borrowers
2. Three-Year Official Cohort Default Rates for Schools, U.S. DEP’T EDUC., http://www2.ed.gov/ offices/OSFAP/defaultmanagement/cdr.html (last updated Sept. 24, 2014), archived at http://perma.cc/FH77-7SLJ. 3. ALISA F. CUNNINGHAM & GREGORY S. KIENZL, DELINQUENCY: THE UNTOLD STORY OF STUDENT
LOAN BORROWING 18 (2011), available at http://www.ihep.org/sites/default/files/uploads/docs/pubs/ delinquency-the_untold_story_final_march_2011.pdf, archived at http://perma.cc/A4AX-AN65. 4. See Kelly D. Edmiston et al., Student Loans: Overview and Issues (Update) 8, 12 (Fed. Reserve Bank of Kan. City, Working Paper No. RWP 12-05, 2013), available at https://www.kansascityfed.org/ publicat/reswkpap/pdf/rwp%2012-05.pdf, archived at https://perma.cc/3K5Z-EM2A; Phyllis Korkki, The Ripple Effects of Rising Student Debt, N.Y. TIMES (May 24, 2014), http://www.nytimes.com/2014/05/25/ business/the-ripple-effects-of-rising-student-debt.html, archived at http://perma.cc/38NR-GYP2. 5. See 20 U.S.C. § 1092b (2012). The National Student Loan Data System maintains a collection of accurate information on student loan indebtedness and institutional lending practices with the goal of improving loan repayment. See id. 6. Nat’l Student Loan Data Sys., Direct Loan Portfolio by Loan Status, U.S. DEP’T EDUC., http://studentaid.ed.gov/sites/default/files/fsawg/datacenter/library/PortfoliobyLoanStatus.xls (last visited Apr. 18, 2015), archived at https://perma.cc/9T5D-XQWR.
2015] FOCUS ON WRONG FACTORS CONTRIBUTES TO STUDENT LOAN DISTRESS 601
are currently in school, in a grace period,7 in repayment, in deferment,8 in forbearance,9 and in default.10 The major problem with this breakdown is that the repayment data include both those who are timely and accurately repaying their loans and those who are delinquent on their payments.11 The rationale for calculating loan repayment in this manner is hard to comprehend. A borrower is not in default until the 271st day of failing to pay, but it is difficult to argue that someone who is 270 days behind on payment is really repaying her loan.12 Because there is no clear picture of how borrowers are really faring in repayment, or anything about the relationship between forbearance, deferment, and delinquency, all public policy debates continue to revolve around the one datapoint that we are familiar with—default.
Changing the conversation about student debt beyond just default could have far-reaching impacts on the economy. There is no doubt that the impact is severe for the fraction of the population that experiences the financial hardship of student loan default. Based on an Institute for Higher Education Policy (IHEP) study, however, a much larger population (at least 26% of the roughly forty million Americans with student debt in repayment) has their credit score impacted just like defaulters after becoming delinquent.13 This group is also putting off major purchases and life decisions as they struggle to make student loan payments.14 The repayment problems of this population—far larger than that represented by a default number—has a cascading impact on the ability of borrowers to fully participate in financial activity, sending ripples through the economy each time another borrower falls past due. How big that ripple is can
7. Glossary, U.S. DEP’T EDUC., https://studentaid.ed.gov/glossary (last visited Mar. 22, 2015), archived at http://perma.cc/EAL4-S6SA [hereinafter Glossary]. “Grace period” is defined as “[a] period of time after borrowers graduate, leave school, or drop below half-time enrollment where they are not required to make payments on certain federal student loans.” Id. “Direct Subsidized Loans, Direct Unsubsidized Loans, Subsidized Federal Stafford Loans, and Unsubsidized Federal Stafford Loans have a six-month grace period before payments are due.” Understanding Repayment, U.S. DEP’T EDUC., https://studentaid.ed.gov/repay-loans/understand (last visited Mar. 22, 2015), archived at http://perma.cc/P229-44F7. 8. Glossary, supra note 7. “Deferment” is defined as “[a] postponement of payment on a loan that is allowed under certain conditions and during which interest does not accrue on Direct Subsidized Loans, Subsidized Federal Stafford Loans, and Federal Perkins Loans.” Id. 9. Id. “Forbearance” is defined as “[a] period during which your monthly loan payments are temporarily suspended or reduced. . . . . During forbearance, principal payments are postponed but interest continues to accrue. Unpaid interest that accrues during the forbearance will be added to the principal balance (capitalized) of your loan(s), increasing the total amount you owe.” Id. 10. Id. “Default” is defined as “[f]ailure to repay a loan according to the terms agreed to in the promissory note. For most federal student loans, you will default if you have not made a payment in more than 270 days.” Id. 11. Id. “Delinquency” is defined as “when loan payments are not received by the due dates. A loan remains delinquent until the borrower makes up the missed payment(s) through payment, deferment, or forbearance.” Id. After 270 days the loan will be considered in default. Id. 12. See supra note 10 (defining “default”). 13. See Edmiston et al., supra note 4, at 13 (describing impact of delinquency on borrowers’ credit scores). 14. See id.
602 SUFFOLK UNIVERSITY LAW REVIEW [Vol. XLVIII:599
only be determined by knowing the scope of the delinquency problem. To change the conversation and push for new policies that help
borrowers, there must be a better means of quantifying the student loan problem beyond simply default, in order to give a more accurate portrayal of how borrowers are really faring as consumers in paying back their debt. The raw number of 13.7% in default and in dire straits after three years is not enough to help the other nearly 90% of the population. If we ever want to get more loans in repayment and out of delinquency and default, the federal government needs to start reporting student loan repayments in a way that reflects not just whether they can avoid default, but how well borrowers are eliminating their debt.
II. DATA SPURS POLICY CHANGE
The corollary to “you get what you measure” is that you cannot impact or understand that which you do not measure. Having a clear understanding of the data will not necessarily fix the problem but transparency in data spurs action. Time and time again we see in all areas, from education and the environment to public health, that data impacts how we view and deal with complex issues. In order to change the conversation about where student loan repayment struggles are really happening for the majority of the borrower population, we need to shine a light on the data and expose the problem for all to see.
A perfect blueprint for managing public support around data issues can be seen if we look outside the education field, specifically at the push to reduce fatalities due to smoking. In 1964, the Surgeon General of the United States released the first report on the health impacts of smoking on “firsthand” smokers.15 As a result, smokers began to understand the consequences of inhaled tobacco, and for the next several decades smoking-related deaths gradually decreased.16 Those data were not enough, though, to effect major health or public policy change. The initial smoking data spurred more of a cautionary tale: if you choose to smoke there are negative consequences to your health. Focusing only on smokers did not bring the needed behavioral modifications to the public at large, so health experts pushed for more data on the impact smoke has on those who have not made the choice to smoke but are nonetheless exposed to it. 17 In 1986, the Surgeon General released information
15. See U.S. DEP’T OF HEALTH, EDUC., & WELFARE, PUB. NO. 1103, SMOKING AND HEALTH: REPORT OF
THE ADVISORY COMMITTEE TO THE SURGEON GENERAL OF THE PUBLIC HEALTH SERVICE (1964), available at http://profiles.nlm.nih.gov/ps/access/NNBBMQ.pdf, archived at http://perma.cc/9SP3-84ZU. 16. See James L. Pirkle et al., Trends in the Exposure of Nonsmokers in the U.S. Population to Secondhand Smoke: 1988-2002, 114 ENVTL. HEALTH PERSP. 853, 853 (2006). 17. See U.S. DEP’T OF HEALTH & HUMAN SERVS., PUB. NO. (CDC) 87-8396, SMOKING AND HEALTH: A
NATIONAL STATUS REPORT (2d ed. 1987), available at http://profiles.nlm.nih.gov/ps/access/NNBBVP.pdf, archived at http://perma.cc/3FAT-C73R.
2015] FOCUS ON WRONG FACTORS CONTRIBUTES TO STUDENT LOAN DISTRESS 603
on the effects of secondhand smoke on public health.18 It was not until the data about the indirect impacts of smoking on the public at large were disseminated that public opinion, public policy, and public behavior began to change.19 Over the next decade, the way people talked about smoking changed, more pressure mounted on smokers to quit, and the once widely accepted habit became a public taboo. Although tools had been available to address firsthand smoking, a profound impact on curbing smoking did not occur until the 1987 data were released. Simply altering the data tracked, published, and communicated changed both public behavior and public policy around the issue. The student loan industry could benefit greatly from this type of change. Student loan delinquency is the new “secondhand” smoke—far more people are being impacted throughout the economy than just those who have the personal financial burden of student debt.
For a number of reasons, student loan data has focused on the stark population of defaulters with the perception that they only hurt themselves, but in reality, a much larger population of struggling borrowers languishes in the shadows without assistance. Borrowers struggling with student loan debt have limited ability to buy homes, cars, and consumer goods, thus creating a ripple effect of secondhand ramifications on the consumption driven U.S. economy.20 We need to change the data tracked, published, and talked about in student lending so that we can change the public policy debate around student loan debt and its broader impact.
Creation of the CDR is an example of how tracking data in a new way can force policy change. The 1970s and early 1980s were plagued by growing inflation, unemployment, and economic instability.21 When combined with poor consumer information about the nature of a loan, these factors led many borrowers to not meet their federal student loan obligations.22 As the media published stories of graduates walking away from student debt just days after graduating and lenders began complaining about rising default numbers, members of Congress grew concerned that rising default rates would force the 18. See id. 19. See Pirkle et al., supra note 16, at 853. 20. See Edmiston et al., supra note 4, at 13 (describing impact of debt burden on borrowers’ access to credit). 21. See generally Allan H. Meltzer, Origins of the Great Inflation, 87 FED. RES. BANK ST. LOUIS REV. 145, available at http://research.stlouisfed.org/publications/review/05/03/part2/Meltzer.pdf, archived at http://perma.cc/4Z6D-UJ56; Labor Force Statistics from the Current Population Survey, U.S. DEP’T LAB., http://data.bls.gov/timeseries/LNS14000000;%201971-1985 (last visited July 16, 2015), archived at http:// perma.cc/PNV7-22H7. 22. See Stephen Burd, Getting Rid of the College Loan Repo Man, WASH. MONTHLY (Sept./Oct. 2012), http://www.washingtonmonthly.com/magazine/septemberoctober_2012/features/getting_rid_of_the_college_loa039354.php?page=all, archived at http://perma.cc/U9ZB-MDM8; Lawrence E. Gladieux, Federal Student Aid Policy: A History and an Assessment, U.S. DEP’T EDUC. (Oct. 1995), https://www2.ed.gov/offices/OPE/PPI/ FinPostSecEd/gladieux.html, archived at https://perma.cc/4TWG-D4LJ; Andrew Martin & Andrew W. Lehren, A Generation Hobbled by the Soaring Cost of College, N.Y. TIMES (May 12, 2012), http://www.nytimes.com/ 2012/05/13/business/student-loans-weighing-down-a-generation-with-heavy-debt.html?pagewanted=all&_r=2.
604 SUFFOLK UNIVERSITY LAW REVIEW [Vol. XLVIII:599
student loan system they had established to the point of collapse.23 Congress reacted by holding borrowers more accountable for debts by limiting, and then eliminating, the ability of borrowers to discharge their loans through bankruptcy, thus making loans a lifelong obligation for borrowers.24 The U.S. Department of Education also felt it necessary to react to mounting political pressure and, in November 1987, Secretary of Education William Bennett announced sweeping accountability measures for the guaranteed student loan program.25 To curb defaults, the U.S. Department of Education would implement a rule to “bar institutions from participation in all federal student aid programs if they fail to bring the guaranteed student loan default rate of their students below 20%.”26 The rule established that institutions would be judged based on the number of defaults that occurred over a set time or “cohort” period.27 The release of this data from the U.S. Department of Education, which for the first time outlined the scope of the student loan default problem, launched a massive public debate about the effectiveness of the student lending program and how best to manage the default picture that was now coming more clearly into focus.28
The Bennett proposal as originally outlined was never put into effect, but the following year, Congress included Senator Claiborne Pell’s Student Loan Default Prevention Act29 as part of the Omnibus Budget Reconciliation Act of 1990.30 This bill aimed to “reduce the cost of the [Federal Family Education Loan] program by promptly eliminating from the program schools whose 23. See Arnold H. Lubasch, U.S., In Bid for Repayment of Student Loans, Sues 25, N.Y. TIMES (Jan. 29, 1985), http://www.nytimes.com/1985/01/29/nyregion/us-in-bid-for-repayment-of-student-loans-sues-25.html; Iver Peterson, Ex-Ohio Students Say They Can’t Pay Off Their Defaulted Federal Loans, N.Y. TIMES (Mar. 8, 1981), http://www.nytimes.com/1981/03/08/us/ex-ohio-students-say-they-can-t-pay-off-their-defaulted-federal-loans.html; United Press Int’l, Many Doctors Failing To Pay Student Loans, N.Y. TIMES (Dec. 7, 1981), http://www.nytimes.com/1981/12/07/us/many-doctors-failing-to-pay-student-loans.html; United Press Int’l, U.S. To Pursue Physicians Who Defaulted on Loans, N.Y. TIMES (Dec. 28, 1981), http://www.nytimes.com/ 1981/12/28/us/us-to-pursue-physicians-who-defaulted-on-loans.html. 24. See Education Amendments of 1976, Pub. L. No. 94-482, § 127, 90 Stat. 2081, 2141 (requiring borrowers to wait five years before filing for discharge of student loans); Higher Education Amendments of 1998, Pub. L. No. 105-244, § 971, 112 Stat. 1581, 1837 (striking waiting period for discharging loans in bankruptcy). 25. See Press Conference, U.S. Dep’t of Educ., Student Loan Defaults, CSPAN (Nov. 4, 1987), http://www.c-span.org/video/?871-1/student-loan-defaults, archived at http://perma.cc/37J9-Z53Z (statement by Secretary of Education William Bennett). 26. Id. 27. See id. 28. See, e.g., William J. Bennett, Our Greedy Colleges, N.Y. TIMES (Feb. 18, 1987), http://www.nytimes. com/1987/02/18/opinion/our-greedy-colleges.html; Kenneth I. Watten, Wrong Target on Student Loan Defaults, CHI. TRIB. (Nov. 28, 1987), http://articles.chicagotribune.com/1987-11-28/news/8703290831 _1_default-rates-student-loan-defaults-loan-money, archived at http://perma.cc/L9UF-UP2W; Mitchell Zuckoff, As Student Loan Defaults Soar, Fight Over Remedy Intensifies, CHI. TRIB. (Jan. 10, 1988), http:// articles.chicagotribune.com/1988-01-10/news/8803210421_1_default-rates-default-problem-loans, archived at http://perma.cc/U8KS-ZG73. 29. See Student Loan Default Prevention Initiative Act of 1990, Pub. L. No. 101-508, 104 Stat. 1388-25. 30. See Omnibus Budget Reconciliation Act of 1990, Pub. L. No. 101-508, 104 Stat. 1388.
2015] FOCUS ON WRONG FACTORS CONTRIBUTES TO STUDENT LOAN DISTRESS 605
students had chronically high rates of default.”31 The legislation required that student loan data be collected in a uniform way and be used to hold schools and other parties like servicers and guaranty agencies accountable for growing defaults.32 Until this point, there had been no complete data on loan repayment and the scope of the problem was mainly anecdotal. In fact, when Bennett made initial statements about this proposal, he made it clear that all the data he had were only estimates of the default problem.33
The major impetus for taking action in 1990 was a reaction to mounting public pressure to curb the problems on which default data had shed light. The accountability measures made data publically available for all to see, comment on, and legislate. Without the data regarding defaults, there would not have been the same media push or public demand for subsequent political change to establish standards for default. The increased transparency exposed the poor loan practices of many entities, which spurred public criticism and political action aimed at the bad schools and borrowers. “Good” borrowers and schools—those who had not defaulted or had low default rates—were not part of the dialogue.
Even after twenty-five years of tracking, when it comes to student loan data, we are really only in the first stages of exposing the baseline problem. Like firsthand smoking, we know the dire consequences of an individual defaulting on a student loan, but we do not yet have the data to understand the broader impact of student debt on all borrowers’ financial decisions and actions. Data need to articulate the secondhand effect of student loans—both that more people are being impacted than just those in the default number and that this larger number of impacted people has ramifications for the U.S. economy at large.
31. Atlanta Coll. of Med. & Dental Careers, Inc. v. Riley, 987 F.2d 821, 824 (D.C. Cir. 1993). 32. See Student Loan Default Prevention Initiative Act of 1990, Pub. L. No. 101-508, §§ 3001-3103, 104 Stat. 1388-25.
[Pell’s bill] [r]equires those guaranty agencies, lenders, and institutions with default rates in excess of 25 percent to develop and carry out default management plans.
Subjects guaranty agencies, lenders, and institutions with high volume default rates in the highest five percent by volume of defaulted student loans to program reviews by the Secretary (in the case of guaranty agencies) or by the State guaranty agency (in the case of lenders or institutions). Directs the Secretary (or the State guaranty agency, as the case may be) to develop and implement a default management plan for such guaranty agencies, lenders, or institutions if it is determined that their management practices substantially contribute to the high volume default.
Summary: S.568 – 101st Congress (1989-1990), CONGRESS.GOV, https://www.congress.gov/bill/101stcongress /senate-bill/568?q={%22search%22%3A[%22s.568%22]} (last visited Mar. 31, 2015), archived at http://perma .cc/A9S3-A6JT. 33. See Press Conference, supra note 25.
606 SUFFOLK UNIVERSITY LAW REVIEW [Vol. XLVIII:599
III. THE IMPACT OF STUDENT DEBT IS GREATER THAN JUST THE DEFAULT NUMBER
The CDR establishes a starting point to begin understanding default but masks where the majority of borrowers actually are in the repayment process. This leads to the false assumption that all other borrowers are successfully repaying their debts and also means that we are not focusing on the solutions to the problem that could be possible with better data. The reality is that we simply do not have enough data on the other 90% of borrowers to fill in all the missing pieces and decipher where and when borrowers have repayment problems. This is mainly due to the fact that calculations of CDR are for only a narrow timeframe, the means of pinpointing a solid number of those in delinquency are varied, and the definition of “in repayment” is inconsistent.
Problems with the CDR as a measure of default have been widely debated.34 The U.S. Department of Education Office of Inspector General has pointed out that while the “cohort default rates provide the information required under the [Higher Education Act], they do not appear to provide decision-makers with sufficient information on defaults in the Title IV loan programs.”35 Issues with the time frame used to evaluate borrowers,36 the types of loans included in the calculation (or more importantly excluded from the calculation),37 and 34. See Erin Dillon, Hidden Details: A Closer Look at Student Loan Default Rates, EDUC. SECTOR (Oct. 22, 2007) (on file with Suffolk University Law Review). 35. See OFFICE OF INSPECTOR GEN., U.S. DEP’T OF EDUC., PUB NO. ED-OIG/A03-C0017, AUDIT TO
DETERMINE IF COHORT DEFAULT RATES PROVIDE SUFFICIENT INFORMATION ON DEFAULTS IN THE TITLE IV
LOAN PROGRAMS 1 (2003), available at http://www2.ed.gov/about/offices/list/oig/auditreports/a03c0017.pdf, archived at http://perma.cc/AJ9J-2Q9N. The Higher Education Act (HEA), Public Law 89-329, was originally passed in 1965 as part of President Lyndon Johnson’s Great Society. President Johnson believed that increased access to higher education was a tool for economic growth and so this law was designed to make higher education more accessible to populations who were previously unable to attain it due to economic circumstances. Among other initiatives to regulate the higher education system, the law established a broad role for the federal government to fund need-based aid to students in the form of scholarships and loans, and it established grants to institutions of higher education for research. Over the years, various reauthorizations and amendments have been undertaken for this legislation, but it is still the predominant law governing higher education and federal student aid. Title IV of the Act regulates all aspects of student aid. 36. See Higher Education Amendments of 1992, Pub. L. No. 102-325, § 504(c)(3)(A), 106 Stat. 448, 662 (requiring borrower tracking for two-year period after leaving school for purposes of measuring CDR). The 2008 amendments to the Higher Education Act changed the tracking period from two years to three years. See Higher Education Opportunity Act, Pub. L. No. 110-315, § 489(1)(e)(2)(B), 122 Stat. 3078, 3305 (2008). The amendments also designated fiscal year 2009 as the first cohort year that three-year cohort default rates would be released. As a result, schools became accountable for the three-year rate as of 2014, after three years of CDR data had been released. 37. See 2.1 How the Cohort Default Rates Are Calculated: Understanding the CDR Calculation Process, U.S. DEP’T EDUC., http://www.ifap.ed.gov/DefaultManagement/guide/attachments/CDRGuideCh2Pt1 CDRCalculation.pdf, archived at http://perma.cc/6XVY-7X3U. The CDR only tracks defaults on Federal Stafford Loans and Federal Direct Stafford/Ford Loans. See Three-Year Official Cohort Default Rates for Schools, supra note 2. Federal PLUS Loans, Federal Insured Student Loans, and Federal Perkins Loans are not included. See id. Federal Perkins Loans have their own CDR calculation.
2015] FOCUS ON WRONG FACTORS CONTRIBUTES TO STUDENT LOAN DISTRESS 607
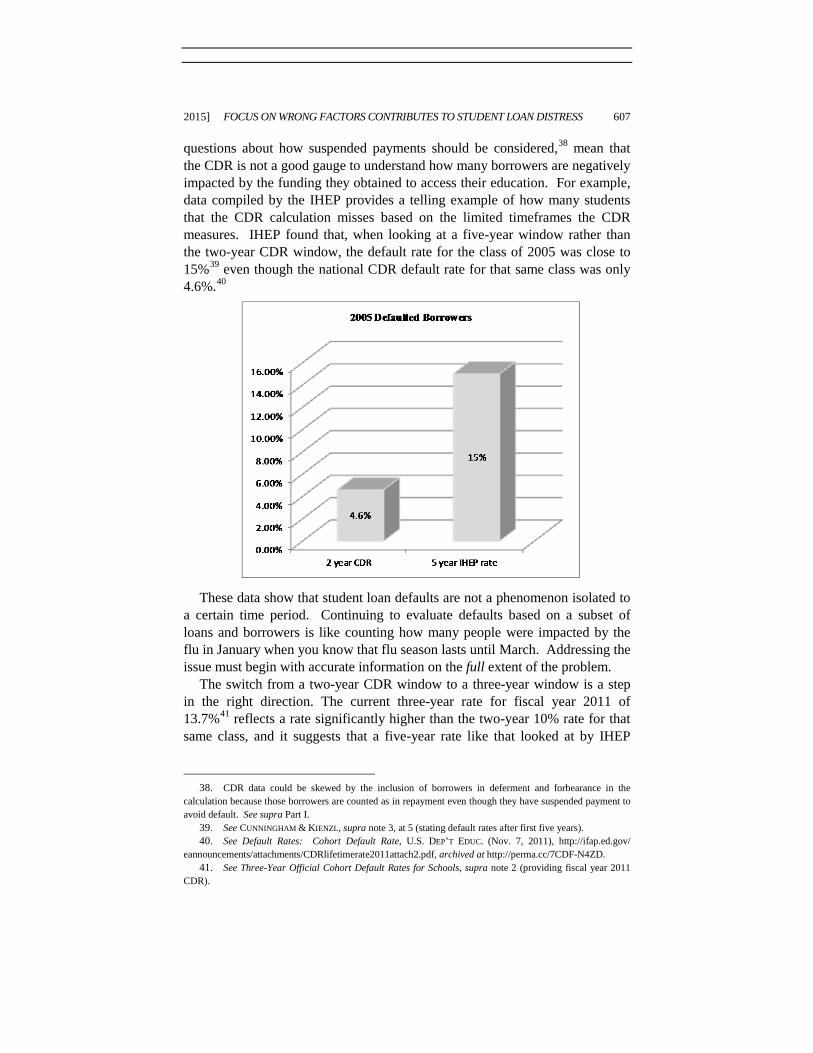
questions about how suspended payments should be considered,38 mean that the CDR is not a good gauge to understand how many borrowers are negatively impacted by the funding they obtained to access their education. For example, data compiled by the IHEP provides a telling example of how many students that the CDR calculation misses based on the limited timeframes the CDR measures. IHEP found that, when looking at a five-year window rather than the two-year CDR window, the default rate for the class of 2005 was close to 15%39 even though the national CDR default rate for that same class was only 4.6%.40
These data show that student loan defaults are not a phenomenon isolated to
a certain time period. Continuing to evaluate defaults based on a subset of loans and borrowers is like counting how many people were impacted by the flu in January when you know that flu season lasts until March. Addressing the issue must begin with accurate information on the full extent of the problem.
The switch from a two-year CDR window to a three-year window is a step in the right direction. The current three-year rate for fiscal year 2011 of 13.7%41 reflects a rate significantly higher than the two-year 10% rate for that same class, and it suggests that a five-year rate like that looked at by IHEP
38. CDR data could be skewed by the inclusion of borrowers in deferment and forbearance in the calculation because those borrowers are counted as in repayment even though they have suspended payment to avoid default. See supra Part I. 39. See CUNNINGHAM & KIENZL, supra note 3, at 5 (stating default rates after first five years). 40. See Default Rates: Cohort Default Rate, U.S. DEP’T EDUC. (Nov. 7, 2011), http://ifap.ed.gov/ eannouncements/attachments/CDRlifetimerate2011attach2.pdf, archived at http://perma.cc/7CDF-N4ZD. 41. See Three-Year Official Cohort Default Rates for Schools, supra note 2 (providing fiscal year 2011 CDR).
608 SUFFOLK UNIVERSITY LAW REVIEW [Vol. XLVIII:599
could be higher still.42 There needs to be, however, a better understanding of how borrowers are dealing with the financial challenges that result from falling behind on loan payments at any point in the repayment process because a student loan default will follow a borrower for his lifetime, well beyond the three-year window schools are incented to care about. To ensure that education debts are not crippling the ability of borrowers to reap the long-term rewards that their education was intended to impart, it would be wise to have a better understanding of how student loan default is impacting borrowers in a long-term way. The current CDR calculation does not do this.
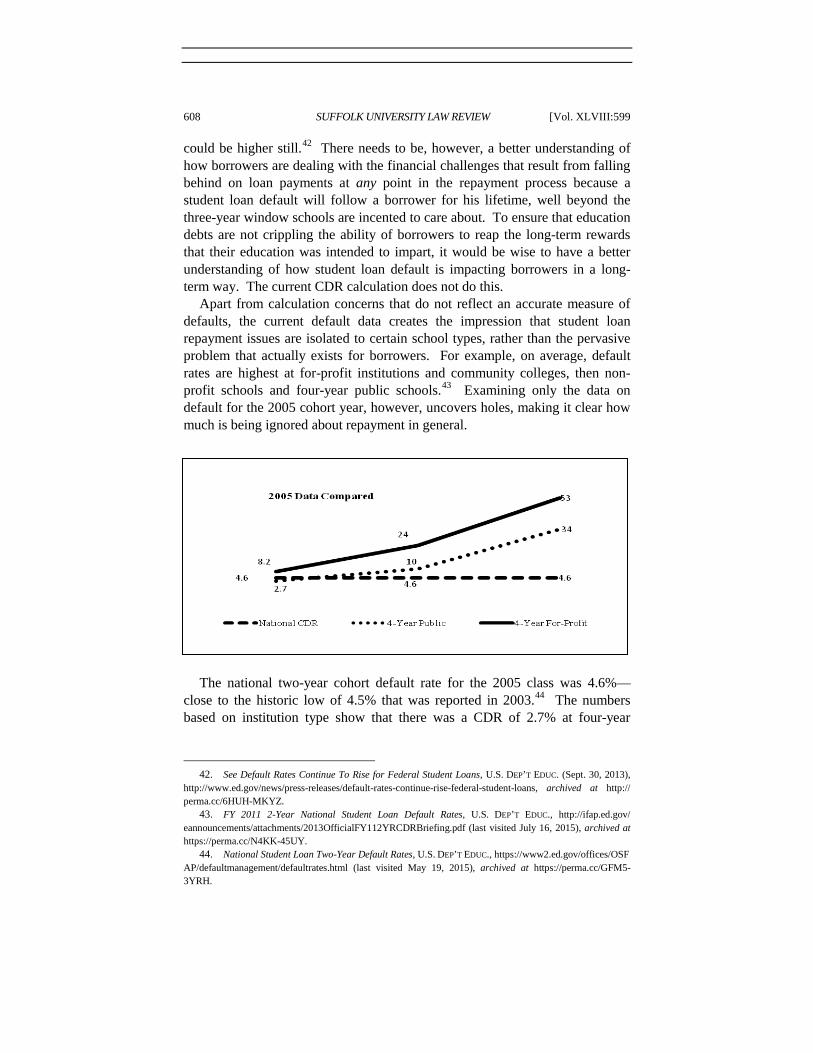
Apart from calculation concerns that do not reflect an accurate measure of defaults, the current default data creates the impression that student loan repayment issues are isolated to certain school types, rather than the pervasive problem that actually exists for borrowers. For example, on average, default rates are highest at for-profit institutions and community colleges, then non-profit schools and four-year public schools.43 Examining only the data on default for the 2005 cohort year, however, uncovers holes, making it clear how much is being ignored about repayment in general.
The national two-year cohort default rate for the 2005 class was 4.6%—
close to the historic low of 4.5% that was reported in 2003.44 The numbers based on institution type show that there was a CDR of 2.7% at four-year
42. See Default Rates Continue To Rise for Federal Student Loans, U.S. DEP’T EDUC. (Sept. 30, 2013), http://www.ed.gov/news/press-releases/default-rates-continue-rise-federal-student-loans, archived at http:// perma.cc/6HUH-MKYZ. 43. FY 2011 2-Year National Student Loan Default Rates, U.S. DEP’T EDUC., http://ifap.ed.gov/ eannouncements/attachments/2013OfficialFY112YRCDRBriefing.pdf (last visited July 16, 2015), archived at https://perma.cc/N4KK-45UY. 44. National Student Loan Two-Year Default Rates, U.S. DEP’T EDUC., https://www2.ed.gov/offices/OSF AP/defaultmanagement/defaultrates.html (last visited May 19, 2015), archived at https://perma.cc/GFM5-3YRH.
2015] FOCUS ON WRONG FACTORS CONTRIBUTES TO STUDENT LOAN DISTRESS 609
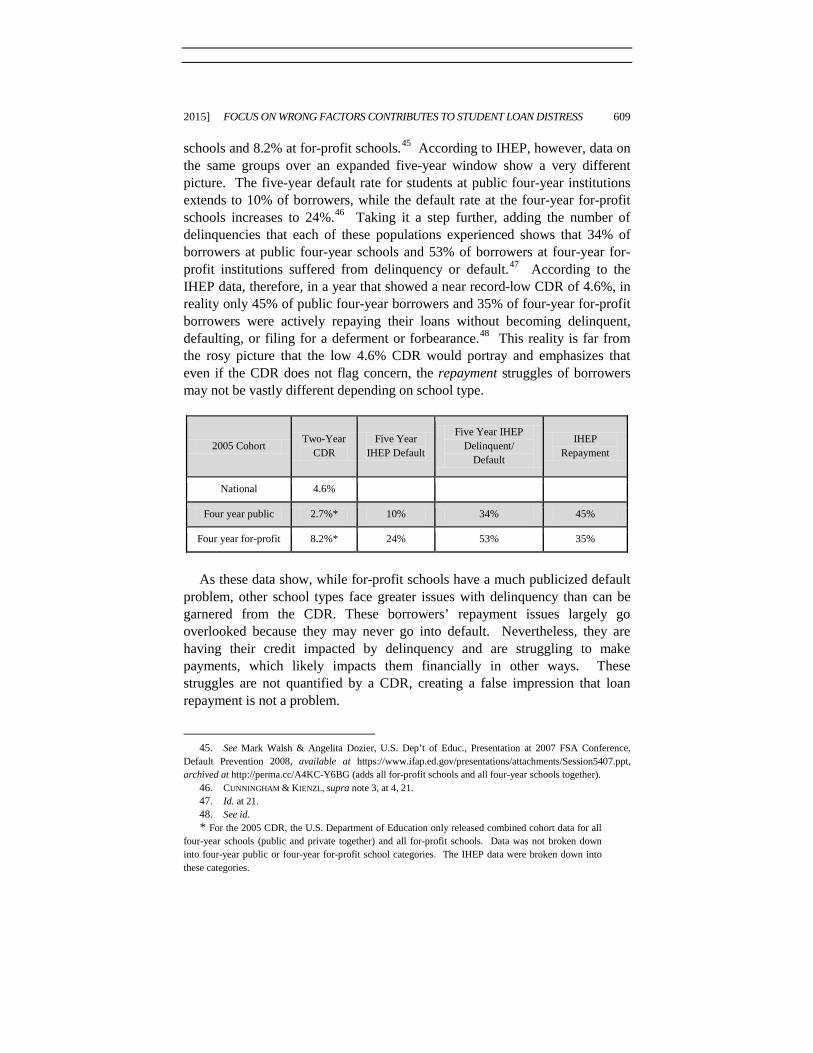
schools and 8.2% at for-profit schools.45 According to IHEP, however, data on the same groups over an expanded five-year window show a very different picture. The five-year default rate for students at public four-year institutions extends to 10% of borrowers, while the default rate at the four-year for-profit schools increases to 24%.46 Taking it a step further, adding the number of delinquencies that each of these populations experienced shows that 34% of borrowers at public four-year schools and 53% of borrowers at four-year for-profit institutions suffered from delinquency or default.47 According to the IHEP data, therefore, in a year that showed a near record-low CDR of 4.6%, in reality only 45% of public four-year borrowers and 35% of four-year for-profit borrowers were actively repaying their loans without becoming delinquent, defaulting, or filing for a deferment or forbearance.48 This reality is far from the rosy picture that the low 4.6% CDR would portray and emphasizes that even if the CDR does not flag concern, the repayment struggles of borrowers may not be vastly different depending on school type.
2005 Cohort Two-Year CDR
Five Year IHEP Default
Five Year IHEP Delinquent/
Default
IHEP Repayment
National 4.6%
Four year public 2.7%* 10% 34% 45%
Four year for-profit 8.2%* 24% 53% 35%
As these data show, while for-profit schools have a much publicized default
problem, other school types face greater issues with delinquency than can be garnered from the CDR. These borrowers’ repayment issues largely go overlooked because they may never go into default. Nevertheless, they are having their credit impacted by delinquency and are struggling to make payments, which likely impacts them financially in other ways. These struggles are not quantified by a CDR, creating a false impression that loan repayment is not a problem.
45. See Mark Walsh & Angelita Dozier, U.S. Dep’t of Educ., Presentation at 2007 FSA Conference, Default Prevention 2008, available at https://www.ifap.ed.gov/presentations/attachments/Session5407.ppt, archived at http://perma.cc/A4KC-Y6BG (adds all for-profit schools and all four-year schools together). 46. CUNNINGHAM & KIENZL, supra note 3, at 4, 21. 47. Id. at 21. 48. See id.
* For the 2005 CDR, the U.S. Department of Education only released combined cohort data for all four-year schools (public and private together) and all for-profit schools. Data was not broken down into four-year public or four-year for-profit school categories. The IHEP data were broken down into these categories.
610 SUFFOLK UNIVERSITY LAW REVIEW [Vol. XLVIII:599
IV. THERE IS NO GOOD MEASURE TO QUANTIFY STUDENT LOAN STRUGGLES BEYOND DEFAULT
The CDR is clearly not the right metric to understand where borrowers are in repayment, but this leaves open the questions of what metric is appropriate and where does the current data fall short. As previously noted, data on repayment and delinquency are not disaggregated in reporting by the U.S. Department of Education, and therefore, all we can do to understand repayment is to cobble together data from various other sources.
A. Delinquency
Just one step back in the process from default, student loan delinquency has most of the same negative consequences as default, such as impact on credit scores and higher costs of credit. Given that delinquency is an indicator of pending default, it also provides an opportunity to cure a repayment challenge before defaulting. As a result, it is important to know just how big the delinquency problem is and how to use the data effectively to prevent default.49
On an individual loan basis, guaranty agencies and loan servicers track student loan delinquency and report that information to the U.S. Department of Education. The federal government, however, has yet to report that information beyond its walls in a consistent way or articulate how large a problem delinquency might be and, consequently, the broader economic result of those repayment missteps. Lacking a definition and precise data from the federal government, various entities have attempted to determine the scope of the delinquency problem based on the data available to them.
1. Federal Reserve Bank of New York Study
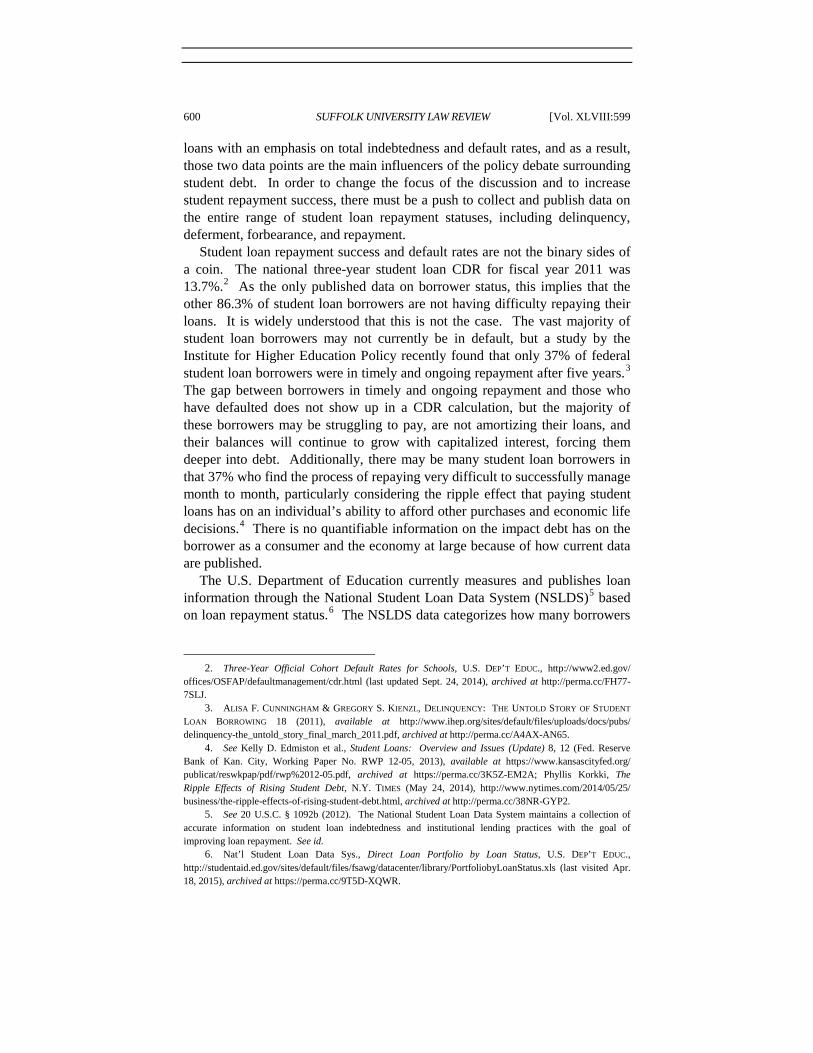
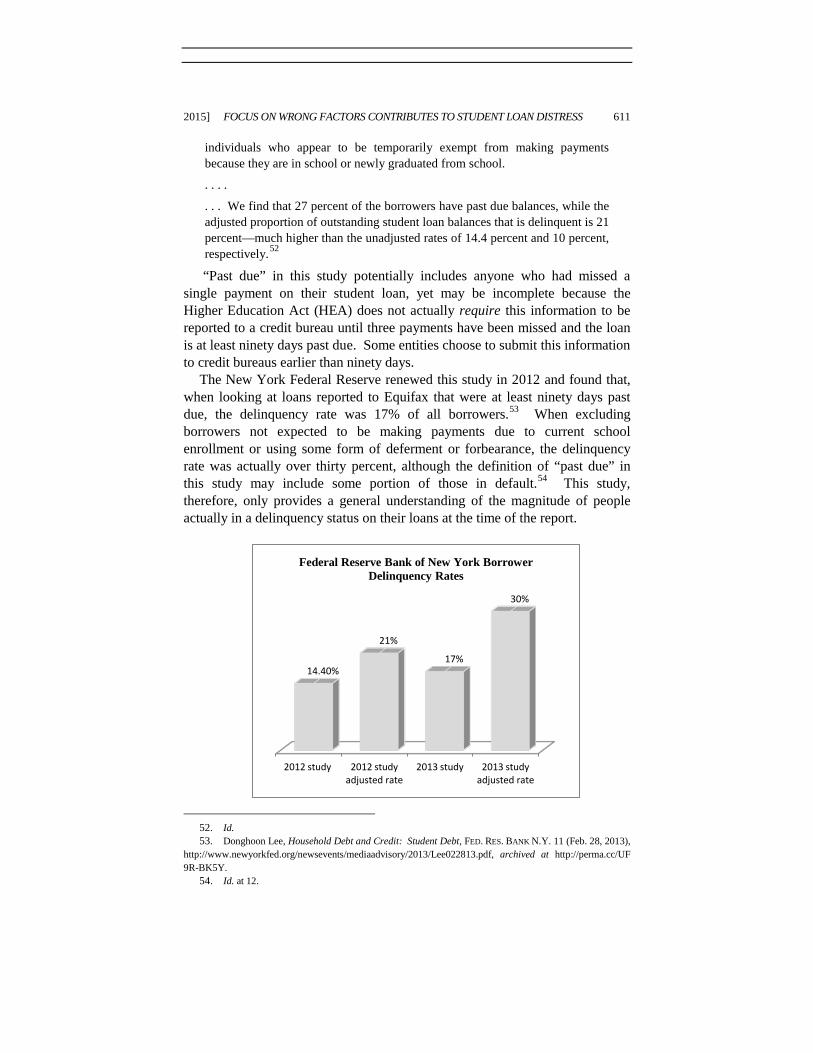
Over the last several years, the Federal Reserve Bank of New York has studied student debt as part of a larger examination of household credit. Using information on repayment reported to the credit bureau Equifax, the Federal Reserve found that of the borrowers “who have outstanding student loan balances as of third-quarter 2011, 14.4 percent . . . have at least one past due student loan account.”50
The report went on to clarify that these data may not be accurate because the number of loans reported included borrowers who were in school or in grace period.51 The report states that:
To address this potential bias in calculating delinquency statistics, we exclude
49. See generally Thomas A. Flint, Predicting Student Loan Defaults, 68 J. HIGHER EDUC. 322 (1997); Laura Greene Knapp & Terry G. Seaks, An Analysis of the Probability of Default on Federally Guaranteed Student Loans, 74 REV. ECON. & STAT. 404 (1992). 50. Meta Brown et al., Grading Student Loans, FED. RES. BANK N.Y. (Mar. 5, 2012), http://libertystreet economics.newyorkfed.org/2012/03/grading-student-loans.html, archived at http://perma.cc/TW86-QKU7. 51. Id.
2015] FOCUS ON WRONG FACTORS CONTRIBUTES TO STUDENT LOAN DISTRESS 611
individuals who appear to be temporarily exempt from making payments because they are in school or newly graduated from school.
. . . .
. . . We find that 27 percent of the borrowers have past due balances, while the adjusted proportion of outstanding student loan balances that is delinquent is 21 percent—much higher than the unadjusted rates of 14.4 percent and 10 percent, respectively.52
“Past due” in this study potentially includes anyone who had missed a single payment on their student loan, yet may be incomplete because the Higher Education Act (HEA) does not actually require this information to be reported to a credit bureau until three payments have been missed and the loan is at least ninety days past due. Some entities choose to submit this information to credit bureaus earlier than ninety days.
The New York Federal Reserve renewed this study in 2012 and found that, when looking at loans reported to Equifax that were at least ninety days past due, the delinquency rate was 17% of all borrowers.53 When excluding borrowers not expected to be making payments due to current school enrollment or using some form of deferment or forbearance, the delinquency rate was actually over thirty percent, although the definition of “past due” in this study may include some portion of those in default.54 This study, therefore, only provides a general understanding of the magnitude of people actually in a delinquency status on their loans at the time of the report.
52. Id. 53. Donghoon Lee, Household Debt and Credit: Student Debt, FED. RES. BANK N.Y. 11 (Feb. 28, 2013), http://www.newyorkfed.org/newsevents/mediaadvisory/2013/Lee022813.pdf, archived at http://perma.cc/UF 9R-BK5Y. 54. Id. at 12.
2012 study 2012 study adjusted rate
2013 study 2013 study adjusted rate
14.40%
21%
17%
30%
Federal Reserve Bank of New York Borrower Delinquency Rates
612 SUFFOLK UNIVERSITY LAW REVIEW [Vol. XLVIII:599
2. Federal Reserve Bank of Kansas City
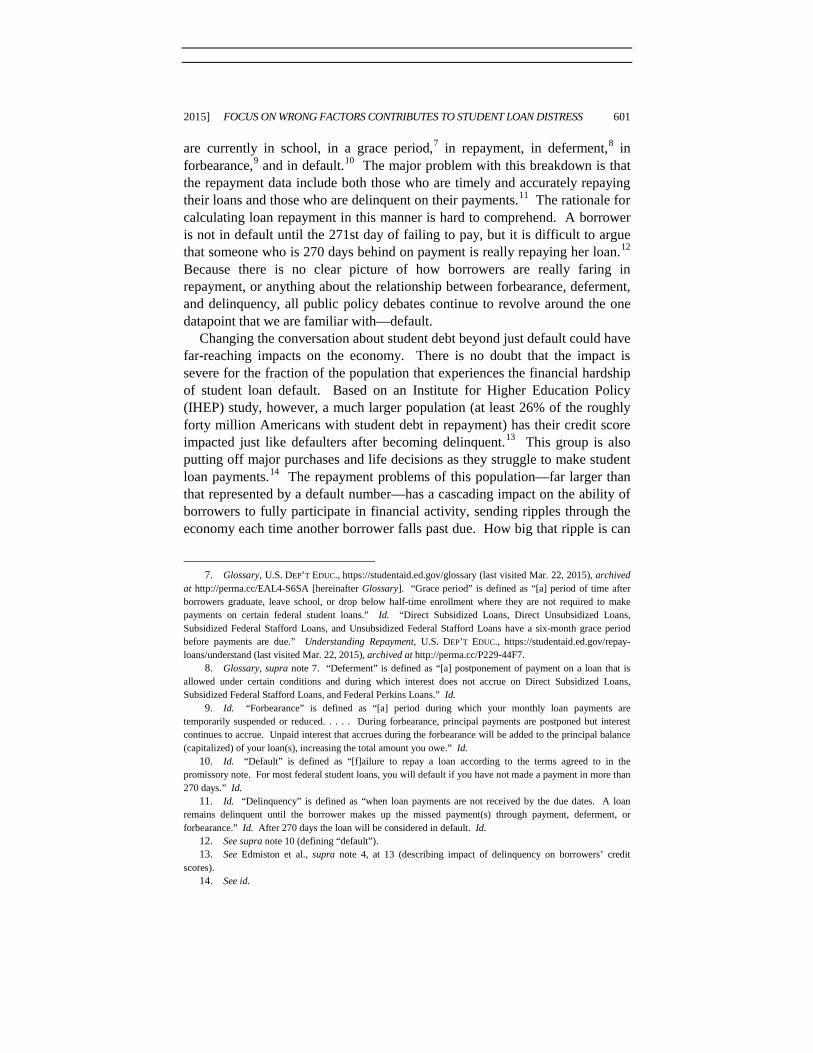
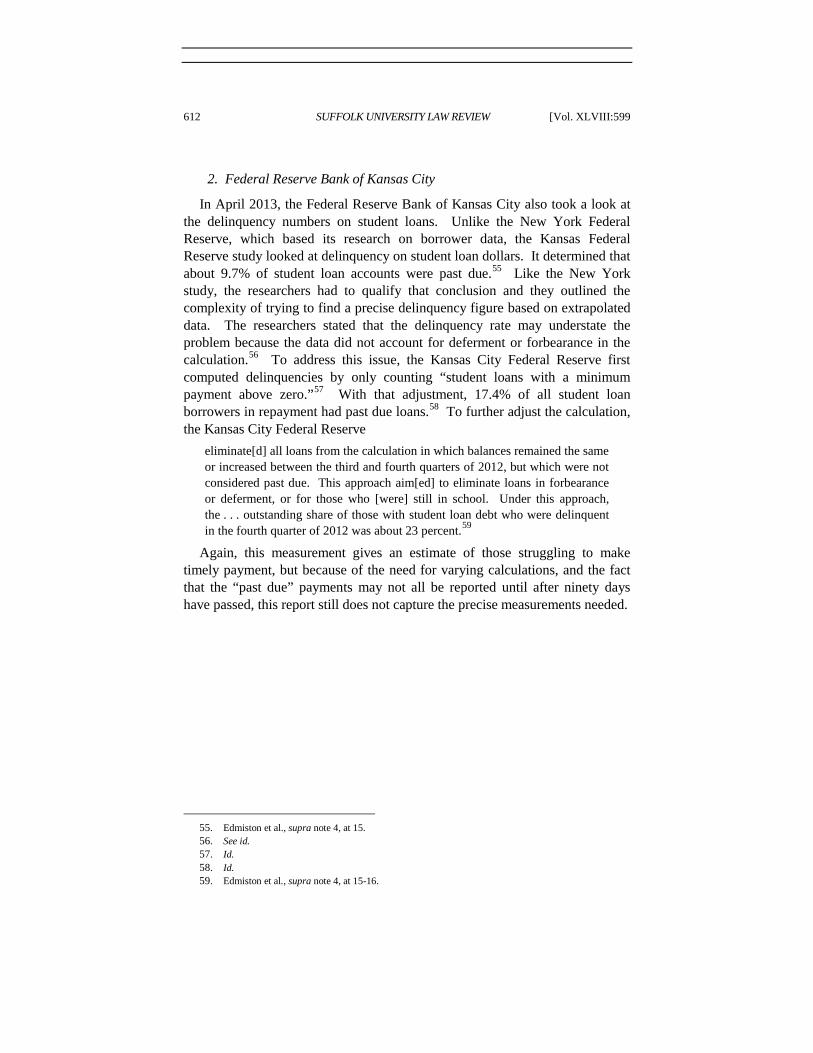
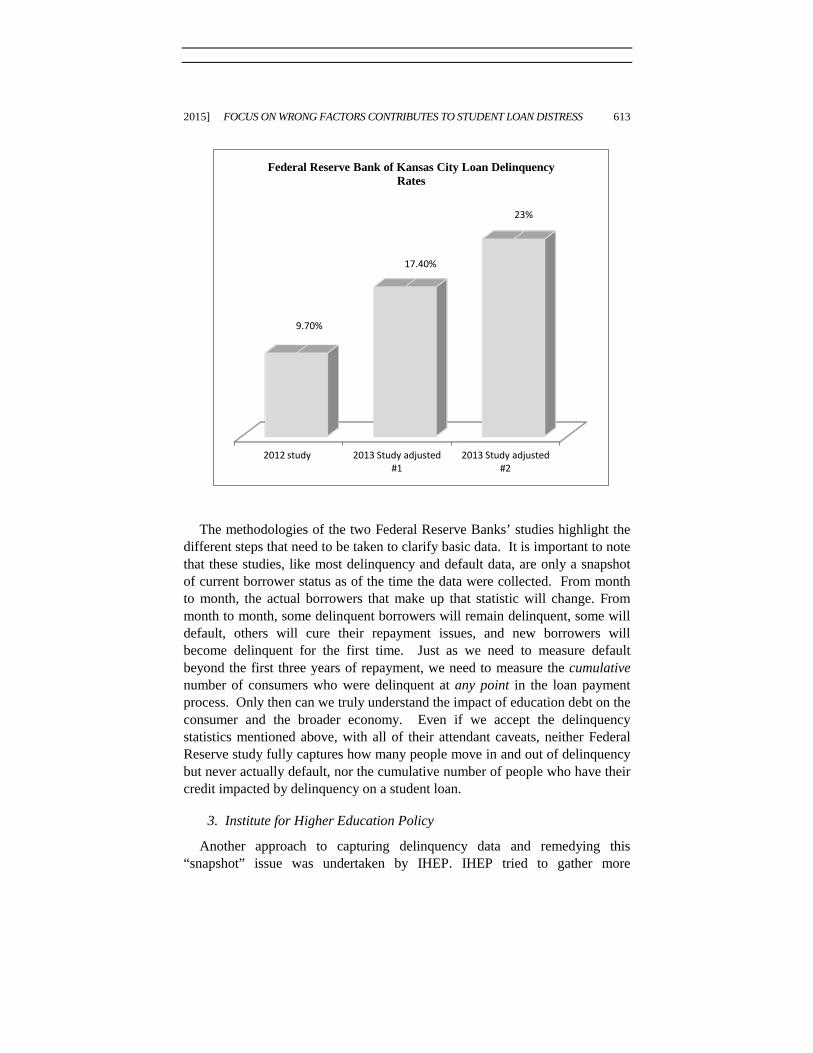
In April 2013, the Federal Reserve Bank of Kansas City also took a look at the delinquency numbers on student loans. Unlike the New York Federal Reserve, which based its research on borrower data, the Kansas Federal Reserve study looked at delinquency on student loan dollars. It determined that about 9.7% of student loan accounts were past due.55 Like the New York study, the researchers had to qualify that conclusion and they outlined the complexity of trying to find a precise delinquency figure based on extrapolated data. The researchers stated that the delinquency rate may understate the problem because the data did not account for deferment or forbearance in the calculation.56 To address this issue, the Kansas City Federal Reserve first computed delinquencies by only counting “student loans with a minimum payment above zero.”57 With that adjustment, 17.4% of all student loan borrowers in repayment had past due loans.58 To further adjust the calculation, the Kansas City Federal Reserve
eliminate[d] all loans from the calculation in which balances remained the same or increased between the third and fourth quarters of 2012, but which were not considered past due. This approach aim[ed] to eliminate loans in forbearance or deferment, or for those who [were] still in school. Under this approach, the . . . outstanding share of those with student loan debt who were delinquent in the fourth quarter of 2012 was about 23 percent.59
Again, this measurement gives an estimate of those struggling to make timely payment, but because of the need for varying calculations, and the fact that the “past due” payments may not all be reported until after ninety days have passed, this report still does not capture the precise measurements needed.
55. Edmiston et al., supra note 4, at 15. 56. See id. 57. Id. 58. Id. 59. Edmiston et al., supra note 4, at 15-16.
2015] FOCUS ON WRONG FACTORS CONTRIBUTES TO STUDENT LOAN DISTRESS 613
The methodologies of the two Federal Reserve Banks’ studies highlight the
different steps that need to be taken to clarify basic data. It is important to note that these studies, like most delinquency and default data, are only a snapshot of current borrower status as of the time the data were collected. From month to month, the actual borrowers that make up that statistic will change. From month to month, some delinquent borrowers will remain delinquent, some will default, others will cure their repayment issues, and new borrowers will become delinquent for the first time. Just as we need to measure default beyond the first three years of repayment, we need to measure the cumulative number of consumers who were delinquent at any point in the loan payment process. Only then can we truly understand the impact of education debt on the consumer and the broader economy. Even if we accept the delinquency statistics mentioned above, with all of their attendant caveats, neither Federal Reserve study fully captures how many people move in and out of delinquency but never actually default, nor the cumulative number of people who have their credit impacted by delinquency on a student loan.
3. Institute for Higher Education Policy
Another approach to capturing delinquency data and remedying this “snapshot” issue was undertaken by IHEP. IHEP tried to gather more
2012 study 2013 Study adjusted #1
2013 Study adjusted #2
9.70%
17.40%
23%
Federal Reserve Bank of Kansas City Loan Delinquency Rates
614 SUFFOLK UNIVERSITY LAW REVIEW [Vol. XLVIII:599
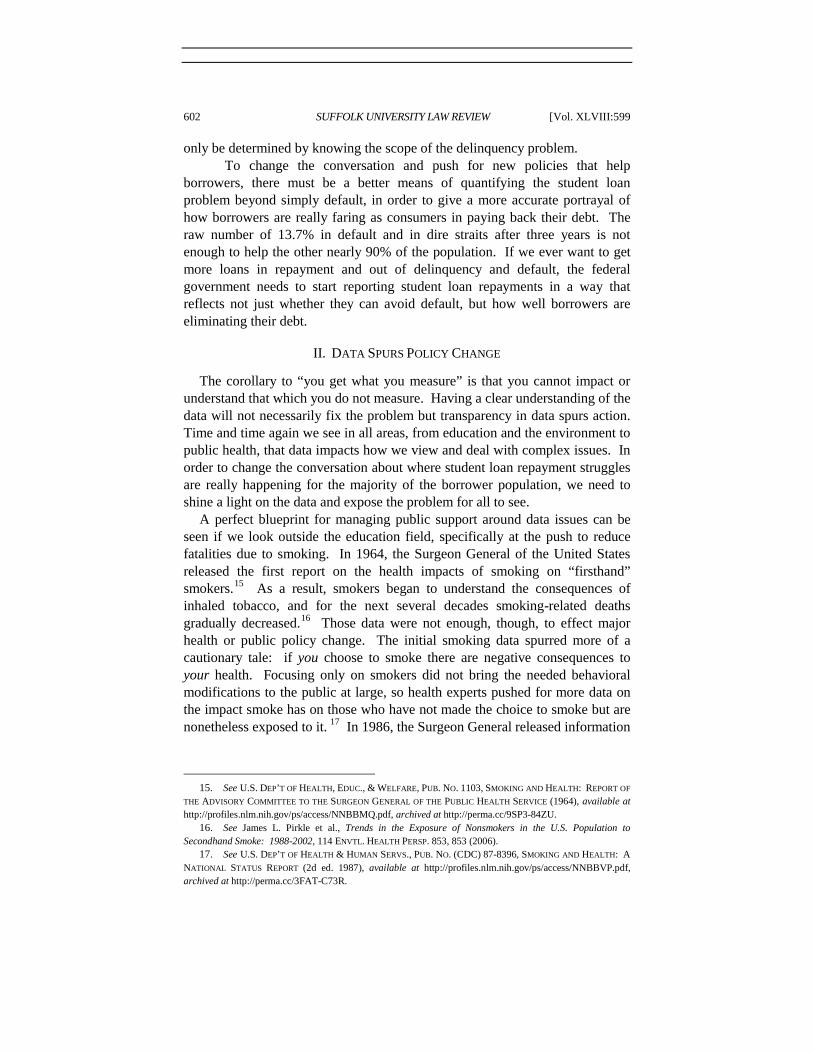
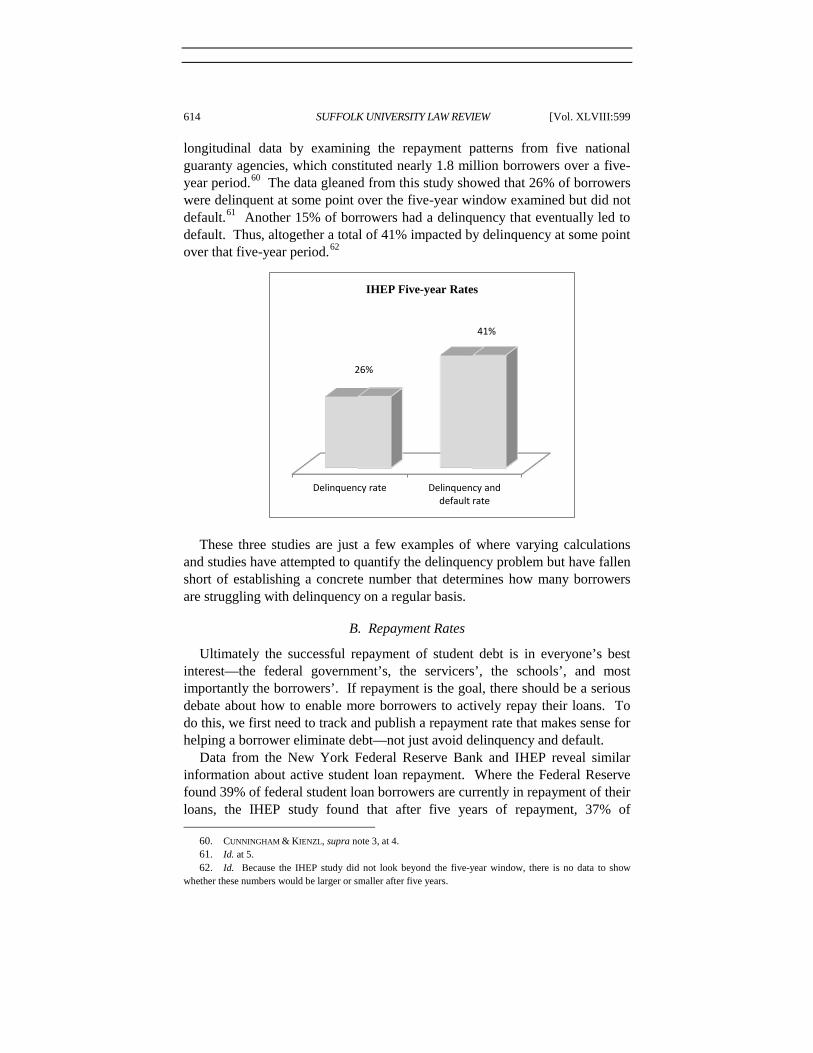
longitudinal data by examining the repayment patterns from five national guaranty agencies, which constituted nearly 1.8 million borrowers over a five-year period.60 The data gleaned from this study showed that 26% of borrowers were delinquent at some point over the five-year window examined but did not default.61 Another 15% of borrowers had a delinquency that eventually led to default. Thus, altogether a total of 41% impacted by delinquency at some point over that five-year period.62
These three studies are just a few examples of where varying calculations
and studies have attempted to quantify the delinquency problem but have fallen short of establishing a concrete number that determines how many borrowers are struggling with delinquency on a regular basis.
B. Repayment Rates
Ultimately the successful repayment of student debt is in everyone’s best interest—the federal government’s, the servicers’, the schools’, and most importantly the borrowers’. If repayment is the goal, there should be a serious debate about how to enable more borrowers to actively repay their loans. To do this, we first need to track and publish a repayment rate that makes sense for helping a borrower eliminate debt—not just avoid delinquency and default.
Data from the New York Federal Reserve Bank and IHEP reveal similar information about active student loan repayment. Where the Federal Reserve found 39% of federal student loan borrowers are currently in repayment of their loans, the IHEP study found that after five years of repayment, 37% of 60. CUNNINGHAM & KIENZL, supra note 3, at 4. 61. Id. at 5. 62. Id. Because the IHEP study did not look beyond the five-year window, there is no data to show whether these numbers would be larger or smaller after five years.
Delinquency rate Delinquency and default rate
26%
41%
IHEP Five-year Rates
2015] FOCUS ON WRONG FACTORS CONTRIBUTES TO STUDENT LOAN DISTRESS 615
borrowers managed to make timely payments without postponing payments or becoming delinquent.63
Unfortunately, there is great debate over what it means or should mean for a borrower to be in repayment: that the borrower is actively paying both the principal and interest on a loan, decreasing the principal; that the borrower is actively paying either the principal or the interest and the principal may stay the same; that the borrower is actively paying the principal or interest on a loan, or is in a repayment program where no payment is currently due; or that the borrower is actively repaying the principal and interest on a loan, or the borrower is less than ninety days past due. Depending on the definition and the method used to parse the numbers, a “repayment rate” can show very different results.
The U.S. Department of Education reports data based on borrower status and reports that 50.7 million borrowers had education loans through either the Federal Family Education Loan (FFEL)64 or Direct Loan (DL) programs65 in the third quarter of 2013.66 This number accounts for borrowers in school, grace period, repayment, deferment, forbearance, default, and an “other” undefined category.67
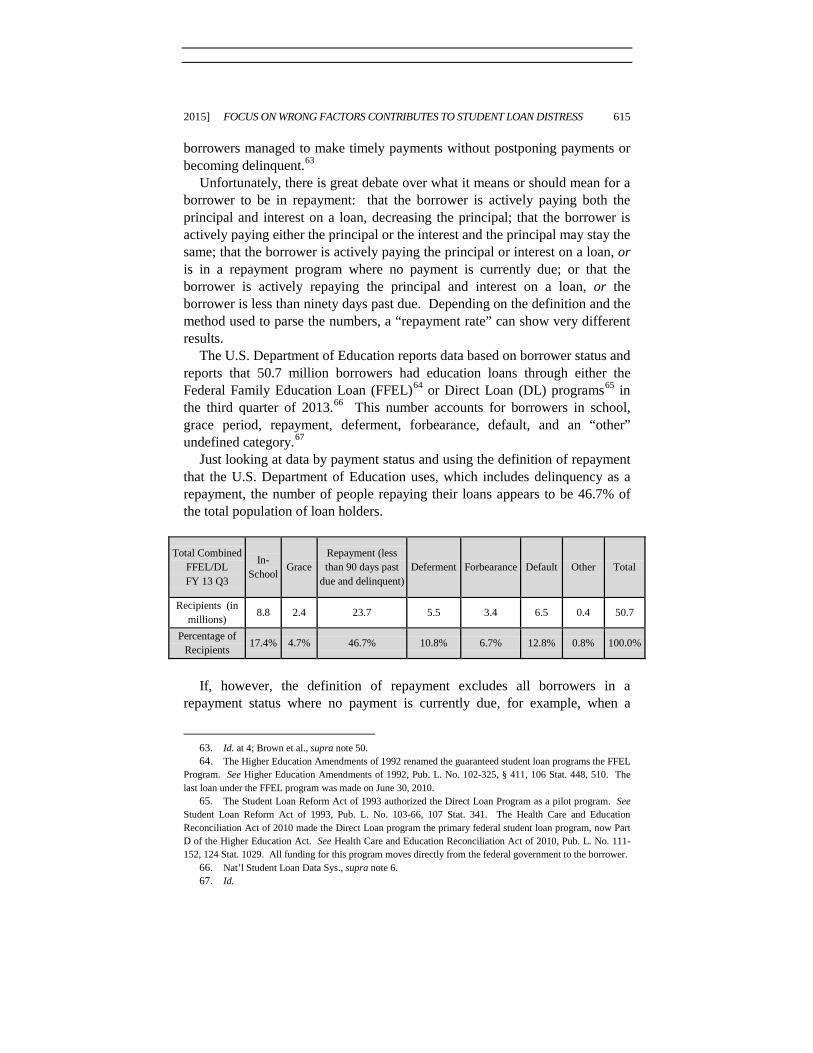
Just looking at data by payment status and using the definition of repayment that the U.S. Department of Education uses, which includes delinquency as a repayment, the number of people repaying their loans appears to be 46.7% of the total population of loan holders.
Total Combined FFEL/DL FY 13 Q3
In-School
Grace Repayment (less than 90 days past
due and delinquent) Deferment Forbearance Default Other Total
Recipients (in millions) 8.8 2.4 23.7 5.5 3.4 6.5 0.4 50.7
Percentage of Recipients 17.4% 4.7% 46.7% 10.8% 6.7% 12.8% 0.8% 100.0%
If, however, the definition of repayment excludes all borrowers in a
repayment status where no payment is currently due, for example, when a
63. Id. at 4; Brown et al., supra note 50. 64. The Higher Education Amendments of 1992 renamed the guaranteed student loan programs the FFEL Program. See Higher Education Amendments of 1992, Pub. L. No. 102-325, § 411, 106 Stat. 448, 510. The last loan under the FFEL program was made on June 30, 2010. 65. The Student Loan Reform Act of 1993 authorized the Direct Loan Program as a pilot program. See Student Loan Reform Act of 1993, Pub. L. No. 103-66, 107 Stat. 341. The Health Care and Education Reconciliation Act of 2010 made the Direct Loan program the primary federal student loan program, now Part D of the Higher Education Act. See Health Care and Education Reconciliation Act of 2010, Pub. L. No. 111-152, 124 Stat. 1029. All funding for this program moves directly from the federal government to the borrower. 66. Nat’l Student Loan Data Sys., supra note 6. 67. Id.
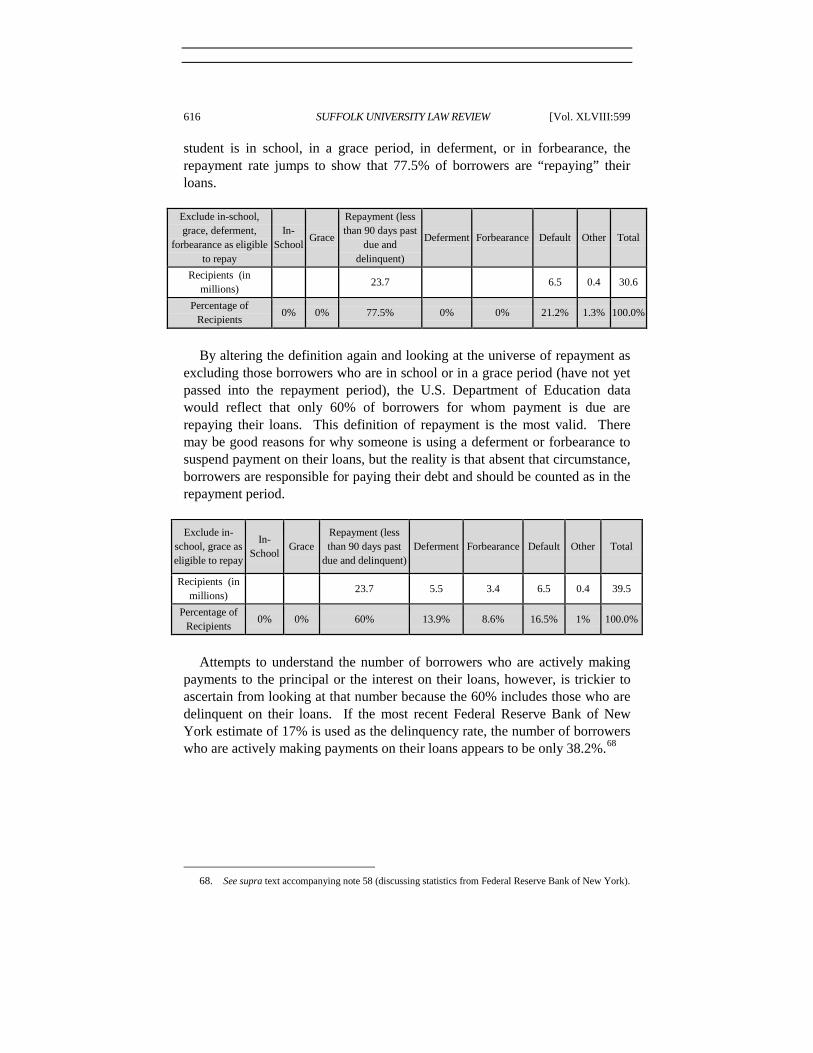
616 SUFFOLK UNIVERSITY LAW REVIEW [Vol. XLVIII:599
student is in school, in a grace period, in deferment, or in forbearance, the repayment rate jumps to show that 77.5% of borrowers are “repaying” their loans.
Exclude in-school, grace, deferment,
forbearance as eligible to repay
In-School Grace
Repayment (less than 90 days past
due and delinquent)
Deferment Forbearance Default Other Total
Recipients (in millions) 23.7 6.5 0.4 30.6
Percentage of Recipients 0% 0% 77.5% 0% 0% 21.2% 1.3% 100.0%
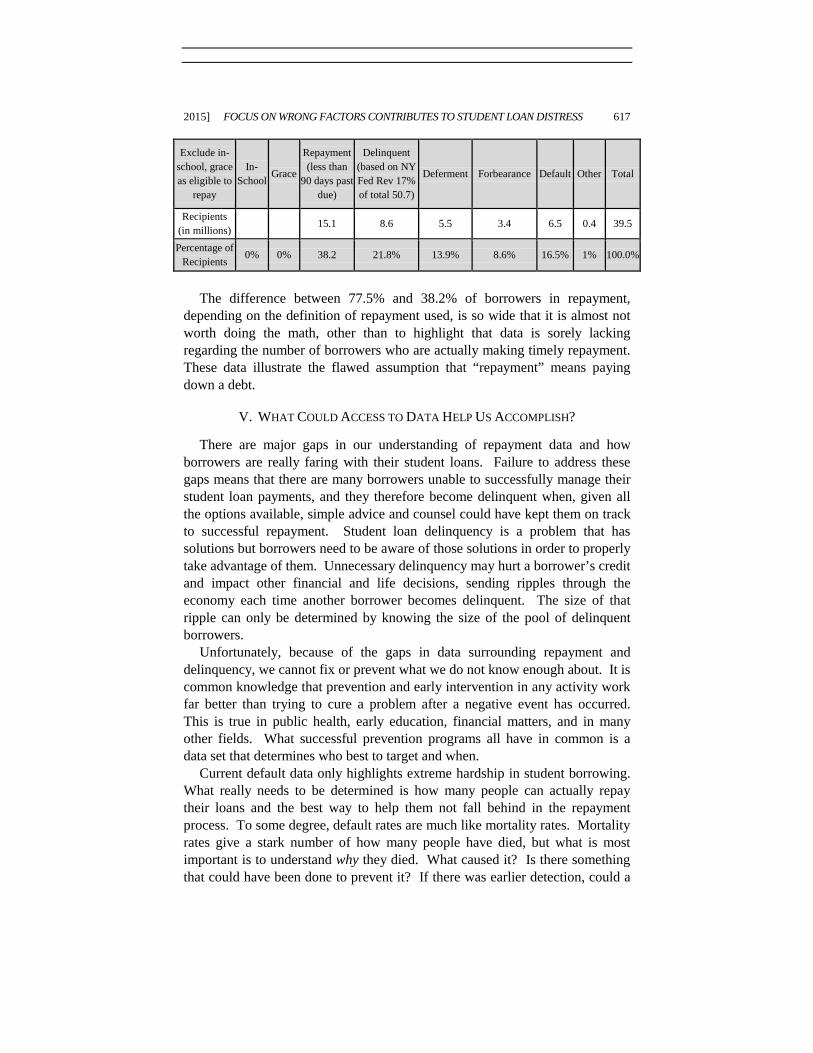
By altering the definition again and looking at the universe of repayment as
excluding those borrowers who are in school or in a grace period (have not yet passed into the repayment period), the U.S. Department of Education data would reflect that only 60% of borrowers for whom payment is due are repaying their loans. This definition of repayment is the most valid. There may be good reasons for why someone is using a deferment or forbearance to suspend payment on their loans, but the reality is that absent that circumstance, borrowers are responsible for paying their debt and should be counted as in the repayment period.
Exclude in-
school, grace as eligible to repay
In-School Grace
Repayment (less than 90 days past
due and delinquent) Deferment Forbearance Default Other Total
Recipients (in millions) 23.7 5.5 3.4 6.5 0.4 39.5
Percentage of Recipients 0% 0% 60% 13.9% 8.6% 16.5% 1% 100.0%
Attempts to understand the number of borrowers who are actively making
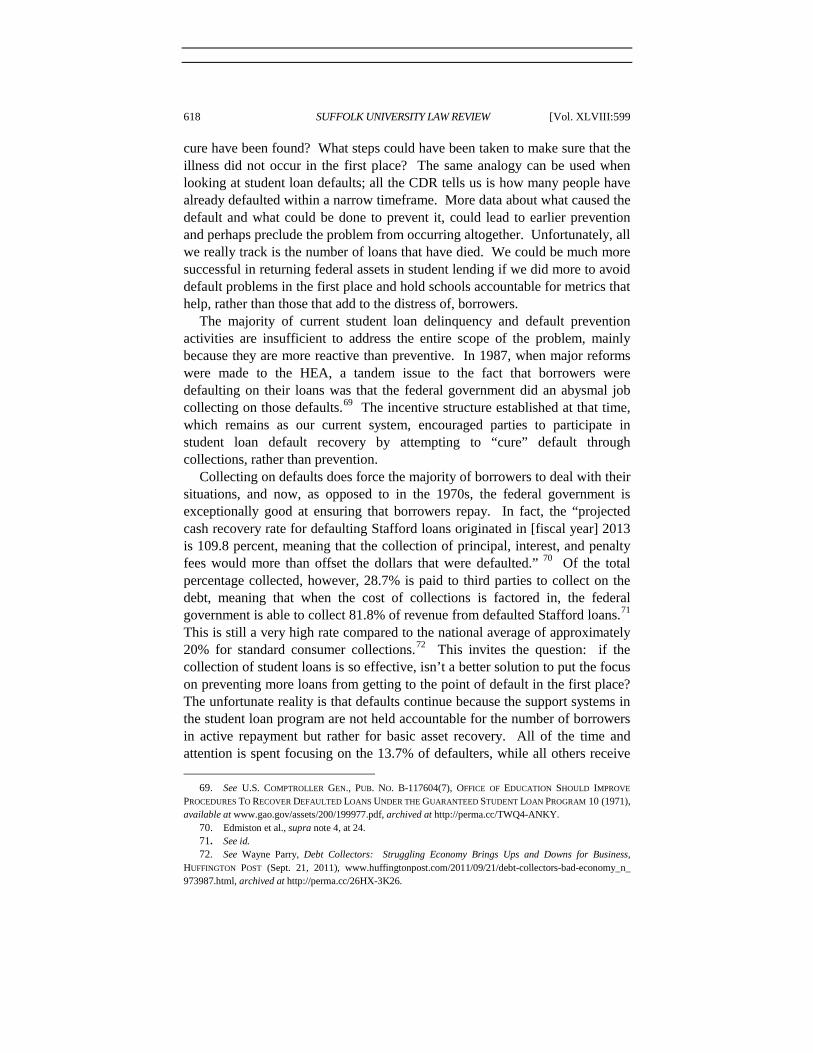
payments to the principal or the interest on their loans, however, is trickier to ascertain from looking at that number because the 60% includes those who are delinquent on their loans. If the most recent Federal Reserve Bank of New York estimate of 17% is used as the delinquency rate, the number of borrowers who are actively making payments on their loans appears to be only 38.2%.68
68. See supra text accompanying note 58 (discussing statistics from Federal Reserve Bank of New York).
2015] FOCUS ON WRONG FACTORS CONTRIBUTES TO STUDENT LOAN DISTRESS 617
Exclude in-school, grace as eligible to
repay
In- School Grace
Repayment (less than
90 days past due)
Delinquent (based on NY Fed Rev 17% of total 50.7)
Deferment Forbearance Default Other Total
Recipients (in millions) 15.1 8.6 5.5 3.4 6.5 0.4 39.5
Percentage of Recipients 0% 0% 38.2 21.8% 13.9% 8.6% 16.5% 1% 100.0%
The difference between 77.5% and 38.2% of borrowers in repayment,
depending on the definition of repayment used, is so wide that it is almost not worth doing the math, other than to highlight that data is sorely lacking regarding the number of borrowers who are actually making timely repayment. These data illustrate the flawed assumption that “repayment” means paying down a debt.
V. WHAT COULD ACCESS TO DATA HELP US ACCOMPLISH?
There are major gaps in our understanding of repayment data and how borrowers are really faring with their student loans. Failure to address these gaps means that there are many borrowers unable to successfully manage their student loan payments, and they therefore become delinquent when, given all the options available, simple advice and counsel could have kept them on track to successful repayment. Student loan delinquency is a problem that has solutions but borrowers need to be aware of those solutions in order to properly take advantage of them. Unnecessary delinquency may hurt a borrower’s credit and impact other financial and life decisions, sending ripples through the economy each time another borrower becomes delinquent. The size of that ripple can only be determined by knowing the size of the pool of delinquent borrowers.
Unfortunately, because of the gaps in data surrounding repayment and delinquency, we cannot fix or prevent what we do not know enough about. It is common knowledge that prevention and early intervention in any activity work far better than trying to cure a problem after a negative event has occurred. This is true in public health, early education, financial matters, and in many other fields. What successful prevention programs all have in common is a data set that determines who best to target and when.
Current default data only highlights extreme hardship in student borrowing. What really needs to be determined is how many people can actually repay their loans and the best way to help them not fall behind in the repayment process. To some degree, default rates are much like mortality rates. Mortality rates give a stark number of how many people have died, but what is most important is to understand why they died. What caused it? Is there something that could have been done to prevent it? If there was earlier detection, could a
618 SUFFOLK UNIVERSITY LAW REVIEW [Vol. XLVIII:599
cure have been found? What steps could have been taken to make sure that the illness did not occur in the first place? The same analogy can be used when looking at student loan defaults; all the CDR tells us is how many people have already defaulted within a narrow timeframe. More data about what caused the default and what could be done to prevent it, could lead to earlier prevention and perhaps preclude the problem from occurring altogether. Unfortunately, all we really track is the number of loans that have died. We could be much more successful in returning federal assets in student lending if we did more to avoid default problems in the first place and hold schools accountable for metrics that help, rather than those that add to the distress of, borrowers.
The majority of current student loan delinquency and default prevention activities are insufficient to address the entire scope of the problem, mainly because they are more reactive than preventive. In 1987, when major reforms were made to the HEA, a tandem issue to the fact that borrowers were defaulting on their loans was that the federal government did an abysmal job collecting on those defaults.69 The incentive structure established at that time, which remains as our current system, encouraged parties to participate in student loan default recovery by attempting to “cure” default through collections, rather than prevention.
Collecting on defaults does force the majority of borrowers to deal with their situations, and now, as opposed to in the 1970s, the federal government is exceptionally good at ensuring that borrowers repay. In fact, the “projected cash recovery rate for defaulting Stafford loans originated in [fiscal year] 2013 is 109.8 percent, meaning that the collection of principal, interest, and penalty fees would more than offset the dollars that were defaulted.” 70 Of the total percentage collected, however, 28.7% is paid to third parties to collect on the debt, meaning that when the cost of collections is factored in, the federal government is able to collect 81.8% of revenue from defaulted Stafford loans.71 This is still a very high rate compared to the national average of approximately 20% for standard consumer collections.72 This invites the question: if the collection of student loans is so effective, isn’t a better solution to put the focus on preventing more loans from getting to the point of default in the first place? The unfortunate reality is that defaults continue because the support systems in the student loan program are not held accountable for the number of borrowers in active repayment but rather for basic asset recovery. All of the time and attention is spent focusing on the 13.7% of defaulters, while all others receive 69. See U.S. COMPTROLLER GEN., PUB. NO. B-117604(7), OFFICE OF EDUCATION SHOULD IMPROVE
PROCEDURES TO RECOVER DEFAULTED LOANS UNDER THE GUARANTEED STUDENT LOAN PROGRAM 10 (1971), available at www.gao.gov/assets/200/199977.pdf, archived at http://perma.cc/TWQ4-ANKY. 70. Edmiston et al., supra note 4, at 24. 71. See id. 72. See Wayne Parry, Debt Collectors: Struggling Economy Brings Ups and Downs for Business, HUFFINGTON POST (Sept. 21, 2011), www.huffingtonpost.com/2011/09/21/debt-collectors-bad-economy_n_ 973987.html, archived at http://perma.cc/26HX-3K26.
2015] FOCUS ON WRONG FACTORS CONTRIBUTES TO STUDENT LOAN DISTRESS 619
minimal support. The entire system is incented to collect rather than prevent. Since the 1987 accountability measures were put in place, higher education
institutions are one place where there has been a focus on prevention. Increased accountability has provided incentives for schools to give borrowers a better understanding of their loan responsibilities. School-based prevention activities, however, are only the beginning of a prevention approach, not the end of the conversation. The best methods of prevention provide information that is personal to an individual’s situation, timely, actionable, and ongoing. This means that information to prevent defaults needs to be available throughout the life of the loan and allow the borrower to take certain actions to avoid going down a road toward default. It cannot end when someone separates from school or moves beyond the CDR default window.
Existing default prevention policies and processes carried out by student loan servicers and guaranty agencies further down the repayment timeline, however, tend to be underfunded, reactive, and too late to save the borrower before their credit worthiness is impacted by delinquency. Loan servicers are required to provide borrower assistance to avoid default and the servicer receives more federal funding for loans in repayment than for delinquent loans. The loan servicing business model, however, is one built on high transaction volume at a low per-borrower cost. Consequently, servicer-borrower interactions are not geared toward effective delivery of proactive intervention. Instead, the system is geared toward providing a quick fix that will keep the borrower out of default, such as arranging for a deferment or forbearance (thus fulfilling the service contract requirement), but not toward providing a long-term solution for the borrower. Changing the focus from simply avoiding default to encouraging the active repayment of student loans would motivate the servicers to assist the broader population of student loan holders.
Prevention of student loan delinquency is, therefore, the way to keep more student loan borrowers successfully on track in a way that will benefit both the individual borrower and the broader economy. The means to that end are to first quantify the problem that exists in a clear and concise way, highlight the scope and breadth of the problem, and show that student loan repayment struggles are not being addressed by current methods. As of the first quarter of fiscal year 2015, there were 52.4 million people at various stages of the student loan process.73 It is easy to imagine the impact that a prevention state of mind in higher education financing policy could have on these borrowers’ finances and the economy as a whole. The only hurdle now is accessing the right data to show the broad impact that 52.4 million student loan borrowers have in countless and unforeseen ways.
73. Nat’l Student Loan Data Sys., supra note 6.
620 SUFFOLK UNIVERSITY LAW REVIEW [Vol. XLVIII:599
VI. RECOMMENDATIONS
A. Default Data
The CDR provides a basis for understanding the number of student loans in default from an individual school, but it does not go far enough to reflect what is actually happening to borrowers year after year. Default data should better track what is happening to individual borrowers over the life of their loan repayment experience.74
There must also be an effort to disincentivize pure collection and incentivize prevention. On paper, current servicer contracts are moving in the right direction to incent servicers to keep loans in good standing, but the reality is that the overall corporate structure of the loan servicers still makes collections more profitable than prevention.75 As noted earlier, some 28.7% of all revenue that is collected on subsidized Stafford loans is lost in order to pay entities to collect on the loan.76 This totals millions of dollars per year that, if even a small fraction was spent months earlier in the repayment process, could have averted the need to collect at all. This would have saved both the borrower’s credit and the need to make major outlays to collectors.
B. Delinquency Data
There are many indicators of future payment challenges other than a missed payment that can be developed so intervention at the right moments with targeted information can be used to assist borrowers with repayment, preventing default. Knowing when a borrower becomes delinquent and moves into other stages on the repayment timeline is vital in order to impact behavior. Currently, however, we have insufficient information to lay out that timeline or ascertain the number of borrowers that are at risk of delinquency or are already having their credit worthiness impacted by delinquency. Delinquency information must be disaggregated from active repayment when reported by the U.S. Department of Education to ensure that the scope of the delinquency problem is well known and can be addressed publicly. Unfortunately, until a need can be articulated, policies to better ensure borrower success will not be put into place.
74. The Cumulative Lifetime Default Rate collected by the U.S. Department of Education is not an “apples to apples” comparison of the CDR as it includes other education loan types and tracks loans rather than borrowers. See Default Rates, U.S. DEP’T EDUC., http://www.ifap.ed.gov/eannouncements/attachments/ 060614ExplanationDefaultRates.pdf (last visited Apr. 19, 2015), archived at http://perma.cc/3ELR-MNCA. 75. See U.S. Department of Education Strengthens Federal Student Loan Servicing, U.S. DEP’T EDUC. (Aug. 29, 2014), http://www.ed.gov/news/press-releases/us-department-education-strengthens-federal-student-loan-servicing, archived at http://perma.cc/9VYH-P5QU. 76. See supra text accompanying note 71.

2015] FOCUS ON WRONG FACTORS CONTRIBUTES TO STUDENT LOAN DISTRESS 621
C. Repayment Data
Most importantly, the federal government must articulate a clear, concise, and consistent definition of the implications of being in repayment on a federal student loan. In July 2010, the U.S. Department of Education launched an effort to control student loan debt by proposing regulations that would require institutions to prove that they were providing borrowers with education that enabled them to acquire the “gainful employment” necessary to help them manage their loan debt.77 One of the proposed requirements was to have programs prove that at least 35% of their borrowers were actively repaying their loans.78 The final rule determined that a loan would be considered in repayment if a borrower was making payments toward either interest or paying the principal on the loan.79 This is a reasonable standard because it allows for income-based repayment plans to be used and reduces the utilization of forbearance and deferment unless absolutely necessary.
Unfortunately, the gainful employment rule came under legal pressure and the court ruled that it could not be enforced as promulgated.80 Last year, the U.S. Department of Education released a new gainful employment regulation that holds schools accountable for the standard CDR and various other metrics, but does not include a repayment rate.81 Even if it is not possible in this political climate to hold schools accountable for repayment rates, in very few other industries is the bar set so low that it is acceptable for only 35% of the population to repay their loans. For the benefit of borrowers, we should at least understand what the repayment rates in other industries are so that we can strive for more than 35% of the population to be actively paying their loan debts.
If we can agree to a definition of repayment that works for borrowers, there are ways already in place to calculate the repayment rate. When the U.S. Department of Education was putting together its gainful employment rules, it developed a model that reflects how many institutions were not meeting the requirement of having at least 35% of the cohort repaying their loans.82 It released the draft data publically and to every institution impacted. Unfortunately, steps have not been taken since that point to improve repayment numbers. Instead of reverting to the unknown, it would be a step in the right
77. See Program Integrity: Gainful Employment—Debt Measures, 76 Fed. Reg. 34,386 (June 13, 2011) (codified at 34 C.F.R. pt. 668). 78. See id. at 34,448. 79. See id. at 34,449. 80. See Ass’n of Private Sector Colls. & Univs. v. Duncan, 681 F.3d 427, 462 (D.C. Cir. 2012) (holding certain portions of regulation violated Administrative Procedures Act). 81. See Program Integrity: Gainful Employment, 79 Fed. Reg. 64,890 (Oct. 31, 2014) (codified at 34 C.F.R. pts. 600 & 668). 82. Negotiated Rulemaking for Higher Education 2009-10–Team I—Program Integrity Issues Analysis and Additional Data, U.S. DEP’T EDUC., http://www2.ed.gov/policy/highered/reg/hearulemaking/ 2009/integrity-analysis.html (last updated Aug. 24, 2010), archived at http://perma.cc/B969-PT68.
622 SUFFOLK UNIVERSITY LAW REVIEW [Vol. XLVIII:599
direction for everyone—schools, borrowers, and the public—to know where the nation stands when it comes to student loan repayment.
Once a definition of repayment has been agreed upon, the U.S. Department of Education should commit to an annual release of the data in line with the annual CDR announcement. Media reports on the topic typically heighten each year immediately following the CDR release. Inclusion of all data in this release would bring greater public scrutiny and, ultimately, needed policy change.
VII. CONCLUSION
Current data on student debt is inadequate to address how borrowers are really fairing in repaying their debts. The data that is available only focuses on the stark population of defaulters, while a much larger population of struggling borrowers languishes in the shadows without acknowledgment or assistance. We need to change the data tracked, published, and talked about in student lending so that we can show that more people are impacted by student loan repayment struggles than just those in the default number. Understanding data more clearly is not the be-all and end-all to fixing a problem, but transparency in data spurs action. Moving the conversation about student debt beyond just default could have a far-reaching impact on the economy by highlighting the need for early prevention programs that alleviate the negative financial impacts of student loan debt.
The public outcry that led to default accountability in the first place is building again, but headlines, such as “Student Loan Default Rates Rise for the Sixth Year,”83 still focus on the only data that we have. The dialogue needs to change to address the fact that “only 38% of borrowers are able to successfully pay down their student loan debt without having their credit impacted by delinquency or default.” To address the reality of what debt really does to borrowers, we need data that helps us better understand the debt and highlights the struggles of those who have repayment challenges but will never be counted in a default number. Public and political pressure will continue to fall on defaults until adequate light is shed on the larger problems that are currently being ignored.
83. Allie Bidwell, Student Loan Default Rates Rise for Sixth Year, U.S. NEWS & WORLD REP. (Oct. 1, 2013), http://www.usnews.com/news/articles/2013/10/01/student-loan-default-rates-rise-for-sixth-year, archived at http://perma.cc/G6D4-3ESU.