minimal data set - health workforcehealthworkforce.eu/wp-content/uploads/2015/09/131202_d... · web...
TRANSCRIPT

JA Health Workforce Planning and Forecasting
D.051 – Release 1MINIMUM PLANNING DATA REQUIREMENTS
WP5 DeliverableD.051
Version/Status Last updated OwnerDraft 01 2013.11.04 Italian TeamDraft 02 2013.11.08 Italian Team – integrationsDraft 02 2013.11.18 With Partners’ comments and notesDraft 03 2013.11.30 Italian Team

D.051 – Release 1MINIMUM PLANNING DATA REQUIREMENTS
________________________________________________________________
WP5
Index1. Management summary..................................................................................................................22. Introduction to the concept of minimum data set (MDS)..............................................................33. The HWF planning conceptual model.............................................................................................44. The planning process......................................................................................................................6
4.1 HWF planning minimum purposes.........................................................................................75. The (quantitative) forecasting model.............................................................................................8
5.1 Supply side..............................................................................................................................95.2 Demand side: a basic quantitative forecasting model..........................................................10
6. Minimum Data Set definitions and requirements........................................................................136.1 Some basic principles...........................................................................................................136.2 What is a minimum data set?...............................................................................................136.3 The elements of the minimum data set................................................................................14
7. Key planning indicators................................................................................................................158. Minimum data set........................................................................................................................199. Appendices...................................................................................................................................20
9.1 Appendix n 1. Some basic concepts for the indicators concerning the HWF demand..........209.2 Appendix n.2 - Definition of each indicator..........................................................................22
9.2.1 Coverage of future demand, high level.........................................................................229.2.2 Relative Affordability....................................................................................................239.2.3 Coverage of future demand, detailed...........................................................................249.2.4 Coverage of needs by foreign professionals today and in the future...........................259.2.5 N° of professionals per inhabitant today and in the future..........................................259.2.6 N° of professionals per weighted inhabitant today and in the future..........................25
9.3 Appendix n.3 – Two examples of calculation for the indicator 1..........................................269.3.1 Example a The indicator 1 (Physicians) with the demand calculated on the base of the future health consumption...........................................................................................................269.3.2 Example 2 b The indicator 1 (Physicians) with the demand calculated on the base of the future weighted population...................................................................................................28
9.4 Appendix n.4 - Minority opinions.........................................................................................319.5 Appendix n.5 – Glossary.......................................................................................................329.6 Appendix n. 6 - Table of references......................................................................................349.7 Appendix n. 7 – WP5 general description.............................................................................37
9.7.1 WP5 scope....................................................................................................................379.7.2 WP5 actions..................................................................................................................379.7.3 WP5 team members.....................................................................................................37
9.8 Appendix n. 8 – WP5 workshop minutes – Milan 19th – 20th of September 2013..............41
Page 1

D.051 – Release 1MINIMUM PLANNING DATA REQUIREMENTS
________________________________________________________________
WP5
MINIMUM DATA SET
1. Management summaryThe healthcare sector constitutes one of the most significant sectors in the EU economy with a growing employment potential due to an increasing demand for healthcare that is driven by several factors such as morbidity, specifically those linked to ageing population, innovative technologies, population expectation in the health systems, among other1.
However, the healthcare sector faces major challenges: an ageing workforce and lack of recruitment in replacing retirees; significant employee turnover in some sectors due to demanding working conditions and
relatively low pay; the need for the workforce to develop new skills to adapt to potential in order to deal with
innovative technologies and with the rise in chronic conditions and comordities2.
Facing these challenges it requests from the policy maker courageous decisions based on a sound forecast of the future impact of any policy put in place. At EU level, an action plan for EU health workforce has been adopted in 2012. One of the actions prioritised in the European Commission’s action plan for EU health workforce (HWF)3 is improving health workforce planning and forecasting to develop policy interventions and inform investment decisions to better match supply and demand and support European countries with health workforce planning which varies considerably 4. The planning process needs a good set of data in order to produce reliable results. Improving health workforce planning and forecasting goes through the identification of a set of key indicators and a process of measurement through the collection of the proper related data.
Reporting shows that some countries still struggle to put a standard and reliable data collection in place, which is the first step for any forecasting exercise. Currently there is no agreement at the international level on minimum data requirements for health workforce planning5.
The Joint Action on Health Workforce Planning and Forecasting (JAEUHWF), funded under the 2012 Health Programme, intends to create a European platform to share good practice and to develop methodologies on forecasting health workforce and skills needs6. The workforce in focus corresponds
1 See Bartosz P. (2010), Astolfi R., Lorenzoni L. Oderkirk J. (2012) and De la Maisonneuve, Martins (2013) for an analysis of the economic impact of the various determinants in healthcare demand.2 See Green paper on the European Workforce for Health, European Comission, 2008.3 Action PLan for the EU health workforce, Commission Staff Working Document (2012) 93 final.4 Feasibility Study: EU level collaboration on Forecasting Health Workforce Needs, Workforce Planning and Health Workforce Trends, Matrix Insight Ltd for the European Commission, May 20125 See note 4.6 http://ec.europa.eu/health/workforce/policy/planning/index_en.htm
Page 2

D.051 – Release 1MINIMUM PLANNING DATA REQUIREMENTS
________________________________________________________________
WP5
to the five “harmonised” professions: Physicians, Nurses, Midwives, Pharmacists, Dentists7.One of the objectives of the Joint Action is to identify a Minimum Data Set for Health Workforce Planning.
A Minimum Data Set (MDS) for Health Workforce Planning consists in a core set of standard variables used to build indicators, which are collected, generally, at a national level, for the reporting and assessment on key aspects of health system delivery. In this paper the focus lays on the current workforce/staffing resources and future Health workforce needs. This can enable the comprehensive analysis of supply, requirements and adequacy in professional-based workforce planning.8
This document contains the results of a shared process involving thirty-seven EU partners of the Joint Action EUHWF (European member states as well as stakeholder organisations)9.
These results are a consensus recommendation on the key planning indicators and the related minimum set of data10, that may be adopted by the EU Member States as a common necessary tool kit to provide basic forecasting and enable a basic planning process to take place11.
A future release of this paper will address the recommendations for the necessary data set and indicators needed to draw future enhanced scenarios. This next release is planned for a second Joint Action programme after 2016.
2. Introduction to the concept of minimum data set (MDS)In the various European countries health systems differ significantly. Even the use of HWF, both as a whole and a single group of professionals, varies widely. In comparing the European Countries it is surprising to see the stability over time of the differences between them 12, depending on traditions, on the organisation of the health and on social security system. The new Member States (MS), which have acceded into the European Union during the last fifteen years, increase the disparity of traditions and organisations.
The planning of human resources in health must takes into account these differences and respect the autonomy of each MS. On the other hand, the free movement of workers within the EU requires the
7 See Directive EU/2005/36 on the recognition of professional qualifications.8 WHO human resources for health minimum data set – 2008. 9 See the list in Appendix n° 9.7.10 The key planning indicators and the minimum data set presented in the next sections reflect the priorities agreed by the Workpackage 5 partners within the EUHWF Joint Action framework and the feedback from the MDS workshop held in Milan on the 19th and 20th of September 2013.11 The Minimum Data Set is not intended to provide (or replace) a country-level workforce planning system. Suggestions for supplementary information are also given so that the MDS can be adapted or developed, if required, to support domestic workforce planning.12 See note 4.
Page 3

D.051 – Release 1MINIMUM PLANNING DATA REQUIREMENTS
________________________________________________________________
WP5
consideration, in dealing with HWF planning, of the EU market as a unique system with common elements in each MS. The Feasibility Study on EU level collaboration on forecasting need, workforce planning and health workforce trends13 pointed out:
"A significant problem driver in this respect is the lack of a sense of cohesive purpose behind data collection. Data on human resources for health are collected for various purposes; but only in a very limited number of countries data are collected for health workforce planning. Hence, certain indicators, which are crucial to forecast and carry out an effective planning of resources, are not covered by data collection. As a consequence, many of the data available at national level are also not integrated and used in health workforce planning."
It is thus necessary to identify a set of key indicators that are instrumental to health workforce planning by defining a conceptual model (meta model).
Accordingly, the first hypothesis is that, despite the differences, a common minimal data set (MDS) can be established and adopted by all MSs, enabling to development of common practices and the exchange of meaningful data and reports.
3. The HWF planning conceptual model The conceptual model contains all the relevant elements of a health workforce planning system14. Below the items of the planning system. The objectives of the HWF planning system (set of outcome indicators). The objective of the
planning system is really the final meaning of the whole project. In literature are cited for example "balance between need and supply" for a profession. This balance can also be required on a regional basis. It is also possible that the objectives include restraints (i.e. budget limitations) which mean that the system also has to find an economical balance. It seems that the process of definition of the objectives is one of the main means to interest stakeholders like policy makers. It is very important to state if the objectives also include indicators and how they are defined.15
The measure of benefits of HWF planning The whole planning process is activated in order to reach the overall goals defined in the previous point (objectives). OECD (2013) points out that very few health workforce planning models have been formally evaluated. Many criteria con be used to assess the quality and impact of health workforce planning models, but probably the main ones are their actual use in policy decision-making and their accuracy in helping to achieve their main objective of ensuring a proper balance over time between the supply and demand of different categories of health workers.
13 See note 4. (p.146)14 See glossary, in Appendix 9.5.15 For a review of the objectives of the HWF planning system in the EU Countries see Matrix (2012) and OECD (2013).
Page 4

D.051 – Release 1MINIMUM PLANNING DATA REQUIREMENTS
________________________________________________________________
WP5
Any National or regional legislation influencing or regulating the HWF planning. As the planning system is a public process it could be a legislation that governs the process and the roles of the different stakeholders.
Actors and organization of the HWF planning. The planning is a process which involves human beings as representatives of stakeholders engaged. So it is important to understand the roles of each actor, who is responsible for the global planning and who is taking the different decisions.
The resources for planning (any human, technical or economic resources). The planning process will need human resources. It is important to face this question by a Country that intends to govern a planning process.
The model of forecasting / simulation. It is important to define the model of forecasting / simulation used. This step will condition the following steps (set reference values, and determine actions for reaching the reference values). In the OECD HWF planning review (2013) one of the key recommendations is that the supply-side need to focus more on retirement patterns. It is pointed out that there is a need to consider more closely the complex issue of work-to-retirement patterns, particularly for physicians but also for other professions as a large number of health care providers are approaching the "standard" retirement age and their retirement decisions will have a major impact on supply in the coming years. It is also put in evidence the need to address adequately the geographical distribution of health workers. A proper assessment of gaps between supply and demand needs to go below the national level to assess geographical (mal-) distribution of physicians, nurses and other health professionals and how it might evolve over time under different conditions.
A set of reference values (targets for the planning process). The reference values (targets) are the specific values of the indicators (drivers) of the forecasting model, in coherence with the objectives of the whole planning system. The reference values are to be compared with the results of the forecasting in order to identify the actions needed to fulfil the objectives of the planning.
The decision on key forecasting elements (time horizon, frequency). The time horizon should permit the planning system to adjust to the desired situation. It is important to perform the forecasting on a regular basis in order to permit subsequent adjustments.
The actions for reaching the reference values. The comparison between the probable future situation and the desired future situation makes it necessary to identify correcting actions to reach the desired situation.
It is possible to find all or some of these elements in every HWF planning system developed in specific Country. So, it is possible to use this conceptual model to map the different HWF in each Country.16
16 The Workpackage 5, within the EUHWF Joint Action frame work, in July 2013 has started a survey on the EU MSs using the conceptual model described in this paragraph in order to update and integrate the Country profile presented in the Feasibility Study (see note 2). The first results of this survey, regarding 13 EU MSs, were used to check the sustainability of the “common minimum data set” described in the section 8.
Page 5

D.051 – Release 1MINIMUM PLANNING DATA REQUIREMENTS
________________________________________________________________
WP5
This conceptual model is important as it stresses the need to focus on the decisions that will be taken (by policy makers) as a result of the programming. It also puts the data collection and the forecasting methods in a setting composed of planners, stakeholders and experts.
The conceptual model distinguishes between the planning process17, which produces a policy proposal, and the forecasting model18, as part of the planning process, which will produce the data necessary for formulating the policy proposal.
Based on this conceptual model it is possible to identify a HWF minimum purpose of planning.
4. The planning processThe HWF planning process is the set of organized activities, task lists and schedules required to achieve scope and targets defined in the health workforce planning system. It includes the making and maintenance of a plan and it combines forecasting of developments with the preparation of scenarios on how to react them (strategies). The planning process necessary to offer decision-makers a technically motivated set of opinions of probable situations in the future (forecasting) can be described by the following figure.
Fig. 1: Elements of the planning process
17 See glossary, in Appendix 9.5.18 See glossary, in Appendix 9.5.
Page 6

D.051 – Release 1MINIMUM PLANNING DATA REQUIREMENTS
________________________________________________________________
WP5
The process of planning works if the forecasting model is based on precise targets, with good knowledge of the error factor on these targets and on the model reliability:
"Health workforce planning is not an exact science and needs regular updating: Assessing the future supply and demand for doctors, nurses or other health professionals 10 or 15 years down the road is a very complicated task, fraught with uncertainties on the supply side and even more so on the demand side. Projections are inevitably based on a set of assumptions about the future; these assumptions need to be regularly re-assessed in light of changing circumstances, new data, and the effect of new policies and programs."19
The output is expressed (measured) by the indicators defined by the planning process. The forecasting model is composed by a set of data as input, a certain number of scenarios based parameters and algorithms. The necessary set of data (the first wheel in the previous figure) depends on the targets and on the indicators. The scope and the targets of planning are the beginning of the forecasting model and need to be considered.
The Work Package 5 (WP5), as part of the Joint Action EUHWF, has defined the Scope and Targets, the key planning indicators and the set of data that is necessary and sufficient for a basic forecasting model, thought of as a starting point for the Countries that need to develop a planning process of Health Work Force.
4.1 HWF planning minimum purposesTo identify the key planning indicators of a basic forecasting model we need, first of all, to define the scope and, subsequently, to set the targets (HWF planning minimum purposes).
The WP5 partners and experts, introducing a priority scheme with the objectives and targets that are necessary to include in a basic planning process, agreed that the scope is:
to recognise the major imbalances of HWF, to analyse these imbalances, to identify possible solutions. 20
This scope was split into three stages as follows:Release Definition & Targets
MDS release 1A Must allow to assess the current situation and to identify imbalances vs. overall evaluation of the supply and the demand for healthcare
MDS release 1B Must allow to evaluate the impact of basic action to correct those imbalances.
Basic actions are defined by actions on:
19 OECD, Health Workforce Planning in OECD Countries 2013 p. 11.20 See WP5 Minutes Milan Workshop, in Appendix 9.8.
Page 7

D.051 – Release 1MINIMUM PLANNING DATA REQUIREMENTS
________________________________________________________________
WP5
Release Definition & Targets health production; inflow (training and immigration) outflow (retirement and emigration)
Evaluation is defined through: major cost aspects of HWF; a first evaluation on impact of imbalances on quality; monitoring overall coverage and geographical variances; identification if domestic production meets the needs;
MDS release 2 Must allow scenario based forecasting including changes in the health care system.This is considered as an advanced model and is not included in the Minimum Data Set, though it will be discussed as a perspective of next action in the sustainability work package.
Special attention has to be set within the evaluation indicators to the non-healthcare related impacts as major Healthcare determinants are to be found outside of the healthcare context. Health workforce planning is a perfect example of Health in All policies concept.
On the base of the information that could be included in a forecasting model, a set of key planning indicators has been defined by the WP5 in order to monitor each of the above-mentioned targets (both stage 1a and stage 1b). Consequently, a list of data, that were necessary and sufficient (minimum), was selected in order to create those indicators.
5. The (quantitative) forecasting model The scope of a quantitative forecasting model is to estimate future scenario as a function of past and current data (time series, cross-sectional or longitudinal data) on the base of specific assumptions. Accordingly it is appropriate when past and current data are available.21 However, it is important to emphasize that, although the forecasting model presented below has a quantitative basis (the indicators proposed in the following pages require the collection of time series of quantitative data), it is clear that the estimates of future quantitative values also depend on judgments and opinions of experts and stakeholders (qualitative forecasting).The forecasting model here proposed contains seven categories of data belonging to two areas: supply of HWF and demand of HWF (see figure below).
21 On the other hand, in the qualitative forecasting models the estimations are based on the opinion and judgment of experts, stakeholders or users and they are appropriate when past data are not available.
Page 8

D.051 – Release 1MINIMUM PLANNING DATA REQUIREMENTS
________________________________________________________________
WP5
Fig. 2: 7 data categories for the HWF quantitative forecasting model 22
To influence policy decisions, forecasting models must be credible. The assumptions underlying different models have a strong influence on results. Transparency of methods and assumptions is a prerequisite for model quality, as is a strategy to validate results23.
5.1 Supply side Training (item 1) is the number of new professionals produced each year by educational
institutions. We suggest, as a basic estimation, to forecast the first years based on the number of students currently within the education system and the following years as the average of the first years. Most of the existing forecasting models are built on the assumptions that the number of trained professionals is the main parameter to create balance between demand and supply of HWF...
The size of the actual Labour force (item 3) depends mainly on the capacity to identify the professionals that are not directly employed in the system but that are actually producing health care, for example retired but still active on a private payment basis. An assumption might be that the numbers professionals not directly employed but active in producing healthcare will be stable over time. In this case they will not influence the changes in supply.
Migration (item 2) has a different importance according to the weight that this phenomenon has in each country. Anyhow its impact on forecasting model will probably grow in the future with more integration within the EU...24
22 WHO - 200923 Astolfi R., Lorenzoni L. Oderkirk J. (2012)
Page 9

D.051 – Release 1MINIMUM PLANNING DATA REQUIREMENTS
________________________________________________________________
WP5
Retirement (item 4) depends on individual decisions and on the legislation that governs the right to retirement. The assumption of the legislation can be part of the parameters that will be shared with the policy makers as the size of the labour force is very sensible to this parameter25.
Job retention (item 5) might be more closely linked to some professions (i.e. nurses) than for others. Its importance changes in the different EU Member States depending also on the habit to early retirement for family reasons. This item can be shared with the policy makers as a parameter in their hands.
On the base of what is stated above, the items on the supply side can be considered stable or can be shared with the policy makers as political decisions to be done.
5.2 Demand side: a basic quantitative forecasting modelConcerning the demand side, there are numerous studies which analyze the wide range of factors influencing the demand of healthcare. The Health conditions including the disability will depend on 26:
The socio demographic factors like age distribution and education The geographic and environmental factors The cultural factors like social norms, behaviour and self efficacy The economic factors like income and wealth
The technology is an significant factor for diagnosis and cure of diseases and the technological development may have an important role for the demand of health care services. The actions from the authorities like health promotion and policy decisions will also influence the demand for health care services and thus for the change in demand of the health workforce.
Unlike the elements relating to the supply side, the many factors that determine the HWF demand are more difficult to measure and therefore to predict (see appendix 1). The aim of this paper is to identify the minimum data set for a basic quantitative forecasting model. Considering that the projection period useful for our basic model will be variable with a maximum of fifteen years for the physicians and taking into account that in this medium period the past trends will be significant for the result, the actual consumption for each age group will represent a good assumption for a basic model. Anyhow, as the institutions and the policies may be an important part of the model, it is necessary to discuss this assumption with the policy makers and not only present the results as facts.
The proposed conceptual model includes all these factors in two categories of data: population needs and health production. Then, the WP 5 partners and experts, in the framework of the Joint
24The indicators 5 and 6 proposed in the section 7, articulated by geographical area, are useful just to measure the impact of the mobility flows in a specific geographical area.25 See note 20.26 See Zegal L., Bolton T. – 2009
Page 10

D.051 – Release 1MINIMUM PLANNING DATA REQUIREMENTS
________________________________________________________________
WP5
Action EUHWF, accordingly to the recent OECD and EC studies and guidelines27, proposed to use a simplified basic model that permits to calculate the demand of HWF on the base of:
population by group of age; health consumption (per age group); and a parameter “k” which transforms the population demand in HWF demand (number of
professionals needed in headcount).
In order to complete the definition the forecasting model, a number of basic assumptions, valid also for more advanced model, have to be made.
Health consumption per capita for each age group remains constant (no compression or
expansion of morbidity).
The percentage of public consumption and private consumption will remain constant so the
total health consumption (HCT) will include also the private consumption.
Health service remains as it is: no change in productivity or technology.
The roles or the scope of practice for each profession remain unchanged (no interaction
between 5 different professional groups)
Current imbalances between supply and demand.
On the base of these assumptions and in the framework of a “minimum purposes of planning” these are the proposals for the two categories of the demand side model.
Population need (item 7) The trend of future demand will be estimated on the base of the demographic change. It can
be assumed that the service prevision does not change over time and the needed growth/reduction in health workforce is equal to the growth in demand based on demographic structure of population. The inflation is not taken into account. For simplicity, we will base on age and disaggregate into three groups: children (Pop1), adults (Pop2) and elderly (Pop3). These groups have to be further defined: children can be in the 0-14 age interval, adult in the 15-64 age interval and elderly in the 65+ interval. The model proposed measures of the pro-capita healthcare consumption (HC) for each age group in year 0 (HC10, HC20 and HC30)and calculate the future healthcare consumption by multiplying the future population in year x (Pop1x, Pop2x and Pop3x) by proportions of healthcare consumption in year 0:Here’s the formula: HCTx = ( HC10*Pop1x + HC20*Pop2x + HC30 *Pop3x)
The need of health workers for health production (item 6)
27 See Przywara B. (2010); Astolfi R. et al. (2012); De la Maisonneuve C. et al. (2013)
Page 11

D.051 – Release 1MINIMUM PLANNING DATA REQUIREMENTS
________________________________________________________________
WP5
The EC measures the health expenditure by age and is also publishing the forecast of the population by age group28. The formula recommended by the WP5 partners and for the calculation of the future need is expressed below:
HWFpx=kp *HCTx
where HCTx = ( HC10*Pop1x + HC20*Pop2x + HC30 *Pop3x)Each group of profession has a specific ratio to the health expenditure (kp). For example in the Italian case, more than 20% of the total public health expenditure is for physicians and close to 40% is for all the professions included in this project29. Any change in expenditure will therefore be closely related to the cost of and the numbers of the professionals working in the health care sector.
Other changes in the assumptions of the demand side model Simplification of the demand side model:
o As a result of the discussion with the policy makers and the stake holders it might be questioned that the increasing age of the population will also increase the demand for health services (see appendix 1). In this case we can assume HC1=HC2=HC3=1 (every single individual demand absorbs the same level of health care consumption). This simplified model will estimate the demand only by the changes in population size; an approach commonly known as a constant health workers to population ratio approach.
o An alternative way to calculate the future need of health personnel is to use the health consumption per age group (HC1, HC2, HC3) for calculating a weight per age group and then calculate a weighted population (see appendix 3) today and tomorrow. It is important to point out that even if the measure used in this case (weighted population) is not expressed in money terms like in the main proposal above, it is based on exactly the same assumptions (health consumption in money terms per age group).
Extension of the demand side model: o Productivity improvement: this can be expressed as a reduction of " kp " by a certain
percentage (you need less health workforce per total health consumption).30
28 See the analyzis done by the Working Group on Ageing Population and Sustainability (AWG) of the Economic Policy Committee (http://europa.eu/epc/working_groups/ageing_en.htm)29 Source: Ragioneria dello Stato.30 For a disquisition on the proposal demand model see Appendix 9.1
Page 12

D.051 – Release 1MINIMUM PLANNING DATA REQUIREMENTS
________________________________________________________________
WP5
6. Minimum Data Set definitions and requirementsA Minimum Data Set (MDS) for Health Workforce Planning consists in a core set of standard variables used to build indicators, which are collected, generally, at a national level, for the reporting and assessment on key aspects of health system delivery. It may be adopted by the EU Member States as a common necessary tool kit to provide basic forecasting and enable a basic planning process to take place.
6.1 Some basic principles The Minimum Data Set presented in this document is based on some basic planning requirements.
1. Universal coverage, i.e. the health care system will provide assistance to all citizens without excluding poor or rich that means it means that the forecast for the need of professionals includes the needs of the whole population of the Country.
2. Affordability, i.e. the cost of the future health care system has to be kept within the limits of what is considered sustainable by the population.
3. Effectiveness, i.e. in considering the future need of professionals is it important to bear in mind good production parameters.
4. Imbalances are not an option as they are a threat to the coverage and quality, i.e. it is not acceptable to plan for a number of professionals that is lower than that which ensures a good quality).
5. Education and not immigration to meet Healthcare needs, i.e. each country has to plan how cover its own HWF needs, migration is a right for the EU citizens but should not be used systematically as a source to cover the population’s need31
6.2 What is a minimum data set?A minimum data set is a minimum number of data items that has to be presented as an input to a decision-making process in order to be able to reach a certain goal. The decision-making process in this case is the planning for the future needs of the health work force. 32
A Health Workforce Planning System consists of a core set of key indicators which are used, generally, at a national level, for the collection and reporting on key aspects of health system delivery, including current workforce/staffing resources and future Health workforce needs. This can enable the comprehensive analysis of supply, requirements and adequacy in professional-based workforce planning (WHO – 2008). The data are for planning as well as to
31 See WHO Global code of practice on the international recruitment of health personnel (2010)32 The Feasibility Study suggests a "common" data set in order to facilitate the exchange of information across Europe and across regions. In this case common means a data set that is the same for all Member States. As today's situation of planning is very different between the EU countries, the EC has found that it is more important to define a "minimum" data set that will fulfill the basic need for planning in a Member State that starts the HWF planning process.
Page 13

D.051 – Release 1MINIMUM PLANNING DATA REQUIREMENTS
________________________________________________________________
WP5
promote coordination and collaboration between stakeholders at the national and European level.33
The process of collecting data is very costly in terms of time, use of resources, quality control, and necessary reiteration of the process. Thus it is necessary to contemplate the need of each data item before starting the process, balancing the cost of collecting and processing the information and the value of the decision to be made on the basis of that information.
6.3 The elements of the minimum data setIn accordance with the principles and the definition presented above, a minimum dataset must contain the data necessary and sufficient to measure, by means of specific indicators (key planning indicators), the seven categories of the forecasting model (see Fig. 2). In particular, the key planning indicators presented in the next section measure the categories of the forecasting model that WP5 partners and experts have deemed priority in the light of to the three-stages scheme presented in section 4.1.So, the set of data used in the key planning indicators formulas, which is necessary for the Minimum Purpose of Planning, is the MDS.The Health Workforce MDS for planning thus conceived is focused on physicians, pharmacists, dentists, nurses and midwives.
33 See note 4.
Page 14

D.051 – Release 1MINIMUM PLANNING DATA REQUIREMENTS
________________________________________________________________
WP5
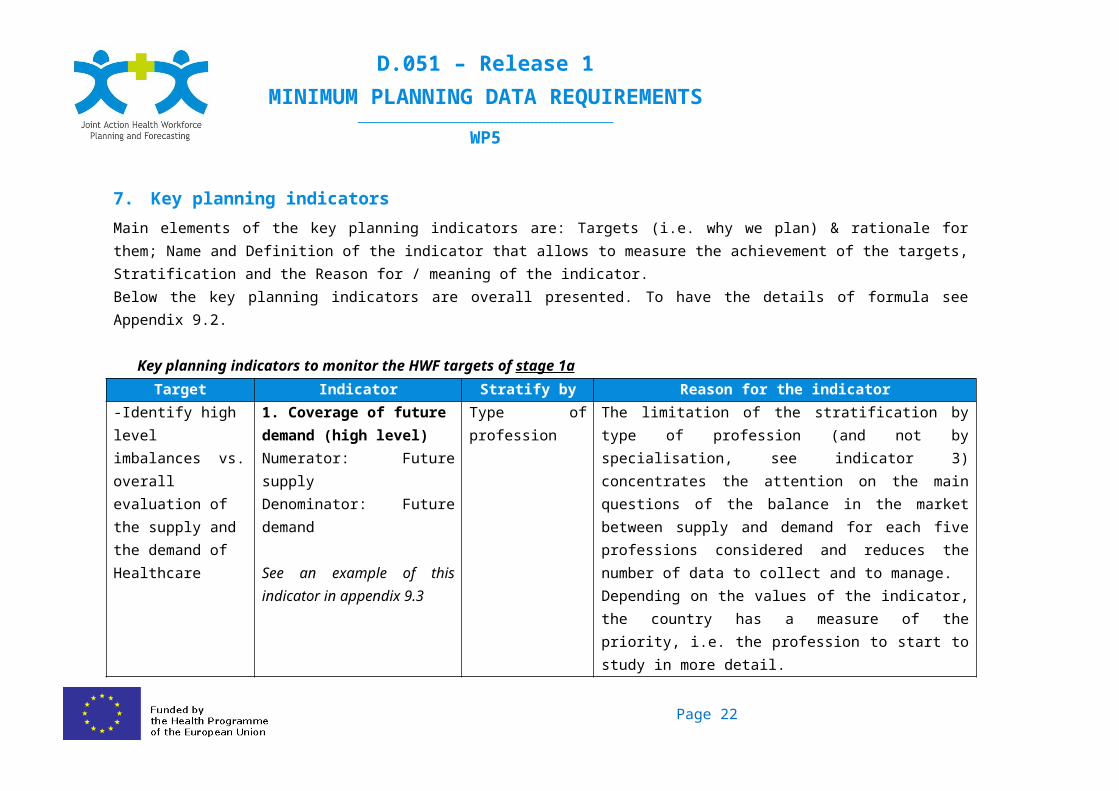
7. Key planning indicators Main elements of the key planning indicators are: Targets (i.e. why we plan) & rationale for them; Name and Definition of the indicator that allows to measure the achievement of the targets, Stratification and the Reason for / meaning of the indicator.Below the key planning indicators are overall presented. To have the details of formula see Appendix 9.2.
Key planning indicators to monitor the HWF targets of stage 1aTarget Indicator Stratify by Reason for the indicator
-Identify high level imbalances vs. overall evaluation of the supply and the demand of Healthcare
1. Coverage of future demand (high level)Numerator: Future supplyDenominator: Future demand
See an example of this indicator in appendix 9.3
Type of profession The limitation of the stratification by type of profession (and not by specialisation, see indicator 3) concentrates the attention on the main questions of the balance in the market between supply and demand for each five professions considered and reduces the number of data to collect and to manage.Depending on the values of the indicator, the country has a measure of the priority, i.e. the profession to start to study in more detail.A value of the indicator >1 means a future surplus of professionals, a value = 1 means a balance between supply and demand, a value < 1 means a future shortage of professionals.Please, note that the projection of demand starts from the assumption that currently there is balance between supply and demand.
Page 15
D.051 – Release 1MINIMUM PLANNING DATA REQUIREMENTS
________________________________________________________________
WP5
Key planning indicators to monitor the HWF targets of stage 1bTarget Indicator Stratify by Reason for the indicator
-Identify major affordability aspects of HWF;-First evaluation on impact of imbalances on quality
2. AffordabilityNumerator: Future health consumptionDenominator: Current health consumption
Depends on the responsibility for the health consumption. If it is on country level, the indicator will not be articulated further.
This indicator is forecasting the health consumption as a result of the changes in population. It is a base for overall evaluations of what the country can permit in relation to the total cost and, perhaps, which changes of the Health Production will be necessary in order to offer the same quality as today to the citizens. A value of the indicator >1 means higher consumption in the future compared with the current situation, a value = 1 means a balance between future and current consumption, a value < 1 means lower consumption in the future as compared of today's situation.
Page 16

D.051 – Release 1MINIMUM PLANNING DATA REQUIREMENTS
________________________________________________________________
WP5
Target Indicator Stratify by Reason for the indicator-Monitor overall coverage-Identify detailed imbalances-Identify if inland production meets the needs-First evaluation on impact of imbalances on quality
3. Coverage of future demand, detailedNumerator: Future supply inland + Future potential supply from abroadDenominator: Future demand
4. Coverage of needs by foreign professionals today and in the futureNumerator: N° of professionals with foreign first qualification.Denominator: Total n° of professionals.
Type of profession.Single specialisation within the type of profession.
The first indicator shows, for each specialisation, the future balance of the HWF in the country using the current legislation and the current organisation regarding education, retirement, migration etc. Any shortage (indicator <1) will require an action, for example on the number of intake in university. Any surplus (indicator >1) will need an action in the opposite direction.The second indicator shows the part of the professionals that are covered by immigration from other countries. This is a potential critical issue as compared to the international policy of migration and regarding the need to introduce foreign professionals in the national system.
Page 17

D.051 – Release 1MINIMUM PLANNING DATA REQUIREMENTS
________________________________________________________________
WP5
Target Indicator Stratify by Reason for the indicator-Monitor geographical variances of coverage
5. N° of professionals per inhabitant today and in the futureNumerator: N° of professionalsDenominator: population6. N° of professionals per weighted inhabitant today and in the futureNumerator: N° of professionalsDenominator: population weighted by the consumption per age group (basic index: average of EU countries)
region within the country articulated by macro-area in order to separate the greater municipal areas (for example Province in Italy, Department in France etc..).
The two indicators are complementary as the first one show the real figures of the number of professionals per inhabitant but might not be connected to the differences in age of the population. The second indicator makes it possible to compare different regions within a country and different countries. The method to weight the population is the same that is used to calculate the future demand (indicator 3).There are no international standards for this indicator. Each country has to establish their own values as standard for these indicators that will be used to compare a region with another or a country with other countries and the current situation with the future situation.
Page 18

D.051 – Release 1MINIMUM PLANNING DATA REQUIREMENTS
________________________________________________________________
WP5 Italy Ministry of Health / Agenas
8. Minimum data setHere are listed the necessary and sufficient (minimum) data to create the indicators in described in the previous paragraph.
Information needed for measuring the indicator 1 –Minimum Data Set 1a (see appendix 9.2)
Areas Supply Demand
CategoryCharacterisation
Labour force
TrainingRetiremen
tMigration (outflow)
Migration (inflow)
Population
Type of profession x x x x xAge x x x x x XHead count x x x x x X
Information needed for measuring the indicators 2, 3, 4, 5 and 6Minimum Data Set 1b (see appendix 9.2)
Areas Supply Demand
CategoryCharacterisation
Labour force
TrainingRetiremen
tMigration (outflow)
Migration (inflow)
Population
Type x x x x xAge x x x x x xHead count x x x x x xFTE xGeographical area x x x x x xSpecialisation (where applied)
x x x x x
Country of first qualification x x x x x
Page 19

D.051 – Release 1MINIMUM PLANNING DATA REQUIREMENTS
________________________________________________________________
WP5
9. Appendices
9.1 Appendix n 1. Some basic concepts for the indicators concerning the HWF demandOECD has recently published two documents, OECD Health Working Papers n 59 "Comparative Analysis of Health Forecasting Methods"34 and OECD Economic Policy Papers n 6 "Public spending on health and long-term care: a new set of projections"35.
The first paper classifies the quantitative demand forecasting model proposed in this paper as "Component based models": indeed it forecasts health expenditure by component, such as by financing agent or providers of care and the forecast are usually estimated by age group. This type of forecasting models is the dominant class, accounting for more than half of all forecasting models surveyed by their study. One of the reasons for their proliferation is a focus on demographic drivers of health expenditure growth. They are also less data intensive and less complex than other type of models and they are considered most appropriate for short-term projections as they depend on clear and undisturbed trends. According to the study, virtually all existing models account for demographic shifts in the population and some focus specifically on scenarios about the potential future health status of older people. The study points out that two other important influences on health expenditure growth that are the least understood include technological innovation and the role played by changes in health-seeking behaviour and underlying social norms about health and illness, and that there is little empirical evidence on these factors upon which models may be developed.
Regarding "Demographical factors and health status", the authors report that around 25 % of life time health expenditures are concentrated in the last year of life and it might be that traditional projection methods overestimate the influence of population ageing because longevity gains could progressively postpone health expenditure from one age class to the next, rather than raise it. The relationship between life expectancy and morbidity can follow different paths. The first is known as the "health ageing" hypothesis, and assumes that increase of life expectancy corresponds to an equal increase in years of healthy life before the morbidity period prior to death. The second is a pessimistic view of expansion of morbidity where by increases in life expectancy yield a longer-time spent with ill-health and reduced quality of life. The third and opposite theory is known as "compression of morbidity" where longevity gains can be associated with an increase of healthy-life period.
The paper does not report evidence that one or another model is better than the others but concludes that the forecast models should be valued for their ability to demonstrate the likely future course of events, if past trends continue.
34 OECD 2012.35 OECD 2013.
Page 20

D.051 – Release 1MINIMUM PLANNING DATA REQUIREMENTS
________________________________________________________________
WP5
The second study compares the actual evolution of public health and long-term care expenditures with the projections made by an OECD study 2006. They find that the actual development of the last years was higher than the most expensive trend (called the "cost-pressure scenario"). The study then assumes the "compression of morbidity" relationship between life expectancy and morbidity (for definition see the first study above) and makes projections up to 2060. The projections shows that the more mature countries (the Nordic countries as well as the United States and the United Kingdom) will have a lower increase of costs while the poorer countries will have above average increases in public health expenditures. As an average, the percentage of GDP will increase in an interval between 3,5% of GDP to 8% of GDP. With the assumptions made, the demographic and income effects will play only a minor role in the projected increase of public health and long-term care expenditures.
When considering the implications of these two studies for this project we have to take into account that the projection period in our case will be around fifteen years and not fifty years. The past trends will therefore be more significant for the result. Even if the role of the ageing population to the increase of future expenditures is not certain (see the first study), but we think that, at the present state of art, it will represent a good assumption for our model. As the institutions and the policies may be an important part of the model, we think that it is necessary to discuss the effects with the policy makers and not only present the results as facts. The overall effect of the indicators, and in particular the indicators 2, 5 and 6 may help in these discussions.
Page 21
D.051 – Release 1MINIMUM PLANNING DATA REQUIREMENTS
________________________________________________________________
WP5
9.2 Appendix n.2 - Definition of each indicator
9.2.1 Coverage of future demand, high level
Numerator: Future supply domestic + Future supply abroadDenominator: Future demandArticulated by: Type of professionNumerator: Future supplyFuture supply domestic= current stock + from education - retiredFuture supply abroad = + immigration - emigrationCurrent stock: Current number of professionals (headcount) that are currently producing health care stratified by type (5 types) and age.From education: Forecast of number of professionals (headcount) that complete education (basic or specialist) and are licensed to practice during the period. The first years will be calculated on the base of the current students in training; subsequently the actual training capacity (average of the statistics of the last years) of will be used.Retired: Forecast of number of professionals (headcount) that will retire each year using the actual probability according to the existing laws of the country.Immigration: Forecast of number of licensed and recognised professionals (headcount) that may enter the country calculated using the average of the last years.Emigration: Forecast of number of practising professionals (headcount) that may leave the country calculated using the average of the last years.Denominator: Future demandFuture demand = HWFpx=kp *HCTx where
HCTx = ( HC10*Pop1x + HC20*Pop2x + HC30 *Pop3x) (2)HWFpx : The demand of a specific profession "p" (headcounts) in the year x.kp: The constant that connects the total health production with the demand for a specific profession.HCTx : The total health consumption in year x.(1)HC10: The pro capite consumption of age group 1 in year 0 (basic year)HC20: The pro capite consumption of age group 2 in year 0 (basic year)HC30: The pro capite consumption of age group 3 in year 0 (basic year)Pop1x: The population of age group 1 in year x.Pop2x: The population of age group 2 in year x.Pop3x: The population of age group 3 in year x.Note(1): it is important to check the sustainability of the total health consumption in year x compared with the current consumption.Note(2): the values of these parameters are available from OECD / Eurostat / WHO
Page 22

D.051 – Release 1MINIMUM PLANNING DATA REQUIREMENTS
________________________________________________________________
WP5
9.2.2 Relative Affordability
Numerator: Future health consumptionDenominator: Current health consumptionArticulated by: Depends on the institution responsible for the health consumption. If it is on country level, the indicator will not be articulated further, otherwise it has to be further detailed.Numerator: Future health consumptionHCTx : The total health consumption in year x.
HCTx = ( HC10*Pop1x + HC20*Pop2x + HC30 *Pop3x)HCTx : The total health consumption in year x.HC10: The pro capite consumption of age group 1 in year 0 (basic year)HC20: The pro capite consumption of age group 2 in year 0 (basic year)HC30: The pro capite consumption of age group 3 in year 0 (basic year)Pop1x: The population of age group 1 in year x.Pop2x: The population of age group 2 in year x.Pop3x: The population of age group 3 in year x.Denominator: Current health consumption:HCT0 : The total current health consumption.
HCT0 = ( HC10*Pop10 + HC20*Pop20 + HC30 *Pop30)HC10: The current pro capite consumption of age group 1HC20: The current pro capite consumption of age group 2HC30: The current pro capite consumption of age group 3Pop1x: The current population of age group 1.Pop2x: The current population of age group 2.Pop3x: The current population of age group 3.
Page 23

D.051 – Release 1MINIMUM PLANNING DATA REQUIREMENTS
________________________________________________________________
WP5
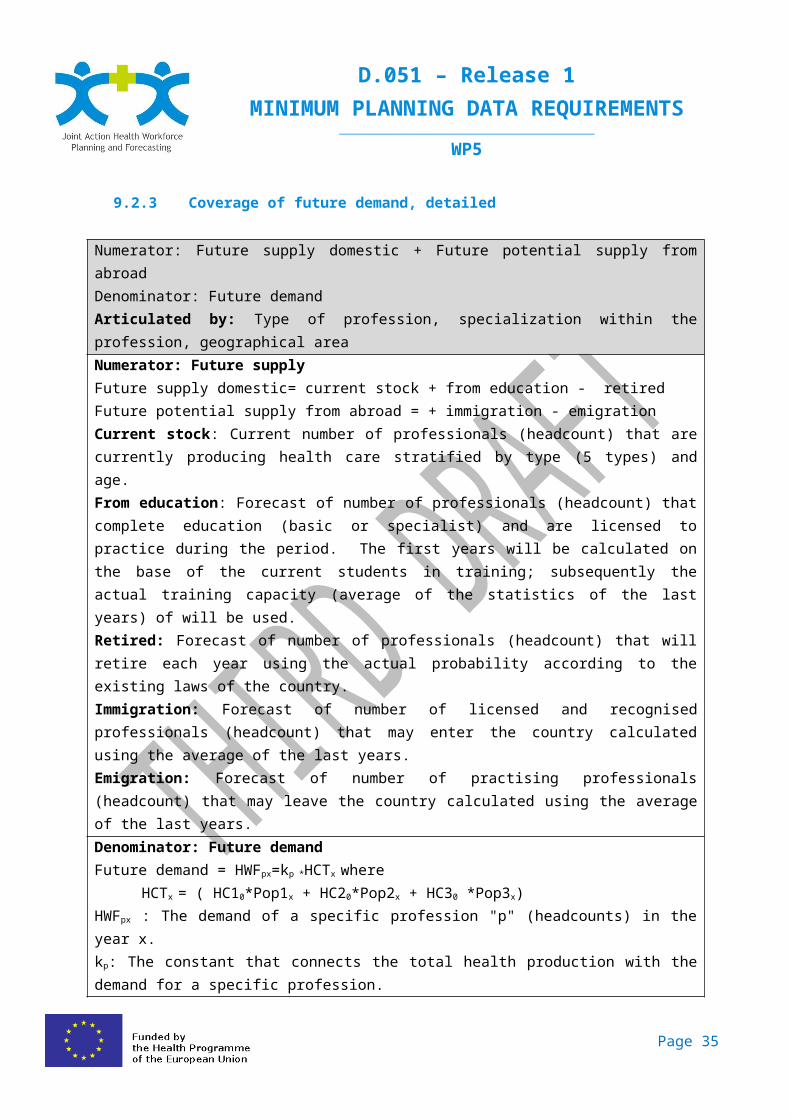
9.2.3 Coverage of future demand, detailed
Numerator: Future supply domestic + Future potential supply from abroadDenominator: Future demandArticulated by: Type of profession, specialization within the profession, geographical areaNumerator: Future supplyFuture supply domestic= current stock + from education - retiredFuture potential supply from abroad = + immigration - emigrationCurrent stock: Current number of professionals (headcount) that are currently producing health care stratified by type (5 types) and age.From education: Forecast of number of professionals (headcount) that complete education (basic or specialist) and are licensed to practice during the period. The first years will be calculated on the base of the current students in training; subsequently the actual training capacity (average of the statistics of the last years) of will be used.Retired: Forecast of number of professionals (headcount) that will retire each year using the actual probability according to the existing laws of the country.Immigration: Forecast of number of licensed and recognised professionals (headcount) that may enter the country calculated using the average of the last years.Emigration: Forecast of number of practising professionals (headcount) that may leave the country calculated using the average of the last years.Denominator: Future demandFuture demand = HWFpx=kp *HCTx where
HCTx = ( HC10*Pop1x + HC20*Pop2x + HC30 *Pop3x)HWFpx : The demand of a specific profession "p" (headcounts) in the year x.kp: The constant that connects the total health production with the demand for a specific profession.HCTx : The total health consumption in year x.(1)HC10: The pro capite consumption of age group 1 in year 0 (basic year)HC20: The pro capite consumption of age group 2 in year 0 (basic year)HC30: The pro capite consumption of age group 3 in year 0 (basic year)Pop1x: The population of age group 1 in year x.Pop2x: The population of age group 2 in year x.Pop3x: The population of age group 3 in year x.(1) Note: it is important to check the sustainability of the total health consumption in year x compared with the current consumption.
Page 24

D.051 – Release 1MINIMUM PLANNING DATA REQUIREMENTS
________________________________________________________________
WP5
9.2.4 Coverage of needs by foreign professionals today and in the futureNumerator: N° of professionals with foreign first qualification.Denominator: Total n° of professionals.Articulated by: Type of profession, specialization within the profession, geographical areaNumerator: N° of professionals with foreign first qualification.Current stock of professionals with foreign qualification: The part of the current stock with country of first qualification <> current country of activity.Future stock of professionals with foreign qualification: The part of the future stock with country of first qualification <> current country of activity.Denominator: Total n° of professionals.Total current stock: Current number from indicator 3.Total future stock: Numerator of indicator 3
9.2.5 N° of professionals per inhabitant today and in the futureNumerator: N° of professionalsDenominator: populationArticulated by: Type of profession, specialization within the profession, geographical areaNumerator: Actual number of professionalsActual number of professionals: From indicator 3Future number of professionals: From indicator 3Denominator: populationActual population: Number of population (without weighting)Future population: Number of population (without weighting) from a reliable institute of forecasting.
9.2.6 N° of professionals per weighted inhabitant today and in the futureNumerator: N° of professionalsDenominator: weighted populationArticulated by: Type of profession, specialization within the profession, geographical areaNumerator: Actual number of professionalsCurrent number of professionals: From indicator 3Future number of professionals: From indicator 3Denominator: populationCurrent population: Number of inhabitants weighted by the health consumption for each age group (average current EU countries).Future population: Number of population from a reliable institute of forecasting weighted by the health consumption for each age group (average actual EU countries).
Page 25

D.051 – Release 1MINIMUM PLANNING DATA REQUIREMENTS
________________________________________________________________
WP5
9.3 Appendix n.3 – Two examples of calculation for the indicator 1
In order to make the calculation more clear we have included two examples of the calculation of the demand formulas in the Indicator 1:
a. calculation of the actual and the future health consumption (the main alternative) or b. calculation of the weighted population (the alternative presented on page x).
The supply formulas are the same in the two examples.
9.3.1 Example a The indicator 1 (Physicians) with the demand calculated on the base of the future health consumption
Numerator: Future supply 2028 (Italian figures)
Future supply = current stock + from education - retired + immigration -emigration
Current stock (practising) 254.000
From education (2013-2028) 140.578 estimation
Retired (2013-2028) 168.597 estimation
Immigration (2013-2028) 3.819 estimation
Emigration (2013-2028) 7.918 estimation
Future supply 2028 221.883(254.000 + 140.478 - 168.597 + 3.819 - 7.918)
Page 26

D.051 – Release 1MINIMUM PLANNING DATA REQUIREMENTS
________________________________________________________________
WP5
Denominator: Future demand 2028 (Italian population)
Step 1 Construction of the current health consumption.Actual population
N° of inhabitants (a)
Health consumption (euro per person,
European average) (b)
Health consumption (millions of euro) (a)*(b)/1.000.000
Pop1 = population aged 0-14 8.325.217 772 6.427Pop2 = population aged 15-64 38.698.168 1.287 49.805Pop3= population aged 65+ 12.370.822 3.861 47.764Total Italian population 59.394.207 103.995
Step 2 Calculation of the conversion factor for physiciansCurrent number of physicians 254.000kp 2,442417 (254.000/103.995)
Step 3 Calculation of the future health consumptionPopulation 2028
N° of inhabitants (a)
Health consumption (euro per person,
European average) (b)
Health consumption (millions of euro) (a)*(b)/1.000.000
Pop1 = population aged 0-14 8.073.662 772 6.233Pop2 = population aged 15-64 39.374.526 1.287 50.675Pop3= population aged 65+ 15.893.206 3.861 61.364Total Italian population 63.341.394 118.272
Step 4 Calculation of the future number of physicianskp 2,442417
Number of physicians 2028 288.868 (118.272 * 2,442417)
Indicator 6.1.1 = coverage of future demand
Future supply 2028/Future demand 2028 0,8 is < 1 Future shortage(221.883 / 288.868)
Page 27

D.051 – Release 1MINIMUM PLANNING DATA REQUIREMENTS
________________________________________________________________
WP5
9.3.2 Example 2 b The indicator 1 (Physicians) with the demand calculated on the base of the future weighted population
Numerator: Future supply 2028 (Italian figures)
Future supply = current stock + from education - retired + immigration -emigration
Current stock (practising) 254.000
From education (2013-2028) 140.578 estimation
Retired (2013-2028) 168.597 estimation
Immigration (2013-2028) 3.819 estimation
Emigration (2013-2028) 7.918 estimation
Future supply 2028 221.883(254.000 + 140.478 - 168.597 + 3.819 - 7.918)
Page 28

D.051 – Release 1MINIMUM PLANNING DATA REQUIREMENTS
________________________________________________________________
WP5
Denominator: Future demand 2028 (Italian population)Future demand (HWF2028) =kp * HCT2028
Step1 Construction of a Weight for each age groupActual consumption of health care
Health expenditure(euro per person
European average)
Weight per age group
Pop1 = population aged 0-14 772 0,6Pop2 = population aged 15-64 1.287 1Pop3= population aged 65+ 3.861 3Total Italian population
Step 2 Construction of the current weighted population (Italian population).Actual population
N° of inhabitants (a) Weight (b) Weighted pop = (a)*(b)
Pop1 = population aged 0-14 8.325.217 0,6 4.995.130Pop2 = population aged 15-64 38.698.168 1 38.698.168Pop3= population aged 65+ 12.370.822 3 37.112.466Total Italian population 59.394.207 80.805.764
Step 3 Calculation of the conversion factor for physiciansKp = current number of practising physicians/weighted population * 1000Kp = 254.000 / 80.805.764 * 1.000Kp 0,00314
Step 4 Calculation of the future weighted populationPopulation 2028
N° of inhabitants (a) Weight (b) Weighted pop = (a)*(b)
Pop1 = population aged 0-14 8.073.662 0,6 4.844.197Pop2 = population aged 15-64 39.374.526 1 39.374.526Pop3= population aged 65+ 15.893.206 3 47.679.618Total Italian population 63.341.394 91.898.341HCT2028 91.898.341
Step 5 Calculation of the future demand of practising physiciansFuture demand 2028 (HWF2028): 0,00314 * 91.898.341 =
288.868
Page 29

D.051 – Release 1MINIMUM PLANNING DATA REQUIREMENTS
________________________________________________________________
WP5
Indicator 6.1.1 = coverage of future demand
Future supply 2028/Future demand 2028 0,8 is < 1 future shortage
Page 30

D.051 – Release 1MINIMUM PLANNING DATA REQUIREMENTS
________________________________________________________________
WP5
9.4 Appendix n.4 - Minority opinions
There were no proposed additional key planning indicators which change the contents of the MDS.
Page 31

D.051 – Release 1MINIMUM PLANNING DATA REQUIREMENTS
________________________________________________________________
WP5
9.5 Appendix n.5 – Glossary
ITEM (alphabetical order) DEFINITIONAge group Population by single year of birth or age groups (i.e.: 0-4; 5-9;
10-14;.... 60-64;65+).Dentists Dental practitioners (see Directive EC/2005/36 section 4,
article 34).Emigration (outflow) Annual number of professionals exiting from the Country for
practising profession full time abroad.Forecasting model (quantitative) A quantitative forecasting model is a set of formal statement
about variables and relationships among variables. The scope is to estimate future data as a function of past data (time series, cross-sectional or longitudinal data) on the base of specific assumptions. Accordingly it is appropriate when past data are available. Quantitative forecasting models are usually applied to short- or intermediate-range decisions. On the other hand, qualitative forecasting models (in which estimations are based on the opinion and judgment of experts, stakeholders or users) are appropriate when past data are not available and they are usually applied to intermediate- or long-range decisions.
Full time equivalent (FTE) Unit to measure employed persons in a way that makes them comparable although they may work a different number of hours per week.The unit is obtained by comparing an employee's average number of hours worked to the average number of hours of a full-time worker. A full-time person is therefore counted as one FTE, while a part-time worker gets a score in proportion to the hours he or she works or studies. For example, a part-time worker employed for 24 hours a week where full-time work consists of 48 hours, is counted as 0.5 FTE.
Labour force Current number of professionals (headcount) that are currently producing health care in the Country/Region.
Midwives Midwives (see Directive EC/2005/36 section 6, article 40).Migration (inflow) Annual number of licensed and recognised professionals
entering the Country.Nurses Nurses responsible for general care (see Directive EC/2005/36
section 3, article 31)Pharmacists Pharmacists (see Directive EC/2005/36 section 7, article 44).
Page 32

D.051 – Release 1MINIMUM PLANNING DATA REQUIREMENTS
________________________________________________________________
WP5
ITEM (alphabetical order) DEFINITIONPhysicians Doctors of medicine (see Directive EC/2005/36 section 2,
article 24).Planning process The planning process is the set of organized activities, task lists
and schedules required to achieve the objectives defined in the health workforce planning system. It includes the making and maintenance of a plan and it combines forecasting of developments with the preparation of scenarios of how to react to them (strategies). In these meaning it is the counterpart of the spontaneous order. The planning process is a fundamental function of management since it is aimed at the best satisfaction of the needs given the resources available.
Planning system The planning system is used to make decisions about the future development and use of health workforce (“what it should look like in the future”). It considers both the internal and external factors that affect the health workforce supply and demand (where development should happen, where it should not and how development should be). The planning system balances different interests to make sure that the healthcare system works and it is developed in a way that creates high quality at sustainable costs. The health workforce planning systems in the different Countries will tend to vary and are flexible due to the periodic and adaptive nature of the applied strategy. These will also have political aspects.
Population Number of inhabitants in the Country or Region considered at the reference date (Source: National Institute of Statistics).
Professions Health professions included in the Directive 2005/36/EC of the European Parliament and of the Council on the recognition of professional qualifications: physicians, nurses, midwives, pharmacists, dentists (please see details in the items).
Retirement Annual number of professionals retiring from labour market.Shortage Negative gap between supply and demand.Training Annual number of professionals who complete education
(basic or specialist) and are licensed to practice.
Page 33

D.051 – Release 1MINIMUM PLANNING DATA REQUIREMENTS
________________________________________________________________
WP5
9.6 Appendix n. 6 - Table of references
Matrix Insight Ltd, in collaboration with the Centre for Workforce Intelligence (CfWI) - for EC - 2012Commission feasibility study on EU level collaboration on forecasting health workforce needs, workforce planning and health workforce trendhttp://ec.europa.eu/health/workforce/key_documents/study_2012/index_en.htm
Tomoko Ono, Gaetan Lafortune, Michael Schoenstein. OECD Health Working Papers, No. 62, OECD Publishing. - 2013Health Workforce Planning in OECD Countries: A Review of 26 Projection Models from 18 Countrieshttp://www.oecd-ilibrary.org/social-issues-migration-health/health-workforce-planning-in-oecd-countries_5k44t787zcwb-en
WHO Library Cataloguing (in Publication Data) - 2008WHO human resources for health minimum data sethttp://www.who.int/hrh/documents/hrh_minimum_data_set.pdf
OECD-WHO -Draft guidelines on monitoring the implementation of the WHO Global Code on the International Recruitment of Health Personnel. Part II – Regular national reporting instrument – Section 2: Quantitative information – Minimum Data Setshttp://www.who.int/hrh/migration/section_2_quantitative.pdf
WHO - 2009WHO - Handbook on Monitoring and Evaluation of Human Resources for Healthhttp://www.who.int/hrh/resources/handbook/en/
Bartosz Przywara - 2010Projecting future health care expenditure al European level: drivers, methodology and main resultshttp://ec.europa.eu/economy_finance/publications/economic_paper/2010/ecp417_en.htm
Christine de la Maisonneuve, Joaquim Oliveira Martins - 2013Public spending on health and long-term care: a new set of projectionshttp://www.oecd.org/eco/growth/Health%20FINAL.pdf
Roberto Astolfi, Luca Lorenzoni, Jillian Oderkirk - 2012A comparative analysis of health forecasting methodshttp://search.oecd.org/officialdocuments/publicdisplaydocumentpdf/?cote=DELSA/HEA/WD/HWP(2012)2&docLanguage=En
Page 34
D.051 – Release 1MINIMUM PLANNING DATA REQUIREMENTS
________________________________________________________________
WP5
Leonie Segal, Tom Bolton - 2009Issues facing the future health care workforce: the importance of demand modellinghttp://www.anzhealthpolicy.com/content/pdf/1743-8462-6-12.pdf
WHO - 2010WHO Global Code of Practice on the International Recruitment of Health Personnelhttp://www.who.int/hrh/migration/code/code_en.pdf
European Commission - 2008GREEN PAPER On the European Workforce for Healthhttp://ec.europa.eu/health/ph_systems/docs/workforce_gp_en.pdf
Harpa Guðnadóttir, Marías Halldór Gestsson; Sólveig Fríða Jóhannsdóttir – 2009Health workforce forecast
Stephen Birch, George Kephart, Gail Tomblin Murphy, Linda O’Brien-Pallas, Rob Alder, and Adrian MacKenzieHealth Human Resources Planning and the Production of Health: Development of an Extended Analytical Framework for Needs-Based Health Human Resources Planninghttp://ccoms-imsuerj.org.br/capfts/2011/uploads/Health_Human_Resources_Planning_and_the_Production.14.pdf
O'Brien-Pallas L, Baumann A, Donner G, Murphy GT, Lochhaas-Gerlach J, Luba M. - 2001Forecasting models for human resources in health carehttp://www.ncbi.nlm.nih.gov/pubmed/11155116
Dominique Roberfroid*, Christian Leonard and Sabine Stordeur - 2009Physician supply forecast: better than peering in a crystal ball?http://www.biomedcentral.com/content/pdf/1478-4491-7-10.pdf
Leonie Segal* and Tom Bolton - 2009Issues facing the future health care workforce: the importance of demand modelling.http://www.anzhealthpolicy.com/content/pdf/1743-8462-6-12.pdf
Walter Sermeus, Linda H Aiken, Koen Van den Heede1, Anne Marie Rafferty, Peter Griffiths, Maria Teresa Moreno-Casbas, Reinhard Busse, Rikard Lindqvist, Anne P Scott, Luk Bruyneel, Tomasz Brzostek, Juha Kinnunen, Maria Schubert, Lisette Schoonhoven, Dimitrios Zikos and RN4CAST consortium - 2009Nurse forecasting in Europe (RN4CAST): Rationale, design and methodologyhttp://www.biomedcentral.com/content/pdf/1472-6955-10-6.pdf
Jonathan P. Weiner
Page 35

D.051 – Release 1MINIMUM PLANNING DATA REQUIREMENTS
________________________________________________________________
WP5
A Shortage Of Physicians Or A Surplus Of Assumptions?http://content.healthaffairs.org/content/21/1/160.full.html
Malou Van Greuningen*, Ronald S Batenburg and Lud FJ Van der Velden - 2012Netherlands - Ten years of health workforce planning in the Netherlands: a tentative evaluation of GP planning as an examplehttp://www.human-resources-health.com/content/pdf/1478-4491-10-21.pdf
Sabine Stordeur and Christian LéonardChallenges in physician supply planning: the case of Belgiumhttp://www.ncbi.nlm.nih.gov/pmc/articles/PMC3017009/
DOMINIQUE ROBERFROID, SABINE STORDEUR, CECILE CAMBERLIN, CARINE VAN DE VOORDE, FRANCE VRIJENS, CHRISTIAN LEONARDKCE reports 72C : Physician workforce supply in Belgium: current situation and challengeshttps://kce.fgov.be/sites/default/files/page_documents/d20081027309.pdf
Karen Bloor, Alan Maynard - University of York - 2003Planning human resources in health care: Towards an economic approach. An international comparative reviewhttp://www.fcass-cfhi.ca/Migrated/PDF/ResearchReports/CommissionedResearch/bloor_report.pdf
Tomblin Murphy G, Kephart G, Lethbridge L, O'Brien-Pallas L, Birch S. - 2009Planning for what? Challenging the assumptions of health human resources planning.http://www.ncbi.nlm.nih.gov/pubmed/19443074
European Commission Staff Working Document (2012) 93 final - 2012Action Plan for the EU health workforce
Page 36

D.051 – Release 1MINIMUM PLANNING DATA REQUIREMENTS
________________________________________________________________
WP5
9.7 Appendix n. 7 – WP5 general description
9.7.1 WP5 scopeWork Package 5 (WP5) aim is to promote and support the use of quantitative model-based planning methodologies (both supply-side and demand-side) based on what is in use today or shortcomings in EU countries and a “good practices” evaluation.Health professions in focus are doctors, nurses, pharmacists, dentists and midwifes (the five health professions covered by the Recognition of Professional Qualifications Directive).
9.7.2 WP5 actionsThe WP5 specific Objective is to ”define guidelines on quantitative HWF planning methodology and increased quantitative planning capacity”.
N# Title WHEN3.1 Minimum data set (MDS)
MILESTONES 5.1 Agreement on the minimum data set October 2013DELIVERABLE D.051 Minimum planning data requirements November 2013
3.2 Exchange of good practices
MILESTONES 5.2Experts group conference on HWF planning methodologies
April 2014
DELIVERABLE D.052 Report of good practices in planning methodologies September 2014DELIVERABLE D.053 Web portal on HWF planning methodologies, with WP2 January 2015
3.3 Defining and experimenting guide lines on HWF planning (cookbook)MILESTONES 5.3 Validation of the cookbook March 2015MILESTONES 5.4 Start-up of the Pilot studies June 2015MILESTONES 5.5 Finalisation of the cookbook September 2015DELIVERABLE D.054 Report on WP5 pilot study experiences March 2016
9.7.3 WP5 team membersWP5 is managed by Italy. The WP5 Team Leader is Giovanni Leonardi, General Director Health Professions and Human Resources at Ministry of Health.
There are two Italian organisations covering the competencies of WP5: the Ministry of Health (MoH) and the National Agency for Regional Healthcare (AGENAS); their roles, within the project, were divided accordingly.
Page 37

D.051 – Release 1MINIMUM PLANNING DATA REQUIREMENTS
________________________________________________________________
WP5
Their primarily responsibilities are:MoH AGENAS
- Results of WP5 - Project management- Represent the Italian knowledge broker - Methodology of research- Relationships with international contacts - Budget and reporting management- Dissemination to Italian stakeholders - Logistics and organisation of meeting- Pilot study project - Operational secretariat
Italian teamMinistry of Health AGENAS
Giovanni Leonardi - WP5 Leader Achille IachinoEgle Parisi Ragnar Gullstrand
Annalisa Malgieri Paolo MicheluttiCristina Sabatini Anna Maria Pacini
Italy is supported by WP5 Partners and experts, divided into WP Leaders, Associated and Collaborative partners, which together make up the team. They are:
WP LeaderCountry Acronym Role Name
Belgium BE_FPS Michel Van Hoegaerden Program ManagerBelgium BE_FPS Lieve Jorens WP1 LeaderSlovakia SK_MOH Zuzana Matlonova WP2 LeaderEurope STAK_EHMA Jeni Bremner WP2 LeaderEurope STAK_EHMA Paul Giepmans WP2 LeaderFinland FI_MOH Marjukka Vallimies-Patomäki WP3 LeaderMalta MT_MOH Andrew Xuereb WP3 LeaderHungary HU_SU Zoltan Aszalos WP4 LeaderUnited Kindom UK_DoH Matt Edwards WP6 LeaderUnited Kindom UK_DoH John, Fellows WP6 Team memberBulgaria BG_MUV Todorka Kostadinova WP7 LeaderEurope STAK_EAHC Caroline Hager EC RepresentativeEurope STAK_EC Balazs Lengyel EC RepresentativeEurope STAK_EC Antoniette Martiat EC RepresentativeEurope STAK_EC Angela Blanco EC Representative
Page 38

D.051 – Release 1MINIMUM PLANNING DATA REQUIREMENTS
________________________________________________________________
WP5
Associated partnersCountry Acronym Name
Belgium BE_FPS Pieter-Jan MiermansBulgaria BG_NCPHA Nastashka DanovaBulgaria BG_NCPHA Milena VladimirovaBulgaria BG_NCPHA Plamen DimitrovBulgaria BG_MUV Nikolina RadevaFinland FI_MOH Reijo AilasmaaGermany DE_UNI-HB Melanie BoeckmannGermany DE_UNI-HB Heinz RothgangGreece EL_NSPHJ Despena AndriotiHungary HU_SU Eszter KovacsHungary HU_SU Edit EkeHungary HU_SU Edmond GirasekIceland IS_MOH Valgerdur GunnarsdottirNetherlands NL_CAPORG Victor SlenterNetherlands NL_MOH Leon Van BerkelPoland PL_MOH Aleksandra KotowiczPoland PL_MOH Bartosz BaranPortugal PT_ACSS Ivo Rui SantosPortugal PT_ACSS Filomena Parra da SilvaPortugal PT_ACSS Ana Paula GouveiaPortugal PT_ACSS Gustavo FerreiraSlovenia SI_IVZ Rade PribakovicSpain ES_MOH Pilar CarbajoSpain ES_MOH Mercedes De JorgeSpain ES_MOH Sebas MartinEurope STAK_AMREF Giulia De PonteEurope STAK_EFN Silvia GomezEurope STAK_EFN Alessia ClocchiattiEurope STAK_EFN Paul de RaeveEurope STAK_HOPE Isabella NotarangeloEurope STAK_PGEU Patricia MunozEurope STAK_PGEU John Chave
Page 39

D.051 – Release 1MINIMUM PLANNING DATA REQUIREMENTS
________________________________________________________________
WP5
Collaborating partnersCountry Acronym Name
Belgium BE_FPS Peter WilleméDenmark DK_DHMA Anders HaahrGermany DE_KBV Filip J. LassahnIreland IE_DoH Gabrielle JacobItaly IT_AIC John WilliamsMoldova MD_MoH Eugenia BerzanMoldova MD_MoH Nicolae JelamschiSerbia RS_IPHS Milena VasicSerbia RS_UNI-BG Milena Santric MilicevicEurope STAK_ENMCA Tanja SchubertEurope STAK_ENMCA Marie Colegrave-JugeEurope STAK_UEMO Marie-Christine BonnamourEurope STAK_IOM Benedict RoumyanaEurope STAK_IOM Giuliana UrsoEurope STAK_OECD Michael SchoensteinEurope STAK_OECD Tomoko OnoEurope STAK_WHO Galina Perfilieva
Page 40

D.051 – Release 1MINIMUM PLANNING DATA REQUIREMENTS
________________________________________________________________
WP5
9.8 Appendix n. 8 – WP5 workshop minutes – Milan 19th – 20th of September 2013
See the pdf document external to this document.
Page 41