migration and poverty alleviation in chinapublications.iom.int/bookstore/free/mrs_27.pdf · china...
TRANSCRIPT

China has achieved remarkable progress in poverty alleviation since the start of the reforms. Calculated according to the offi cial poverty line, rural poverty has dropped dramatically from 30.7 per cent in 1978 to 2.6 per cent in 2005. Rural-urban labour migration on an unprecedented scale played a vital role in rural income growth, poverty reduction and economic development in sending places, as numerous rural labourers responded to the rising income inequality by migrating to the cities. Empirical evidence shows that while the vast rural to urban migration does not signifi cantly increase urban income poverty, labour market discrimination and social exclusion expose rural migrants to many risks and vulnerabilities in the cities, where the poor are becoming increasingly marginalized. Capacity building for the poor, the adoption of an integrated labour market system that also takes account of migrants, and the creation a of rural social security system are the three important poverty alleviation options promoted by the government. Although migration in China has unique institutional characteristics owing to the existence of hukou system (Household Registration System), the experiences and lessons to be drawn from consider-ing migration as a development approach have important implications for the shaping of appropriate developmental policies.
IOM • OIM
Migration and Poverty Alleviation in China
No. 27
ISSN 1607-338X
Also available online at:http://www.iom.int
mrs27cover.indd 1mrs27cover.indd 1 2/19/2007 4:21:12 PM2/19/2007 4:21:12 PM

The opinions expressed in the report are those of the author and do not necessarily reflect the views of the International Organization for Migration. The designations employed and the presentation of material throughout the report do not imply the expression of any opinion whatsoever on the part of IOM concerning the legal status of any country, territory, city or area, or of its authorities, or concerning its frontiers or boundaries. _______________
IOM is committed to the principle that humane and orderly migration benefits migrants and society. As an intergovernmental body, IOM acts with its partners in the international community to: assist in meeting the operational challenges of migration; advance understanding of migration issues; encourage social and economic development through migration; and uphold the human dignity and well-being of migrants._______________
Publisher: International Organization for Migration 17 route des Morillons 1211 Geneva 19 Switzerland Tel: +41.22.717 91 11 Fax: +41.22.798 61 50 E-mail: [email protected] Internet: http://www.iom.int
Editor: Ilse Pinto-Dobernig_______________
ISSN 1607-338X© 2007 International Organization for Migration (IOM)_______________
All rights reserved. No part of this publication may be reproduced, stored in a retrieval system, or transmitted in any form or by any means, electronic, mechanical, photocopying, recording, or otherwise without the prior written permission of the publisher.
12_07
IOM Migration Research Series (MRS)
Editor: Frank Laczko Chief, Research and Publications Division International Organization for Migration 17 route des Morillons C.P. 71 CH-1211 Geneva 19 Switzerland Tel: +41.22.717 91 11 E-mail: [email protected]
Titles in the series are available from:
International Organization for Migration, Research and Publications Unit17 route des Morillons, CH-1211 Geneva 19 Switzerland, Tel: +41.22.717 91 11;
Fax: +41.22.798 61 50, E-mail: [email protected]. The MRS order form is found on the IOM website: http:/www.iom.int
Single issue: US$ 16-25 + US$ 2 postage
Payment must accompany orders and can be made by international bank draft or money order in US dollars payable to International Organization for Migration, Geneva.
mrs27cover.indd 2mrs27cover.indd 2 2/19/2007 4:21:38 PM2/19/2007 4:21:38 PM

Migration and Poverty Alleviation in China
Prepared for IOM by
WANG Dewen and CAI FangInstitute of Population and Labour Economics, CASS


3
CONTENTS
Introduction 5
Employment Nexus Between Economic Growth and Poverty Alleviation 10
Economic Growth and Poverty Alleviation 10
Non-agricultural Employment and Poverty Alleviation 12
Institutional Reform and Migration 15
Trends of Rural to Urban Migration 15
Changes in the Institutional and Policy Environment for Migration 17
1980s: Permitting Rural Labour Mobility 17
1990s: Guiding Rural Labour Mobility 18
Since 2000: Encouraging Rural Labour Mobility 20
Migration as a Labour Market Response to Income Inequality 21
National Development Plans for Poverty Reduction through Migration 23
Migration and the Poverty Trap 25
Characteristics of Poor Households 25
Effectiveness of Migration in Reducing Poverty 27
Ways to Eradicate Chronic Poverty 29
Migration and the Urbanization of Poverty 32
Determinants of the Urbanization of Poverty 32
Re-estimating Urban Poverty 33
Labour Market Discrimination and Social Exclusion 34
Conclusions 35
References 37


5
INTRODUCTION
China is widely recognized for its achievements in reducing absolute poverty since the launch of reforms in the late 1970s. Fast economic growth together with a well-funded national poverty reduction programme have led to a tremendous reduction in rural poverty during the past quarter of a century. Official estimates indicate that between 1978 and 2005 the rural population living in poverty decreased from roughly 250 million to 23.7 million, respectively, and the poverty incidence fell from 30.7 per cent to 2.6 per cent during that same period.
The progress of rural poverty alleviation can be divided into four phases (see Table 1). The first phase was from 1978 to 1985. At this stage, the rural population living below the official poverty line was halved with a decline in the poverty incidence from 30.7 per cent to 14.8 per cent. This 50 per cent reduction can be largely attributed to the success of the rural household responsibility system and the decollectivization of agriculture with the attendant important increase in agricultural productivity.
The second phase of rural poverty alleviation started in 1986, but stagnated in the late 1980s and early 1990s. Although the Chinese government intentionally initiated the large-scale regional development programme to reduce further the numbers of remaining rural poor at this stage, both the cooling down of economic growth and the concentration of the rural poor slowed down the pace of the poverty reduction scheme, which also suffered some setbacks in 1989 and 1991, respectively.
In 1993, the announcement of the „8-7‰ Poverty Reduction Plan marked the beginning of the third phase. This plan called for a national strategic action aimed at reducing the number of the rural poor by 80 million during the period 1994 to 2000. In implementing this programme, the government budgeted special poverty alleviation funds (PAF) consisting of fiscal alleviation funds, food for work funds, and interest-subsidized loans to support economic growth in designated poor areas. With the accomplishment of this plan, the number of the rural poor dropped to 32 million with a poverty incidence of 3.4 per cent.
Since the beginning of the new millennium, poverty alleviation in rural China has entered a new stage. As a follow-up to the development approach to poverty alleviation, the policy emphasis was directed at village-based and/or rural household-based development programmes rather than the previous county-based schemes. The new method aims to reach the remaining rural poor directly and to lift them out of poverty through both improved targeting and financial utilization.

6
TABLE 1RURAL POVERTY ALLEVIATION: 1978-2004
Source: National Bureau of Statistics, China Statistical Yearbook (2005), China Yearbook of Rural Household Survey (2006), China Statistics Press, Beijing; World Bank, China: Overcoming Rural Poverty, 2001, Washington, D.C.
Offi cial Poverty Line One Dollar Per Day Criteria
Year
Poverty Line
(yuan)
Poverty Incidence
(%)
Number of Poor
Population (million)
Poverty Incidence
(%)
Number of Poor
Population (million)
1978 100 30.7 250.0
1979 n.a. 30.2 239.0
1980 130 26.8 220.0
1981 142 18.5 152.0
1982 164 17.5 145.0
1983 179 16.2 135.0
1984 200 15.1 128.0
1985 206 14.8 125.0
1986 213 15.5 131.0
1987 227 14.3 122.0
1988 236 11.1 96.0
1989 259 11.6 102.0
1990 300 9.4 85.0 31.3 280
1991 304 10.4 94.0 31.7 287
1992 317 8.8 80.0 30.1 274
1993 350 8.2 75.0 29.1 266
1994 400 7.7 70.0 25.9 237
1995 530 7.1 65.4 21.8 200
1996 580 6.3 58.0 15.0 138
1997 640 5.4 49.6 13.5 124
1998 635 4.6 42.1 11.5 106
1999 625 3.7 34.1
2000 625 3.4 32.1
2001 630 3.2 29.3
2002 627 3.0 28.3
2003 637 3.1 29.0
2004 668 2.8 26.1
2005 683 2.6 23.6
7
Notwithstanding the remarkable progress already made, China is now facing a number of new difficulties and challenges in poverty reduction. Firstly, the deceleration of rural poverty reduction contrasts with the incremental higher efforts and greater difficulties in lifting the remaining rural poor out of poverty. The average annual change in poverty incidence dropped from 1.5 per cent in 1980s to 0.7 per cent by 1990s, falling further to 0.1 per cent since 2001, while annual PAF input in 2001 and 2002 was 3.7 times higher than during the first half of 1990s, and double that of the second half of 1990s.
Secondly, the characteristics of rural poverty have changed. Since the majority of the remaining rural poor are increasingly concentrated in remote and mountainous townships and villages in the western provinces, they are characterized by low educational attainment, poor health, bad living and reproduction conditions, and marginalization (ADB, 2004; Cai and Du, 2005). They live in extreme and chronic poverty that requires more specific measures for the poverty reduction policies.
Thirdly, new issues of urban and migrant poverty have emerged. Prior to 1990s, the poverty issue in urban China was of less significance as the number of the urban poor was much smaller than at present, and they were well provided for under the urban social relief system. For instance, in 1990, the number of the urban poor stood at 1.3 million with a poverty incidence of 0.4 per cent (Work Bank, 1992). Since the 1990s, the process of labour and social security reform in both state-owned enterprises and urban private sector employment led to millions of workers being no longer needed and tens of thousands of urban families falling into poverty because of unemployment. Khan (1998) found that the urban poverty incidence increased by 12 per cent from 1988 to 1995, characterized by more severe and deeper poverty. Updated results show that in 1999 the number of urban poor had reached 23 million with a poverty incidence of 5.1 per cent, and poverty being both more severe and deeper than in 1995 (Li, 2001). If migrants are included, the issue of urban poverty is even more serious. Li (2001) reported that the poverty incidence of migrants is double that of urban residents with a local urban residence permit (hukou). According to a study of 31 large cities, the poverty incidence of migrants was over 50 per cent higher than for urban residents who had a local urban hukou and, in some cities, it was twice to three times higher than for local residents (Hussain, 2003). Therefore, the emergence of urban poverty, and of migrant poverty in particular, is an important component of the future anti-poverty strategy.
Finally, income disparities between rural and urban areas and among regions have been worsening along with rapid economic growth. Rural-urban income inequality narrowed during the earlier years of reform, but has increased since the mid-1980s. From 1978 to 1985, the ratio of urban to rural per capita net income dropped from

8
2.57: 1 to 1.53:1, but then rose to 2.42:1 in 2004 (see Table 2). If we take into account the subsidized public services and welfare benefits in urban areas, the current rural-urban disparity in China would be the largest in the world (Li and Yue, 2004). Ravallian and Chen (2004) documented that the overall rural and rural-urban income inequalities have been increasing since the beginning of 1980s. Labour market distortions are among the most important factors responsible for this increase, with significant direct or indirect effects on labour mobility and rural income.
The above-mentioned issues provide the context to understand the trend of migration and its role in ChinaÊs poverty reduction efforts. The rest of this paper is organized as follows: Part 2 examines the relationship between economic growth, employment and poverty alleviation; Part 3 describes the institutional conditions of migration, the ways in which migration trends are shaped by trends in income inequality and the national policy actions; Part 4 depicts the characteristics of poor households and analyses the contribution of migration to poverty reduction in sending places; Part 5 examines the issue of the urbanization of poverty, and the final part concludes with policy suggestions.

9
TABLE 2INCOME INEQUALITIES IN CHINA:1978-2004
Source: Gini indices are from Ravallion and Chen, 2004. ChinaÊs (uneven) progress against poverty, Policy Research Paper 3408, Development Research Group, Washington, D.C. Rural urban income ratio comes from the China Statistical Yearbook (2005).
Gini Indices Urban to Rural Income RatioYear Rural Urban National Current Price Constant Price1978 2.57 2.57
1980 24.99 n.a. n.a. 2.50 2.35
1981 24.73 18.46 27.98 2.20 2.04
1982 24.40 16.27 25.91 1.95 1.79
1983 25.73 16.59 26.02 1.82 1.65
1984 26.69 17.79 26.89 1.83 1.63
1985 26.80 17.06 26.45 1.86 1.53
1986 28.48 20.66 29.20 2.12 1.69
1987 28.53 20.20 28.90 2.17 1.65
1988 29.71 21.08 29.50 2.17 1.51
1989 30.96 24.21 31.78 2.29 1.54
1990 29.87 23.42 31.55 2.20 1.64
1991 31.32 23.21 33.10 2.40 1.72
1992 32.03 24.18 34.24 2.58 1.78
1993 33.70 27.18 36.74 2.80 1.89
1994 34.00 29.22 37.60 2.86 1.95
1995 33.98 28.27 36.53 2.71 1.94
1996 32.98 28.52 35.05 2.51 1.85
1997 33.12 29.35 35.00 2.47 1.83
1998 33.07 29.94 35.37 2.51 1.86
1999 33.91 29.71 36.37 2.65 1.96
2000 35.75 31.86 38.49 2.79 2.04
2001 36.48 32.32 39.45 2.90 2.12
2002 n.a. 32.65 n.a. 3.11 2.30
2003 n.a. n.a. n.a. 3.23 2.40
2004 36.92 n.a. n.a. 3.21 2.42

10
EMPLOYMENT NEXUS BETWEEN ECONOMIC GROWTH AND POVERTY ALLEVIATION
Economic growth and poverty alleviation
Whether or not economic growth is also pro-poor growth depends on both the speed and quality of economic growth. Since the start of economic reforms, ChinaÊs economy grew at an annual rate of about 10 per cent, with some cyclical characteristics over time. It is this rapid economic growth that ensures ChinaÊs large reduction of rural poverty, especially during the earlier reform period.
Plotting the poverty incidence against income growth reveals the importance of economic growth in the process of poverty reduction. Figure 1 demonstrates that the rural poverty incidence has declined along with the growth of per capita GDP. Models
FIGURE 1ECONOMIC GROWTH AND RURAL POVERTY ALLEVIATION
Source: National Statistical Bureau, China Statistical Yearbook (2005), China Yearbook of Rural Household Survey (2006), China Statistics Press, Beijing.
��
��
��
��
��
��
�
�
���������� ��������������
�������������������������
� ��� ��� ��� ��� ��� ��� �� �� ��� �����
11
using rates of provincial rural poverty reduction from 1991 to 1996 relative to GDP growth reinforce the conclusion that provinces with more rapid per capita GDP growth also show a more rapid decline in the number of rural poor (World Bank, 2001). The coastal provinces took the lead in the economic opening and achieved faster economic growth, leading also to much faster rural poverty reduction compared to central and western regions.
Huang et al. (2005) confirmed that economic growth significantly affects poverty reduction, though the sensitivity of the growth in poverty will decline with the increase of per capita GDP. They pointed out that if the inter-country data from the 2003 Global Development Report were used in the regression, a „U‰-shaped relationship can be found between income level and poverty incidence with a turning point at US$ 25,000. Because all developing countries are below that level, faster economic growth will have a stronger impact on poverty reduction at the initial stages of economic growth, but with a diminishing effect as an economy becomes wealthy and mature.
The above empirical evidence is consistent with findings from other sources (Chen and Wang, 2001; Jalan and Ravallion, 1998; Khan, 2000), which testify that economic growth is an important factor in ChinaÊs poverty reduction efforts, but that its effects have been declining since the mid-1980s. Slow agricultural growth is one of the factors that weaken the effects of economic growth on poverty reduction.
Between 1978 and 1984, agricultural growth in China was impressive. The value of agricultural output grew at an annual rate of 6.9 per cent, up from 2.5 per cent in the period 1952-78. The annual growth rates for grain, cotton and oil-seeds were 4.8, 17.7 and 13.8 per cent, respectively. As a result, rural per capita income almost tripled and the number of rural poor was halved during that period.
Compared with the fast growth at the initial reform stage, agricultural growth slowed down to between 3.1 to 4.6 per cent between the late 1980s and the beginning of this century. In the meantime, the share of agricultural output in GDP decreased from 31.4 per cent to 15.2 per cent (see Table 3). Slow agricultural growth not only allows non-agricultural sectors to become the major contributors of economic growth, but also delays lifting the rural poor out of poverty because they rely mainly on agriculture for their household income and cannot equally enjoy the gains from the rapid growth of non-agricultural sectors. Chen and Wang (2001) used household survey data for 1990 to 1999 to empirically show that the poor have gained far less from economic growth than the rich, and that only 20 per cent of the richest had income growth equivalent to, or greater than, GDP growth. As a result, rising income inequality disconnects poverty alleviation from economic growth.

12
The increasing rate of accumulation and investment, which caused the difference between economic growth and income growth, is also one of determinants of the slowdown in poverty reduction (Khan, 2000). The arithmetic average growth rates of per capita GDP of rural and urban per capita income from 1978 to 1984 are 8.2, 15.9 and 6.6 per cent, respectively; the growth of per capita GDP does not change from 1985 to 2002, while the growth rates of rural and urban per capita income drop to 4.3 per cent and 6.3 per cent, respectively. The growing gap between economic growth and income growth has played an important role in decreasing the speed of poverty reduction and increasing the number of the urban poor (Lin and Li, 2005). In fact, such investment-propelled high-speed economic growth comes to a certain extent at the cost of the slow growth of employment, because it dilutes the diffusion of the „trickle-down‰ effect.
Non-agricultural employment and poverty alleviation
Employment is the major family income-generation activity. The growth of rural income can be divided into agricultural and non-agricultural revenues. With slow agricultural growth, non-agricultural revenue becomes the main source of household income growth through non-agricultural employment. The share of wage income in rural household income has been increasing from 17 per cent in 1985 to 34 per cent in 2004. In urban household income, wage income accounts for more than
TABLE 3ECONOMIC GROWTH IN CHINA: 1978-2004
Source: National Bureau of Statistics, China Statistical Yearbook (2005), China Statistics Press, Beijing.
Time Period 1978-1984 1985-1989 1990-1994 1995-1999 2000-2004Growth rates (%)GDP 9.6 9.9 10.7 8.8 8.6
Agriculture 6.9 3.1 4.6 4.0 3.4
Industry 9.9 12.2 15.3 10.7 10.3
Tertiary 12.2 12.7 8.8 8.3 8.3
Per capita GDP 8.2 8.2 9.3 7.7 7.8
Composition of GDP (%)GDP 100.0 100.0 100.0 100.0 100.0
Agriculture 31.4 26.6 22.7 19.2 15.4
Industry 46.2 43.6 44.6 49.4 51.2
Tertiary 22.4 29.8 32.7 31.4 33.4

13
70 per cent. If a family member is under-employed, the whole family income will be dramatically reduced. Therefore, wage-earning employment will be the crucial channel for maintaining family income and benefits from rapid economic growth.
Like fast agricultural growth, the rapid development of Township and Village Enterprises (hereinafter referred to as TVEs) has also had a very positive impact on poverty reduction through the creation of non-agricultural employment. In 1978, total industrial production of TVEs was 49.3 billion yuan, accounting for 11.6 per cent of GDP. In 1992, this figure rose to 2,036 billion yuan, accounting for 38.6 per cent of gross national industrial product. From 1978 to 2003, the real growth rate of gross output was 28.0 per cent per year, creating millions of non-agricultural employment opportunities that facilitated the transfer of rural labour surplus. From 1978 to 2003, the number of people employed in TVEs rose from 28.3 million, accounting for 9.2 per cent of rural employment, to 138.7 million or 28.5 per cent of rural employment, with an average annual growth rate of 6.1 per cent.
The development of rural industrialization has not been uniform across regions. In the early 1980s, the number of non-agricultural workers actually decreased in the poor central and western regions as the commune system was dismantled. In 2004, 53.4 per cent of TVE employment was concentrated in the eastern regions, compared to 27.7 per cent in the central and 19.0 per cent in the western regions. Regional differences in rural industrialization caused regional differences in non-agricultural employment, thereby affecting the speed of rural poverty reduction. Since the rural poor are increasingly concentrated in remote and mountainous areas, slow agricultural growth and less-developed industrialization limited poverty reduction in those areas.
The decline in the sensitivity of employment (employment elasticity) relative to GDP (or output) growth, illustrates that over time the effect of economic growth on employment and poverty reduction will diminish. As shown in Figure 2, the employment elasticity in non-agricultural sectors (including industry and tertiary industry) has a downward trend. In the 1980s, ChinaÊs annual average GDP grew by 9.8 per cent, and employment elasticity by 0.56 per cent. In 1990s, ChinaÊs GDP grew at an annual rate of 9.3 per cent, while the employment elasticity was 0.33. TVE employment growth was strongest in the late 1980s and early 1990s, but its employment elasticity has also declined since then. The distortion of factors of production and economic restructuring towards capitalization are the main reasons for the declining employment elasticity in non-agricultural sectors, which not only limits the full utilization of ChinaÊs abundant labour resources, but also hinders rural labourers from taking advantage of the opportunities of rapid economic growth to improve their quality of life.

14
FIGURE 2EMPLOYMENT ELASTICITIES IN NON-AGRICULTURAL SECTORS AND TVEs
Note: Employment in non-agricultural sectors includes those in industry and tertiary industry. Source: National Statistical Bureau, China Statistical Yearbook (2005), China Statistics Press, Beijing.
���� �����������!���� "#$!
� �
� �
� �
� �
�
� �
� �
�� �
�� �
� �
� �
� �
� �
��� ��� �� ���� ���� ���� ���� ��� ��� �� ���� ���� ���� ����
15
INSTITUTIONAL REFORM AND MIGRATION
Trends of rural to urban migration
The massive rural to urban migration in China is unprecedented in human history. As the most populous developing country in the world, arable land in China is a mere 0.1 hectare per capita, only half the worldÊs average. In a country with such a huge population and so little land, rural labourers have a strong tendency to migrate to the cities. During the early 1950s, mobility into and out of the cities was relatively unrestricted and, in fact, a large number of rural labourers moved into the cities at that time. By the mid-1950s, however, the establishment of hukou segregated rural from urban areas and imposed strict controls on migration between them and across regions.
Prior to the start of the reforms, rural labourers had no alternative to working in agricultural sectors. In 1978, there were 285 million agricultural labourers, accounting for 70.9 per cent of the total labour force and 92.9 per cent of the total rural labour force. With the unfolding of rural and urban reforms, industrialization cum urbanization gradually transferred more and more rural labourers into non-agricultural sectors and urban areas.
In the early 1980s, when agricultural reforms first took place, not very many rural labourers migrated to other areas to work (see Table 4). Most of the 2 million rural migrants were craftsmen, such as carpenters, construction workers and street vendors who moved between villages. With the improvement of agricultural productivity and the relaxation of government controls on rural-urban migration, more and more rural labourers joined the wave of migrants. By the end of the 1980s, China had a total of 30 million rural migrants. An era of massive population flows from rural to urban areas was looming on the horizon.
Deng XiaopingÊs visit to South China in 1992 ushered in a new round of rapid economic growth. The expansion of the private economic sectors drew large numbers of rural labourers out of agriculture, triggering the first large-scale migration wave across regions. The number of people employed in urban private enterprises or self-employed totalled 11.16 million in 1993, an increase of 33.2 per cent over 1992. This figure reached 34.67 million in 1999 with an average annual increase of 3.92 million. In 1992 the number of projects receiving direct investment from foreign companies and from companies in the special administrative areas of Hong Kong, Macao and the Chinese Province of Taiwan had reached 48,764, 2.8 times that of 1991. The amount

16
TABLE 4NUMBER OF RURAL TO URBAN MIGRANTS: 1982-2004
Source: Chen, Xiaohua, Hongyu Zhang (ed.), Building an Equal Employment System for Rural Labourers, China Financial and Economic Press, 2005, Beijing.
Year Out of Township (Million) Average Annual Transfer (10,000s)1982 2.0 50
1989 30.0 400
1993 62.0 800
1995 70.0 400
1996 72.2 223
1997 77.2 499
2001 89.6 348
2002 94.3 469
2003 98.2 390
2004 102.6 440
of actual FDI reached US$ 11 billion, up 1.5 times from 1991, and kept growing at a rapid pace in the following years. Rapid development of TVEs, especially in coastal areas, as well as the booming economic development zones generated strong demand for cheap rural labourers.
The numbers of rural migrants doubled within four years. In 1993, rural migrants totalled 62 million, 22 million of whom had migrated across provinces, 2.07 and 3.14 times the respective figures for 1989. Subsequently, the numbers of rural migrants increased steadily to 70 million in 1994 and 75 million in 1995; of these, 25-28 million were inter-provincial migrants.
The 1997 South-East Asian financial crisis had a negative impact on economic growth in Asia and the world at large. Consequently, export and TVE development in China suffered tremendously. The reform of state-owned enterprises and the urban employment system from the mid-1990s onwards led to massive lay-offs of urban workers. The unemployment rate rose sharply and the job market shrank. Rural to urban migration slowed down to an annual average of 3.6 million.
Since 2001, rural to urban migration has again accelerated. From 2001 to 2004, the number of rural migrants increased to 4.12 million per annum. In 2004, rural migrants exceeded 100 million for the first time, accounting for 20.6 per cent of the

17
total number of rural labourers. Despite the increasing migration of rural labourers, the expansion of non-agricultural sectors in the wake of ChinaÊs accession to the WTO has increased the demand for rural labourers. The eastern costal areas began to experience shortages of rural migrant workers since late 2002 and correspondingly difficult labour market conditions (Wang, et al., 2005).
Changes in the institutional and policy environment for migration
ChinaÊs rural to urban migration has evolved along with gradual institutional changes that have enabled the development of labour markets and the abolition of structural obstacles to mobility. Apart from the characteristics common to developing countries, ChinaÊs rural to urban migration has some unique features associated with institutional transition. Specifically, the policy measures governing migration have gone through three stages since the beginning of the reform in 1978: permitting rural labour mobility; guiding rural labour mobility, and encouraging rural labour mobility. Under the principle of market-oriented reform, the intention and focus of related policies have changed according to the macroeconomic situation, leading to fluctuations in the numbers of rural migrants.
1980s: Permitting rural labour mobility
The household responsibility system (HRS) initiated in late 1970s, released surplus labourers from agriculture and raised farm productivity. At the same time, the rapid development of TVEs, especially in the eastern regions, increased the demand for rural labourers. As the focus of economic reform shifted from rural to urban areas, systemic reform in urban areas gathered pace. The tertiary sector in urban areas began to open up to rural migrants, creating more opportunities for labour mobility from agricultural to non-agricultural sectors and from rural to urban areas. In this situation, permitting rural labour mobility was not only what farmers desired, but also a prerequisite for achieving urban economic growth.
In 1984, China began to allow farmers and agricultural collectives to engage in long-distance transporting and the sale of „three categories of agricultural and non-staple food‰, as well as foodstuffs not included in the quota assigned by the state. This was the first time that Chinese farmers had the right to do business outside their hometowns. Farmers were also encouraged by the state to work in nearby small towns where emerging TVEs demanded labour. In 1985, the Ministry of Public Security promulgated Temporary Rules on Migratory Population in Cities and Towns, which

18
required all those aged 16 and above who stayed in cities and towns for more than three months to apply for temporary residence permits. This policy provided the legal basis for charging a temporary residence permit fee and, to some extent, discouraged rural to urban migration.
From 1988 to 1990, to control the inflation induced by the overheated economy, the Chinese government adopted many economic measures, including reducing infrastructure investment as well as strengthening controls on financial market, taxation and credit. As a result, many construction projects were suspended or stopped, and economic growth slowed down significantly. In order to protect urban workers, many rural migrants were fired, giving rise to a reverse flow of urban to rural migration. The development of non-agricultural sectors in rural areas also suffered greatly. The capacity of TVEs to absorb workers declined over the course of two consecutive years. According to the Notice on Employment Work, issued by the State Council on 27 April 1990, the government encouraged rural labours to „leave the land without leaving the township‰ and to seek employment locally. Stronger control was imposed on rural migrants in cities. Non-planned rural workers were let go and asked to return to the countryside.
The above-mentioned policies had the effect of deterring labour mobility. The population of rural migrants fell dramatically between 1988 and 1989, dropping by as much as about 33 per cent in several big cities. This decline was short-lived, however. By 1990-91, in most cities the number of rural migrants had again reached the levels of 1988, and some even exceeded their previous levels.
1990s: Guiding rural labour mobility
Growing income inequalities, the pressure of employment in agricultural sectors and the reform of the urban hukou system created push-pull forces leading to large-scale migration. In these circumstances, the former policies that suppressed labour mobility were obviously ineffective. Therefore, strengthening the management of labour mobility through the provision of employment guidance and employment services clearly emerged as the better option.
In January 1991, the Ministry of Labour and Social Security, the Ministry of Agriculture and the State Council Development Research Centre jointly decided to set up a pilot project for the promotion of ChinaÊs rural labour employment. The implementation of this project proceeded in two phases. During Phase I (1991-1994), the project was implemented in 50 counties, and during Phase II (1994-1996), in eight

19
provinces. Experiments were conducted to promote the non-agricultural employment of rural labourers in those counties and provinces to gain experience for expansion.
Based on the experience of the first stage of the pilot project, the Ministry of Labour and Social Security promulgated Temporary Rules on Managing the Employment of Rural Labour Migrating Across Provinces. According to these, before leaving home, rural migrants were required to bring their ID card and other necessary documents to register at the local employment agency and obtain an employment registration card. After arriving at their destination, rural migrants needed to obtain the employment registration certificate for incoming migrant workers. Employment certificates for rural migrants (employment registration card plus employment registration certificate) served as a valid ID card for rural migrants and enabled them to enjoy the employment services provided by career centres. In November 1997, the State Council issued suggestions on the establishment of a comprehensive labour market planning and information service system for the creation of a labour market system.
The Procedure to Apply for a Temporary Living Card, promulgated by Ministry of Public Security on 2 June 1995, established rules for the use, effectiveness and change of the temporary residence card. Persons aged 16 and above who left their place of normal residence for more than one month for purposes other than visiting friends or family, travelling, seeking medical treatment or a business trip, were required to apply for a temporary residence card while waiting for a temporary hukou, valid for a maximum of one year.
In 1997, the hukou system was further relaxed. Small cities and towns began to grant hukou to rural migrants who either bought or built a house. In July 1998, the State Council approved Opinions on Solving Top Issues in Hukou Management, stating that migrants who had lived for a certain time in a city were permitted to obtain a local urban hukou, as long as they had a fixed residence, a stable and legal occupation or a source of income. In the same year, the Ministry of Public Security issued new regulations relaxing the control over hukou registration, allowing persons who joined their parents, spouses and children in cities to register with urban hukou. The reforms in urban welfare provisioning, such as the removal of rationing, the creation of a housing market, the adoption of more flexible employment policies and attempts to establish a social security system, have made it easier for rural labour migrants to make a living in cities.
Guiding rural labour mobility is the top policy priority in this period. Since the mid-1990s, however, after a large number of workers in state-owned enterprises (SOEs) were laid off, unemployed urban workers entered the urban labour markets and competed with migrants. In order to solve the unemployment problem of laid-

20
off SOE workers, many cities adopted protective measures to exclude rural migrants from certain jobs. This policy had very limited effect and was rapidly abandoned in most cities, but continued to exist in some with high unemployment rates, such as Shengyang, to save jobs for urban workers (Solinger, 2004) or for the arrangement of local re-employment after some TVEs collapsed in Jiangsu.
Since 2000: Encouraging rural labour mobility
There have been a number of positive changes concerning the employment of rural migrants since 2000. The contribution of rural migrants to urban social and economic development has gradually been recognized by society, and urban residents have begun to change their attitude towards migrant workers.
In January 2002, the State Council first released the 16-word policy of „fair treat-ment, good guidance, improving management and improving services‰. In January 2003, the State Council issued the Notice on How to Better Manage and Provide Services for Rural Migrants, requiring local governments to make greater efforts to provide better public employment management and services for rural migrants, eliminate unreasonable limitations on rural-urban migration, solve salary arrears and cuts, improve living and working conditions, provide more training opportunities, ensure schooling for the children of migrants and enhance management. In the first document of 2004, the central government pointed out that „rural migrant workers have become a crucial component of the industrial work force, and create wealth for cities and generate tax revenues‰.
Under the new concept of „fair treatment‰, unreasonable limitations on rural migrants have been gradually removed and a mechanism conducive to the employment of rural migrants put in place. In order to facilitate labour mobility and social stability, the State Planning and Development Committee, together with the Ministry of Finance, issued a notice in November 2001 requiring local governments to abolish all manner of fees levied on rural migrants, including temporary residence fees, management fees of the temporary population, family planning fees, urban expansion fees, labour adjustment fees, management and service fees, and construction enterprisesÊ management fees. According to the 2003-2010 Nationwide Training Plan for Rural Migrants, jointly developed by the Ministry of Agriculture, the Ministry of Labour and Social Security, the Ministry of Education, the Ministry of Technology, the Ministry of Construction and the Ministry of Finance in September 2003, special funds have been secured by the central and local governments for the training of rural migrants. The implementation of these policy measures will greatly improve the employment conditions of rural migrant labourers.

21
ChinaÊs rural-urban labour migration began with the implementation of the household responsibility system, and reached its peak with the reform of the hukou system. Large-scale rural to urban migration has contributed towards the development of ChinaÊs economy and transition to a market economy by providing the necessary labour. At present, the allocation of labour and other factors of production has been transformed in line with a market-economy approach. Although there has been progress in reforming the hukou system, much remains to be done, since the hukou system still associates employment with individual identity, and hinders labour mobility and economic development.
Migration as a labour market response to income inequality
In the 1980s, most rural migrants opted to „leave the farm land without leaving the village‰, and chose to work in local TVEs. Since the early 1990s, fundamental changes in the pattern of supply and demand for agricultural products intensified the pressures for surplus rural labourers to transfer out of agriculture. In the meantime, booming economies in the south-eastern coastal areas, such as Guangdong and Fujiang, experienced increasing demand for cheap labour. Thus, the spatial imbalance between labour supply and demand triggered the first wave of migration. In 1993, the number of rural migrants was estimated at about 60 million, with one-third entering the cities. According the National Statistical Bureau rural survey, by 2004 this figure had risen to 120 million, half of whom were inter-provincial migrant.
Increasing regional mobility is also the response of surplus rural labourers to growing income inequalities. Since the mid-1980s, when income inequalities started to increase, economic reforms gradually allowed market forces to play a greater role in the allocation of resource and factors of production. Benefiting from early openness, coastal provinces have been leading in both economic growth and the development of markets for factor allocation (Cai and Wang, 2004), thereby eliminating the institutional obstacles that prevented factors of production from moving across regions, and creating the conditions to receive the massive inflow of rural migrants. Cheap rural migrants, in turn, have played an important role in driving economic growth in these regions.
The integration into international markets has accelerated the adjustment of economic restructuring in those regions towards labour-intensive industries, which utilize ChinaÊs comparative advantage of abundant labour resources. In 2004, 92.6 per cent of the total export value in China was generated in the eastern region, against only 4.2 per cent in the central and 3.2 per cent in the western regions. In 2003, 85.7 per cent of foreign direct investment was invested in the eastern regions,
22
against 11.0 per cent in central and 3.3 per cent in western regions. As a result, the main direction of migration is from the centre and western regions to the east.
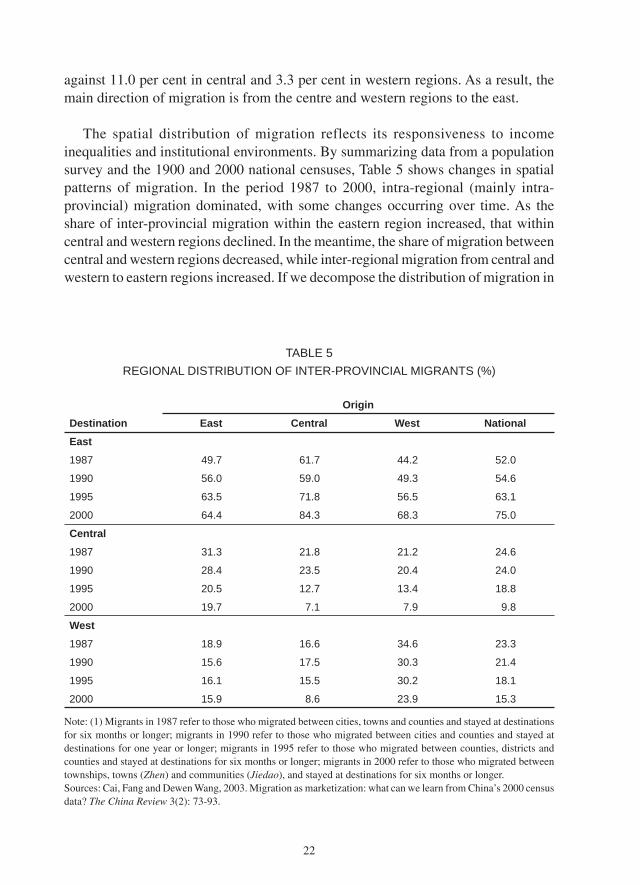
The spatial distribution of migration reflects its responsiveness to income inequalities and institutional environments. By summarizing data from a population survey and the 1900 and 2000 national censuses, Table 5 shows changes in spatial patterns of migration. In the period 1987 to 2000, intra-regional (mainly intra-provincial) migration dominated, with some changes occurring over time. As the share of inter-provincial migration within the eastern region increased, that within central and western regions declined. In the meantime, the share of migration between central and western regions decreased, while inter-regional migration from central and western to eastern regions increased. If we decompose the distribution of migration in
TABLE 5REGIONAL DISTRIBUTION OF INTER-PROVINCIAL MIGRANTS (%)
Note: (1) Migrants in 1987 refer to those who migrated between cities, towns and counties and stayed at destinations for six months or longer; migrants in 1990 refer to those who migrated between cities and counties and stayed at destinations for one year or longer; migrants in 1995 refer to those who migrated between counties, districts and counties and stayed at destinations for six months or longer; migrants in 2000 refer to those who migrated between townships, towns (Zhen) and communities (Jiedao), and stayed at destinations for six months or longer. Sources: Cai, Fang and Dewen Wang, 2003. Migration as marketization: what can we learn from ChinaÊs 2000 census data? The China Review 3(2): 73-93.
OriginDestination East Central West NationalEast1987 49.7 61.7 44.2 52.0
1990 56.0 59.0 49.3 54.6
1995 63.5 71.8 56.5 63.1
2000 64.4 84.3 68.3 75.0
Central1987 31.3 21.8 21.2 24.6
1990 28.4 23.5 20.4 24.0
1995 20.5 12.7 13.4 18.8
2000 19.7 7.1 7.9 9.8
West1987 18.9 16.6 34.6 23.3
1990 15.6 17.5 30.3 21.4
1995 16.1 15.5 30.2 18.1
2000 15.9 8.6 23.9 15.3

23
2000 into four types of migration (i.e., urban to urban, urban to rural, rural to urban and rural to rural migration), rural to urban migration with 40.7 per cent accounts for the major part of the total. Urban to urban migration ranks second, accounting for 37.2 per cent. Thus, these two are the main forms of migration in China. Rural to rural migration accounted for 18.2 per cent of total migration, and urban to rural migration for only 4 per cent of the total.
New surveys illustrate that rural migration is further concentrated in eastern regions. For example, in 2004 the five provinces with the highest ratio of migrants to provincial rural labourers, were Anhui, Jiangxi, Hubei, Chongqing and Sichuan, all experiencing a ratio of over 30 per cent and all located in central and western regions. More than 10 million rural labourers left Henan and Sichuan. Around 28.1 per cent of rural migrants chose to work in mega-cities and provincial capitals, 34.3 per cent in prefectures and less than 40 per cent in county towns and townships. The share of rural migrants who choose to work in the eastern regions increased from 64.3 per cent in 2000, to 68 per cent in 2003 and 70 per cent in 2004. Although the relative rate of migration to income disparity rose from 0.197 in the period 1985-1990 to 0.595 for the period 1995-2000, such an increase in mobility has not reduced income inequality, mainly because of the unfinished reform of the hukou system and other factors that continue to accentuate regional disparity (Lin et al., 2004).
National development plans for poverty reduction through migration
In order to accelerate the pace of rural poverty alleviation, the Chinese government has been incorporating migration into its national economic development plan, and calling for appropriate policy actions. In 1986, the government set up the national rural poverty criteria for the first time, and 331 counties were designated as national poverty counties in which rural income was less than 150 yuan. During the late 1980s and the early 1990s, the Chinese government adopted a series of important policy measures to strengthen the work of rural poverty alleviation, such as establishing specific leading agencies, providing funds and prioritizing policies, and introducing the regional development strategy of poverty alleviation instead of the traditional social relief. At that time, major policy measures paid much more attention to regional economic development and the transfer of rural surplus labourers into non-agricultural sectors in poor areas. With the anti-poverty efforts in poverty-stricken areas, per capita rural income rose from 206 yuan in 1986 to 483.7 yuan in 1993 in the national designated poverty counties, the number of rural poor declined from 125 million to 80 million and the poverty incidence from 14.8 per cent to 8.7 per cent during the same period.

24
The success of the regional development strategy of poverty alleviation greatly encouraged the Chinese government to lift all rural poor out of poverty. In 1994, the government proclaimed the implementation of „8-7‰ poverty reduction plan, aiming to eradicate the remaining 80 million poor in the coming seven years. In this plan, the government proposed a concrete objective that one labourer per household would be transferred to township and village enterprises and developed areas, and identified migration as one of the important development channels to achieve the goals of the „8-7‰ poverty reduction plan. Major measures included the development of labour-intensive industries and township and village enterprises in poverty-stricken areas, the inter-regional transfer of rural labourers organized by government agencies, the spatial reallocation for poor households living in extremely poor and remote areas. Moreover, the development of education, training and technological extension was emphasized to improve farmersÊ qualifications and their employability in non-agricultural sectors.
In 1994, the Chinese government adjusted the national poverty criteria for the state-designated poverty counties with per capita rural incomes of less than 400 yuan. According to this standard, 592 counties were officially designated as poverty counties, which accounted for 72 per cent of the total rural poor population. In fact, most of the provincial governments also set up local criteria and chose a number of local counties as officially designated poverty counties, but which are not included in the list of the state-designated poverty counties. The wide social participation in anti-poverty actions yielded results, with the number of rural poor in the state-designated poverty counties falling from 58.6 million in 1994 to 17.1 million, and the rural poverty incidence to less than 3 per cent by the end of 2000, thereby achieving the goals of the „8-7‰ poverty reduction plan.
At the beginning of the new millennium, the Chinese government announced a rural poverty alleviation programme for the period 2001 to 2010, targeting the marginalized poor populations concentrated in remote and mountainous regions. In this 10-year programme, labour transfers and reallocation were also emphasized as an important means to implement the regional development and anti-poverty strategy. In 2003, the government launched two national programmes: one to provide training for around 60 million rural migrants between 2003 and 2010 and to improve their employability in non-agricultural sectors; the other to provide technical training for about 16 million farmers and improve their adopting of new farming technologies. These national development plans are expected to have a very beneficial effect on rural poverty reduction and rural development.

25
MIGRATION AND THE POVERTY TRAP
Characteristics of poor households
Income (consumption) poverty measures the status of poverty by comparing family income and consumption expenditures with a given poverty line. This measurement is virtually an ex post methodology, because income (consumption) is the outcome of family economic activity. Poverty is multi-dimensional. Factors to directly or indirectly affect the process of family income generation include family assets, education, health status, local infrastructure, natural disasters, access to public services and participation in social activities. In most cases, income (consumption) poverty directly relates to assets-based and capability poverty that reflect the status of individual deprivation and social exclusion (Sen, 1992; World Bank, 2006). The assets-based and capability poverty is often the major cause of chronic income (consumption) poverty and a vicious poverty cycle.
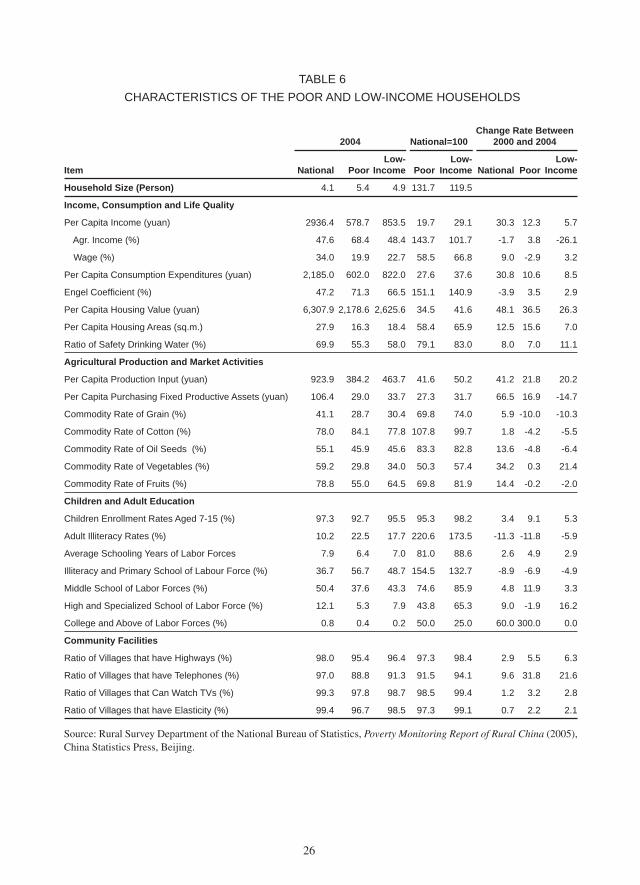
Differences in income and consumption between poor and non-poor households mainly derive from their differences in assets and human capital. Table 6 provides evidence for this comparison. As shown there, per capita income of the poor and low-income households in 2004 is 578.7 yuan and 853.5 yuan, equivalent to only 19.7 per cent and 29.1 per cent of the national average per capita income of rural households, respectively. Agricultural income is the main source of income for poor households, accounting for 68.4 per cent. In contrast, the share of wage income in the national average per capita income is 34.0 per cent, 14.1 percentage points higher than in poor households. The slow income growth of the poor and low-income rural households means that a large share of income is devoted to food expenditures. The Engle coefficients of the poor and low-income households, which measure the ratio of food expenditures to total consumption expenditures, is 71.3 per cent and 66.5 per cent, equivalent to 151.1 per cent and 140.9 per cent of the national average, respectively. Per capita living space and ratios of households with safe drinking water also indicate significant differences in the quality of life between poor and non-poor households (Table 6).
Three categories of factors cause income and consumption differences between the poor and non-poor households. First is the difference in agricultural production and market activities. Low-income levels and financial difficulties constrain the capability of poor households to increase their input and productive investment. The semi-commercial characteristics of agricultural production mean that poor households
26
TABLE 6CHARACTERISTICS OF THE POOR AND LOW-INCOME HOUSEHOLDS
Source: Rural Survey Department of the National Bureau of Statistics, Poverty Monitoring Report of Rural China (2005), China Statistics Press, Beijing.
2004 National=100Change Rate Between
2000 and 2004
Item National PoorLow-
Income PoorLow-
Income National PoorLow-
Income
Household Size (Person) 4.1 5.4 4.9 131.7 119.5
Income, Consumption and Life Quality
Per Capita Income (yuan) 2936.4 578.7 853.5 19.7 29.1 30.3 12.3 5.7
Agr. Income (%) 47.6 68.4 48.4 143.7 101.7 -1.7 3.8 -26.1
Wage (%) 34.0 19.9 22.7 58.5 66.8 9.0 -2.9 3.2
Per Capita Consumption Expenditures (yuan) 2,185.0 602.0 822.0 27.6 37.6 30.8 10.6 8.5
Engel Coeffi cient (%) 47.2 71.3 66.5 151.1 140.9 -3.9 3.5 2.9
Per Capita Housing Value (yuan) 6,307.9 2,178.6 2,625.6 34.5 41.6 48.1 36.5 26.3
Per Capita Housing Areas (sq.m.) 27.9 16.3 18.4 58.4 65.9 12.5 15.6 7.0
Ratio of Safety Drinking Water (%) 69.9 55.3 58.0 79.1 83.0 8.0 7.0 11.1
Agricultural Production and Market Activities
Per Capita Production Input (yuan) 923.9 384.2 463.7 41.6 50.2 41.2 21.8 20.2
Per Capita Purchasing Fixed Productive Assets (yuan) 106.4 29.0 33.7 27.3 31.7 66.5 16.9 -14.7
Commodity Rate of Grain (%) 41.1 28.7 30.4 69.8 74.0 5.9 -10.0 -10.3
Commodity Rate of Cotton (%) 78.0 84.1 77.8 107.8 99.7 1.8 -4.2 -5.5
Commodity Rate of Oil Seeds (%) 55.1 45.9 45.6 83.3 82.8 13.6 -4.8 -6.4
Commodity Rate of Vegetables (%) 59.2 29.8 34.0 50.3 57.4 34.2 0.3 21.4
Commodity Rate of Fruits (%) 78.8 55.0 64.5 69.8 81.9 14.4 -0.2 -2.0
Children and Adult Education
Children Enrollment Rates Aged 7-15 (%) 97.3 92.7 95.5 95.3 98.2 3.4 9.1 5.3
Adult Illiteracy Rates (%) 10.2 22.5 17.7 220.6 173.5 -11.3 -11.8 -5.9
Average Schooling Years of Labor Forces 7.9 6.4 7.0 81.0 88.6 2.6 4.9 2.9
Illiteracy and Primary School of Labour Force (%) 36.7 56.7 48.7 154.5 132.7 -8.9 -6.9 -4.9
Middle School of Labor Forces (%) 50.4 37.6 43.3 74.6 85.9 4.8 11.9 3.3
High and Specialized School of Labor Force (%) 12.1 5.3 7.9 43.8 65.3 9.0 -1.9 16.2
College and Above of Labor Forces (%) 0.8 0.4 0.2 50.0 25.0 60.0 300.0 0.0
Community Facilities
Ratio of Villages that have Highways (%) 98.0 95.4 96.4 97.3 98.4 2.9 5.5 6.3
Ratio of Villages that have Telephones (%) 97.0 88.8 91.3 91.5 94.1 9.6 31.8 21.6
Ratio of Villages that Can Watch TVs (%) 99.3 97.8 98.7 98.5 99.4 1.2 3.2 2.8
Ratio of Villages that have Elasticity (%) 99.4 96.7 98.5 97.3 99.1 0.7 2.2 2.1

27
produce agricultural goods for sale and personal consumption, which reduces their opportunities to make money by fully participating in market activities. In Table 6, per capita input of poor households is equivalent to less than half the national average, while per capita productive fixed assets investments of poor households are equivalent to less than one-third of the national average; comparable figures for low-income households are slightly more than half and more than one-third of the national average, respectively. The commodity rates of staple agricultural products like grain, cotton and oil plants, vegetables and fruit from poor and low-income households are all below the national average, except the commodity rate of cotton from poor households.
Second is the difference in adult education. Adult illiteracy rates among poor and low-income households are respectively 1.5 and 1.3 times higher than the national average. Average school years in poor and low-income households are 6.4 and 7.0 years, equivalent to 81 and 89 per cent of the national average, respectively. The educational distribution of the labour force further illustrates the significant difference in education levels in poor and non-poor households. More than 60 per cent of labourers in poor households have not graduated from middle school, against the national average of 44.5 per cent. The disadvantage of less education in the poor households has prevented their members from improving agricultural productivity or from being employed in non-agricultural sectors.
The third factor is the differences in local infrastructure and access to public services. Rural infrastructure includes roads, irrigation, electricity, communication, transportation and so on, which play an important role in agricultural production and living conditions. As shown in Table 6, rural infrastructure and public utilities in poor areas are well below the national average. Even so, state investment in poor areas has helped to narrow the gap between the poor and non-poor areas.
Effectiveness of migration in reducing poverty
According to development theory, the poor caught in the poverty trap face a set of vicious cycles, which keep them mired in poverty. Investment in health and education is central to enable the poor to benefit from the interlocking set of self-reinforcing virtuous cycles and the escape from the poverty trap.
Migration is part of a process of human capital investment. Only minimum financial input and psychological preparation are needed to cover the cost of job hunting and transportation, and to deal with the uncertainties and risks in the migration process. Studies show that the extremely poor are less likely to migrate due to their lack of

28
money, information and education, and are more risk-averse, but they will pursue migration if given help in training and finding jobs. The monitoring figures show an upward trend in migration in poor areas. In 2001, 11.8 per cent of total labourers in officially designated poor counties left to work outside and this number had risen to 16.6 per cent by 2004. The increasing inter-provincial migration from the officially designated poverty counties indicates an improvement in the migration capability of rural labourers in poor areas (see Table 7).
Remittances are one of the most important means by which migration contributes to poverty reduction. For example, many surplus rural labourers in the western provinces have been able to find jobs in the more-developed areas of their own provinces or in the coastal provinces. Many send home remittances that allow relatives on the farms to improve their living standards, or else they bring money back home to set up small businesses, creating needed jobs in the villages. It is reported that remittances from outside migrants to Sichuan province amounted to an estimated 20 billion yuan (US$ 2.4 billion) in 1995, accounting for 7 per cent of the provinceÊs GDP. About
TABLE 7MIGRATION IN THE STATE-DESIGNATED COUNTIES
Source: Rural Survey Department of the National Bureau of Statistics, Poverty Monitoring Report of Rural China (2002, 2005), China Statistics Press, Beijing.
2004 2001Mobility Channels Government and Organization 3.4 3.82
Relatives and Friends 38.9 41.93
Self-own 57.7 54.25
Region DistributionOutside Township and Within County 12.6 22.74
Outside County and Within Province 21.1 24.47
Inter-Province 66.3 52.79
Outside Duration0-6 months 36.8 n.a.
6 months and over 63.2 n.a.
IncomeTotal Income 3,921.6 3,268.53
Self-own Consumption Expenditures 1,447.4 1,344.85
Remittances 1,611.8 1,706.11
Number of MigrantsShare of Rural Labour Forces 16.6 11.8

29
30,000 peasants who returned to that province have started their own businesses, creating thousands of local jobs. Remittances from migration were 2.8 times the per capita income of the poor households in the officially designated poverty counties (Table 7).
Using rural household survey data for four poverty counties, Cai and Du (2005) analysed the impact of remittances on poverty reduction. According to the data, the per capita income of migrants was 2,907 yuan before remittances, while that of other family members was 602 yuan. On average, migrants remitted a third of their income per person (980 yuan), with other family members receiving 465 yuan per person, or 77 per cent of their own per capita earnings. Using the rural poverty line of 635 yuan in 2000, they found that the poverty incidence of migrants was 17.5 per cent before remittances, and 27.8 per cent after remittances, whereas the poverty incidence of other family members was 67.1 per cent before and 49.2 per cent after receiving remittances. Zhao (2002) found that households with returned migrants invest significantly more than other households in productive farm assets. Such evidence suggests that migration helps poor families to deal with and eventually escape poverty.
Ways to eradicate chronic poverty
As the left-behind rural poor are increasingly marginalized, an analysis of their income dynamics provides useful information for understanding poverty persistence. However, this method has a strict requirement that the data should be a repeated household panel so that the index of aggregate poverty can be decomposed into chronic and transitory poverty. Rodgers and Rodgers (1993) used the Panel Study of Income Dynamics data, and found that during the 1970s and the mid-1980s, chronic poverty in the US was a more serious problem than transitory poverty. Based on a 1990-1995 panel dataset, Jyotsna and Ravallion (1998) found that consumption variability accounted for a large share of observed poverty in rural China. They suggested that ChinaÊs anti-poverty policies should place greater emphasis on the problem of transitory poverty.
The NBS Department of Rural Survey (2002) re-examined the issue of rural poverty persistence by using large sample panel data from 1997 to 2001 in the officially designated poverty counties. The results obtained from 16,000 households confirmed that transitory poverty is the dominant form of poverty and accounts for 91.7 per cent (65.1%) of rural income (consumption) poverty if using the official poverty line (see Table 8). But, if the low-income poverty line (equivalent to one dollar-per-day criteria) is used, the share of income transitory poverty dropped to 79.9 per cent, whereas the

30
share of consumption transitory poverty fell to 44.8 per cent, which indicates that we should be cautious when examining the nature of rural poverty.
Family size, education and geographic location have a significant impact on headcount index and poverty persistence. As shown in Table 8, the headcount index rises with the increase in family size, but decreases with the increase of per capita education levels. The headcount index in the eastern region is around one-fourth of that in central and western regions. Like the headcount index, the chronic poverty
TABLE 8TRANSITORY AND CHRONIC POVERTY IN THE STATE-DESIGNATED COUNTIES:
1997-2001
Source: Rural Survey Department of the National Bureau of Statistics, Poverty Monitoring Report of Rural China (2002), China Statistics Press, Beijing.
Offi cial Poverty Line: 630 Yuan Low Income Line: 830 Yuan
Headcount Index
Chronic Poverty
Transitory Poverty
Share of Transitory
PovertyHeadcount
IndexChronic Poverty
Transitory Poverty
Share of Transitory
Poverty
Income Poverty 0.0770 0.0064 0.0707 91.70 0.0745 0.0150 0.0596 79.90
Household Size
1 0.0111 0.0041 0.0071 63.50 0.0299 0.0099 0.0200 66.92
2 0.0128 0.0033 0.0095 74.54 0.0346 0.0147 0.0199 57.59
3 0.0117 0.0028 0.0089 75.79 0.0338 0.0149 0.0189 55.98
4 0.0139 0.0040 0.0099 71.33 0.0421 0.0207 0.0214 50.90
5 0.0214 0.0078 0.0136 63.35 0.0586 0.0341 0.0245 41.84
6 0.0289 0.0160 0.0173 59.98 0.0769 0.0475 0.0295 38.30
7 0.0357 0.0185 0.0172 48.08 0.0910 0.0642 0.0268 29.33
8 0.0413 0.0180 0.0233 56.49 0.0122 0.0691 0.0331 32.34
Education
Illiteracy 0.0361 0.0166 0.0196 54.09 0.0902 0.0594 0.0308 34.15
Semi Illiteracy 0.0228 0.0079 0.0149 65.26 0.0629 0.0359 0.0270 42.93
Primary School 0.0181 0.0058 0.0123 68.01 0.0499 0.0262 0.0237 47.52
Middle School 0.0157 0.0051 0.0106 67.36 0.0453 0.0237 0.0215 47.56
High School 0.0132 0.0043 0.0089 67.72 0.0392 0.0199 0.0193 49.20
Specialized High School 0.0082 0.0020 0.0062 75.17 0.0250 0.0099 0.0151 60.40
College and Above 0.0072 0.0010 0.0061 85.60 0.0275 0.0115 0.0159 58.04
Region
East 0.0055 0.0008 0.0047 85.66 0.0195 0.0068 0.0128 65.37
Central 0.0185 0.0069 0.0116 62.67 0.0513 0.0285 0.0228 44.39
West 0.0199 0.0067 0.0132 66.44 0.0555 0.0309 0.0245 44.21
Consumption Poverty 0.0184 0.0067 0.0120 65.10 0.0515 0.0284 0.0230 44.8

31
index and its share in the headcount index have a similar relationship with family size, per capita education and geographic location.
The factors that cause transitory and chronic poverty differ. Families caught in transitory poverty often experience the temporary shocks of natural disaster, agricultural price fluctuation, variations in the economic business cycle, short-time illness, temporary unemployment, and so on. They can recover from those temporary shocks, and their income and consumption recover over time. In contrast, families caught in chronic poverty often face long-lasting adverse factors such as living in remote areas with bad natural environments, poor production conditions and low agricultural productivity, family members with serious illness, and low participation in market activities and non-agricultural employment. It is difficult to improve the quality of life of people in these households through agricultural production, and it is difficult for them to recover from external adverse shocks.
Different sources of transitory and chronic poverty have different implications for policy and intervention. If transitory poverty is the major component of poverty, a well-funded social safety net will be a good tool to help the poor overcome temporary shocks. If poverty is composed largely of chronic poverty, the developmental approach such as strengthening assets accumulation, human capital investment, infrastructural investment and the provision of public services will be an effective and cost-efficient option to eliminate poverty in the long run. For some poor populations who live in isolated remote border or mountainous areas, government-sponsored relocation would be a sound choice to cut down the overwhelming cost.
Cai and Du (2005) used endowments as an instrument to predict the likelihood of households in poor areas that tend to participate in migration. They then grouped these households into three types: households with high endowments which tend to be more responsive to migration; households with low endowments which tend to be less responsive to migration, and households at the subsistence limit which have moderate endowments and tend to be sensitive to migration because the predicted income is almost equivalent to the official poverty line. From the perspective of migration there is a set of specific but different policy measures for government intervention. As for the first household type, a better institutional environment is very important for them to improve their quality of life through free mobility; concerning the second type of households, the provision of basic needs is necessary to temporarily escape poverty. Strengthening household assets accumulation, human capital investment and the provisioning of public services can increase their endowments, enhance their capacity to migrate and enable them to cast off poverty in the long run. As for the third type, providing training, employment information and services are mostly helpful in enabling them to grasp migration opportunities.
32
MIGRATION AND THE URBANIZATION OF POVERTY
Determinants of the urbanization of poverty
The urbanization of poverty is largely determined by the rate of rural-urban migration and the growth of employment in urban sectors. If the growth of employment outpaces the rate of rural to urban migration, it is possible to achieve the dual goal of both poverty alleviation and urban development. If the process of migration is hindered by institutional and policy barriers, the segregation of the urban labour market will distort the efficient allocation of resources and factors of production. Labour market discrimination and social exclusion will force most rural migrants to work in the informal sectors and to choose informal settlement in order to reduce their cost of living in urban areas, which will probably exacerbate the problem of urban poverty in the future.
According to the report of the United Nations Human Settlements Programme (2003), the worldÊs urban population increased by 36 per cent during the 1990s. If such growth rates are sustained in the future, poverty will become increasingly urbanized across the globe due to the lagged development of urban infrastructure, job creation and public services. At present, at least 1 billion people worldwide live in urban slums. Moreover, in 30 yearsÊ time, one in every three will live in urban slums characterized by poor public health, lack of basic infrastructure, inadequate public services and widespread violence and insecurity.
Ravallion (2001) verified that the growth rate of urban pauperization in developing countries outpaces the speed of urbanization itself, owing to the rapid transfer of poverty from rural to urban areas via migration. According to data from 39 developing countries, he found that the rate of urban pauperization is 26 percentage points higher than the rate of urbanization. If this momentum persists and global urbanization reaches 52 per cent in 2020, the proportion of the urban poor as a percentage of the total urban population will rise to 40 per cent.
The increase in the proportion of the poor in urban areas will exacerbate the cost of development. Urban slums are often cut off from urban planning programmes, receive little productive public investment, and suffer from a lack of income-generating opportunities. Residents in informal settlements also face a high degree of uncertainty, since their rights to remain in their homes are often poorly defined. As a result, migrants are particularly prone to become victims of urban pauperization. To avoid

33
this outcome would require that greater policy concern and attention be directed at the living and employment conditions of rural migrants.
Re-estimating urban poverty
Several studies show that urban poverty will increase if migrants are included in calculations as migrants are often excluded from affordable public housing, health services and schooling for children. However, results from a new China Urban Labour Survey (CULS) jointly conducted by the Institute of Population and Labour Economics of the Chinese Academy of Social Sciences, and the World Bank in 2004 and 2005, do not fully support this conclusion.
As shown in Table 9, we chose different poverty criteria to measure the poverty of urban residents and rural migrants. The diagnostic Dibao (Minimum Living Standard Scheme) poverty line is 1,982 yuan, the low-income poverty line is 1,112 yuan, the one-dollar-per-day poverty line is 1,124 yuan, and the two-dollars-per-day poverty line is 2,247 yuan. Thus, the estimates between the diagnostic Dibao poverty line and the two-dollars-per-day poverty line, and between the low-income poverty line and the
TABLE 9RE-ESTIMATION OF URBAN POVERTY
Source: 2005 China Urban Labor Survey in 5 large cities including Shanghai, Wuhan, Shengyang, Fujian, and Xian, and 5 smaller cities in surrounding areas.
Poverty LineCity Dibao Line Low Income Line One-Dollar-A-Day Two-Dollars-A-DayPoverty Incidence of Urban Residents5 Large Cities 3.5 1.4 1.4 4.1
5 Small Cities 7.0 3.1 3.1 8.4
Total 5.3 2.2 2.3 6.3
Poverty Incidence of Rural Migrants5 Large Cities 3.7 2.3 2.3 4.0
5 Small Cities 7.1 3.9 3.9 8.2
Total 5.4 3.1 3.1 6.2
Poverty Incidence of Urban Residents and Rural Migrants5 Large Cities 3.5 1.8 1.8 4.0
5 Small Cities 7.1 3.4 3.4 8.3
Total 5.4 2.6 2.6 6.3

34
one-dollar-poverty line are close. The estimates of migrantsÊ poverty incidence from low-income poverty and one-dollar-per-day poverty lines are close to 1.4 percentage points above those of urban residents, but figures from the Dibao poverty line and the two-dollars-a-day poverty line for urban residents and rural migrants are almost equal. If we include rural migrants in the measurement of urban poverty, the urban poverty incidence is only slightly increased by a 0.1 percentage point.
Higher human capital, higher mobility and lower unemployment rates explain the relatively low poverty of migrants in cities. Migration is a process of natural selection. Under the restrictions of the hukou system, only migrants with better human capital are able to penetrate the urban „invisible wall‰. A number of studies show that rural migrant workers are primarily young individuals with, on average, one school year more than those who choose not to migrate, and equivalent to that of urban residents. If migrants cannot find a job in one city, they can try their luck in another one. If they fail in urban areas, they can return to farming. Their higher mobility also ensures them a low unemployment rate. According to the statistics of the fifth population census in 2000, the unemployment rate of migrants was 3.6 per cent, compared to 9.1 per cent for urban residents. The China Urban Labour Survey also confirms the 2005 unemployment rate among migrants at 2.7 per cent, against 8.6 per cent for urban residents.
Labour market discrimination and social exclusion
Although as yet rural to urban migration in China has not had much of a negative impact on urban poverty, the hukou system remains a fundamental barrier to migration due to the incomplete nature of the reform (Roberts, 2000). Evidence illustrates that rural migrants lack the necessary social protection and have low social security coverage and limited access to urban public services (Cai and Wang, 2005). Many rural migrants work in harsh conditions all the year round only to find that they cannot get paid. For work units employing migrant workers in 2001, the default ratio was 12.02 per cent, considerably above the 8.59 per cent for those employing only urban residents. According to the China Urban Labour Survey, in all work units with migrant workers, less than 10 per cent of migrant workers are provided with old-age social security, while more than 70 per cent of their urban counterparts enjoy this security; less than 10 per cent of migrant workers are covered by medical insurance against more than 65 per cent of urban resident workers. Migrant workers have hardly any chance of receiving formal education after entering the city, and they have to pay higher tuition fees for their childrenÊs education. The difference in tuition for students with and without local hukou was around 30 per cent in 2005.

35
CONCLUSIONS
China has achieved remarkable progress in poverty alleviation since the start of the reforms in 1978 by targeting regional development strategies and broad social participation in economic growth. Rapid agricultural growth in the initial reform stage reduced the incidence of rural poor by half; but, since the mid-1980s it slowed down, leading to the deceleration of rural poverty reduction when income inequality started to widen. With the growing regional concentration of rural poverty, migration has played an increasingly important role in rural income growth and poverty reduction. Labour market policy reforms have gradually created a friendly institutional environment to encourage and support rural-urban migration that is becoming more responsive to income inequalities. Valuable experience has been gained to promote economic development through the abolition of institutional barriers and the correction of economic structural distortions. Migration can be viewed as a tool to accelerate the transformation of economic structures. The linkage between rural and urban areas will be strengthened through the contribution of remittances to the rural poor, the contribution of cheap rural labour to urban economic growth, and the narrowing of rural-urban disparities through the reallocation of factors of production. Although remittances accounted for 18 per cent of rural income and reduced rural poverty by nearly 20 percentage points, it remains difficult for extremely poor households with low endowments to take advantage of labour markets and to benefit from rapid economic growth. The declining employment elasticity is related to the slowdown in the rate of rural poverty reduction and the increase in urban poverty. Therefore, the coordination of economic growth and employment is important to reduce both rural and urban poverty.
At present, massive migration does not significantly worsen the urban poverty incidence, but labour market discrimination and social exclusion have increased the risks and vulnerabilities of rural migrants. In order to avoid poverty urbanization, abolishing various remnants of the hukou system and employment policy constraints on labour mobility, and establishing a portable social security system for migrants are key to enabling them to grasp the opportunities from rapid economic growth without falling into poverty.
The increasing marginalization of rural poverty has alerted policymakers to place greater emphasis on the establishment of a rural social security system. The minimum standard of living scheme (Dibao) and the new rural cooperative medical scheme should be a priority policy since so many marginalized people are extremely poor, and illness is a key cause of their poverty. A pension system is almost non-existent in rural

36
China. The gradual creation of a pension system in rural areas is extremely important to reduce the poverty incidence of the rural elderly. Moreover, the developmental approach of strengthening the capacity for assets accumulation, human capital investment as well as the provision of public services should be pursued to enhance the capability of extremely poor households and lift them out of chronic poverty.

37
REFERENCES
Asian Development Bank (ADB) 2004 “The suggestions to set up Dibao in rural area”, Internal Report, Cai,
Fang and Dewen Wang. 2003 “Migration as marketization: what can we learn from China’s 2000
census data?”, The China Review 3(2): 73-93.Cai, Fang, and Dewen Wang 2005 Impacts of domestic migration on economic growth and urban
development in China. Paper presented at the Conference “Migration and Development Within and Across Borders: Concepts, Methods and Policy Considerations in International and Internal Migration”, International Organization for Migration (IOM), New York, 17-19 November.
Cai, Fang, and Yang Du 2005 “Changing natures of rural poverty and new policy orientations”,
Institute of Population and Labour Economics, Chinese Academy of Social Sciences, Working paper.
Chan, Kam Wing, and Li Zhang 1999 “The hukou system and rural-urban migration in China: Processes and
changes”, China Quarterly 160, December, pp. 818-55.Chen, Shaohua, and Yan Wang 2001 China’s Growth and Poverty Reduction: Recent Trends Between 1990
and 1999, World Bank.Chen, Xiaohua, and Hongyu Zhang (eds.), 2005 Building an Equal Employment System for Rural Labourers, China
Financial and Economic Press, Beijing. Huang, Jikun, Scott Rozelle, and Qi Zhang 2005 “Macroeconomic policies, trade liberalization and poverty in China”, in
Guoliang Wang (ed.) A Policy Study on the Poverty Reduction Program of PRC: Trends and Challenges, Social Sciences Academic Press, Beijing.
Hussain, A. 2003 Urban Poverty in China: Measurement, Patterns and Policies,
International Labour Offi ce, Geneva, January.Jalan, J., and M. Ravallion 1998 “Transient poverty in post-reform rural China”, Journal of Comparative
Economics 26, 338-357.

38
Khan, A.R. 2000 A comparative analysis of selected Asian countries, UNDP, from
www.undp.org/poverty/publications /case/macro/asia.doc. 1998 “Poverty in China in the period of globalization: New evidence on
trends and patterns”, Issues in Development Discussion Paper No. 22, Development Policies Department, International Labour Offi ce, Geneva.
Li, Shi 2001 The increasing urban poverty at the end of the 1990s and its reason,
http://www.cass.net.cn/jingjisuo/yjlw/01.asp?id=194.Li, Shi, and Ximing Yue 2004 “A survey on China’s rural urban disparity”, Finance, No. 4.Lin, Justin, Gewei Wang, and Yaohui Zhao 2004 “Regional inequality and labour transfers in China”, Economic
Development and Cultural Change, 52(3): 587-603.Lin, Justin, and Yongjun Li 2005 “China’s poverty reduction policy: trends and challenges”, in Guoliang
Wang, ed., A Policy Study on the Poverty Reduction Program of PRC: Trends and Challenges, Social Sciences Academic Press, Beijing.
Ministry of Agriculture 2003 China Township Enterprises Yearbook, China Agricultural Press,
Beijing.National Bureau of Statistics (NBS), China Statistical Yearbook 2006 China Yearbook of Rural Household Survey, China Statistics Press,
Beijing.Ravallion, M. 2001 “On the urbanization of poverty”, Working Paper, Development
Research Group, World Bank.Ravallion, M., and Shaohua Chen 2004 “China’s (uneven) progress against poverty”, Policy Research Paper
3408, Development Research Group, Washington, D.C.Roberts, K. 2000 “Chinese labour migration: Insights from Mexican undocumented
migration to the United States”, in West, L. and Yaohui Zhao (eds.) Rural Labour Flows in China, Institute of East Asian Studies, University of California, Berkeley.
Rodgers R.J., and J.L.Rodgers 1993 “Chronic poverty in the United States”, Journal of Human Resources,
28(1): 25-54.

39
Rural Survey Department of National Bureau of Statistics 2002, 2005 Poverty Monitoring Report of Rural China, China Statistics Press,
Beijing.Sen, A. 1992 Inequality Re-examined, Oxford: Clarendon Press, New York: Russell
Sage Foundation, and Cambridge. MA: Harvard University Press.Solinger, D.J. 1999 “Citizenship issues in China’s internal migration: Comparisons with
Germany and Japan”, Political Science Quarterly, 114(3): 455-78.United Nations Human Settlements Programme 2003 The Challenge of Slums: Global Report on Human Settlements,
London: Earthscan Publications and UN-Habitat.Wang, Dewen, Yaowu Wu, and Fang Cai 2004 “Migration, unemployment and urban labour market segregation during
China’s economic transition”, The World Economy, No. 4.Wang Dewen, Fang Cai, and Wenshu Gao 2005 “Globalization and internal migration in China: New trends and policy
implications”, Paper presented at the Monash University Conference.World Bank 2006 World Development Report 2006: Equity and Development,
Washington, D.C. 2001 China: Overcoming Rural Poverty, Washington, D.C. 1992 China: Strategies for Reducing Poverty in the 1990s, Washington, D.C.Zhao, Yaohui 2002 “Causes and consequences of return migration: recent evidence from
China”, Journal of Comparative Economics 30, pp. 376-394.


The opinions expressed in the report are those of the author and do not necessarily reflect the views of the International Organization for Migration. The designations employed and the presentation of material throughout the report do not imply the expression of any opinion whatsoever on the part of IOM concerning the legal status of any country, territory, city or area, or of its authorities, or concerning its frontiers or boundaries. _______________
IOM is committed to the principle that humane and orderly migration benefits migrants and society. As an intergovernmental body, IOM acts with its partners in the international community to: assist in meeting the operational challenges of migration; advance understanding of migration issues; encourage social and economic development through migration; and uphold the human dignity and well-being of migrants._______________
Publisher: International Organization for Migration 17 route des Morillons 1211 Geneva 19 Switzerland Tel: +41.22.717 91 11 Fax: +41.22.798 61 50 E-mail: [email protected] Internet: http://www.iom.int
Editor: Ilse Pinto-Dobernig_______________
ISSN 1607-338X© 2007 International Organization for Migration (IOM)_______________
All rights reserved. No part of this publication may be reproduced, stored in a retrieval system, or transmitted in any form or by any means, electronic, mechanical, photocopying, recording, or otherwise without the prior written permission of the publisher.
12_07
IOM Migration Research Series (MRS)
Editor: Frank Laczko Chief, Research and Publications Division International Organization for Migration 17 route des Morillons C.P. 71 CH-1211 Geneva 19 Switzerland Tel: +41.22.717 91 11 E-mail: [email protected]
Titles in the series are available from:
International Organization for Migration, Research and Publications Unit17 route des Morillons, CH-1211 Geneva 19 Switzerland, Tel: +41.22.717 91 11;
Fax: +41.22.798 61 50, E-mail: [email protected]. The MRS order form is found on the IOM website: http:/www.iom.int
Single issue: US$ 16-25 + US$ 2 postage
Payment must accompany orders and can be made by international bank draft or money order in US dollars payable to International Organization for Migration, Geneva.
mrs27cover.indd 2mrs27cover.indd 2 2/19/2007 4:21:38 PM2/19/2007 4:21:38 PM

China has achieved remarkable progress in poverty alleviation since the start of the reforms. Calculated according to the offi cial poverty line, rural poverty has dropped dramatically from 30.7 per cent in 1978 to 2.6 per cent in 2005. Rural-urban labour migration on an unprecedented scale played a vital role in rural income growth, poverty reduction and economic development in sending places, as numerous rural labourers responded to the rising income inequality by migrating to the cities. Empirical evidence shows that while the vast rural to urban migration does not signifi cantly increase urban income poverty, labour market discrimination and social exclusion expose rural migrants to many risks and vulnerabilities in the cities, where the poor are becoming increasingly marginalized. Capacity building for the poor, the adoption of an integrated labour market system that also takes account of migrants, and the creation a of rural social security system are the three important poverty alleviation options promoted by the government. Although migration in China has unique institutional characteristics owing to the existence of hukou system (Household Registration System), the experiences and lessons to be drawn from consider-ing migration as a development approach have important implications for the shaping of appropriate developmental policies.
IOM • OIM
Migration and Poverty Alleviation in China
No. 27
ISSN 1607-338X
Also available online at:http://www.iom.int
mrs27cover.indd 1mrs27cover.indd 1 2/19/2007 4:21:12 PM2/19/2007 4:21:12 PM