mid-water trawl design for the survey … trawl design for the survey vessel mfv sagarika ......
TRANSCRIPT
P.O. Box 1390, Skulagata 4
120 Reykjavik, Iceland Final Project, 2008
MID-WATER TRAWL DESIGN FOR THE SURVEY VESSEL MFV
SAGARIKA
Mahadev R. Kokane
Fishery Survey of India
Department of Animal Husbandry Dairying and Fisheries
Ministry of Agriculture, Government of India
Supervisor
Mr. Einar Hreinsson
Marine Research Institute
Iceland
ABSTRACT
In this assignment a four panel prototype mid-water trawl was designed for the Fishery
Survey of India, in particular the survey vessel MFV Sagarika for experimental mid-water
trawling along the central west coast of India. The aim was to investigate the potential for
pelagic fishing in the area and to promote the use of mid-water trawls as a substitute for
bottom trawls. The design is based on basic formulas and calculations for the design of
fishing gears and specific scientific reports on modelling and full scale tests of mid-water
trawls. The design is also based on available knowledge on the behaviour and morphology of
the targeted species. The resulting net plan is presented as conventional 2D blueprint and 3D
model, visualising three optional hanging ratios (0.5, 0.3 and 0.2) and rigging.

Konkane
UNU-Fisheries Training Programme 2
TABLE OF CONTENTS
1 INTRODUCTION .............................................................................................................. 6
2 LITERATURE REVIEW ................................................................................................... 8
2.1 Pelagic fishery ............................................................................................................. 8
2.2 Fish behaviour ............................................................................................................. 9
2.2.1 Mackerel (Rastrelliger kangurta) ......................................................................... 9
2.2.2 Oil sardine (Sardinella longiceps, Valenciennes, 1847) .................................... 10
2.2.3 Ribbon fish .......................................................................................................... 10
2.2.4 Carangid ............................................................................................................. 11
2.2.5 Anchovies ........................................................................................................... 11
2.3 The mid-water trawl .................................................................................................. 11
2.4 Otter board ................................................................................................................. 12
2.5 The importance of acoustics in mid-water trawling .................................................. 13
2.5.1 Echosounder ....................................................................................................... 13
2.5.2 Sonar .................................................................................................................. 14
2.5.3 The trawl sonde and gear sensors ...................................................................... 14
2.6 The importance of trawl design ................................................................................. 14
3 MATERIAL AND METHODS ........................................................................................ 15
3.1 The vessel: MFV Sagarika ........................................................................................ 15
3.2 Towing speed ............................................................................................................. 16
3.3 Prototype design ........................................................................................................ 16
3.4 Calculations ............................................................................................................... 17
3.4.1 The towing force of a trawler ............................................................................. 17
3.4.2 Mesh size selectivity and its calculations ........................................................... 17
3.4.3 Calculation of twine surface area ...................................................................... 18
3.4.4 Estimation of netting weight ............................................................................... 19
3.4.5 Calculation of the opening of the net: ................................................................ 19
3.4.6 Hanging ratio ..................................................................................................... 20
3.4.7 Calculation of netting drag ................................................................................ 20
3.4.8 Drag and weight of otter boards ........................................................................ 22
3.4.9 Calculation of total trawl resistance .................................................................. 23
4 RESULTS ......................................................................................................................... 24
4.1 Towing pull ................................................................................................................ 24
4.2 Estimation of net drag coefficient (Cx) ...................................................................... 24
4.3 Twine surface area ..................................................................................................... 25
4.4 Netting drag ............................................................................................................... 25
4.5 Trawl mouth opening ................................................................................................. 27

Konkane
UNU-Fisheries Training Programme 3
4.6 Netting weight ........................................................................................................... 28
4.7 Resistance of the gear ................................................................................................ 28
4.8 Prototype design ........................................................................................................ 29
4.8.1 General specifications ........................................................................................ 29
4.8.2 Advantages of the prototype design ................................................................... 30
4.8.3 Drawing .............................................................................................................. 31
5 DISCUSSION ................................................................................................................... 37
6 CONCLUSION ................................................................................................................. 38
LIST OF REFRENCES ............................................................................................................ 40
LIST OF FIGURES
Figure 1: Marine fish production assemblage in India (2005) (Source: Anon 2008c) .............. 8 Figure 2: Major pelagic fish distribution in the Indian EEZ (Source: Anon 2008e).................. 9
Figure 3: Indian mackerel (Rastrelliger kanagurta) (Source: Fishbase 2008)............................ 9 Figure 4 : Oil sardine (Sardinella longiceps) (Source: Fishbase 2008) .................................... 10 Figure 5: Ribbon fish (Source: Fishbase 2008) ........................................................................ 10
Figure 6: Indian scad (Decapterus russelli) (Source: Fishbase 2008) ...................................... 11 Figure 7: Horse mackerel (Megalaspis cordyla) (Source: Fishbase 2008) .............................. 11
Figure 8: Stolephorus spp. (Source: Fishbase 2008) ................................................................ 11 Figure 9: Mid-water trawl (Source: FAO 2008) ...................................................................... 12 Figure 10: Pelagic trawl equipped with acoustic equipments such as echosounder, sonar, trawl
sonar and sensors (Source: Misund 1997) ................................................................................ 13
Figure 11: The vessel MFV Sagarika (Source: FSI) ................................................................ 15 Figure 12 : Angle of incidence of a cone shape body .............................................................. 21 Figure 13: Comparison of netting drag against vessel pull with three formulas. Fridman
(1986) (E1: 0.5, E1: 0.3 and E1:0.2 hanging ratio), Reid (1977) and MacLennan (1981) ...... 26 Figure 14: Vertical trawl mouth opening at different hanging ratios as a function of speed ... 27
Figure 15: Total netting drag compared to vessel pull at different towing speeds .................. 29 Figure 16: Prototype mid-water trawl design for the survey vessel MFV Sagarika ................ 32 Figure 17: 3D view (top view) of prototype mid-water trawl at different hanging ratios A: 0.5,
B: 0.3 and C: 0.2 ....................................................................................................................... 33 Figure 18: 3D view (front view) of prototype mid-water trawl at different hanging ratio A:
0.5, B: 0.3 and C: 0.2 ................................................................................................................ 33
Figure 19: 3D view (isometric view) of prototype mid-water trawl at different hanging ratios
A: 0.5, B: 0.3 and C: 0.2 ........................................................................................................... 34 Figure 20: Towing position net view (side view) with combination of otter board (3x1 m),
sweep line (75 m) and warp (300 m) at different hanging ratios A: 0.5, B: 0.3 and C: 0.2 at the
depth of 100 m .......................................................................................................................... 34 Figure 21: Towing position net view (top view) with combination of otter board (3x1 m),
sweep line (75 m) and warp (300 m) at different hanging ratios A: 0.5, B: 0.3 and C: 0.2 at the
depth of 100 m .......................................................................................................................... 35 Figure 22: Towing position net view (front view) with combination of otter board (3x1 m),
sweep line (75 m) and warp (300 m) at different hanging ratios A: 0.5, B: 0.3 and C: 0.2 at the
depth of 100 m .......................................................................................................................... 36
Konkane
UNU-Fisheries Training Programme 4
Figure 23: Towing position net view (isometric view) with a combination of otter board (3x1
m), sweep line (75 m) and warp (300 m) at different hanging ratios, depth 100 m ................. 36
LIST OF TABLES
Table 1: Calculated towing pull of the vessel (formula 3.1) .................................................... 24 Table 2: Cx value at different hanging ratios (formula 4.4 for angle of incidence = α) .......... 25 Table 3: Twine surface area of the prototype design (formulas 3.4 and 3.5) ........................... 25
Table 4: Calculation of netting drag/resistance using three different formulas ....................... 26 Table 5: Calculation of vertical mouth opening (Koyama et al. 1981) based on the belly
circumference at different hanging ratios and towing speeds (formula 3.7). ........................... 27 Table 6: Calculation of netting weight (K = knot correction factor page no. 35 and Rtex value
= page no.14 of Fisherman’s workbook) (formula 3.6) ........................................................... 28 Table 7: Drag offered by different gear components at different speeds ................................. 28 Table 8: Data sheet: prototype mid-water trawl ....................................................................... 30
Table 9: Prototype net drawing specification ........................................................................... 31

Konkane
UNU-Fisheries Training Programme 5
LIST OF ABBREVIATIONS
2D: Two dimensions
3D: three dimensions
CMFRI: Central Marine Fisheries Research Institute
EEZ: Exclusive Economic Zone
FAO: Food and Agricultural Organisation
Fig.: Figure
FSI: Fishery Survey of India
GPS: Global Positioning System
MFV: Marine Fishing Vessel
Sonar: Sound Navigation and Ranging
VHF: Very High Frequency
LIST OF UNIT ABBREVIATIONS
BHP: brake horsepower
kg: kilogram
kgf: kilogram-force
knot: nautical mile
m: meter
mm: millimetre
m/s: meter per second
ps: Pferde starke
LIST OF FIGURE SYMBOLS
#: number of meshes
Φ: diameter

Konkane
UNU-Fisheries Training Programme 6
1 INTRODUCTION
Fishing is an ancient practice in many countries. Fishing has undergone radical changes, from
the traditional to the highly mechanised. After the introduction of motors, many European
countries made evolutionary changes in vessel size, horse power, net design, etc. The
invention of electronics for fish detection and net design was another breakthrough for the
fishing industry.
India is one of the largest countries in the world, with a combined coastline of 8041 km in
length, and an EEZ of 2.02 million km2. The Indian fishing industry was traditionally based
on indigenous crafts and gears; mechanisation in India started in the middle and late 1950s.
Trawling was first introduced in India under an Indo- Norwegian project in the year 1954.
The catches during that phase increased drastically. Further, it has been observed that the
increase in marine landings over the last half decade is only marginal which, to a certain
extent, might be due to intense fishing efforts in a limited narrow coastal area (Vivekanandan
et al., 2003). However, the catches from the inshore waters (<50m) reached the catchable
potential during 1995-2000 (Vivekanandan et al., 2003). India still has some unused potential
to exploit further the offshore fishing resources (>50m), while the majority of trawlers are
currently operated in the inshore waters. When we consider the fact that marine organisms
such as eels, cat fish, sciaenids, pomfret, Indian mackerel and cephalopods have already been
over exploited in coastal waters (Vivekanandan et al., 2003).
Mechanised fishing vessels include stern and out rigger trawlers, gillnetters, purse-seiners,
long liners and dol netters (dol nets are set bag nets, held stationary against the current,
mainly used for the Bombay duck) (Flewwelling and Hosch 2006). Trawling is one of the
most important methods of commercial fishing constituting about 50% of the total marine
landings of India (Morgan 2004). The mechanised fishing is almost confined to shrimp
trawling along the narrow coastal waters (Vivekanandan et al., 2003).
Maximum Sustainable Yield in the Exclusive Economic Zone of India is estimated as 3.92
million tonnes per year out of which about 16% is in the offshore region. The present
exploitation is about 3.02 million tonnes (Anon 2008a). The marine fish resources from the
inshore waters have reached the maximum level and the effort now should be towards
conservation and management of these resources (Somvanshi 2001). To reduce
overexploitation, it has been realised that there should be no increase in effort in the shallow
waters. However, diversification of fishing activities and mechanisation of indigenous crafts
has been suggested to improve the present yield. The Indian government is emphasising the
introduction of resource specific vessels (> 20m) to explore the possibilities of deep sea and
oceanic resources (Anon 2008b).
The landing pattern of west coast of India for the years 1970-1998 shows that the average
annual landings of pelagic fish contribute 59% to the total landings. The dominant groups
(and species) in the pelagic landings are oil sardine (Sardinella longiceps), Indian mackerel
(Rastrelliger kanagurta), Carangids (Caranx spp. and Decapterus russelli), whitebaits
(Stolephorus spp.) lesser sardines (Sardinella spp.), seerfishes (Scomberomorus commerson
and S. Guttatus), sharks (Scoliodon laticaudus and Carcharhinus spp.), barracudas (Sphyraena
spp.) and tunas (Euthynnus affinis and Auxis thazard). The remaining 41% is made up of
demersal fishes, shrimp, crustaceans and cephalopods (Vivekanandan et al., 2003). The catch
analysis of 2005 indicated that pelagic fish contribution to the total catch was 55% (Anon
2008c). These resources are caught by purse seines, drift gillnets, ring-seines, and hooks and

Konkane
UNU-Fisheries Training Programme 7
lines mainly but considerable catches have also been reported in the bottom trawl. The survey
conducted by M.F.V. Samudrika in the years 1994-96 using bottom trawl reported a
considerable quantity of pelagic species in the catches (Srinath et al., 2003)
Bottom trawl fishing has both a direct and indirect impact on the marine ecosystem as well as
on biodiversity. As a mobile non selective fishing gear (some extend), the bottom trawl net
collects every organism in its path and incidental capture of non-target species by-catch has
become a major concern related to bottom trawling (Biju and Deepthi 2006). This method of
fishing collects and kills huge amounts of non-targeted species and the young ones of the
commercially valuable species. It also mechanically disturbs the sea bottom and injures a
wide variety of marine benthic creatures (Knieb 1991). To overcome these problems there is a
need to reduce the pressure on demersal resources by diversifying to resource specific trawls
i.e. mid-water trawls.
In this project a prototype mid-water trawl was designed according to the specifications of
MFV Sagarika for the purpose of carrying out experimental mid-water trawling trials along
the central west coast of India. Currently the Fisheries Survey of India is working towards
assessment of the fish resources and charting of fishing grounds in the Indian EEZ. Further,
the Fishery Survey of India is planning to purchase two mid-water trawlers to carry out the
pelagic resources surveys along the Indian coast. This proto-type design is part of developing
the required fishing gear to be used in this assignment of assessing fish resources as the Indian
waters have both demersal and pelagic marine resources.
For the development of a prototype mid-water trawl design, great concern has to be given to
the reduction of by-catch, oil economy and sustainable utilisation of the resources. By-catch
studies, conducted by FAO (Alverson and Freeberg 1996), have revealed that as much as 2.23
million tonnes annually of edible marine fish are thrown away in the Indian Ocean (East
Indian Ocean and West Indian Ocean). The main component of by-catch is low quality fish
and juveniles of commercially valuable fish species. Since the by-catch component carries a
major portion of juveniles of valuable fish resources, it is of even greater importance to
reduce the by-catch to a minimum level. Profitability of trawling to a great extent depends
upon fuel price. For towed gears, oil consumption is directly proportional to the resistance of
the fishing gear. It is advisable for the fishing industry to go for low resistance gears. The
resistance of the gear is influenced by netting area, towing speed of the vessel, warp and otter
board, etc. (Buckingham 1972). Large mesh sizes of net and thin twine diameter reduce the
drag of the net with a specific horse power (Prado 1977, Fujishi 1985).
Keeping all these factors in mind, a prototype experimental mid-water trawl net has been
designed. It will help to catch the pelagic resources efficiently without damaging demersal
biota of the marine ecosystem.
Goal and objectives of the project:
The aim of the project is to develop a suitable mid-water trawl net design for the departmental
vessel MFV Sagarika with the following objectives:
i) To study the rigging and operations of pelagic trawls.
ii) To study the acoustic equipment needed for pelagic trawling.
iii) To design a prototype of a pelagic trawl for the survey vessel MFV Sagarika.
iv) To draw the prototype design in 2D and 3D using the Design Cad 3D Max 19 2008
software
Konkane
UNU-Fisheries Training Programme 8
2 LITERATURE REVIEW
2.1 Pelagic fishery
The Icelandic fisheries information on the pelagic fishery indicates that pelagic fish stocks in
Iceland are highly abundant and move in large shoals. Their migration routes are highly
extensive. The catches of oceanic redfish began in Iceland in 1989, blue whiting in 1997 and
mackerel in 2006 (Anon 2008d). In the world’s total catch of marine species, the top 10 of the
fish species caught are pelagic fish and the pelagic fishery itself contributes more than 50% to
the total world’s marine fish landings (FAO 2006). The world’s most abundant pelagic
fisheries are herring, pilchard and Peruvian anchovies (FAO 2006). Most of the pelagic
fisheries are seasonal and exclusively harvested by vessels operating purse seines, pelagic
trawls and driftnets. A large portion of the pelagic species are utilised for fish meal and oil
production. However, an increasing share is used for human consumption (Anon 2008d).
The Indian fishery is an open access multi species fishery system. Currently and nationwide
the pelagic fishery is able to sustain a
significantly increased production
(Vivekananda 2002). The status of inshore
resources is portrayed as fully exploited, or
overexploited, with possible room for
expansion offshore (Flewwelling and Hosch
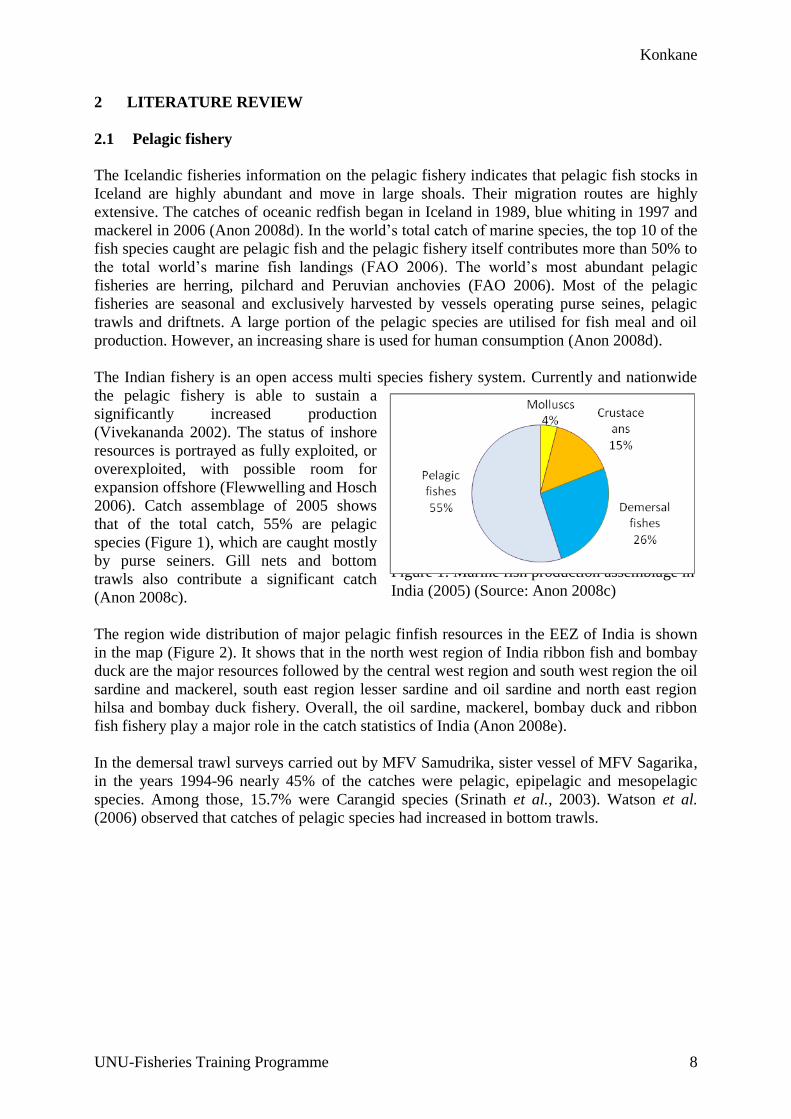
2006). Catch assemblage of 2005 shows
that of the total catch, 55% are pelagic
species (Figure 1), which are caught mostly
by purse seiners. Gill nets and bottom
trawls also contribute a significant catch
(Anon 2008c).
The region wide distribution of major pelagic finfish resources in the EEZ of India is shown
in the map (Figure 2). It shows that in the north west region of India ribbon fish and bombay
duck are the major resources followed by the central west region and south west region the oil
sardine and mackerel, south east region lesser sardine and oil sardine and north east region
hilsa and bombay duck fishery. Overall, the oil sardine, mackerel, bombay duck and ribbon
fish fishery play a major role in the catch statistics of India (Anon 2008e).
In the demersal trawl surveys carried out by MFV Samudrika, sister vessel of MFV Sagarika,
in the years 1994-96 nearly 45% of the catches were pelagic, epipelagic and mesopelagic
species. Among those, 15.7% were Carangid species (Srinath et al., 2003). Watson et al.
(2006) observed that catches of pelagic species had increased in bottom trawls.
Figure 1: Marine fish production assemblage in
India (2005) (Source: Anon 2008c)

Konkane
UNU-Fisheries Training Programme 9
Figure 2: Major pelagic fish distribution in the Indian EEZ (Source: Anon 2008e)
2.2 Fish behaviour
Mid-water trawling is carried out for specific pelagic resources, e.g. mackerel, sardine etc.,
and before designing the net, the designer needs to have adequate knowledge of the shape,
size and general information of the target fish species. The targeted fish species in this study
are pelagic, epipelagic, and mesopelagic in nature. Some of the commercially important mid-
water species and their behaviour patterns in the Indian water are as follows.
2.2.1 Mackerel (Rastrelliger kangurta)
The mackerel is a pelagic shoaling
scombroid fish (Figure 3), widely distributed
in the Indo Pacific region. But it is only at
the Indian coast, that these species are
highly exploited. Distribution in the inshore
waters is limited to waters of 25 m depth,
but the Fishery Survey of India vessels are
catching these species in waters of up to 60
m depth. The mackerel of different size
groups move in separate shoals. They move
in semicircular or arrow head formations and
their speed is about 8-10 miles per hour. They scatter, when pursued by seer fish, but when
the shoals are chased by sharks or porpoises, the mackerel submerge with the head
downwards into a compact mass. When the mackerel dive, a patch of muddy water is seen at
the surface which is due to churning of water by a large mass of fish. The luminescence
caused by mackerel shoals passing through a patch of phosphorescent phytoplankton
(noctiluca) are noticed in many areas. The fish is a plankton feeder, feeding to a great extent
on zooplankton and to a lesser extent on the phytoplankton. The average size in catches
observed is 18-24 cm. Mackerel is caught mainly by purse seines, ring seines and gill nets but
considerable catches are recorded in trawl according to Anon (2008f).
Figure 3: Indian mackerel (Rastrelliger
kanagurta) (Source: Fishbase 2008)

Konkane
UNU-Fisheries Training Programme 10
2.2.2 Oil sardine (Sardinella longiceps, Valenciennes, 1847)
The oil sardine is a neretic-pelagic clupeoid
fish (Figure 4), which occurs on both the
west and east coasts of India. It is a shoaling
species of the west coast of India
particularly. During the July-August period,
juveniles appear along the coast and by
September-December, they form a large
proportion of the catch. The shoals are
capable of moving at a speed of 3-5 km/h.
The shoals extend from a minimum of 1 m2
to 500 m2. The depth of the shoal normally is 0.5-8 m. When the shoal moves flipping,
pattering, rippling and leaping actions can be seen. The appearance of most of the shoals is
bluish, pinkish and luminescent in shades. The oil sardine is mainly caught by purse seines,
shore seines and gillnets. The average size range of the catch is 15-17 cm.
A study of commercial catches since 1925 revealed that there seems to be an inverse
relationship of the occurrence of oil sardines to that of mackerels, i.e. in a season when the oil
sardine fishery is good, then the mackerel fishery is a failure and vice versa. The reasons for
this occurrence are still obscure according to Anon (2008f).
2.2.3 Ribbon fish
The ribbon fish or hair tails (Figure 5) are of
the family Trichiuridae and are represented
in the Indian waters by Trichiurus lepturus
(Linn) Lepturacanthus savala (Cuv),
Eupleurogrammus intermedius (Grey), E.
muticus (Grey). They have a wide range of
distribution throughout the warm seas
mostly confined to depths of 100-500 m at
the continental shelf margin and at the upper part of the slope (Nakamura and Parin 1993).
Trichiurus lepturus has been known to be the most common species occurring in the Indian
Ocean around the Archipelago and in various parts of the Pacific.
In the Indian waters the species composition in the catch differs from place to place. The
commercial catches of these species are usually in the size range of 16-18 cm, but
occasionally fish can measure over one metre in length. The different species of ribbon fish
inhabit different ecological zones but samples of caught fish usually represent all age groups.
The commercial size of E. intermedius is from 14-35 cm. and of L. savala and E. muticus
from 25-75 cm. Each shoal consists of one species only. They are caught in various types of
fishing gears but chiefly in seines and to some extent in gillnets and trawls and sometimes on
longline. In Gujarat and Maharashtra landings are the highest in the fourth quarter (October-
December) and lowest in the third t quarter (July-September). In Kerala, Tamil Nadu and
Andhra, they are highest in third quarter (July-September) and lowest in the first quarter
(January-March). The fish is marketed fresh or in cured condition according to Anon (2008f).
Figure 4 : Oil sardine (Sardinella longiceps)
(Source: Fishbase 2008)
Figure 5: Ribbon fish (Source: Fishbase 2008)

Konkane
UNU-Fisheries Training Programme 11
2.2.4 Carangid
The carangid group is an important resource
in the Indian waters, of which more than 50
species are reported (Panikkar 1949). Among
these major species are Indian scad
(Decapterus russelli) (Figure 6), horse
mackerel and big eye scad. These resources
are pelagic or epipelagic in nature, most of the
species form small shoals but Indian scad is
reported in big shoals of fish in the size range
16-20 cm in length (Jaiswar et al. 2001). Horse
mackerel and big eye scad also appear in large
schools (Panikkar 1949)
2.2.4.1 Horse mackerel
Torpedo scad or horse mackerel (Figure 7) is
broadly distributed throughout the western
Indian Ocean. Elsewhere it is found in the
western Pacific Ocean from Japan to Australia.
Pelagic species occur in inshore waters of the
continental shelf, form schools and feed
mainly on fish. The reported maximum total
length is 80 cm; it commonly attains 30 to 40
cm in total length and 3 to 4 kg in weight. The main gears used are hook and lines, beach
seines, trawls, purse seines and traps according to Anon (2008g).
2.2.5 Anchovies
Anchovies are found in scattered areas
throughout the world's oceans, but are
concentrated in temperate waters and are
rare or absent in very cold or very warm
seas. They can generally accept a wide range
of temperatures and salinity. Large schools
can be found in shallow, brackish areas with
muddy bottoms, as in estuaries and bays
(Anon 2009). In the Indian waters there are
about 45 species known of which Thyrsa and Stolephorus groups (Figure 8) are the most
important. These species are generally dominated in Cape Comorin up to the Gulf of Mannar
(Panikkar 1949).
2.3 The mid-water trawl
During the 1960s, pelagic trawling was developed as a capture technique for shoaling species.
The trawls which are used to catch these resources are a cone-shaped net which is towed in
mid-water. It consists of a cone-shaped body, normally made of four panels, ending in a
codend and the net has lateral wings extending forward from the opening. The horizontal
opening is maintained by otter boards. Floats and/or sailkites on the headline and weights on
Figure 6: Indian scad (Decapterus russelli)
(Source: Fishbase 2008)
Figure 7: Horse mackerel (Megalaspis
cordyla) (Source: Fishbase 2008)
Figure 8: Stolephorus spp. (Source: Fishbase
2008)
Konkane
UNU-Fisheries Training Programme 12
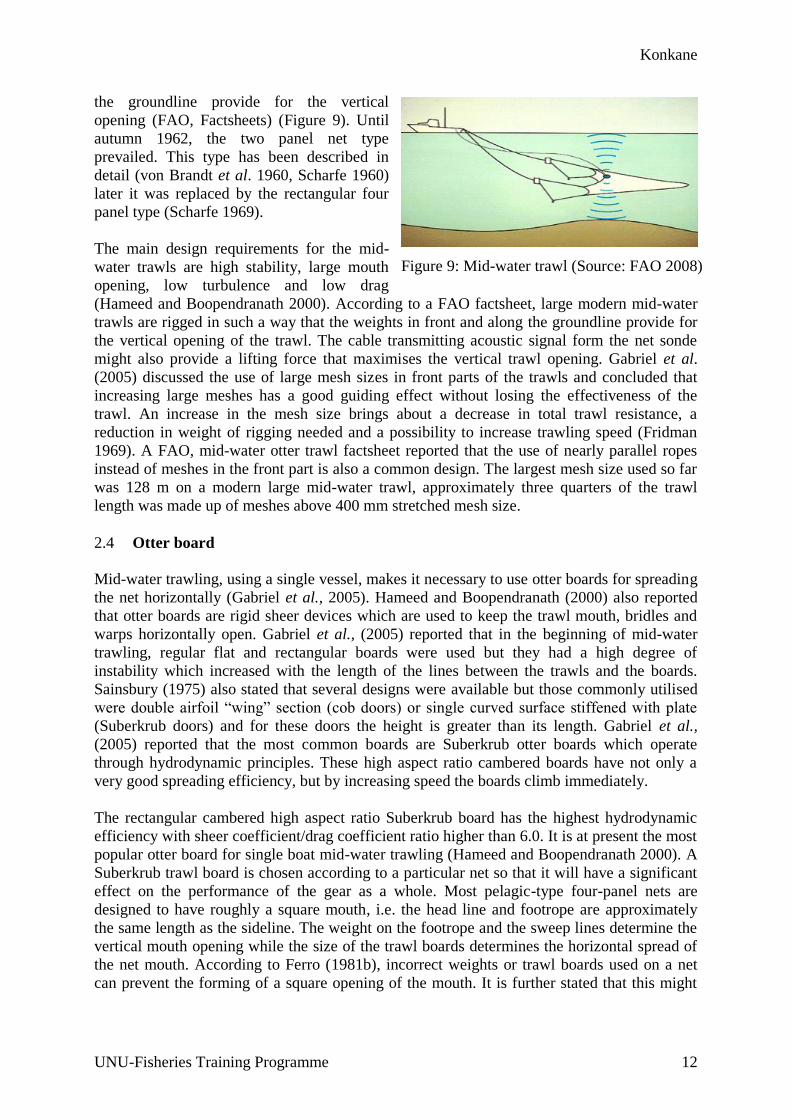
the groundline provide for the vertical
opening (FAO, Factsheets) (Figure 9). Until
autumn 1962, the two panel net type
prevailed. This type has been described in
detail (von Brandt et al. 1960, Scharfe 1960)
later it was replaced by the rectangular four
panel type (Scharfe 1969).
The main design requirements for the mid-
water trawls are high stability, large mouth
opening, low turbulence and low drag
(Hameed and Boopendranath 2000). According to a FAO factsheet, large modern mid-water
trawls are rigged in such a way that the weights in front and along the groundline provide for
the vertical opening of the trawl. The cable transmitting acoustic signal form the net sonde
might also provide a lifting force that maximises the vertical trawl opening. Gabriel et al.
(2005) discussed the use of large mesh sizes in front parts of the trawls and concluded that
increasing large meshes has a good guiding effect without losing the effectiveness of the
trawl. An increase in the mesh size brings about a decrease in total trawl resistance, a
reduction in weight of rigging needed and a possibility to increase trawling speed (Fridman
1969). A FAO, mid-water otter trawl factsheet reported that the use of nearly parallel ropes
instead of meshes in the front part is also a common design. The largest mesh size used so far
was 128 m on a modern large mid-water trawl, approximately three quarters of the trawl
length was made up of meshes above 400 mm stretched mesh size.
2.4 Otter board
Mid-water trawling, using a single vessel, makes it necessary to use otter boards for spreading
the net horizontally (Gabriel et al., 2005). Hameed and Boopendranath (2000) also reported
that otter boards are rigid sheer devices which are used to keep the trawl mouth, bridles and
warps horizontally open. Gabriel et al., (2005) reported that in the beginning of mid-water
trawling, regular flat and rectangular boards were used but they had a high degree of
instability which increased with the length of the lines between the trawls and the boards.
Sainsbury (1975) also stated that several designs were available but those commonly utilised
were double airfoil “wing” section (cob doors) or single curved surface stiffened with plate
(Suberkrub doors) and for these doors the height is greater than its length. Gabriel et al.,
(2005) reported that the most common boards are Suberkrub otter boards which operate
through hydrodynamic principles. These high aspect ratio cambered boards have not only a
very good spreading efficiency, but by increasing speed the boards climb immediately.
The rectangular cambered high aspect ratio Suberkrub board has the highest hydrodynamic
efficiency with sheer coefficient/drag coefficient ratio higher than 6.0. It is at present the most
popular otter board for single boat mid-water trawling (Hameed and Boopendranath 2000). A
Suberkrub trawl board is chosen according to a particular net so that it will have a significant
effect on the performance of the gear as a whole. Most pelagic-type four-panel nets are
designed to have roughly a square mouth, i.e. the head line and footrope are approximately
the same length as the sideline. The weight on the footrope and the sweep lines determine the
vertical mouth opening while the size of the trawl boards determines the horizontal spread of
the net mouth. According to Ferro (1981b), incorrect weights or trawl boards used on a net
can prevent the forming of a square opening of the mouth. It is further stated that this might
Figure 9: Mid-water trawl (Source: FAO 2008)
Konkane
UNU-Fisheries Training Programme 13
cause distortion of the net itself with an area of slack or strained netting and these features can
cause net damage or fish escape.
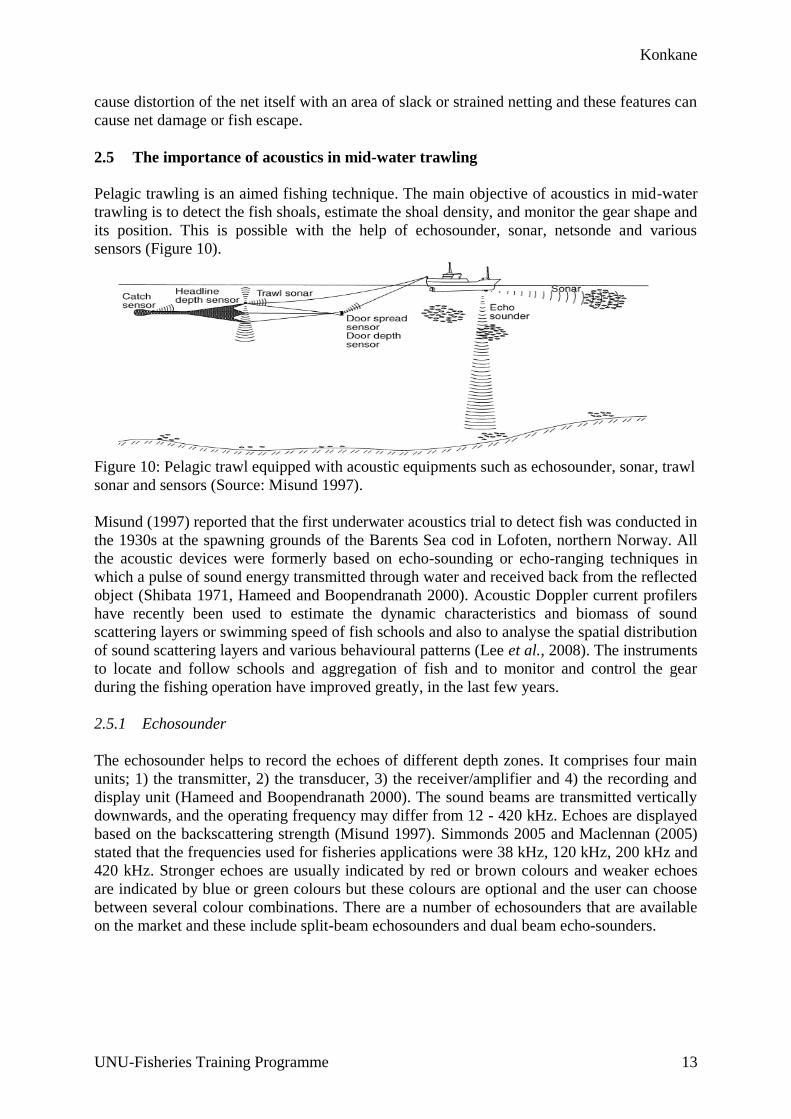
2.5 The importance of acoustics in mid-water trawling
Pelagic trawling is an aimed fishing technique. The main objective of acoustics in mid-water
trawling is to detect the fish shoals, estimate the shoal density, and monitor the gear shape and
its position. This is possible with the help of echosounder, sonar, netsonde and various
sensors (Figure 10).
Figure 10: Pelagic trawl equipped with acoustic equipments such as echosounder, sonar, trawl
sonar and sensors (Source: Misund 1997).
Misund (1997) reported that the first underwater acoustics trial to detect fish was conducted in
the 1930s at the spawning grounds of the Barents Sea cod in Lofoten, northern Norway. All
the acoustic devices were formerly based on echo-sounding or echo-ranging techniques in
which a pulse of sound energy transmitted through water and received back from the reflected
object (Shibata 1971, Hameed and Boopendranath 2000). Acoustic Doppler current profilers
have recently been used to estimate the dynamic characteristics and biomass of sound
scattering layers or swimming speed of fish schools and also to analyse the spatial distribution
of sound scattering layers and various behavioural patterns (Lee et al., 2008). The instruments
to locate and follow schools and aggregation of fish and to monitor and control the gear
during the fishing operation have improved greatly, in the last few years.
2.5.1 Echosounder
The echosounder helps to record the echoes of different depth zones. It comprises four main
units; 1) the transmitter, 2) the transducer, 3) the receiver/amplifier and 4) the recording and
display unit (Hameed and Boopendranath 2000). The sound beams are transmitted vertically
downwards, and the operating frequency may differ from 12 - 420 kHz. Echoes are displayed
based on the backscattering strength (Misund 1997). Simmonds 2005 and Maclennan (2005)
stated that the frequencies used for fisheries applications were 38 kHz, 120 kHz, 200 kHz and
420 kHz. Stronger echoes are usually indicated by red or brown colours and weaker echoes
are indicated by blue or green colours but these colours are optional and the user can choose
between several colour combinations. There are a number of echosounders that are available
on the market and these include split-beam echosounders and dual beam echo-sounders.
Konkane
UNU-Fisheries Training Programme 14
2.5.2 Sonar
The sonar scans the sea horizontally but it works on the same principle as the echosounder.
Hameed and Boopendranath (2000) stated that there were two types of sonars utilised in the
fishery sector, i.e. sector scanning or search light sonar and omnisonar. Further, Misund
(1997) reported that the search light sonar was a single beam, in which a single beam was
trained in sequential sectors with one or more transmissions in each sector. The multibeam or
omnidirectional sonar uses several beams, which are trained on a large sector or the whole
circle in each transmission. Some sonars may also be operated with an additional vertical
beam fan which enables the vertical extent of fish shoals to be projected as well. Nowadays
several sonar products and types of data calibration software are available on the market that
give detailed information on fish schools, distance from vessel, depth range and speed etc.
2.5.3 The trawl sonde and gear sensors
The trawl sonde was invented to monitor the vertical opening of the trawl and the vertical
position of the trawl in relation to fish concentrations and the bottom (Misund 1997). The net
recorder operates through a cable to the ship or wireless. The wireless type relies on a
transmitter/receiver, transducer, mounted on the trawl headline, sending information through
ultrasonic sound beam, to the receiver mounted on the hull of the vessel (Hameed and
Boopendranath 2000, Sainsbury 1975). Gabriel et al. (2005) stated that any disarrangement of
the net could be detected immediately. Some of the net sondes provide total views of the net
and there are some combination equipments which provide temperature at the depth of the
mid-water trawl. Simmonds 2005 and Maclennan (2005) reported that some net sondes had
two transducers with one beam directed downwards and the other beam directed upwards
while the combined echogram was displayed in colour on the screen.
To be able to follow how the gear is functioning during fishing, acoustic gear performance
sensors have been introduced during the last two decades. On the most modern trawls there
are now cableless acoustic sensors to measure trawl depth, door spread, headline height, sea
temperature, speed through the water and relative amount of catch in the bag (Figure 10).
2.6 The importance of trawl design
A trawl net design is a scientific field which involves several basic calculations, formulas,
tests and knowledge on the size and shape of the targeted species. It is a process of preparing
technical specifications and drawings for a fishing net, which has to satisfy the gear handling,
technical, operational, economic and social requirements. In the olden days the net design was
directly utilised for net construction without knowing much about its geometry in the water.
Later the flume tanks were introduced to judge the working shape and position on a model of
each gear, the speed, magnitude and direction of forces. Today other methods also exist such
as underwater cameras to monitor the real shape of the net in situ and computer software for
visualising the shape of the net at different hanging ratios. Each design has its own
specifications and there are certain rules to draw the net plans in accordance with international
standards.
Net designing has undergone changes in the past decades with modernisation of fishing
techniques, methodology and invention of different software. Still the basic principles of
designing are the same with a few additional techniques. There are several literature available
on net design such as how to make and set nets by Garner (1974), Modern Fishing Gear of the

Konkane
UNU-Fisheries Training Programme 15
world Volume 1-3 (FAO), Calculations for fishing gear designs by Fridman (1986),
Fishermans workbooks (FAO 1977) and several reports and documents presented by FAO
and other organisations in the world. It is a continuous process of development in the line of
fishing gear design.
3 MATERIAL AND METHODS
The method applied in this study is as described by Fridman in his book “Calculations for
fishing gear design” with a combination of Prado “Fisherman’s workbook” and various other
books and reports. A prototype mid-water trawl design was prepared according to the
specification of MFV Sagarika (Departmental vessel of the Fishery Survey of India).
3.1 The vessel: MFV Sagarika
MFV Sagarika is a stern trawler belonging to the Fishery Survey of India (Figure 11). It is
operated along the central west coast of India and carries out bottom trawling using a 27 m
fish trawl and a 30 m shrimp trawl. In the present study the specifications of this vessel were
used while designing the prototype mid-water trawl. The specifications are given below:
Specification:
General information
Year built : 1993
Builder : Nigata Engineering Co. Ltd., Japan
Type of vessel : Fishing vessel – Combination trawler
1. Dimensions
Length overall : 28.80 m
Length between perpendiculars : 24.80 m
Breadth : 7.30 m
Depth : 3.25 m
Designed load draft : 2.75 m
Gross tonnage : 189 tonnes
2. Engine
Main engine : 650 ps (BHP = 1.01387 * Ps) X 1450
Figure 11: The vessel MFV Sagarika (Source: FSI)

Konkane
UNU-Fisheries Training Programme 16
rpm; Nigata, Japan
Service speed : 9.0 knots
Endurance : 6333 miles, 15 days
3. Compliment
Officers : 6
Crew : 10
Total : 16 persons (15+1 Scientist)
4. Capacities
Fuel oil tank : 67.27 m3
Fresh water tank : 41.51 m3
Fish hold : 94.17 m3
5. Navigation equipments : Auto pilot, radar, GPS
Automatic direction finder, gyro
compass,
6. Communication equipments : Radiotelephone, VHF (2)
7. Fish finding equipments : Echosounder, sonar, net sonde
8. Gear hauling equipments
Split winch : Length : 0.51 m
Wire diameter : 18 mm
Warp storage capacity : 1000 m
Net drum : Length : 1.3 m
Diameter : 2.1 m
3.2 Towing speed
The cruising speed of the vessel MFV Sagarika is 9 knots but the trawling speed depends on
the net drag. When capturing a fish school the towing speed should be proportional to the
swimming speed of the fish. Lower towing speeds being used to catch slow swimming fish
and higher speeds for fast swimming fish. Practical observations and special experiments have
shown that there is an optimal trawling speed for each species of fish and trawl design which
provides the maximum catch (Fridman 1986).
3.3 Prototype design
While documenting the required characteristics of the prototype of a mid-water trawl and its
accessories, one must consider the shape and size of the fish, technical characteristics of the
fishing vessel from which the gear is going to be operated, such as size of the vessel, engine
horse power, towing pull of the vessel, size of the net drum, capacity of the trawl winch and
other gear handling devices. After getting all this information we will be able to estimate the
towing pull of the vessel and have a rough idea on the size of the net. A draft is made; its
towing resistance is calculated and matched to the available towing power and speed
requirements.
After designing the prototype the net was drawn in accordance with international guidelines
(FAO 1972, Strange 1978) using computer software. In this project the net diagram is drawn
in Design CAD MAX 19 software and presented both in 2D and 3D. The net design was
drawn in 3D with different hanging ratios to evaluate the most realistic ratio and to select the
appropriate bridle lengths and rigging details.

Konkane
UNU-Fisheries Training Programme 17
3.4 Calculations
The only knowledge that many good fishermen have is their experience and what they have
learned from their fathers. They often distrust the results of theoretical investigations,
particularly because they do not know how to take advantage of them. However, with the
dynamic changes which have occurred in recent years in the world fisheries, improving the
selection of fishing ground, gear and methods, and involving sophisticated equipments such
as monitoring instruments, large and powerful fishing gear and automatic machines,
fishermen of a new type are needed who are able to blend practical experience with
theoretical knowledge (Fridman 1986).
Here the calculations followed for the designing of a prototype mid-water trawl are given
bellow. All the calculations were done manually.
3.4.1 The towing force of a trawler
The towing force of the vessel depends upon the engine brake horsepower (BHP) and the
towing speed. Fridman (1986) prescribed the following formula for calculating the available
towing force.
)7.0( VKPF Ft
(3.1)
Where,
Ft: towing pull, kgf
P: engine brake horsepower (BHP = 1.01387 * Ps)
V: towing speed in Knots
KF: empirical towing force coefficient, this coefficient ranges from 10 to 20 depending
upon the type of propeller and the presence of propeller nozzle.
3.4.2 Mesh size selectivity and its calculations
In the present study the mesh size selectivity of the mid-water trawl is important. In the wing
section of the net it was decided to use large meshes in order to reduce drag, while still
providing herding effect on the particular species. Then it goes to descending order in mesh
size and twine diameter along the belly towards the codend.
3.4.2.1 Mesh size for codend
The formula prescribed by Fridman (1986) is based on the gillnet mesh size selectivity and
calculates the effective mesh size for trawl net as follows:
OGOC MM
3
2 (3.2)
Where,
Moc: mesh opening in the codend
MOG: mesh opening in gillnets
Whereas the mesh opening in gillnets can be calculated with the help of the following
formula:
Konkane
UNU-Fisheries Training Programme 18
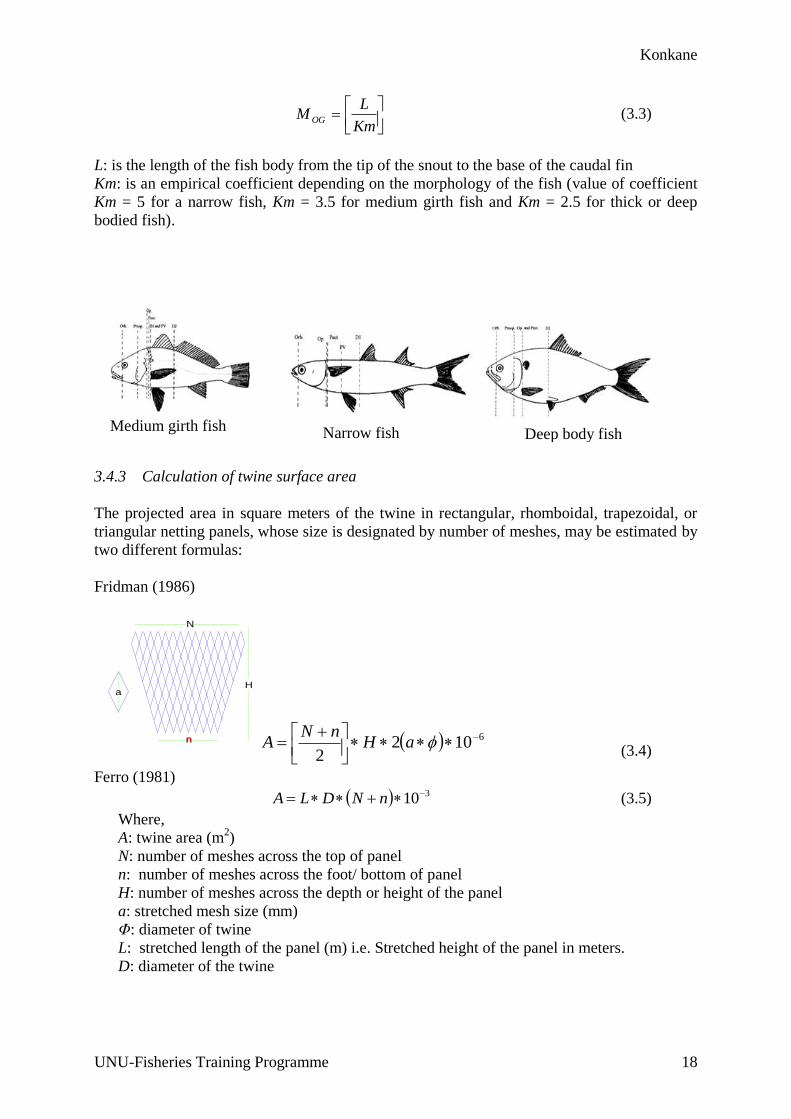
Km
LM OG (3.3)
L: is the length of the fish body from the tip of the snout to the base of the caudal fin
Km: is an empirical coefficient depending on the morphology of the fish (value of coefficient
Km = 5 for a narrow fish, Km = 3.5 for medium girth fish and Km = 2.5 for thick or deep
bodied fish).
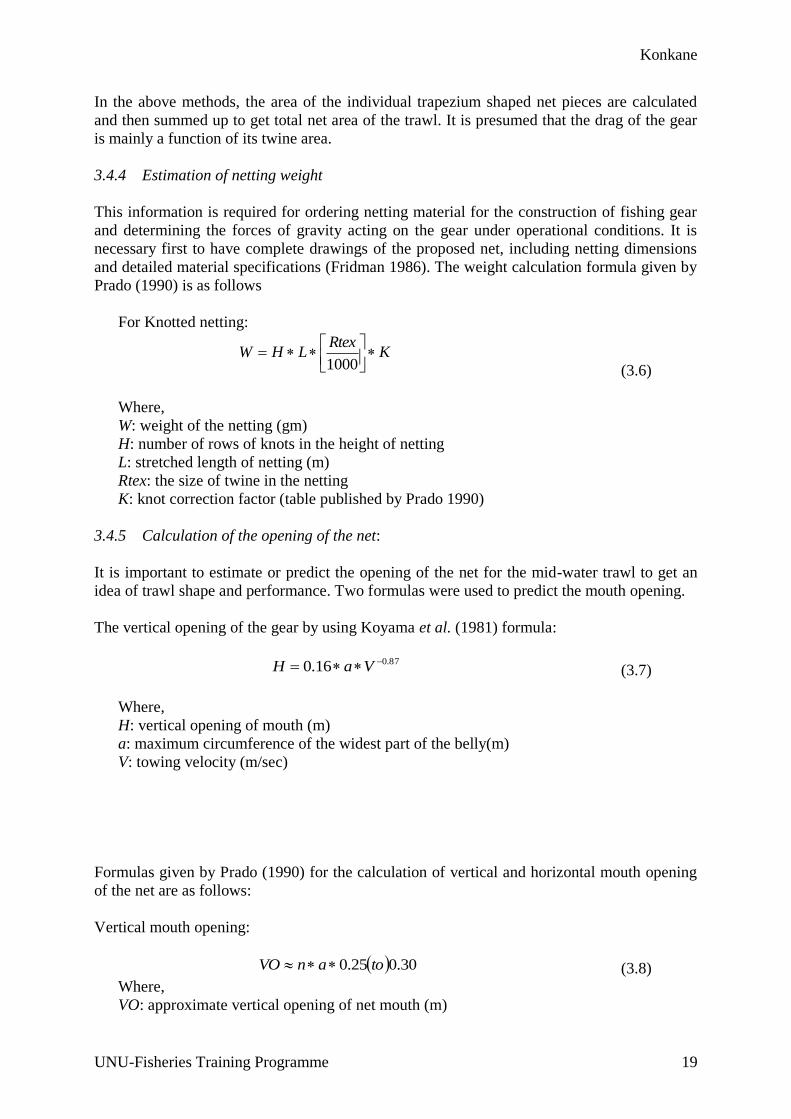
3.4.3 Calculation of twine surface area
The projected area in square meters of the twine in rectangular, rhomboidal, trapezoidal, or
triangular netting panels, whose size is designated by number of meshes, may be estimated by
two different formulas:
Fridman (1986)
N
n
H
n
a
61022
aH
nNA
(3.4)
Ferro (1981)
310 nNDLA (3.5)
Where,
A: twine area (m2)
N: number of meshes across the top of panel
n: number of meshes across the foot/ bottom of panel
H: number of meshes across the depth or height of the panel
a: stretched mesh size (mm)
Φ: diameter of twine
L: stretched length of the panel (m) i.e. Stretched height of the panel in meters.
D: diameter of the twine
Medium girth fish Narrow fish Deep body fish
Konkane
UNU-Fisheries Training Programme 19
In the above methods, the area of the individual trapezium shaped net pieces are calculated
and then summed up to get total net area of the trawl. It is presumed that the drag of the gear
is mainly a function of its twine area.
3.4.4 Estimation of netting weight
This information is required for ordering netting material for the construction of fishing gear
and determining the forces of gravity acting on the gear under operational conditions. It is
necessary first to have complete drawings of the proposed net, including netting dimensions
and detailed material specifications (Fridman 1986). The weight calculation formula given by
Prado (1990) is as follows
For Knotted netting:
KRtex
LHW
1000 (3.6)
Where,
W: weight of the netting (gm)
H: number of rows of knots in the height of netting
L: stretched length of netting (m)
Rtex: the size of twine in the netting
K: knot correction factor (table published by Prado 1990)
3.4.5 Calculation of the opening of the net:
It is important to estimate or predict the opening of the net for the mid-water trawl to get an
idea of trawl shape and performance. Two formulas were used to predict the mouth opening.
The vertical opening of the gear by using Koyama et al. (1981) formula:
87.016.0 VaH (3.7)
Where,
H: vertical opening of mouth (m)
a: maximum circumference of the widest part of the belly(m)
V: towing velocity (m/sec)
Formulas given by Prado (1990) for the calculation of vertical and horizontal mouth opening
of the net are as follows:
Vertical mouth opening:
30.025.0 toanVO (3.8)
Where,
VO: approximate vertical opening of net mouth (m)

Konkane
UNU-Fisheries Training Programme 20
n: width in number of meshes of front edge of belly
a: mesh size (m)
The other formula calculates the horizontal mouth opening of the net:
60.050.0 toHRS (3.9)
Where,
S: approximate
horizontal spread
between ends of wings
(m)
HR: length of
head rope (m)
3.4.6 Hanging ratio
The actual shape of mesh is determined by the process of hanging it onto the rope frame. The
different shapes of the netting panel are achieved by varying the primary hanging ratio E1 and
the secondary hanging ratio E2. Here three different hanging ratios were used: E1= 0.2, 0.3,
and 0.5, for the calculation of secondary hanging ratio. The circumference opening of the
trawl will depend on the hanging ratio used. The following formula given by Fridman (1986)
calculates the secondary hanging ratio.
2
12 1 EE (4.0)
Where,
E2: vertical hanging ratio
E1: horizontal hanging ratio
The actual height of a mounted (rigged or hung) net depends on the stretched height and the
hanging ratio. The general formula given by Fridman (1986) in all cases is:
2ENM (4.1)
Where,
M = mounted height (m)
N = stretched height (m)
E2 = vertical hanging ratio
3.4.7 Calculation of netting drag
It is assumed that the drag of the gear is mainly a function of their twine area. Different
fishing nets often have shapes which are more complex than a plane netting panel and the
hydrodynamic characteristics of their component netting sections may not all be the same. An
approximate determination of the hydrodynamic resistance of fishing nets may be carried out
on the assumption that the resistance of a combined net of an arbitrary shape is equal to the
sum of the drags of its netting components of simpler shape, whatever their size or form may
be.
Konkane
UNU-Fisheries Training Programme 21
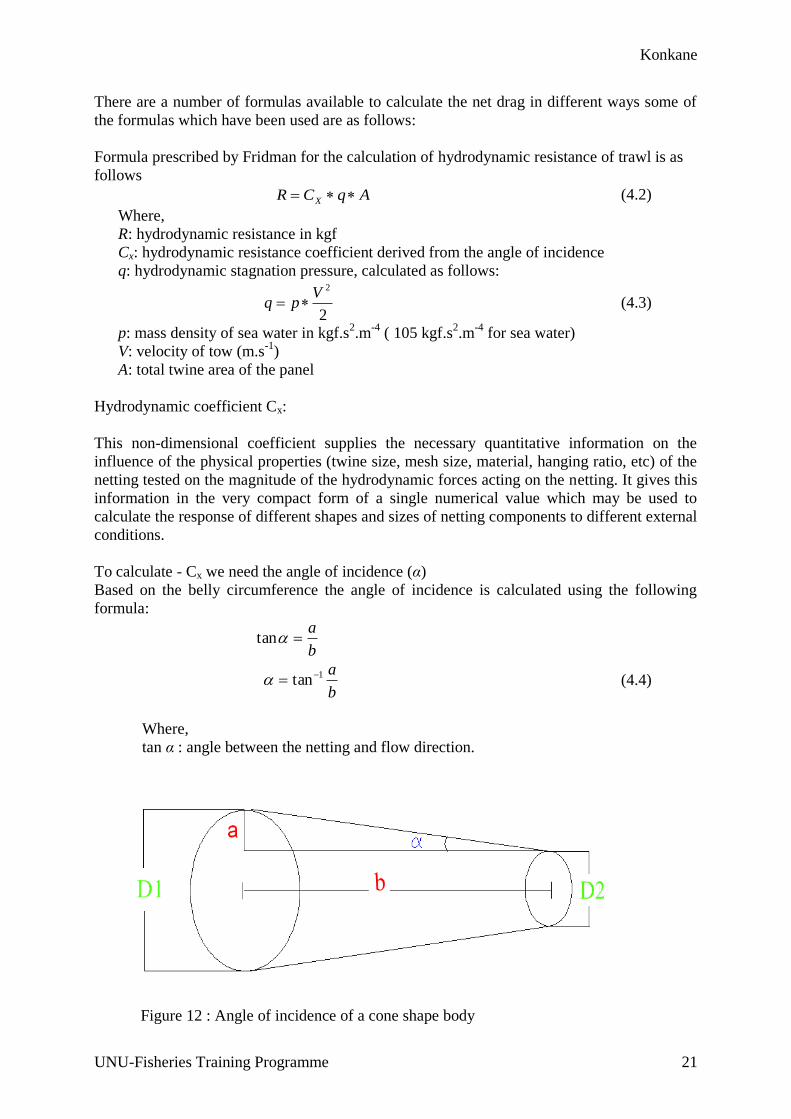
There are a number of formulas available to calculate the net drag in different ways some of
the formulas which have been used are as follows:
Formula prescribed by Fridman for the calculation of hydrodynamic resistance of trawl is as
follows
AqCR X (4.2)
Where,
R: hydrodynamic resistance in kgf
Cx: hydrodynamic resistance coefficient derived from the angle of incidence
q: hydrodynamic stagnation pressure, calculated as follows:
2
2Vpq (4.3)
p: mass density of sea water in kgf.s2.m
-4 ( 105 kgf.s
2.m
-4 for sea water)
V: velocity of tow (m.s-1
)
A: total twine area of the panel
Hydrodynamic coefficient Cx:
This non-dimensional coefficient supplies the necessary quantitative information on the
influence of the physical properties (twine size, mesh size, material, hanging ratio, etc) of the
netting tested on the magnitude of the hydrodynamic forces acting on the netting. It gives this
information in the very compact form of a single numerical value which may be used to
calculate the response of different shapes and sizes of netting components to different external
conditions.
To calculate - Cx we need the angle of incidence (α)
Based on the belly circumference the angle of incidence is calculated using the following
formula:
b
atan
b
a1tan (4.4)
Where,
tan α : angle between the netting and flow direction.
Figure 12 : Angle of incidence of a cone shape body

Konkane
UNU-Fisheries Training Programme 22
Where,
2
21 DDa
(4.5)
D1: diameter of the large circle i.e. the front end of the cone shaped belly
D2: diameter of the small circle i.e. the aft end of the cone shaped belly
b: length of the cylinder
α: angle of incidence
After getting the angle of incidence it can be correlated with table given in Fridman (1986).
This value is the Cx value which is used for the calculation of net drag.
Reid (1977) defines a relationship between net drag, net speed and net twine area which is
independent of parameters derived from the net geometry using the following equation:
2.11572.54
2
V
RVD (4.6)
Where,
D: drag in tonnes
R: total twine area (m2)
V: speed in knots
The MacLennan (1981) formula for calculation of net drag is:
9807
0641.01
6.462.61 2
V
VTa
Rp (4.7)
Where,
Rp: net drag
V: trawling speed (knots)
Ta: twine area for the complete trawl (m2)
All three formulas were applied to see the variations in the calculated netting drag. Fridman
(1986) showed the generalised relationship between the drag of a panel of netting and its
angle of incidence to the flow. Whereas the MacLennan (1981) formula is based on
engineering trials and the Reid (1977) formula expresses the relationship between net drag,
net speed and net twine area.
3.4.8 Drag and weight of otter boards
Each net will require a different size and weight of trawl board in accordance with netting
area to achieve the correct spreading of the net (Ferro 1981). The area of the otter board for
the prototype mid-water trawl was calculated based on the formula prescribed in the
Fisherman’s workbook.
23.1)0152.0( fSSp (4.8)
Where,
Sp: surface area of a Suberkrub otter board in m2
Sf: twine surface area of pelagic/mid-water trawl

Konkane
UNU-Fisheries Training Programme 23
In this specific case Sf = 117.2432 m2
so that a fitting size of otter boards would be: 3.01
m2
The actual weight of the trawl door required in accordance with surface area of otter board is
given by Ferro (1981):
2
3
75 BW (4.9)
Where,
W: weight of the otter board
B: area of the otter board (m2)
The drag of the otter board is calculated by the Fridman (1986) formula:
AqCxRo
Ro: otter board drag
Cx: angle of attack assumed to be 150 the Cx value taken from the Fridman table page no.
68
A: area of the otter board
q: hydrodynamic stagnation pressure which is calculated by formula 4.3
3.4.9 Calculation of total trawl resistance
The drag of the trawl gear is the power required to overcome the hydrodynamic resistance of
the gear towed at a particular speed. The total drag of the trawl system should match the
available towing force of the vessel (Hameed and Boopendranath 2000).
The total trawl gear resistance is computed by determining the resistance of the various gear
components such as netting panels, lines and ropes, floats, sinkers, otter-boards and warps.
Total drag of the gear: RfRoRxRnRt (5.0)
Where,
Rt: total gear resistance
Rn: resistance offered by netting panel
Rx: resistance offered by line and ropes i.e. Head rope, foot rope, warp, sweep line and
bridal
Ro: resistance offered by otter boards
3.4.9.1 Calculation of net drag (Rn)
Formula 4.6 (Reid 1977) was used to calculate the net drag.
3.4.9.2 Calculation of drag due to floats and sinkers
The basic hydrodynamic formula was used for estimating the drag due to floats or sinkers
(Fridman 1986).
AqCNRf X (5.1)
Where,
Rf: resistance due to floats and sinkers (kgf)

Konkane
UNU-Fisheries Training Programme 24
N: number of floats (and sinkers)
q: hydrodynamic stagnation pressure (kgf/m2) =pV
2/2
A: area of the sphere (m2)
Cx: drag coefficient (0.5 for all spheres Fridman, 1986 page no.66)
3.4.9.3 Drag induced by lines and ropes (Rx)
Calculation of the drag of ropes and lines i.e. warp, head line, foot rope, sweep line and
bridals according to the formula given by Fridman (1981), the Cx value and length and
diameter will change according to the lines and ropes and their angles.
qDLCRs X (5.2)
Where,
L: length of rope (m)
D: diameter of rope (m)
Cx: drag coefficient (obtained from Fridman 1986 page no. 64 and 65)
q: hydrodynamic stagnation pressure (kgf/m2) = pV
2/2
4 RESULTS
4.1 Towing pull
The towing pull of the vessel MFV Sagarika is calculated using Fridman (1986) formula
(3.1). Generally the towing force coefficient ranges from 10 for trawlers with conventional
pitch propellers to 15 for trawlers equipped with controllable pitch propeller. A value derived
at using the equation (3.1) shows that at a slow speed a vessel can tow more weight, but as the
speed increases the available towing pull of the vessel decreases. The calculated towing pull
of the vessel MFV Sagarika at different towing speeds is given in Table 1
Table 1: Calculated towing pull of the vessel (formula 3.1)
4.2 Estimation of net drag coefficient (Cx)
All the calculations in this project are based on the prototype mid-water trawl design Figure
16, Tables 8 and 9.
Angle of incidence and drag coefficient values were calculated for the prototype net using
different hanging ratio (using lower section net circumference and top section net
circumference, as the belly section portion has been taken for the calculation of net drag
coefficient). The E1 and E2 were derived using the formula (4.0) and the angle of incidence
Towing speed
(in knot)
Towing pull (in tons) hp = 650
(Empirical coefficients Kf=15)
1.0 9.29
1.5 9.07
2.0 8.84
2.5 8.61
3.0 8.38
3.5 8.16
4.0 7.93
4.5 7.70
5.0 7.47

Konkane
UNU-Fisheries Training Programme 25
using equations (4.4 and 4.5). When the hanging ratio starts decreasing the opening of the net
starts reducing and they are thus proportional to each other. Based on the angle of incidence
the Cx value is obtained from the data published in the FAO fishing manual (Fridman 1986)
page no.55. The results are shown in Table 2.
Table 2: Cx value at different hanging ratios (formula 4.4 for angle of incidence = α) Hanging ratio
α Cx E1 E2
0.5 0.86 12 0.50
0.3 0.95 7.5 0.47
0.2 0.98 4.5 0.43
4.3 Twine surface area
The twine surface area is calculated using Prado (1990) (formula 3.4) and Ferro (1981)
(formula 3.5) for each section of the net and then summed up. The results obtained by using
both formulas are the same. The netting area of the trawl is given in Table 3.
Table 3: Twine surface area of the prototype design (formulas 3.4 and 3.5) Netting
panels N n H a Φ/D L=H*a
Prado
1990
Ferro
1981 Panel
Total netting
area(m2)
Wing 25 12.5 25 400 4 10 1.50 1.50 8 12.00
Belly 1 155 125 30 200 3 6 5.04 5.04 4 20.16
Belly 2 250 120 130 100 2.5 13 12.02 12.02 4 48.10
Belly 3 240 90 150 50 1.8 7.5 4.45 4.45 4 17.82
Cod end 150 150 250 30 1.8 7.5 4.05 4.05 4 16.20
Corner
piece 4 2 2 400 4 0.8 0.02 0.02 8 0.15
Extra
panel 2 2 23 400 4 9.2 0.15 0.15 8 1.18
Wedges 14.5 2.5 6 400 5 2.4 0.20 0.20 8 1.63
Total
area 117.24
N : upper section meshes ; n : Lower section meshes ; H : Meshes in depth ; a: Mesh size ; Φ/D : Twine
diameter ; L : stretched length of the panel(m)
4.4 Netting drag
To a net designer, attempting to design a net to suite a specific power of vessel, the ability to
predict the hydrodynamic drag of the net is essential (Reid 1977). The netting drag of the net
is calculated based on the three different formulas given (4.2, 4.6, and 4.7) and using three
different hanging ratios (Formula 4.2). Values are given in Table 4.
The netting resistance was calculated by using three different hanging ratios, i.e. 0.5, 0.3 and
0.2. The results show that as the hanging ratio increases, the netting drag increases and vice
versa. Put another way the net opening depends upon the hanging ratio. Fridman shows the
generalised relationship between the drag of a panel of netting and its angle of incidence to
the flow on the one hand, and between the total net drag and the mean angle of incidence of
the netting (Formula 4.2), on the other.
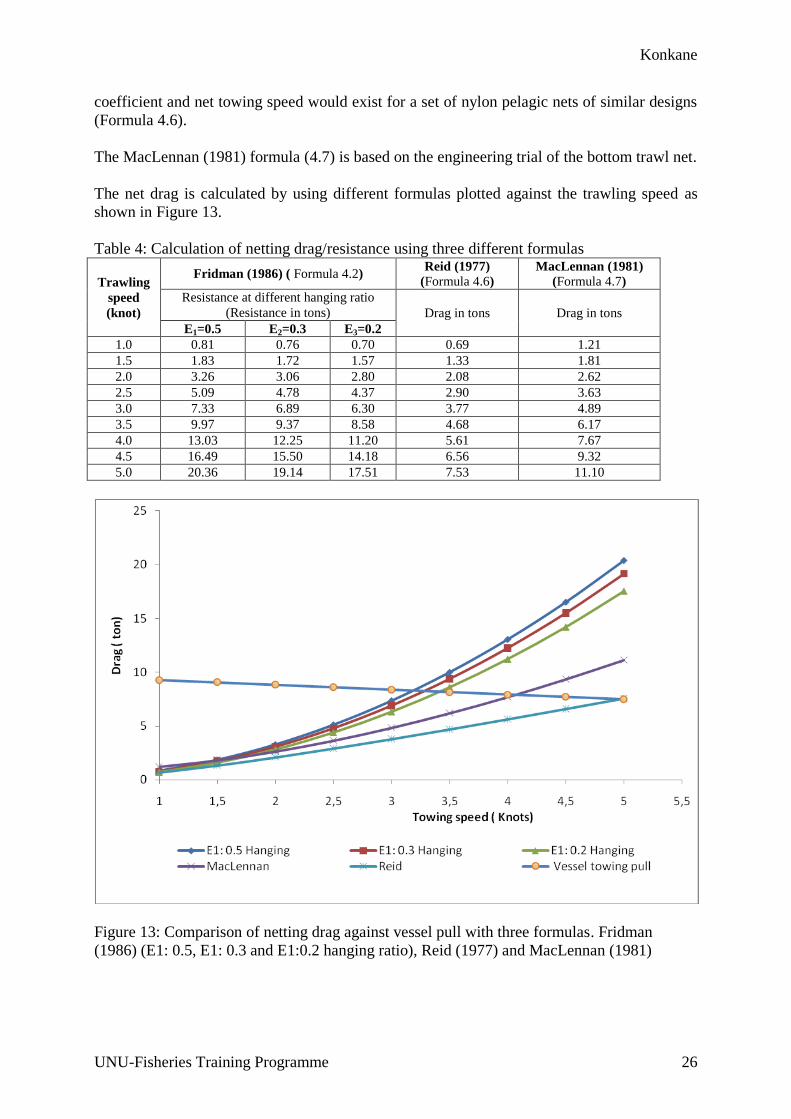
The simple formula given by Reid (1977) is based on the engineering performance of the
pelagic trawl (four panels), assuming that a constant relationship between the net drag
Konkane
UNU-Fisheries Training Programme 26
coefficient and net towing speed would exist for a set of nylon pelagic nets of similar designs
(Formula 4.6).
The MacLennan (1981) formula (4.7) is based on the engineering trial of the bottom trawl net.
The net drag is calculated by using different formulas plotted against the trawling speed as
shown in Figure 13.
Table 4: Calculation of netting drag/resistance using three different formulas
Trawling
speed
(knot)
Fridman (1986) ( Formula 4.2) Reid (1977)
(Formula 4.6)
MacLennan (1981)
(Formula 4.7)
Resistance at different hanging ratio
(Resistance in tons) Drag in tons Drag in tons
E1=0.5 E2=0.3 E3=0.2
1.0 0.81 0.76 0.70 0.69 1.21
1.5 1.83 1.72 1.57 1.33 1.81
2.0 3.26 3.06 2.80 2.08 2.62
2.5 5.09 4.78 4.37 2.90 3.63
3.0 7.33 6.89 6.30 3.77 4.89
3.5 9.97 9.37 8.58 4.68 6.17
4.0 13.03 12.25 11.20 5.61 7.67
4.5 16.49 15.50 14.18 6.56 9.32
5.0 20.36 19.14 17.51 7.53 11.10
Figure 13: Comparison of netting drag against vessel pull with three formulas. Fridman
(1986) (E1: 0.5, E1: 0.3 and E1:0.2 hanging ratio), Reid (1977) and MacLennan (1981)

Konkane
UNU-Fisheries Training Programme 27
4.5 Trawl mouth opening
There are two formulas available for the trawl mouth opening, one given by Koyama et al.,
(1981) (3.7) predicting the vertical height of the trawl gear at different trawling speeds. As the
trawling speed increases the vertical net opening of the net reduces. The results are shown in
Table 5 and Figure 14.
The other formula (3.8) given by Prado (1990) for vertical trawl mouth opening and
horizontal opening (3.9). The vertical mouth opening is based on the number of meshes in the
top belly cross section and horizontal opening based on the head rope length of the mid-water
trawl. The value calculated for vertical mouth opening is 7.75 m and 14.61 m for horizontal
opening.
Table 5: Calculation of vertical mouth opening (Koyama et al., 1981) based on the belly
circumference at different hanging ratios and towing speeds (formula 3.7). Trawling
speed
Mouth opening (m) at
E1= 0.5 hanging ratio
Mouth opening (m) at
E1=0.3 hanging ratio
Mouth opening (m) at
E1= 0.2 hanging ratio
1.0 17.67 10.60 7.07
1.5 12.42 7.45 4.97
2.0 9.66 5.80 3.87
2.5 7.96 4.78 3.18
3.0 6.79 4.08 2.72
3.5 5.94 3.56 2.37
4.0 5.29 3.17 2.12
4.5 4.78 2.87 1.91
Note: This vertical opening of the net is based on the empirical formula. It may vary with depth of operation and
weight of the foot rope and sweep line etc.
Figure 14: Vertical trawl mouth opening at different hanging ratios as a function of speed
Konkane
UNU-Fisheries Training Programme 28
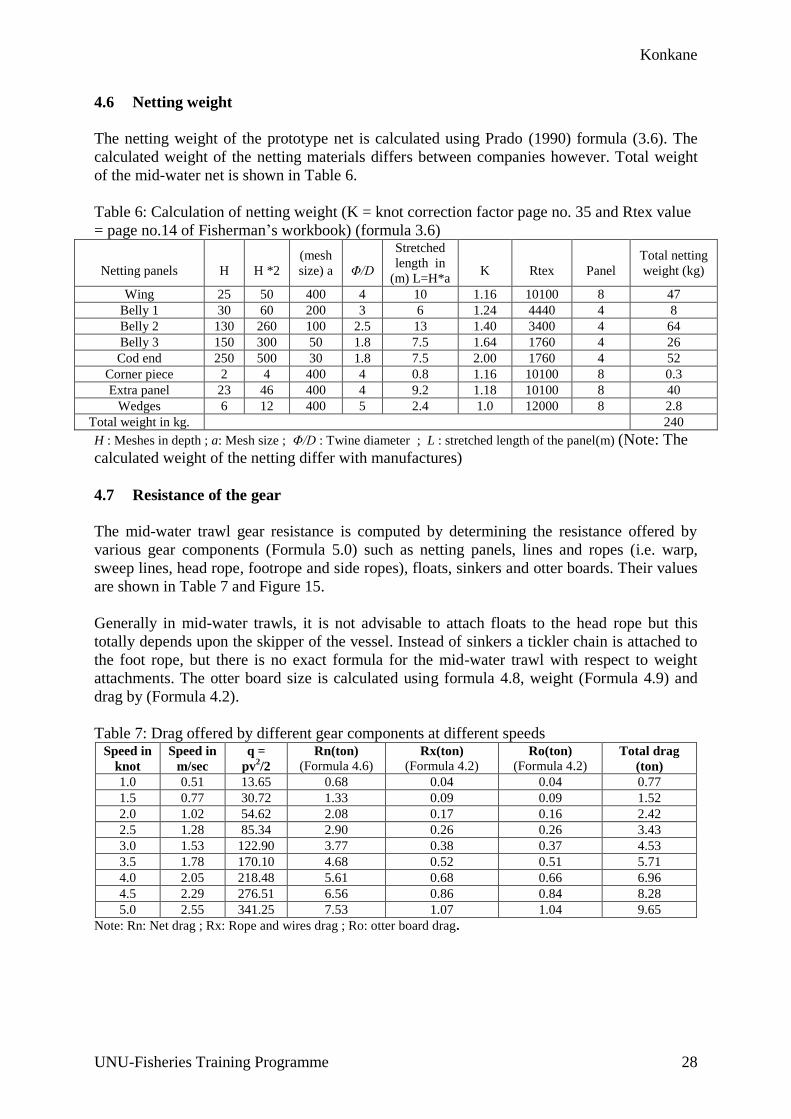
4.6 Netting weight
The netting weight of the prototype net is calculated using Prado (1990) formula (3.6). The
calculated weight of the netting materials differs between companies however. Total weight
of the mid-water net is shown in Table 6.
Table 6: Calculation of netting weight (K = knot correction factor page no. 35 and Rtex value
= page no.14 of Fisherman’s workbook) (formula 3.6)
Netting panels
H
H *2
(mesh
size) a
Φ/D
Stretched
length in
(m) L=H*a
K
Rtex
Panel
Total netting
weight (kg)
Wing 25 50 400 4 10 1.16 10100 8 47
Belly 1 30 60 200 3 6 1.24 4440 4 8
Belly 2 130 260 100 2.5 13 1.40 3400 4 64
Belly 3 150 300 50 1.8 7.5 1.64 1760 4 26
Cod end 250 500 30 1.8 7.5 2.00 1760 4 52
Corner piece 2 4 400 4 0.8 1.16 10100 8 0.3
Extra panel 23 46 400 4 9.2 1.18 10100 8 40
Wedges 6 12 400 5 2.4 1.0 12000 8 2.8
Total weight in kg. 240
H : Meshes in depth ; a: Mesh size ; Φ/D : Twine diameter ; L : stretched length of the panel(m) (Note: The
calculated weight of the netting differ with manufactures)
4.7 Resistance of the gear
The mid-water trawl gear resistance is computed by determining the resistance offered by
various gear components (Formula 5.0) such as netting panels, lines and ropes (i.e. warp,
sweep lines, head rope, footrope and side ropes), floats, sinkers and otter boards. Their values
are shown in Table 7 and Figure 15.
Generally in mid-water trawls, it is not advisable to attach floats to the head rope but this
totally depends upon the skipper of the vessel. Instead of sinkers a tickler chain is attached to
the foot rope, but there is no exact formula for the mid-water trawl with respect to weight
attachments. The otter board size is calculated using formula 4.8, weight (Formula 4.9) and
drag by (Formula 4.2).
Table 7: Drag offered by different gear components at different speeds Speed in
knot
Speed in
m/sec
q =
pv2/2
Rn(ton)
(Formula 4.6) Rx(ton)
(Formula 4.2) Ro(ton)
(Formula 4.2) Total drag
(ton)
1.0 0.51 13.65 0.68 0.04 0.04 0.77
1.5 0.77 30.72 1.33 0.09 0.09 1.52
2.0 1.02 54.62 2.08 0.17 0.16 2.42
2.5 1.28 85.34 2.90 0.26 0.26 3.43
3.0 1.53 122.90 3.77 0.38 0.37 4.53
3.5 1.78 170.10 4.68 0.52 0.51 5.71
4.0 2.05 218.48 5.61 0.68 0.66 6.96
4.5 2.29 276.51 6.56 0.86 0.84 8.28
5.0 2.55 341.25 7.53 1.07 1.04 9.65
Note: Rn: Net drag ; Rx: Rope and wires drag ; Ro: otter board drag.

Konkane
UNU-Fisheries Training Programme 29
Figure 15: Total netting drag compared to vessel pull at different towing speeds
4.8 Prototype design
4.8.1 General specifications
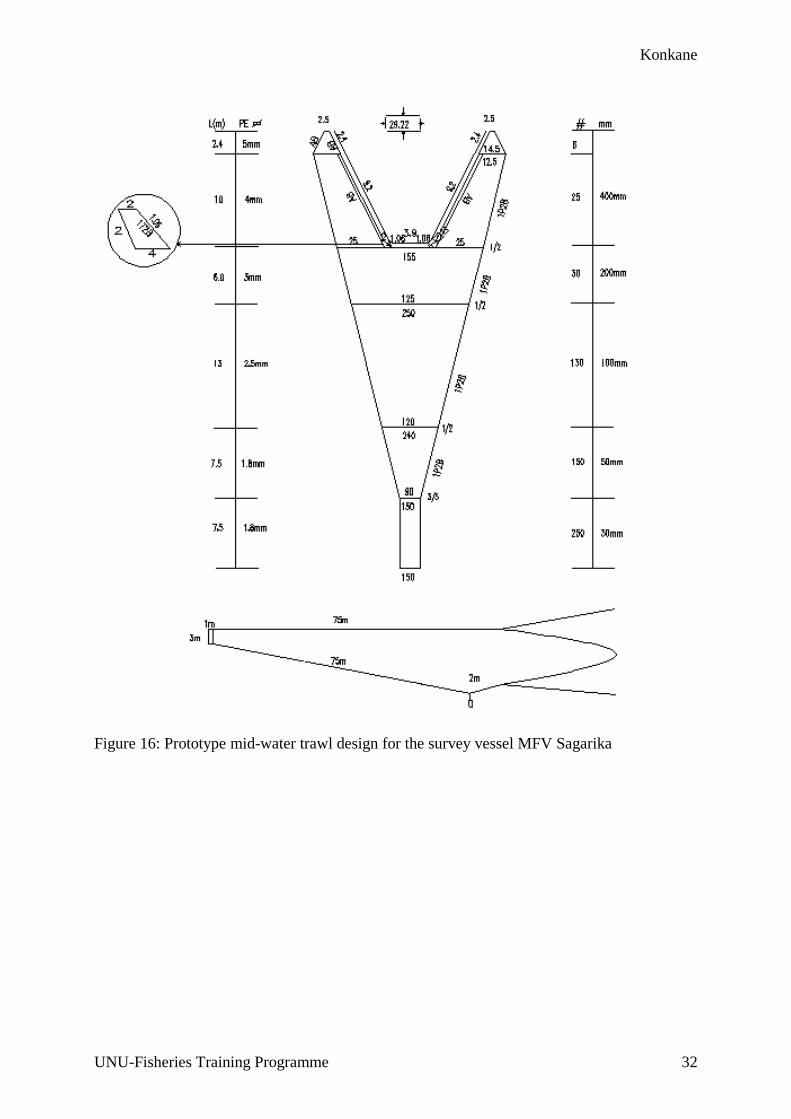
The prototype is a four panel mid-water trawl, with all the panels of equal size. The front part
of the belly is 155 meshes with a mesh size of 200 mm. The mesh size in the wings is 400
mm; the belly is comprised of three different mesh sizes, i.e. 200 mm, 100 mm and 50 mm
and terminating into the codend of 30 mm mesh size. Since it is a four panel mid-water trawl
the head rope, foot rope and side ropes are kept the same length, i.e. 29.22 m. The detailed
specifications of the gear are given in data sheet Table 8 and in Figure 16.
Konkane
UNU-Fisheries Training Programme 30
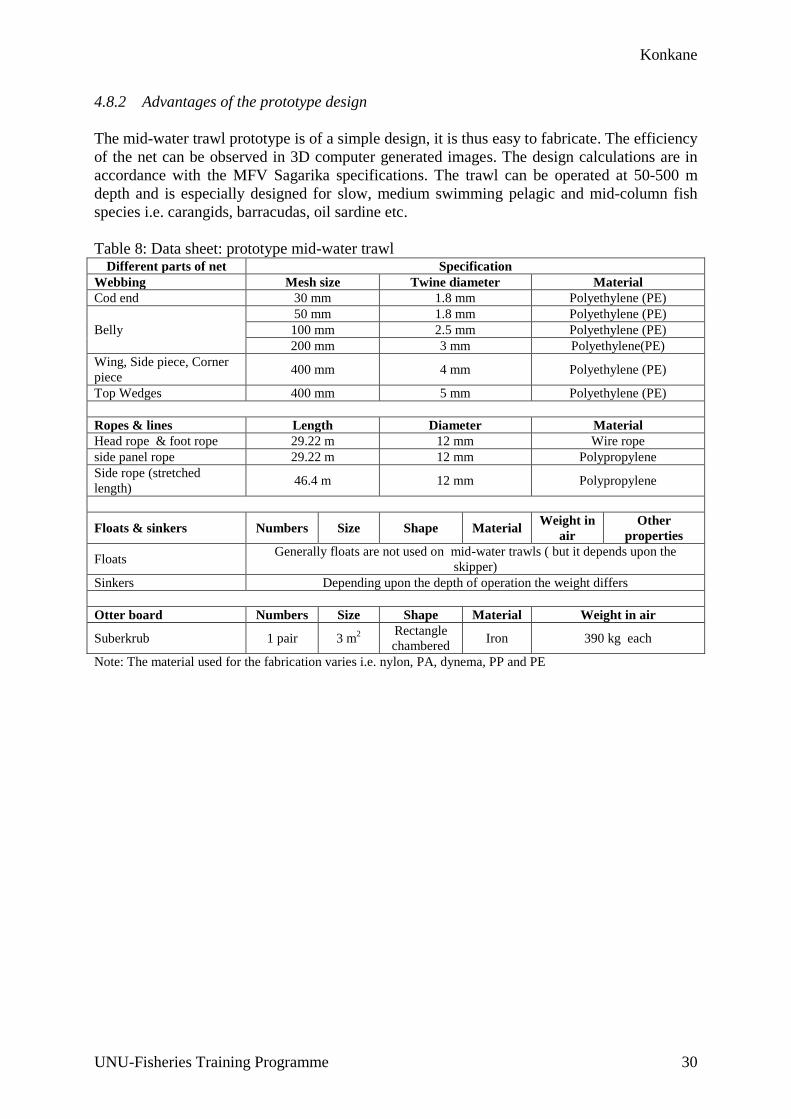
4.8.2 Advantages of the prototype design
The mid-water trawl prototype is of a simple design, it is thus easy to fabricate. The efficiency
of the net can be observed in 3D computer generated images. The design calculations are in
accordance with the MFV Sagarika specifications. The trawl can be operated at 50-500 m
depth and is especially designed for slow, medium swimming pelagic and mid-column fish
species i.e. carangids, barracudas, oil sardine etc.
Table 8: Data sheet: prototype mid-water trawl Different parts of net Specification
Webbing Mesh size Twine diameter Material
Cod end 30 mm 1.8 mm Polyethylene (PE)
Belly
50 mm 1.8 mm Polyethylene (PE)
100 mm 2.5 mm Polyethylene (PE)
200 mm 3 mm Polyethylene(PE)
Wing, Side piece, Corner
piece 400 mm 4 mm Polyethylene (PE)
Top Wedges 400 mm 5 mm Polyethylene (PE)
Ropes & lines Length Diameter Material
Head rope & foot rope 29.22 m 12 mm Wire rope
side panel rope 29.22 m 12 mm Polypropylene
Side rope (stretched
length) 46.4 m 12 mm Polypropylene
Floats & sinkers Numbers Size Shape Material Weight in
air
Other
properties
Floats Generally floats are not used on mid-water trawls ( but it depends upon the
skipper)
Sinkers Depending upon the depth of operation the weight differs
Otter board Numbers Size Shape Material Weight in air
Suberkrub 1 pair 3 m2
Rectangle
chambered Iron 390 kg each
Note: The material used for the fabrication varies i.e. nylon, PA, dynema, PP and PE

Konkane
UNU-Fisheries Training Programme 31
4.8.3 Drawing
The prototype net drawing specifications are given in Table 9. The prototype design is drawn
in 3D using Design Cad 3D MAX 19 (2008) software to be able to view the net from different
angles and to see if the net design made is functioning properly. In the present study the net is
drawn with three different hanging ratios i.e. 0.5, 0.3 and 0.2 to select the right hanging ratio
for the net. The colours in the figures represent the mesh size of each section i.e. light green
400 mm for wing, red 200 mm for belly 1, yellow 100 mm for belly 2, green 50 mm for belly
3 and red colour, the codend of 30 mm. Six different views can be observed i.e. top, side,
front, isometric, perspective and parallel views. But in the present report three views of the
prototype mid-water trawl net and four views of the net with complete rigging are given in
Figures 17, 18, 19, 20, 21, 22 and 23.
Table 9: Prototype net drawing specification
Section Mesh Size
(mm)
Meshes in cross section Meshes in
depth
Cutting
Rate
Twine
Φ(mm)
No. of
panels Upper Lower
Wing 400 12.5 25 25 1P2B 4 8
Belly 1 200 155 125 30 1P2B 3 4
Belly 2 100 250 120 130 1P2B 2.5 4
Belly 3 50 240 90 150 1P2B 1.8 4
Codend 30 150 150 250 AP 1.8 4
Corner piece 400 2 4 2 1T2B 4 8
Extra panel 400 2 2 23 AB 4 8
Wedges 400 2.5 14.5 6 AB 5 8
Konkane
UNU-Fisheries Training Programme 32
Figure 16: Prototype mid-water trawl design for the survey vessel MFV Sagarika

Konkane
UNU-Fisheries Training Programme 33
Figure 17: 3D view (top view) of prototype mid-water trawl at different hanging ratios A: 0.5,
B: 0.3 and C: 0.2
Figure 18: 3D view (front view) of prototype mid-water trawl at different hanging ratio A:
0.5, B: 0.3 and C: 0.2
0.5 0.3 0.2

Konkane
UNU-Fisheries Training Programme 34
Figure 19: 3D view (isometric view) of prototype mid-water trawl at different hanging ratios
A: 0.5, B: 0.3 and C: 0.2
Figure 20: Towing position net view (side view) with combination of otter board (3x1 m),
sweep line (75 m) and warp (300 m) at different hanging ratios A: 0.5, B: 0.3 and C: 0.2 at the
depth of 100 m

Konkane
UNU-Fisheries Training Programme 35
Figure 21: Towing position net view (top view) with combination of otter board (3x1 m),
sweep line (75 m) and warp (300 m) at different hanging ratios A: 0.5, B: 0.3 and C: 0.2 at the
depth of 100 m

Konkane
UNU-Fisheries Training Programme 36
Figure 22: Towing position net view (front view) with combination of otter board (3x1 m),
sweep line (75 m) and warp (300 m) at different hanging ratios A: 0.5, B: 0.3 and C: 0.2 at the
depth of 100 m
Figure 23: Towing position net view (isometric view) with a combination of otter board (3x1
m), sweep line (75 m) and warp (300 m) at different hanging ratios, depth 100 m

Konkane
UNU-Fisheries Training Programme 37
5 DISCUSSION
If we take an overview of Indian fisheries we notice that more than 50 % of the catches
reported are pelagic species. These are caught by purse seiners, gillnetters and bottom trawlers
but not much attention has been paid so far to developing the mid-water or pelagic trawls. In
this project attempts are made to design a suitable experimental mid-water trawl to comply
with the available specifications of the departmental vessel MFV Sagarika.
The towing pull of the vessel is factored into the net size of the design. The mesh size of the
codend is calculated based on two formulas, i.e. on the basis of gill net selectivity; the result
differs with target species. The Indian fishery is a multi-species fishery, but even though it
was decided to keep the mesh size constant at 30 mm in the prototype design, it is advisable to
select the mesh size of the codend according to the targeted species. The surface twine area
was calculated using two different formulas, but they gave identical results. The weight of the
prototype design net was calculated at 240 kg approximately, it varies with the netting
material. At constant towing speed vertical opening is dependent only on the maximum
circumference of the belly section of the net and horizontal opening will be 50% of the head
rope length (with rigging), depending on otter board spread. Another important parameter in
the net design is the hanging ratio; the net opening depends heavily upon the hanging ratio. In
this prototype design three hanging ratios were used i.e. 0.5, 0.3 and 0.2. Based on these ratios
vertical net opening and netting drag were calculated. Bethke et al. (1999) conducted the
comparison study of three pelagic trawls, i.e. Macro, Foto and Krake for herring and sprat
survey with three different vertical mouth openings and different sizes of codend meshes, the
results showed that the larger the trawl, the larger the proportion of large fish.
The calculated netting drag varies with the three formulas used. For the mid-water trawl Reid
(1977) suggested the empirical formula which is based on the engineering trials of four panel
pelagic trawls. His formula was utilised in the final drag calculations against the vessel pull.
The various other components of the rigged trawl also offer resistance, such as the drag
offered by otter boards, line and ropes, which is calculated using Fridman’s formula. The total
drag is calculated by adding all drag components, i.e. netting drag; drag offered by lines and
ropes, sinkers and floats and otter boards. The total drag of the netting plotted against the
vessel pull shows that the vessel can drag the prototype net at the maximum speed of 4.3
knots. Bethke et al. (1999) suggested that the pelagic trawl must not be too large in relation to
the towing power of the vessel as it must be towed at a minimum speed of 3.5-4 knots.
The otter board suggested is of suberkrub type due to its high power of lifting and horizontal
spreading of the net mouth, compared to its size and weight. The spread of the net increases
with the towing speed within certain limits and the height of the net mouth tends to reduce in
relation to increased towing speed (Park 2007). Lee (1967) suggested that regular bottom
trawl boards can be converted to surface trawl boards by attaching hydrofoils to the top edges
of the boards. There are many manufactures available which are producing the different types
of otter boards, but their specifications are usually not available due to business secrets. The
area of the required otter boards for the prototype design is calculated as 3 m2 and their weight
as 390 kg, applying the formula prescribed by Ferro (1981). No formula is available on the
weight of the foot rope and sweep lines in mid-water or pelagic trawls; it has to be found out
by trial and error.
After designing the prototype trawl, the net was drawn in two dimensions (2D) according to
the FAO guidelines. The net plan also has been drawn in three dimensions (3D) using

Konkane
UNU-Fisheries Training Programme 38
different hanging ratios i.e. 0.5, 0.3 and 0.2 to see how the design functions in the water. The
design can be judged using the 3D techniques by visualising the net in different views. After
visualising the net behaviour in 3D, it has been decided to select the hanging ratio 0.3 due to
its appearance in comparison with 0.5 hanging and 0.2 hanging ratios. The selection of
hanging ratio totally depends on the designer’s view on the plan. The 3D designing software
is the best tool available to judge the net before taking decisions on the actual fabrication of
the net; it gives an overall idea on the net geometry when towed in water.
There are different types of mid-water and pelagic trawl designs available in the market but
their specifications are not available to refer or to discuses due to their business policy.
6 CONCLUSION
The resultant four panel prototype mid-water trawl net can be towed by the vessel MFV
Sagarika at speeds up to 4.3 nm/h. This is sufficient to catch slow and medium swimming
pelagic fish and sporadic catches of mackerel, oil sardine, carangids, ribbon fish and
barracuda etc. The knowledge acquired and software now available will help to respond to
necessary adjustments, which will be revealed in real condition tests in Indian waters. The 3D
using Design Cad 3D MAX 19 (2008) software results shows best appearance of the net in 0.3
hanging ratio, but it is a computer generated image. The resultant net plan needs to be tested
in real conditions. This study could be helpful to the Fishery Survey of India and to Indian
fishers.

Konkane
UNU-Fisheries Training Programme 39
ACKNOWLEDGEMENTS
I would like to thank Dr. Tumi Tomasson, Director of the United Nations University-
Fisheries Training Programme, for giving me an opportunity to be in this programme. My
sincere thanks to Mr. Thor Asgeirsson, Deputy Director, and staff members of the UNU-FTP
Mr. Konrad, Mrs. Sigridur and Mr. Gudni for their constant encouragement, guidance and
assistance. My thanks are due to the Director and staff of the Marine Research Institute and
University Centre of the Westfjords for providing me a good learning environment and
working facilities. Also I extend my sincere thanks to MATIS and all lecturers who
enlightened me in diverse subjects.
I am also thankful to my supervisor Mr. Einar Hreinsson for giving me valuable assistance to
make my study a success. Also I would like to forward my sincere thanks to Dr. Olafur Arnar
Ingolfsson, Mr. Peter Weiss and my fellow students: Roany Martinez, Kheng Makkhen and
Kingsley M. Thengo.
My special thanks to the Director General of the Fishery Survey of India, Dr. V.S.
Somvanshi, for allowing me to participate in this training programme. Also I extend my
gratitude to Mr. Gopalkrishnan, Deputy Director General; Dr. M.E. John, Zonal Director; Dr.
Ramalingam, Senior Fisheries Scientist; Dr. A.K. Bhargava, Senior Fisheries Scientist,
Fishery Survey of India and Secretary, Joint Secretary, Commissioners, Deputy
Commissioners of the Fisheries in the Ministry of Agriculture, New Delhi.
Last but not least my wife and children who have graciously put up with my extended
absence.

Konkane
UNU-Fisheries Training Programme 40
LIST OF REFRENCES
Alverson, D.L., Freebag, M.H., Murawski, S. A. And Pope, J.G., 1996. A global assessment
of fisheries by-catch and discards. FAO Fish. Tech. Pap. No.339, p.233.
[10/12/08]http://www.fao.org/docrep/003/T4890E/T4890E00.htm
Anon, 2008a. Fishery Survey of India 2008. Marine fish production2006-07. Field Guide For
Identification Of Marine Fishery Resources [2/12/08]< http://fsi.gov.in/englishver.htm>
Anon, 2008b. Ministry of Agriculture,DAHD&F (2008). Fisheries. Schemes for development
of fisheries sector. Centrally Sponsord Scheme on Development of Marine Fisheries,
Infrastructure and Post Harvest operations. [26/11/08]< www.dahd.nic.in>
Anon, 2008c. Central Marine Fisheries Research Institute. Research. Research Project.
Fishery Resource Assessment. Inhouse Project. Assessment of Exploited Marine Fishery
Resources. [10.12.2008]< http://www.cmfri.com>
Anon, 2008d. Icelandic Fisheries 2008. Icelandic Fisheries Information Centre of the
Icelandic Ministry of Fisheries and Agriculture. Main Species. Pelagic Species[15/12/08]
<http://www.fisheries.is/main-species/pelagic-fishes/>
Anon, 2008e. Central Marine Fisheries Research Institute. Marine Capture. Pelagic Fisheries.
Related links. Distribution of Major Pelagic Finfish Resources in the EEZ of India.
[10.12.2008]< http://www.cmfri.com>
Anon, 2008f. Indiaagronet 2008. Agriculture Research Centre. Agri. Technology. Fisheries.
Types of Commercial Fishes.[15/12/08]< http://www.indiaagronet.com>
Anon, 2008g. FishBase 2008. [26/12/08]<
http://www.fishbase.org/summary/Speciessummary.php?id=384>
Anon, 2009. Wikipedia 2009. Anchovy [5/01/09]<http://en.wikipedia.org/wiki/Anchovy>
Bethke, E., Fredrik, Cardinale, M. and Hakansson, N. 1999. Comparison of the selectivity of
three pelagic sampling traws in a hydroacoustic survey. Fisheries Research. Vol.44 (1): 15-
23pp.
Biju. k, Deepthi, G.R., 2006. Trawling and by-catch: Implications on marine ecosystem.
Current Science, Vol. 90 (7):922-931. [18/12/08] <
http://www.iisc.ernet.in/currsci/apr102006/922.pdf>
Buckingham, H. 1972. Design of trawls. World Fishing, 21(11):55-56.
FAO 1972.Catalogue of Fishing Gear Designs. Fishing News(Books)Ltd.,London : 191 pp.
FAO 2006. The State of World Fisheries and Aquaculture, World review of Fisheries and
Aquaculture. Fisheries resources: trends in production, utilization and trade . FAO ,
Rome,2007. [ 2/01/09] <http://www.fao.org/docrep/009/a0699e/A0699E00.htm>
Konkane
UNU-Fisheries Training Programme 41
FAO 2008. Fisheries Technology. Fish Capture Technology. Fishing Gears Methods. Fishing
Gear Type. Midwater otter trawls [26/11/08] (http://www.fao.org/fishery/geartype/309/en).
Ferro, R.S.T., 1981a. Calculation of the twine area of a trawl net. Scottish Fisheries
Information Pamphlets, (5), 6 pp.
Ferro, R.S.T., 1981b. Choosing the Size of Suberkurb Trawl Board to Suit a Pelagic-Type
Four-Panel Trawl. Scottish Fisheries Information Pamphlets, (6), 6 pp.
Flewwelling, P. & Hosch, G. 2006. Country review: India (East coast). In: The State of the
World Marine Capture Fisheries Management: Indian Ocean. C. De Young ed. FAO
Technical Report No. 488. Rome. 2006. 458p[29/11/08]<
http://www.fao.org/docrep/009/a0477e/a0477e0a.htm#TopOfPage>
Fridman, A.L., 1986. Calculation for Fishing Gear Designs. Fishing News (Books) Ltd.,
London : 241pp.
Fujishi, A. 1985. Japan-How big mesh save fuel. World Fishing, 34(7):6.
Gabriel, O., Lange, K., Dahm, E. And Wendt, T. (2005). Fish catching methods of the world.
Blackwell Science Ltd., Oxford, 523p.
Morgan, G., 2004, Country review: India (West coast) In: Review of the state of world marine
capture fisheries management: Indian Ocean. C.De. Young ed. FAO Technical Report No.
488. Rome, FAO. 2006. 458p.
[26/11/08]<http://www.fao.org/docrep/009/a0477e/a0477e0k.htm#TopOfPage>
Garner, J., 1974. How to make and set nets. Fishing news (Books) Ltd., London: 95pp
Hameed, S. M. And Boopendranath, M.R.(2000) Modern Fishing Gear Technology . Daya
Publishing house, Delhi.
Jaiswar, A.K., Chakraborty, S.K. and Swamy, R.P. (2001) Studies on the age, growth and
maturity rates of Indian Scad ,Decapterus russeli (from Mumbai waters). Fisheries Research,
Vol.53, Issue 3
Knieb, R. T., 1991.Indirect effects in experimental studies of marine soft sediment
communities. Am. Zoo., 31: 874-885.
Koyama, T., Kudo, T., Oba, O., 1981. Drag and sheer of the Suberkrub type trawl boards.
Bulletin of the National Research Institute of Fisheries Engineering 2, 95-103
Lee, K., Mukai, T., and Iida., K.2008. Verification of mean volume backscattering strength
obtained from acoustic Doppler current profiler by using sound scattering layer. Fisheries
Science, 74: 221-229
Lee, W. and Trent 1967. Attachment of hydrofoils to otter boards for taking surface samples
of juvenile fish and shrimp. Chesapeake Science. Volume 8(2):130-132
Konkane
UNU-Fisheries Training Programme 42
MacLennan, D.N. (1981) The drag of four panel demersal trawls, Fish. Res., 1:1.P.23-33
Misund, O.A. (1997) Underwater acoustics in marine fisheries and fisheries research. Reviews
in fish Biology and Fisheries. 7, 1-34
Nakamura, I. And N.V. Parin, 1993. FAO species catalogue, Vol. 15, Snake Mackerels and
Cutlassfishes of the world, Fisheries Synopsis No.125, Vol. 15
[19/12/08]<ftp://ftp.fao.org/docrep/fao/009/t0539e/t0539e00.pdf>
Panikkar, 1949. The Biology of Pelagic fishes [15/12/08]
<http://www.apfic.org/Archive/symposia/1949/02.pdf>
Park, H.H.(2007). A method for estimating the gear shape of a midwater trawl. Ocean
Engineering . 34(3-4): 470-478pp
Prado, J. (1990) Fisherman’s Workbook. FAO, Fishing News Books, Blackwell Scientific
Publications Ltd. Oxford.
Prado, J. 1977. Dragging and scrapping in bottom trawling. Peche Marit., No.1189: 223-225
Reid, A.J. (1977). A net drag formula for pelagic trawls, Scott. Fish.Res.Rep. No.7, 12p
Sainsbury, J. C. (1975) Commercial Fishing Methods.Fishing News ( Books) Ltd., London,
119p.
Scharfe,J., 1960. A new method for ‘aimed’ one-boat trawling in mid-water and on the
bottom. Studies and Reviews (General Fish Council for the Mediterranean) No.13
Scharfe,J., 1969. Fortschrittliche Fangtechnik fur die Schleppnetzfischerei. Allgemeine
Fischwirtschaftz-Zeitung, XXI,Jahresheft, ½, 41,42,44,46,48.
Shibata, K. (1971) Experimental measurements of target strength of fish. In Kristjonsson, H.,
ed. Modern Fishing Gear of the World, Vol. 2. London: Fishing News (Books), pp. 104–8.
Simmonds, J. And MacLennan, D. (2005) Fisheries Acoustics. Blackwell Science Ltd.,
London, 437pp.
Somvanshi, V.S. (2001) Issues concerning marine fisheries and fisheries management in
India. Fish code MCS/ Legal: Report of the National workshop on fisheries management.
(Goa, 12-17 Feb, 2001), pp.21-32
Srinath, M., V.N.Pillai, E.Vivekanandan and K.N.Kurup 2003. Demersal fish assemblage of
the Southwest Coast of India, p.163-186. In G.Silvestre,L.Garces, I.
Stobutzki,C.Luna,M.Ahmad,R.A.Valmonte-Santos, L.Lachica-Alino,P.Munro,V.Christensen
and D.Pauly(eds.)Assessment, Management and Future Directions for Cooastal Fisheries in
Asian Countries. WorldFish Center Conference Proceedings 67, 1120 p. [29/11/08]
<http://www.worldfishcenter.org/trawl/publications/assessment/pdf/Chapter-08-FA.pdf>
Strange, E. S., 1978. A Guide to the Preparation of Net Drawings. Scottish Fisheries
Information Pamphlets, (2), 18 pp.
Konkane
UNU-Fisheries Training Programme 43
Vivekanandan, E., 2002. Marine fisheries and fish biodiversity in india. Madras Research
Center of Central Marine Fisheries Research Institute, Chennai. 19pp.
Vivekanandan,E., M. Srinath,V.N.Pillai,S.Immanuel and K.N.Kurup 2003. Marine fisheries
along the southwest coast of india, p.757-792. In G.Silvestre,L.Garces, I.
Stobutzki,C.Luna,M.Ahmad,R.A.Valmonte-Santos, L.Lachica-Alino,P.Munro,V.Christensen
and D.Pauly(eds.)Assessment, Management and Future Directions for Cooastal Fisheries in
Asian Countries. WorldFish Center Conference Proceedings 67,1120p.
von Brandt, Scharfe, Steinberg 1960.Gezielte Fischereimit dem Einschiff-
Schwimmschleppnetz. Informationen for die Fischwirtschaft. VII, 1. Beihef, 1-50
Watson, R., C. Revenga and Y. Kura, 2006. Fishing gear associated with global marine
catches II Trends in trawling and dredging. Fisheries Research, 76: 103-111