microstructural characterization, meso-scale modeling and multiple-scale analysis of discretely...
TRANSCRIPT

Materials Science and Engineering A249 (1998) 62–70
Microstructural characterization, meso-scale modeling andmultiple-scale analysis of discretely reinforced materials
Somnath Ghosh *, Mingshan Li, Suresh Moorthy, Kyunghoon LeeDepartment of Aerospace Engineering, Applied Mechanics and A6iation, The Ohio State Uni6ersity, Columbus, OH 43210, USA
Abstract
This paper presents an overview of physically motivated computational models that are developed to link quantitativemetallography, meso- and multiple-scale analysis for discretely reinforced non-uniform composites. Three-dimensional microstruc-ture models are constructed by serially arranging the digitally acquired section micrographs obtained through serial sectioning.Characterization studies using spatial correlation, intensity and distribution functions show significant differences between 2D and3D images. Mesoscopic analyses for particle damage by cracking and splitting are carried out in 2D by the Voronoi cell finiteelement method (VCFEM) and validated against experimental observations. Finally, the microstructural VCFEM is coupled withstructural analysis models to concurrently predict evolution at macroscopic and microscopic scales. © 1998 Elsevier Science S.A.All rights reserved.
Keywords: Meso-scale modeling; Multiple-scale modeling; Voronoi cell finite element method
1. Introduction
The commercial use of particle reinforced metal ma-trix materials in aerospace, automotive and electronicapplications has increased significantly due to theirimproved thermomechanical properties, wear resistanceand weight reduction, and to their net-shape manufac-turability using conventional forming methods. How-ever, the presence of the second-phase particles oftenhas adverse effects on failure properties, such as frac-ture toughness, ductility, creep rupture and fatigue life.The microstructural composition in most compositematerials is not uniform, but rather contains localregions of clustering and directionality. Compositionalnon-uniformities are in the form of interparticle spac-ings, shapes, sizes, orientations and spatial distributionof reinforcements or constituent material properties.Nucleation and subsequent growth of localized damagethrough particle cracking or matrix localization arestrongly affected by this microstructural non-unifor-mity. Experimental studies with MMCs have estab-
lished that particles in regions of clustering orpreferential alignment have a greater propensity to-wards fracture than those in less dense regions, due tohigher stress concentration. Rigorous simulationsreflecting the details of actual microstructures, includ-ing shapes, sizes and distributions of heterogeneities areneeded for quantitative modeling and for the under-standing of these phenomena.
This paper presents an overview of physically moti-vated computational models that are developed to linkquantitative metallography, meso- and multiple-scaleanalysis for discretely reinforced composites. Through aserial sectioning procedure, three-dimensional mi-crostructure models are constructed for characteriza-tion by serially arranging the digitally acquired sectionmicrographs. Mesoscopic analyses for particle damageby cracking and splitting are carried out in two dimen-sions by the Voronoi cell finite element method(VCFEM). In VCFEM [1–4], the computational modelnaturally evolves by Dirichlet tessellation of the mi-crostructure to generate a morphology based networkof multisided Voronoi polygons (see Fig. 2(b)). EachVoronoi cell with an embedded heterogeneity is treatedas a finite element and requires no further discretiza-
* Corresponding author. Tel.: +1 614 2922599; fax: +1 6142927369; e-mail: [email protected]
0921-5093/98/$19.00 © 1998 Elsevier Science S.A. All rights reserved.
PII S0921-5093(98)00564-4

S. Ghosh et al. / Materials Science and Engineering A249 (1998) 62–70 63
tion. VCFEM formulation combines stress-based hy-brid finite element methods with important microme-chanics considerations, resulting in high efficiency.Finally, multiple-scale analysis of heterogeneous struc-tures is conducted by coupling conventional finite ele-ment codes with a mesoscopic VCFEM analysismodule [5,6]. Through the use of asymptotic expan-sions of displacement and stress fields, a heterogeneousboundary value problem is decomposed into a macro-scopic and microscopic analysis problem, as discussedin Refs. [5–8]. In this paper the commercial generalpurpose code ABAQUS is used for macroscopic anal-ysis at the level of structural geometry and appliedloads.
2. Quantitative metallography and characterization
2.1. The experimental methodology
The material system analyzed is based on a series ofAl–Si–Mg alloys developed at ALCOA TechnicalCenter by Hunt [9] for studying damage evolution inMMCs. This alloy system, fabricated by a powdermetallurgy process, can provide model materials forwhich the size and volume fraction of the reinforcingparticles and the strength of the matrix can be variedindependently. The specific systems analyzed here con-tain :10 and 20 wt.% of approximately equiaxed Siparticulates. For the 10 wt.% material, the mean parti-cle diameter is observed to be :5.12 mm, while thatfor the 20 wt.% material is found to be :7.65 mm. Toinduce particle cracking in the materials, uniaxial ten-sion tests are performed to different strain levels forincorporating different damage levels, as discussed in[9]. Samples considered in this study are pre-strainedto 1, 3, 4, 6 and 9% true strain.
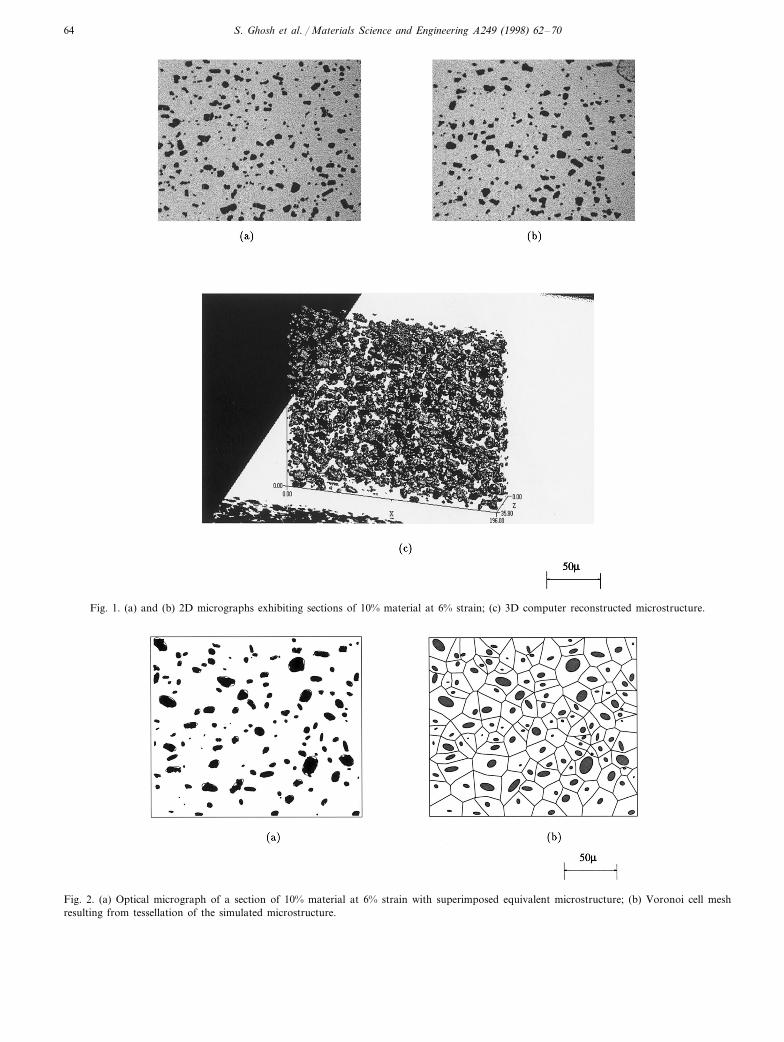
To obtain detailed three-dimensional microstructuralinformation on the particle-reinforced materials, a se-rial sectioning method is invoked for gradual removalof parallel layers of material. While this process istedious, it remains the best known method for accu-rate 3D visualization, image analysis and microstruc-ture reconstruction at the required resolution ofparticle size and spacing. The entire sequence of stepsin the serial sectioning procedure is presented in [10].Following the generation of sections of the specimen,2D images and contours are digitized and stored (seeFig. 1(a) and (b)). Once the micrographs of all sec-tions are digitized, they are computationally assembledto yield 3D microstructures, as shown in Fig. 1(c). Theprecise 3D location, shape, size and orientation ofeach particle is obtained at a fairly high resolutionwith this process.
2.2. Material characterization
Equivalent microstructures that approximate the ac-tual 2D and 3D morphology of micrographs, and yetare computationally less intensive, are generated. In thisprocess, each particle of arbitrary shape is replaced byan equivalent ellipse (ellipsoid for 3D), constructed byequating the 0th, 1st and 2nd moments of the actualparticles with those of the equivalent ellipses or ellip-soids. The moments of the actual particle are computedas the sum of moments of each pixel contained withinthe particle, while the moments of the equivalent ellipse(or ellipsoid) are represented in terms of standard geo-metrical parameters. The procedure yields (i) the cen-troid (xc, yc), (ii) lengths (a, b) of the major and minoraxes, and (iii) angular orientation u of the major axis ofthe equivalent ellipse (or ellipsoid). Details of this pro-cedure are discussed in Refs. [1,2]. An optical mi-crograph of a section with overlapped simulatedmicrostructures, and a tessellated mesh of 2D Voronoicells based on surface-to-surface tessellation are pre-sented in Fig. 2(a) and (b), respectively. Similar proce-dures are followed for generating three-dimensionalVoronoi cell meshes, which are not shown here.
Statistical functions of geometric descriptors, whichcan discriminate between patterns have been discussedin [3,11]. These functions are plotted for the 10% Vf
composite in Fig. 3. Cumulative distribution (F) andprobability density distribution ( f ) functions of thenear-neighbor distance (d) for various 2D sections andthe 3D microstructures are plotted in Fig. 3(a) and (b).The effect of including the third dimension is clearlyobserved, in that the 3D surface-to-surface distancesare much smaller than that inferred from section micro-graphs. The higher peaks at smaller S–S distances inthe f diagrams verify this fact. Shorter plateaux in F(d)and the corresponding zeros in f(d) for the 3D case,infer that distances for which nearest neighbor do notexist are actually smaller than they appear in 2D.Second-order intensity function K(r), defined as thenumber of additional points expected to lie within adistance r of an arbitrarily located point divided byoverall the point density, is an informative descriptor ofspatial distribution [3,11]. Additionally, the pair distri-bution function g(r)=1/2pr (dK(r)/dr), corresponds tothe probability g(r) dr of finding an additional pointwithin a circle of radius dr and centered at r. The twofunctions are plotted for the patterns in Fig. 3(c) and(d) and compared with a pure Poisson process forwhich K(r)=4/3 pr3 (3D), K(r)=pr2 (2D), and g(r)=1 (2D and 3D). It is interesting to note that while the2D and 3D forms of K(r) are obviously different, theK(r) functions for all the 2D sections are approximatelysimilar. With increased clustering, K(r) deviates fromthat for the Poisson process. The peaks in g(r) are morepronounced for the 3D distribution, indicating a
S. Ghosh et al. / Materials Science and Engineering A249 (1998) 62–7064
Fig. 1. (a) and (b) 2D micrographs exhibiting sections of 10% material at 6% strain; (c) 3D computer reconstructed microstructure.
Fig. 2. (a) Optical micrograph of a section of 10% material at 6% strain with superimposed equivalent microstructure; (b) Voronoi cell meshresulting from tessellation of the simulated microstructure.

S. Ghosh et al. / Materials Science and Engineering A249 (1998) 62–70 65
Fig. 3. (a) Cumulative distribution and (b) probability density functions of nearest neighbor distance; (c) second-order intensity and (d) pairdistribution functions; (e) 3D form factor and (f) 2D form factors for section micrographs and 3D microstructure of Al–Mg–Si composite.
greater likelihood of encountering additional particlesat lower radii for this volume fraction. Fig. 3(e) and (f)depict the form factor which is an effective means ofcharacterizing shapes, and is defined as (4p area)/perimeter2 in 2D and p/36 (volume2/surface3) in 3D.
This dimensionless factor is unity for circular/sphericalinclusions, and decreases in value with increasing shapeirregularity. A linear regression analysis is utilized toexpress the dependence of form factor on size, and theslope of this line or regression coefficient are shown in

S. Ghosh et al. / Materials Science and Engineering A249 (1998) 62–7066
Fig. 4. Simulated configurations of evolving damage at exx=6.0% with a Weibull distribution-based damage criterion; (b) histogram of damagedparticles at eyy=6.0%, by Weibull distribution criteria.
Fig. 5. Macroscopic tensile stress–strain response at two volume fractions.
Fig. 3(e) and (f). The form factor decreases with in-creasing size for 3D, suggesting that small inclusionsare more regular than the larger ones. A reverse trendis observed for the 2D form factors.
3. Microscopic VCFEM analysis
The Voronoi cell finite element model has been devel-oped for undamaged composite and porous materials in
Refs. [5,4] using the assumed-stress hybrid formulation.Independent assumptions on stress increments, Ds, aremade in the matrix and inclusion phases in each ele-ment, thus allowing stress discontinuities across theinterface. In two-dimensional analysis, the Airy’s stressfunction F(x, y) is commonly used. Incorporation ofkey features of micromechanics in the choice of stressfunctions significantly enhances computational effi-ciency. Moorthy and Ghosh [4] have introduced adecomposition of the matrix and inclusion stress func-

S. Ghosh et al. / Materials Science and Engineering A249 (1998) 62–70 67
tions into (a) purely polynomial functions Fpolym , Fpoly
c
and (b) reciprocal functions Frecm , for elements with
matrix and inclusion. The purely polynomial part of thestress functions Fpoly
m/c account for the far-field tractionson the element boundary dVe, while the reciprocalterms Frec
m facilitate stress concentration near the inter-face, accounting for their shapes. Compatible displace-ment increments are generated on each of theboundaries/interfaces dVe and dVc by interpolation interms of generalized nodal displacements. The formula-tion is extended to accommodate damage evolution inthe form of particle cracking or splitting in [1,2]. It isassumed that in particle cracking, the crack is com-pletely contained within the inclusion, while for particlesplitting, it’s tip extends nominally into the matrix. Thecrack in a fractured particle is realized as an ellipticalvoid with a high aspect ratio (:10–100). EachVoronoi cell element is amenable to change in topologyfrom two constituent phases (matrix and inclusions) inundamaged cells, to three phases (matrix, inclusion andcrack) in damaged cells. Complete particle cracking orsplitting is assumed to occur at the very onset ofdamage, and thus the problem of crack propagationwithin each inclusion is avoided.
3.1. Fracture criterion
Reinforcing particles are assumed to be brittle andare modeled as linear elastic materials, while the matrixmaterial is assumed to be ductile, and is modeled bysmall deformation J2 elasto-plasticity with isotropichardening. Microstructural damage initiation for theparticulate materials is assumed to be governed by theRankine criterion based on maximum principal stresses.In this criterion, a crack is initiated at right angles tothe principal stress direction, when the maximum prin-cipal stress in tension exceeds a critical fracture stressscr. In the computational procedure, complete particlecracking or splitting is assumed to occur in the form ofan elliptical void, as soon as the principal tensile stressreaches scr. In the case of particle cracking, the cracktip coincides with the interface and is completely con-tained in the particle, while for particle splitting, itextends nominally into the matrix. A parameterdcrack=crack length/inclusion dimension distinguishesbetween complete cracking and splitting of inclusions.A fully cracked inclusion corresponds to a valuedcrack=1, whereas splitting is represented by dcrack=1.004.
Various experimental studies on metal matrix com-posites [9,12,13], suggest that the critical stress scr forparticle fracturing is not only material-dependent, but isalso influenced by the particle size due to the existenceof microcracks. Micrographs of damaged compositesindicate that larger particles tend to fracture at lowerload levels than smaller particles. To account for the
size effect in particle cracking, and hence flaw size anddistribution, a criterion that uses statistical functions tocorrelate particle size, stress levels and failure is consid-ered [13,14]. It is based on a Weibull distribution, inwhich the probability of particle fracture Pf(A, s) isrelated to the particle volume (area in 2D) A and themaximum principal stress sI as
Pf(A, s)=1−e−A(sI/scr)m
, (1)
where scr and m are two material parameters in theWeibull distribution. The Weibull parameters scr and mmay be calculated by correlating geometric features andsimulated stresses with experimental observations.
3.2. Damage in non-uniform microstructures
Material properties of the constituents in the 20 wt.%Al–Si–Mg composite are
3.2.1. Al–Si–Mg matrixYoung’s modulus E=69 GPa, Poisson’s ratio n=
0.33, and the post yield elastic–plastic behavior (non-linear isotropic hardening) is obtained from data onT4-matrix presented in figure (8) of Kiser et al. [13].
3.2.2. Si inclusionsYoung’s modulus E=161 GPa, Poisson’s ratio n=
0.2. Weibull parameters are calculated to be m=2.37and scr=2.12 GPa for a probability of failure Pf(A, s)in Eq. (1) assumed to be \0.95. Fig. 4(a) shows aVCFEM simulation of cracked particles at 6% overallstrain, while a comparison of simulation results withactual micrographic observations is made in histograms(Fig. 4(b)). Particle splitting is assumed in these simula-tions. Fractions for the actual micrograph are shown ingrey with dashed outline. The histograms indicate thatthe Weibull distribution-based criterion provides agood agreement with the micrographs at all size ranges.The tensile response with particles cracking is shown inFig. 5, in which VCFEM results are compared withexperimental results of Kiser et al. [13]. Despite the factthat VCFEM analysis is in 2D, while experimentalresults are for 3D, the comparisons are quite satisfac-tory. The cross-over point at which the 20 wt.% Vf
composite becomes less stronger than the 10 wt.% Vf
composite, is approximately at exx:1.2–1.8%, whichcompares well with the experimental value of exx:1.8%. The consistently higher stress capacity forVCFEM predictions may be attributed to the con-strained plastic flow arising from plane strain con-straints, and also to the fact that matrix softening is notallowed in the present simulation. The stress–strainbehavior of a uniform (square edge) microstructurewith a single circular inclusion of 10 and 20 vol.%,respectively, are also plotted. The 10 vol.% uniformcomposite does not crack for the range of strains

S. Ghosh et al. / Materials Science and Engineering A249 (1998) 62–7068
Fig. 6. Contour plots of (a) particle fracture probability by the Weibull damage criterion immediately before exx=6.0%, (b) effective plastic strain(%) exx=6.0%.
considered and predicts a stiff response. Splitting of theparticle in the 20 wt.% Vf composite results in anabrupt drop in load capacity to yield unreasonablepredictions. Contour plots of particulate failure proba-bility and effective plastic strains are illustrated in Fig.6(a) and (b), respectively. Damaged particles are inwhite with cracks in Fig. 6(a), and the contour plots arefor undamaged particles indicating the likelihood ofdamage. The plastic strain distribution in Fig. 6(b)shows localized bands of severe deformations emanat-
ing from crack tips and propagating to neighboringparticles with cracks.
4. Multiple-scale modeling
In many structural components made of heteroge-neous materials, the characteristic dimensions l of therepresentative material element (RME) are very smallin comparison with the characteristic length L of thebody, and the scale ratio is represented by a very smallpositive number e= l/L. A high level of heterogeneityin the microstructure causes a rapid variation of dis-placements and stresses in a small neighborhood e ofthe macroscopic point x, and consequently, all variablesare assumed to exhibit dependence on both lengthscales, i.e. Fe=F(x, x/e). The superscript e denotesassociation of the function with both length scales. Inmost of the computational work on homogenization[15–17], a periodic repetition of the microstructureabout a macroscopic point x is assumed, thereby mak-ing the dependence of F on y (=x/e), periodic. Inhomogenization theory, the Y-periodic displacementrate field is approximated by an asymptotic expansionwith respect to parameter e,
u; e(x)=u; 0(x, y)+eu; 1(x, y)+e2u; 2(x, y)+ . . . (2)
This relationship, in conjunction with the periodicityconditions, yield two sets of boundary value problems,each at the macroscopic and microscopic levels. Thismethod of multiple-scale coupling has been achievedwith microstructural VCFEM analysis in Refs. [5,6]. Ineach increment of the macroscopic strains, the micro-scopic VCFEM module is executed for two purposes,viz. (i) to evaluate the microscopic stress increments
Fig. 7. (a) Macroscopic model having three different microstructures,(b) square edge packing in region A, (c) hexagonal packing in regionB.

S. Ghosh et al. / Materials Science and Engineering A249 (1998) 62–70 69
Fig. 8. Effective plastic strain distribution; (a) macroscopic strain for homogeneous microstructure, (b) macroscopic strain for heterogeneousmicrostructure, (c) microscopic RME strain at point A, (d) microscopis RME strain at point B.
from given values of the macroscopic strain e at thebeginning of the step, and its increment De, and (ii) tocalculate the instantaneous homogenized tangent mod-ulus Eijkl
H at the end of the increment. The generalpurpose commercial code ABAQUS is chosen to serveas the macroscopic analysis program. The material
constitutive relation at each integration point of themacroscopic ABAQUS elements is input through thehomogenization process by using results from the mi-croscopic VCFEM analysis, through an interface cre-ated through UMAT in ABAQUS. Details of thisprocedure are given in Ref. [5].

S. Ghosh et al. / Materials Science and Engineering A249 (1998) 62–7070
4.1. A multiscale example
This problem involves a connecting rod with differ-ent microstructrures at different regions as shown inFig. 7. Region A consists of a square edge packingRME, region B has a hexagonal packing RME, whilethe remainder of the connecting rod has a homoge-neous aluminum microstructure. The material composi-tion for the heterogeneous regions A and B is 20%boron–aluminium composite, with the followingpropertiesBoron fiber: Young’s modulus, Ec=344.5 GPa; Pois-son ratio, nc=0.26.Aluminum matrix: Young’s modulus, Em=68.9 GPa;Poisson ratio, nm=0.32; initial yield stress, Y0=94MPa; post yield flow rule eeqv=Y0/Em(seqv/Y0)5.Boundary conditions on the top half of the connectingrod being modeled are shown in Fig. 7(a). The rod isassumed to be loaded by a linearly varying internalpressure, applied on one half of the inner race as shownin Fig. 8(a), representing contact with the crank shaft.At the end of ten uniform load increments, the pressurevariation stands at zero at the top to a maximum of0.075 GPa at the center. For comparison, the sameproblem is also executed with a purely homogeneous,aluminum microstructure. One hundred and forthy-sixQUAD4 elements are used in ABAQUS for macro-scopic model, and only one Voronoi cell element isrequired for microscopic analysis. The effective plasticstrains for the homogeneous and heterogeneous rodare, respectively, depicted in Fig. 8(a) and (b), and Fig.8(c) and (d) depict the corresponding microstructuralstrains at macroscopic points A and B. It is observedthat the effective macroscopic stress is relatively unal-tered by the change from homogeneous to heteroge-neous microstructure, though the microstructural stressis significantly higher especially for the square edgepacking. However, the microstructure alteration has amarked effect on the effective macroscopic plasticstrain. The maximum value of plastic strain reducesfrom 0.011361 in the homogeneous problem to0.008217 at the same point A, for the heterogeneouscase.
5. Conclusions
This paper presents an overview of physically basedmultiple-scale computational models for characteriza-tion and analysis of non-uniform composite materials.Various components of the work include quantitativemetallography and material characterization, theVoronoi cell finite element model (VCFEM) for meso-scale modeling and multiple-scale modeling usingasymptotic homogenization. In the experiments phase,
serial sectioning procedures are performed to obtain aseries of optical micrographs from which three-dimen-sional microstructure models are computationally con-structed. Characterization studies using spatialcorrelation, intensity, and distribution functions showsignificant difference between 2D and 3D images.Meso-scale damage modeling with the VCFEM formicrostructural damage evolution establish significantadvantages of this method in modeling composites withmorphological non-uniformities. Particle fracture issuccesfully modeled and validated against experimentalobservations. Finally, the microstructural VCFEM iscoupled with conventional structural analysis models toconcurrently predict evolution of deformation atmacroscopic and microscopic scales. Strong effects ofdifferent microscopic morphology on the mechanicalresponse are observed at both scales.
Acknowledgements
This work has been sponsored by the Mechanics andMaterials Program of National Science Foundationthrough a NSF Young Investigator grant (Grant No.CMS-9457603), by Army Research Office (Grant No.DAAHO4-95-1-0176) and by the ALCOA TechnicalCenter.
References
[1] S. Moorthy, S. Ghosh, Comput. Methods Appl. Mech. Eng. 151(1997) 377.
[2] S. Ghosh, S. Moorthy, Acta Metall. Mater., (1998) in press.[3] S. Ghosh, Z. Nowak, K. Lee, Acta Metall. Mater. 45 (6) (1997)
2215.[4] S. Moorthy, S. Ghosh, Int. J. Numer. Methods Eng. 39 (1996)
2363.[5] S. Ghosh, K. Lee, S. Moorthy, Comput. Methods Appl. Mech.
Eng. 132 (1996) 63.[6] S. Ghosh, K. Lee, S. Moorthy, Int. J. Solids Struct. 32 (1) (1995)
1995.[7] A. Benssousan, J.L. Lions, G. Papanicoulau, Asymptotic Analy-
sis for Periodic Structures, North Holland, Amsterdam, 1978.[8] E. Sanchez-Palencia, Lecture Notes in Physics, vol. 127,
Springer, Berlin, 1980.[9] W.H. Hunt, Ph.D. Thesis, Carnegie Mellon University, 1992.
[10] M. Li, S. Ghosh, T.N. Rouns, H. Weiland, O. Richmond, W.Hunt, unpublished research.
[11] S. Ghosh, Z. Nowak, K. Lee, Comput. Sci. Technol. 57 (1997)1187.
[12] W.H. Hunt, J.R. Brockenbrough, P.E. Magnusen, Scr. Metall.Mater. 25 (1991) 15.
[13] M.T. Kiser, F.W. Zok, D.S. Wilkinson, Acta Metall. Mater. 9(1996) 3465.
[14] W.A. Curtin, J. Am. Ceram. Soc. 77 (1994) 1075.[15] J.M. Guedes, N. Kikuchi, Comput. Methods Appl. Mech. Eng.
83 (1991) 143.[16] J.M. Guedes, Ph.D. Thesis, University of Michigan, 1990.[17] F. Devries, H. Dumontet, G. Duvant, F. Lene, Int. J. Numer.
Methods Eng. 27 (1989) 285..