microrate- the state of microfinance investment 2013 · the state of microfinance investment 2013...
TRANSCRIPT

The State of Microfinance Investment 2013 Survey and Analysis of MIVs – 8th Edition
! ! !!
! !!!!!!!!!!!!!!!!!!!!!!!! ! !
The State of Microfinance Investment 2013
2
About MicroRate!MicroRate is the first rating agency dedicated to evaluating performance and risk in microfinance institutions (MFIs) and microfinance funds (Microfinance Investment Vehicles – MIVs). As the most respected organization of its kind, MicroRate has conducted over 750 ratings of 200+ MFIs throughout Latin America, Africa, Europe, and Central Asia. MicroRate is a leading social rater and has also become the largest MIV evaluator in the industry. About MicroRate Investor Services MicroRate provides investors, fund managers and philanthropists tailored evaluations, benchmark data and market intelligence across the microfinance and impact investment landscape. MicroRate is the global leader in the analysis of MIVs, with 75+ fund evaluations and a database of fund information and benchmark data unequaled in the industry. Reporting and analytical services rely on a proprietary fund evaluation methodology – PRSM™ – that takes a holistic approach to assessing all four key areas of fund excellence: financial Performance, Risk, Social performance, and Management. Thanks to all the contributors who made this industry research report possible:
MicroRate Others Sebastian von Stauffenberg Daniel Rozas Damian von Stauffenberg Rebecca Spradlin Stephen Brown Antonio Vargas Katie Marney
Copyright © 2013 MicroRate Incorporated (“MicroRate”). All rights reserved. This report may be reproduced provided that attribution is given to “MicroRate.” Disclaimer: Please note this report was compiled primarily on information provided by the MIVs listed in Appendix I. The information is provided for informational purposes only and without any obligation, whether contractual or otherwise. No warranty or representation is made as to the correctness, completeness and accuracy of the information given. Data from previous years’ reports may differ from infor-mation presented here as new information was collected.
THE STATE OF MICROFINANCE INVESTMENT 2013 Survey and Analysis of MIVs – 8th Edition
3
Foreword This marks the 8th consecutive year that MicroRate has conducted its survey of microfinance investment vehicles (MIVs), which play a key role in connecting private and public capital with microfinance institutions (MFIs) around the world. Despite the ups and downs of the microfinance market, these market intermediaries have consistently con-tinued to play this important role and we look forward to providing continued coverage of their activities in the years to come. This year’s survey includes responses of 92 MIVs, out of a total 102 contacted. Of the estimated $8.5 billion in total global assets under management (AUM) as of year-end 2012, the 92 MIVs represented here account for $8.1 billion, or 95% of global AUM. We would like to thank every survey participant for his or her time and contributions. In particular, we would also like to thank those MIV fund managers and staff members who took the time to speak with us directly, sharing their insights on the key issues affecting their work during the 2012-2013 period, as well as expectations for the future. Their feedback adds invaluable depth and context to the survey statistics, and we would like to recognize each of them:
• Maya Chorengel, Elevar • Hugo Couderé, Alterfin • Brian Cox, MFX Solutions • Gil Crawford, MicroVest • Paul DiLeo, Grassroots Capital • Loïc De Cannière, Incofin • Mark van Doesburgh, Triple Jump
• Peter Fanconi, BlueOrchard Finance • Songbae Lee, Calvert Foundation • Geert Peetermans, Incofin • Christian Speckhardt, responsAbility • Kaspar Wansleben, Luxembourg Microfinance
and Development Fund
MicroRate would like to give special recognition to the following sponsors of this year’s report. Thank you for your support in increasing the awareness and transparency of our industry.
! ! !!
! !!!!!!!!!!!!!!!!!!!!!!!!! ! !

4
!
Highlights!• MIV growth continues along the “new normal”
growth trajectory: total asset growth +17%, mi-crofinance portfolio +18%.
• Liquidity declined to 8.2% of total assets, down from a high of 14.6% in 2009.
• Growth in all regions, with Latin America (24%) and East Asia/Pacific (23%) posting the strong-est growth, and moderate growth in South Asia (12%), Africa (12%), and Europe/Central Asia (10%).
• Azerbaijan (45%), Georgia (78%), Mongolia (38%), and Bosnia (43%) were among the fast-est-growing countries.
• Funds continue to mature, with investors redeeming $438 million in 2012.
• MIV sector continuing to deconsolidate, with largest MIVs continuing to lose market share. Similar trend among fund managers.
• Equity investment grew by $77 million, but declined as a share of the portfolio from 20% to 18%.
• Institutional investors continue to dominate, with 56% share of total investment.
!
0.7!1.5!
3.1!3.8!
4.2!4.7!
5.3!6.2!
0.5!
0.5!
0.8!
1.1!
1.8!1.7!
1.7!
1.9!
0!
10!
20!
30!
40!
50!
60!
70!
80!
90!
100!
$0!
$1!
$2!
$3!
$4!
$5!
$6!
$7!
$8!
$9!
2005! 2006! 2007! 2008! 2009! 2010! 2011! 2012!
#"of"survey"par-cipants"
Assets"(in"USD"billions)"
MIV"Universe"
Other!Assets!
MF!Por9olio!
Survey!parBcipants!

THE STATE OF MICROFINANCE INVESTMENT 2013 Survey and Analysis of MIVs – 8th Edition
5
The growth of MIVs, both in terms of assets and microfinance portfolio continues on its “new normal” path. MIV assets grew 17% since the prior year, adding $908 million to the sector’s outstanding microfinance portfolio.1 This brings the total portfolio to an all-time high of $6.2 billion and total assets of $8.1 billion.
Since 2009 MIV microfinance portfolios have grown between 11% and 17% year-over-year (YoY). The 57% average assets growth during the boom years of 2005-07 is increasingly receding in memory, and there is no expectation for its return. Nevertheless, the seemingly moderate growth masks a much larger shift in the industry. The increase of $908 million in 2012 is larger than any year on record, except 2007, when it recorded growth of $1.4 billion. That said, it should be noted that this growth is significantly lower than the growth of MFI loan portfolios reported to the MIX Market, which have shown an average YoY growth of 28% during 2009-11.2
It is not just the growth rate that has shown greater sta-bility in the past few years. The funds’ liquidity position has also declined to 8.2%, down from a high of 14.6% during the 2009-10 “crisis” years. Liquidity-wise, the funds are entering into a more sustainable period, with assets and portfolios growing at nearly identical rates (18% vs. 17%) as more funds maintain cash positions at or below 10%.
Other areas of fund management likewise show an evo-lution. Local currency lending has become an industry norm, eliminating many of the concerns over MFIs’ exposure to currency fluctuations, and strengthening MIVs’ competitive position. Gil Crawford of MicroVest points out that “demand for local currency continues to grow, especially in Africa.” Meanwhile, Brian Cox of
MFX Solutions, a company dedicated to hedging microfinance foreign currency positions, reports that the company has now hedged $460 million in local currency exposure since their founding in 2010.
Regional Differences – no major shi f t s in 2012 In 2012, there was no strong regional shift. The acute period of crisis has passed in India, and though the market has by no means regained its earlier momentum, it is resuming growth, contributing $15 million (6%) to investors’ micro-finance portfolios during the year. Opinions regarding the outlook for growth in the region are mostly positive. Peter Fanconi of Blue Orchard believes “Certain Indian states such as Andhra Pradesh remains a potential red flag, while we see opportunities for investment in others,” and Mark van Doesburgh of Triple Jump, says that “South Asia is interesting again, especially for debt, though Pakistan is showing potential for equity as well.”
In Latin America, the largest region by market share, and home to the largest microfinance investment market – Peru, which accounts for 10% of total MIV portfolios – growth has continued apace. The region’s market share continues to dominate, at approximately 36.5% of global microfinance investing, and it contributed 44% of MIV portfolio growth for the year. However, investor sentiment on the region is divided – many cited continuing growth in the re-gion, especially in Central America. According to Kaspar Wansleben of LMDF, “Latin America still has room for
!!!!!!!!!!!!!!!!!!!!!!!!!!!!!!!!!!!!!!!!!!!!!!!!!!!!!!!!1 Total amounts are expressed in USD, using year-end currency conversion rates for each year. However, to factor out the effect of changing exchange rates, growth rates are reported on a fixed conversion rate methodology, using rates as of year-end 2006. 2 Growth in 2012 was technically negative, but this is due to data for the year still being incomplete.!
%!Cash!!!(leH!axis)!
%!MF!Por9olio!(right!axis)!
65%!
70%!
75%!
80%!
85%!
0%!
5%!
10%!
15%!
20%!
2007! 2008! 2009! 2010! 2011! 2012!
Liquidity"Con-nues"to"Decline"
6
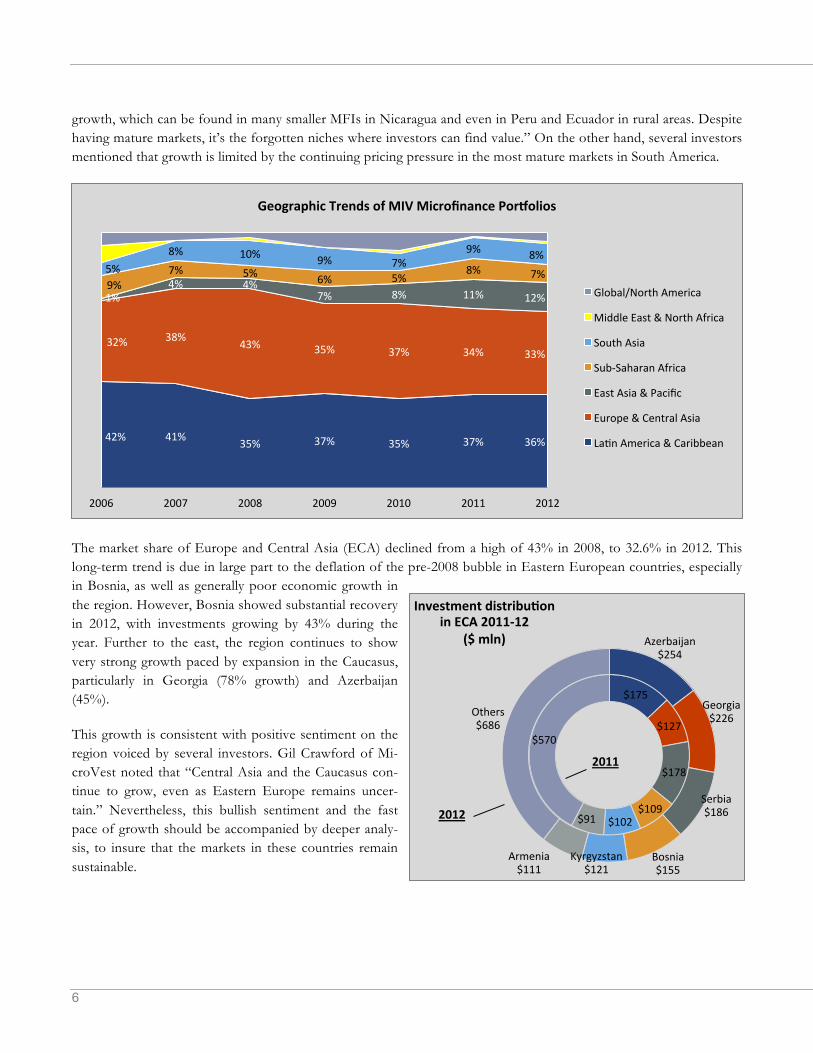
growth, which can be found in many smaller MFIs in Nicaragua and even in Peru and Ecuador in rural areas. Despite having mature markets, it’s the forgotten niches where investors can find value.” On the other hand, several investors mentioned that growth is limited by the continuing pricing pressure in the most mature markets in South America.
The market share of Europe and Central Asia (ECA) declined from a high of 43% in 2008, to 32.6% in 2012. This long-term trend is due in large part to the deflation of the pre-2008 bubble in Eastern European countries, especially in Bosnia, as well as generally poor economic growth in the region. However, Bosnia showed substantial recovery in 2012, with investments growing by 43% during the year. Further to the east, the region continues to show very strong growth paced by expansion in the Caucasus, particularly in Georgia (78% growth) and Azerbaijan (45%).
This growth is consistent with positive sentiment on the region voiced by several investors. Gil Crawford of Mi-croVest noted that “Central Asia and the Caucasus con-tinue to grow, even as Eastern Europe remains uncer-tain.” Nevertheless, this bullish sentiment and the fast pace of growth should be accompanied by deeper analy-sis, to insure that the markets in these countries remain sustainable.
42%! 41%! 35%! 37%! 35%! 37%! 36%!
32%! 38%! 43%! 35%! 37%! 34%! 33%!
1%!4%! 4%!
7%! 8%! 11%! 12%!9%!
7%! 5%! 6%! 5%!8%! 7%!5%!
8%! 10%! 9%! 7%!9%! 8%!
2006! 2007! 2008! 2009! 2010! 2011! 2012!
Geographic"Trends"of"MIV"Microfinance"PorGolios"
Global/North!America!
Middle!East!&!North!Africa!
South!Asia!
SubUSaharan!Africa!
East!Asia!&!Pacific!
Europe!&!Central!Asia!
LaBn!America!&!Caribbean!
$175!
$127!
$178!
$109!$102!$91!
$570!
Azerbaijan!$254!
Georgia!$226!
Serbia!$186!
Bosnia!$155!
Kyrgyzstan!$121!
Armenia!$111!
Others!$686!
Investment"distribu-on"
in"ECA"2011M12"
($"mln)"
2011"
2012"

THE STATE OF MICROFINANCE INVESTMENT 2013 Survey and Analysis of MIVs – 8th Edition
7
MIVs increased their East Asian exposure by $111 million, a growth of 23.4%. The region continues to be dominated by Cambodia and Mongo-lia, which together account for 80% of MIVs total exposure in East Asia. Indeed, this concentration is exacerbated by the relatively small size of these countries: Cambodia, a country of 15 million, accounts for 6.4% of total MIV portfolios, while Mongolia, with a population of just 2.9 mil-lion, accounts for 3.0% of total MIV portfolios. The MIV microfinance investment in these countries is equivalent to 2.3% and 1.4% of GDP for Cambodia and Mongolia, respectively.
The concentration of investment in Cambodia prompted three asset managers active in the region – Blue Orchard, Incofin, and Oikocredit – to study over-indebtedness in the region. The findings from their survey showed a country heavily penetrated by microcredit with pockets of over indebtedness. With a credit bureau now operational (since December 2011), Songbae Lee of Calvert Foundation reflects that “though it’s been a concern for us, Cambodia has managed the crisis and the outlook looks more promising.”
Sub-Saharan Africa continues to be a focus area for investors. However, the region, though growing, has actually lost some market share during the year, dropping from 8.0% to 7.0% of MIV microfinance portfolios – a reflection of difficult market conditions in the traditionally strong East African market. According to Geert Peetermans of Incofin, “in Africa, it’s still hard to find good, risk-priced deals.” Kaspar Wansleben of LMDF agrees: “Africa has very high valuation premiums that have little relationship with the real business prospects. Valuations are artificially inflated and lead to overly aggressive business plans.”
As in prior years, countries in the Middle East and North Africa continue to play no significant role in MIV microfinance portfolios (0.7%), a re-flection of longstanding obstacles to investing in the region’s micro-finance sector and more recent instability following the Arab spring. Few investors mentioned MENA, though Peter Fanconi of Blue Orchard is seeing increasing investment opportunities as well as a growing appetite from investors. BlueOrchard has allocated substantial resources in order to launch a regional MENA fund in 2014.
Investments and Redemptions – heal thy churn in 2012 Funds have continued to mature in 2012, and $438 million were redeemed during the year, only slightly less than in 2011 ($467 million). Nearly a quarter of this sum came from the sale of Accion Investments in Microfinance to Bam-boo Investments, an unprecedented microfinance equity sale worth $100 million. The remaining outflows came from funds scheduled to mature in 2012 or 2013, as well as some unscheduled redemptions.
10.2%!
6.4%!
5.3%!
5.1%!
4.5%!
3.7%!
3.7%!
3.6%!
3.5%!
3.1%!
3.0%!
2.6%!
2.4%!
2.3%!
2.2%!
2.1%!
1.9%!
1.7%!
1.6%!
1.5%!
1.3%!
1.3%!
1.3%!
1.2%!
1.2%!
1.0%!
0.9%!
0.9%!
0.9%!
0.9%!
Peru!
Cambodia!
India!
Azerbaijan!
Georgia!
Serbia!
Ecuador!
Mexico!
Bolivia!
Bosnia!
Mongolia!
Colombia!
Kyrgyzstan!
Paraguay!
Armenia!
Romania!
Tajikistan!
Kenya!
Turkey!
Russia!
Costa!Rica!
Kazakhstan!
Kosovo!
Sri!Lanka!
Nicaragua!
Honduras!
Albania!
Tanzania!
Moldova!
Uganda!
Other!
Microfinance"PorGolio,""
by"Country"
18.6%!
8
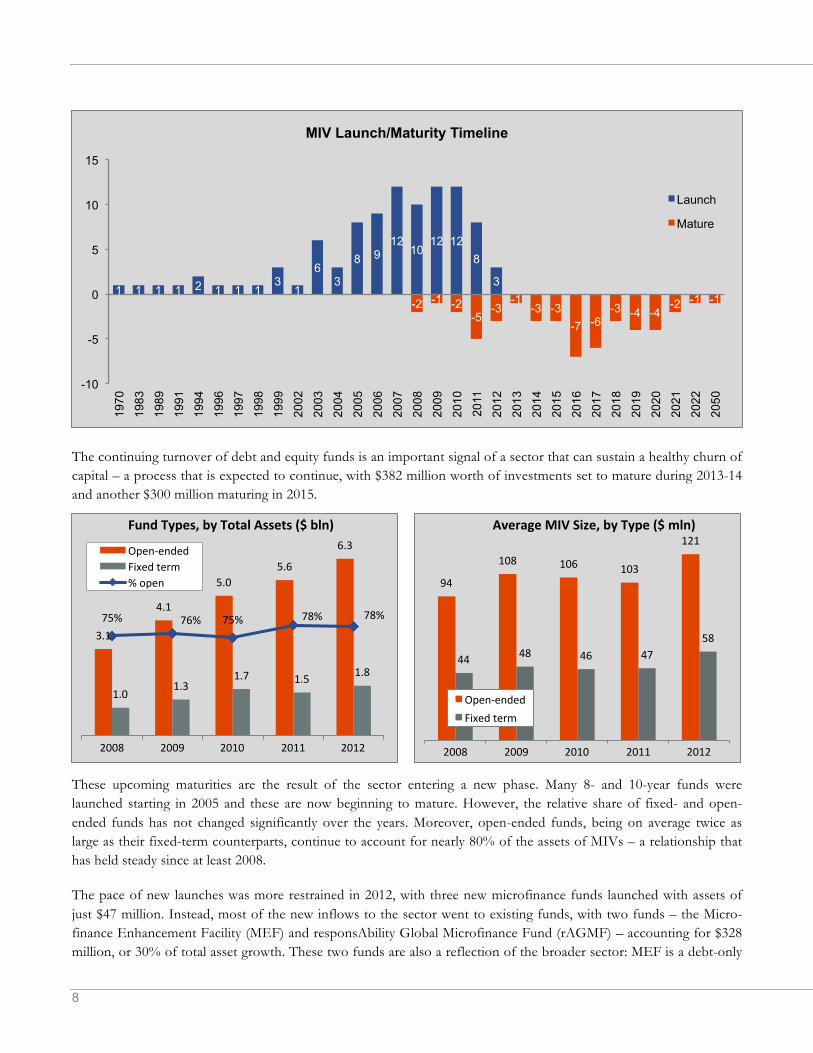
The continuing turnover of debt and equity funds is an important signal of a sector that can sustain a healthy churn of capital – a process that is expected to continue, with $382 million worth of investments set to mature during 2013-14 and another $300 million maturing in 2015.
These upcoming maturities are the result of the sector entering a new phase. Many 8- and 10-year funds were launched starting in 2005 and these are now beginning to mature. However, the relative share of fixed- and open-ended funds has not changed significantly over the years. Moreover, open-ended funds, being on average twice as large as their fixed-term counterparts, continue to account for nearly 80% of the assets of MIVs – a relationship that has held steady since at least 2008.
The pace of new launches was more restrained in 2012, with three new microfinance funds launched with assets of just $47 million. Instead, most of the new inflows to the sector went to existing funds, with two funds – the Micro-finance Enhancement Facility (MEF) and responsAbility Global Microfinance Fund (rAGMF) – accounting for $328 million, or 30% of total asset growth. These two funds are also a reflection of the broader sector: MEF is a debt-only
-2 -1 -2 -5
-3 -1
-3 -3 -7 -6
-3 -4 -4 -2 -1 -1
1 1 1 1 2 1 1 1 3
1
6 3
8 9 12
10 12 12
8
3
-10
-5
0
5
10
15
1970
19
83
1989
19
91
1994
19
96
1997
19
98
1999
20
02
2003
20
04
2005
20
06
2007
20
08
2009
20
10
2011
20
12
2013
20
14
2015
20
16
2017
20
18
2019
20
20
2021
20
22
2050
MIV Launch/Maturity Timeline
Launch
Mature
3.1!
4.1!
5.0!5.6!
6.3!
1.0!1.3!
1.7! 1.5! 1.8!
75%! 76%! 75%! 78%! 78%!
2008! 2009! 2010! 2011! 2012!
Fund"Types,"by"Total"Assets"($"bln)"
OpenUended!Fixed!term!%!open! 94!
108! 106! 103!
121!
44! 48! 46! 47!58!
2008! 2009! 2010! 2011! 2012!
Average"MIV"Size,"by"Type"($"mln)"
OpenUended!Fixed!term!
THE STATE OF MICROFINANCE INVESTMENT 2013 Survey and Analysis of MIVs – 8th Edition
9
fund, supported exclusively by development finance institutions, while rAGMF is a hybrid (debt and equity) fund, backed by a mix of institutional and retail investors. Both are managed by responsAbility Social Investments, though MEF is also co-managed by two other leading microfinance fund managers: Blue Orchard Finance and Cyrano Man-agement.
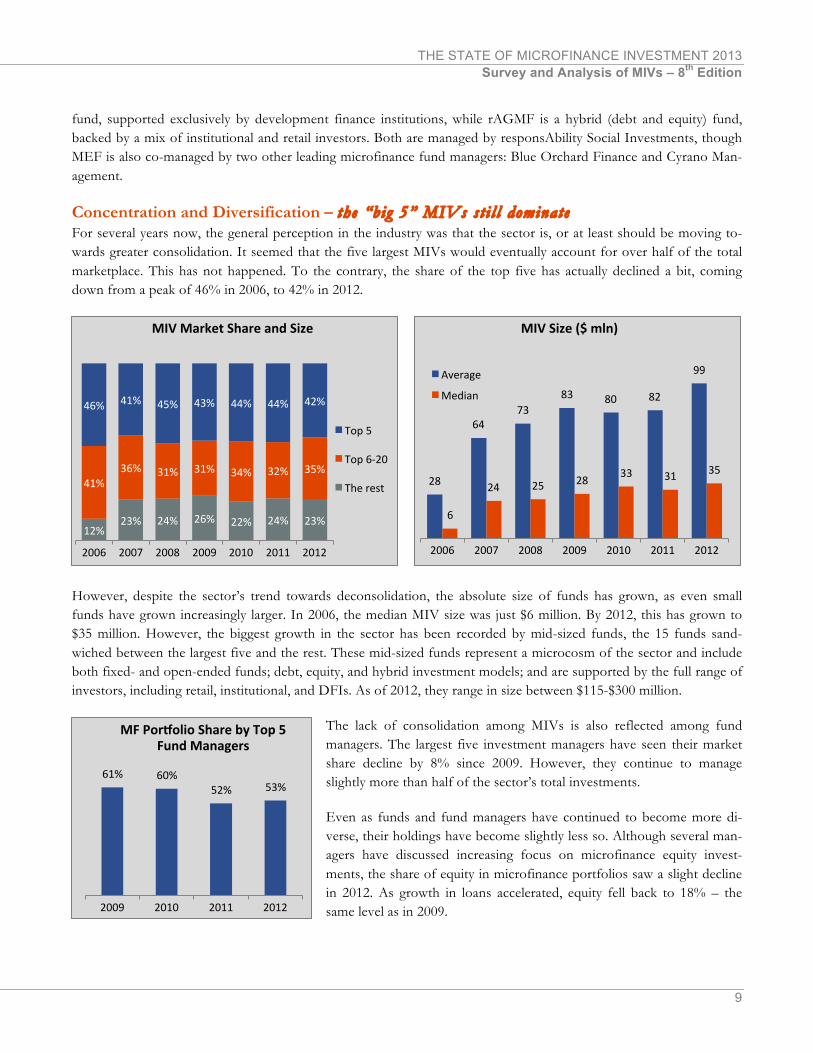
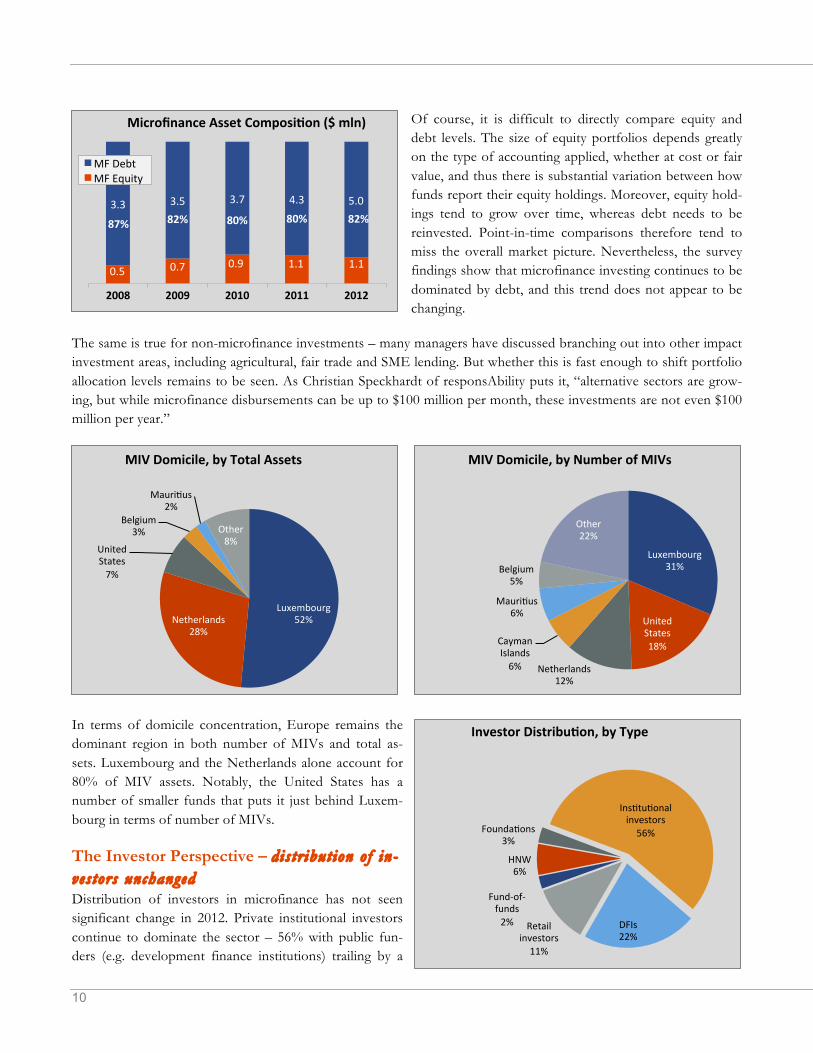
Concentration and Diversification – the “big 5” MIVs st i l l dominate For several years now, the general perception in the industry was that the sector is, or at least should be moving to-wards greater consolidation. It seemed that the five largest MIVs would eventually account for over half of the total marketplace. This has not happened. To the contrary, the share of the top five has actually declined a bit, coming down from a peak of 46% in 2006, to 42% in 2012.
However, despite the sector’s trend towards deconsolidation, the absolute size of funds has grown, as even small funds have grown increasingly larger. In 2006, the median MIV size was just $6 million. By 2012, this has grown to $35 million. However, the biggest growth in the sector has been recorded by mid-sized funds, the 15 funds sand-wiched between the largest five and the rest. These mid-sized funds represent a microcosm of the sector and include both fixed- and open-ended funds; debt, equity, and hybrid investment models; and are supported by the full range of investors, including retail, institutional, and DFIs. As of 2012, they range in size between $115-$300 million.
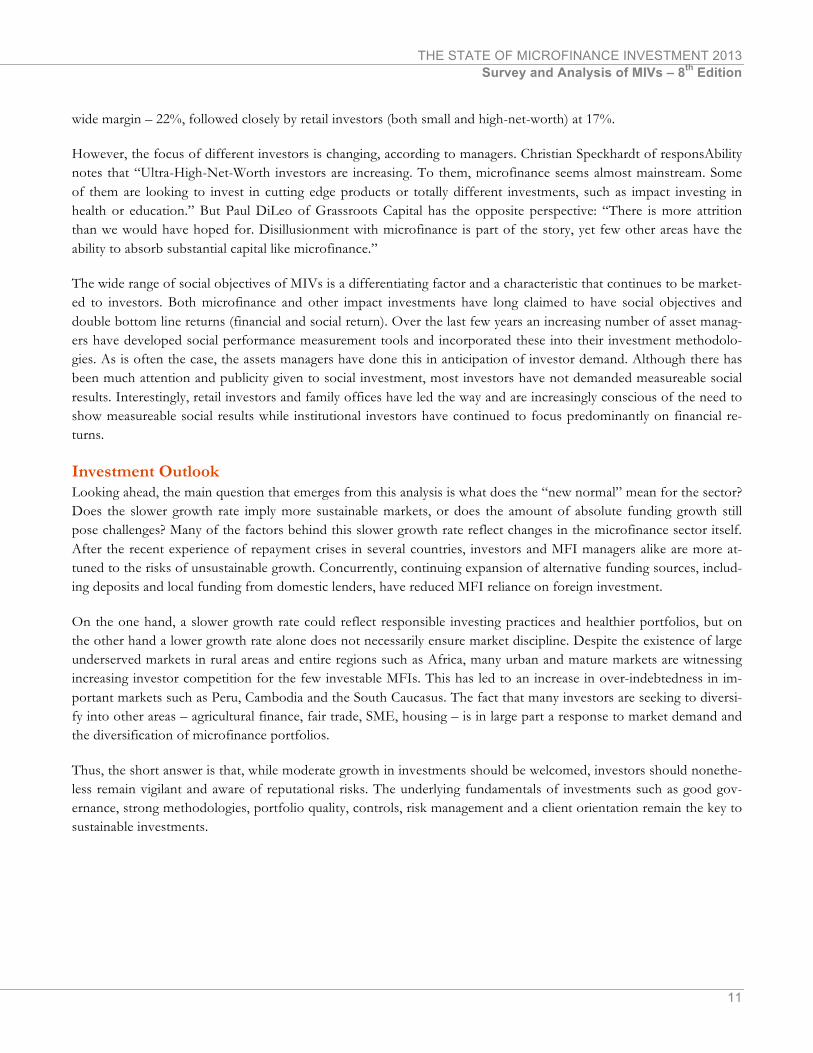
The lack of consolidation among MIVs is also reflected among fund managers. The largest five investment managers have seen their market share decline by 8% since 2009. However, they continue to manage slightly more than half of the sector’s total investments.
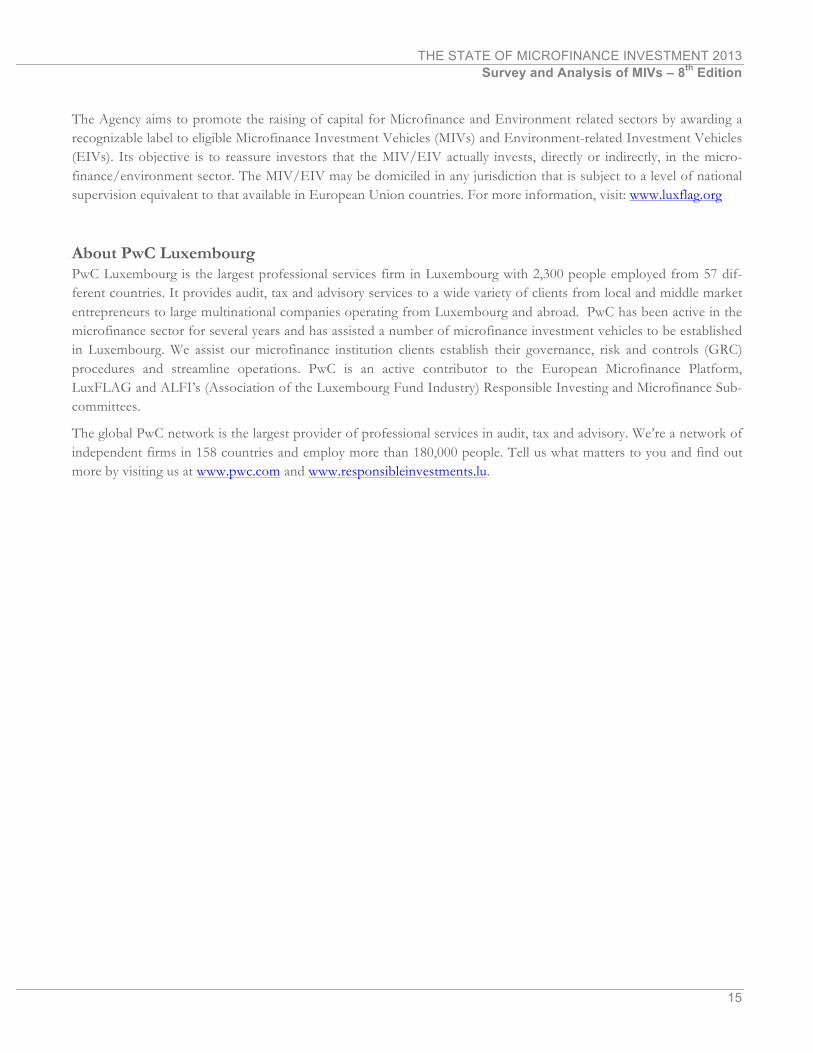
Even as funds and fund managers have continued to become more di-verse, their holdings have become slightly less so. Although several man-agers have discussed increasing focus on microfinance equity invest-ments, the share of equity in microfinance portfolios saw a slight decline in 2012. As growth in loans accelerated, equity fell back to 18% – the same level as in 2009.
12%!23%! 24%! 26%! 22%! 24%! 23%!
41%!36%! 31%! 31%! 34%! 32%! 35%!
46%! 41%! 45%! 43%! 44%! 44%! 42%!
2006! 2007! 2008! 2009! 2010! 2011! 2012!
MIV"Market"Share"and"Size"
Top!5!
Top!6U20!
The!rest! 28!
64!73!
83! 80! 82!
99!
6!
24! 25! 28! 33! 31! 35!
2006! 2007! 2008! 2009! 2010! 2011! 2012!
MIV"Size"($"mln)"
Average!
Median!
61%! 60%!52%! 53%!
2009! 2010! 2011! 2012!
MF"PorGolio"Share"by"Top"5"
Fund"Managers"
10
Of course, it is difficult to directly compare equity and debt levels. The size of equity portfolios depends greatly on the type of accounting applied, whether at cost or fair value, and thus there is substantial variation between how funds report their equity holdings. Moreover, equity hold-ings tend to grow over time, whereas debt needs to be reinvested. Point-in-time comparisons therefore tend to miss the overall market picture. Nevertheless, the survey findings show that microfinance investing continues to be dominated by debt, and this trend does not appear to be changing.
The same is true for non-microfinance investments – many managers have discussed branching out into other impact investment areas, including agricultural, fair trade and SME lending. But whether this is fast enough to shift portfolio allocation levels remains to be seen. As Christian Speckhardt of responsAbility puts it, “alternative sectors are grow-ing, but while microfinance disbursements can be up to $100 million per month, these investments are not even $100 million per year.”
In terms of domicile concentration, Europe remains the dominant region in both number of MIVs and total as-sets. Luxembourg and the Netherlands alone account for 80% of MIV assets. Notably, the United States has a number of smaller funds that puts it just behind Luxem-bourg in terms of number of MIVs.
The Investor Perspective – dis tr ibut ion o f in-ves tors unchanged Distribution of investors in microfinance has not seen significant change in 2012. Private institutional investors continue to dominate the sector – 56% with public fun-ders (e.g. development finance institutions) trailing by a
Luxembourg!52%!Netherlands!
28%!
United!States!7%!
Belgium!3%!
MauriBus!2%!
Other!8%!
MIV"Domicile,"by"Total"Assets"
Luxembourg!31%!
United!States!18%!
Netherlands!12%!
Cayman!Islands!6%!
MauriBus!6%!
Belgium!5%!
Other!22%!
MIV"Domicile,"by"Number"of"MIVs"
0.5! 0.7! 0.9! 1.1! 1.1!
3.3! 3.5! 3.7! 4.3! 5.0!
87%"82%" 80%" 80%" 82%"
2008" 2009" 2010" 2011" 2012"
Microfinance"Asset"Composi-on"($"mln)"
MF!Debt!MF!Equity!!
FundUofUfunds!2%!
HNW!6%!
FoundaBons!3%!
InsBtuBonal!investors!56%!
DFIs!22%!
Retail!investors!11%!
Investor"Distribu-on,"by"Type"
THE STATE OF MICROFINANCE INVESTMENT 2013 Survey and Analysis of MIVs – 8th Edition
11
wide margin – 22%, followed closely by retail investors (both small and high-net-worth) at 17%.
However, the focus of different investors is changing, according to managers. Christian Speckhardt of responsAbility notes that “Ultra-High-Net-Worth investors are increasing. To them, microfinance seems almost mainstream. Some of them are looking to invest in cutting edge products or totally different investments, such as impact investing in health or education.” But Paul DiLeo of Grassroots Capital has the opposite perspective: “There is more attrition than we would have hoped for. Disillusionment with microfinance is part of the story, yet few other areas have the ability to absorb substantial capital like microfinance.”
The wide range of social objectives of MIVs is a differentiating factor and a characteristic that continues to be market-ed to investors. Both microfinance and other impact investments have long claimed to have social objectives and double bottom line returns (financial and social return). Over the last few years an increasing number of asset manag-ers have developed social performance measurement tools and incorporated these into their investment methodolo-gies. As is often the case, the assets managers have done this in anticipation of investor demand. Although there has been much attention and publicity given to social investment, most investors have not demanded measureable social results. Interestingly, retail investors and family offices have led the way and are increasingly conscious of the need to show measureable social results while institutional investors have continued to focus predominantly on financial re-turns.
Investment Outlook Looking ahead, the main question that emerges from this analysis is what does the “new normal” mean for the sector? Does the slower growth rate imply more sustainable markets, or does the amount of absolute funding growth still pose challenges? Many of the factors behind this slower growth rate reflect changes in the microfinance sector itself. After the recent experience of repayment crises in several countries, investors and MFI managers alike are more at-tuned to the risks of unsustainable growth. Concurrently, continuing expansion of alternative funding sources, includ-ing deposits and local funding from domestic lenders, have reduced MFI reliance on foreign investment.
On the one hand, a slower growth rate could reflect responsible investing practices and healthier portfolios, but on the other hand a lower growth rate alone does not necessarily ensure market discipline. Despite the existence of large underserved markets in rural areas and entire regions such as Africa, many urban and mature markets are witnessing increasing investor competition for the few investable MFIs. This has led to an increase in over-indebtedness in im-portant markets such as Peru, Cambodia and the South Caucasus. The fact that many investors are seeking to diversi-fy into other areas – agricultural finance, fair trade, SME, housing – is in large part a response to market demand and the diversification of microfinance portfolios.
Thus, the short answer is that, while moderate growth in investments should be welcomed, investors should nonethe-less remain vigilant and aware of reputational risks. The underlying fundamentals of investments such as good gov-ernance, strong methodologies, portfolio quality, controls, risk management and a client orientation remain the key to sustainable investments.

12
APPENDIX I: GLOBAL MIV LIST, AS OF DECEMBER 2012 MIV Survey Participants: 1. AavishkaarGoodwell India Microfinance Devel-
opment Company 2. AavishkaarGoodwell India Microfinance Devel-
opment Company II Limited 3. Access Africa Fund, LLC 4. AccessBank Bond I 5. ACCION Gateway Fund LLC 6. ACCION International Global Bridge Fund 7. ACCION Investments in Microfinance, SPC 8. Advans SA, SICAR 9. Africap Microfinance Investment Company Ltd. 10. Alterfin 11. ASN-Novib Microcredit Fund 12. Azure Global Microfinance Fund SICAV- SIF 13. Balkan Financial Sector Equity Fund 14. Bamboo Financial Inclusion Fund 15. Bellwether Microfinance Fund Private Limited 16. BlueOrchard Loans for Development 2007 17. BlueOrchard Microfinance Fund (formerly Dexia
Micro-Credit Fund: BlueOrchard Debt Sub-Fund) 18. Capital For Communities Fund 19. Catalyst Microfinance Investors 20. Coopest S.A. 21. ConsorzioEtimos S.C. 22. Creation Investments Social Ventures Fund I 23. CreSudSpA 24. Deutsche Bank Microcredit Development Fund 25. Dual Return Fund - Vision Microfinance 26. Dual Return Fund - Vision Microfinance Local
Currency 27. Dutch Microfinance Fund 28. DWM Microfinance Equity Fund I 29. DWM Microfinance Fund 30. DWM Microfinance Fund-J 31. Elevar Equity II, LP 32. EMF Microfinance Fund AGmvK 33. ESPA VINIS Microfinance 34. Etimos Fund Global Microfinance Debt 35. FEFISOL 36. FINCA Microfinance Fund B.V.
37. Finethic S.C.A., SICAV-SIF, Sub-Fund 1 – Fin-ethic – Microfinance
38. FONIDI, s.e.c. 39. Gawa Microfinance Fund I 40. Global Partnerships Microfinance Fund 2008,
LLC 41. Global Partnerships Social Investment Fund 2010,
LLC 42. Goodwell West Africa Microfinance Development
Company 43. Gray Ghost Microfinance Fund 44. Hivos-Triodos Fund Foundation 45. IC Fund Sicav-Sif Asian Women Microfinance
Sub-Fund 46. Impulse Microfinance Investment Fund 47. Incofin cvso 48. India Financial Inclusion Fund 49. Invest in Visions Microfinance Fund 50. Investisseur et Partenaire pour le Développment 51. KCD-Mikrofinanz-Fonds (FIS) I Global 52. KCD-Mikrofinanz-Fonds (FIS) II Lateinamerika 53. LOCFUND L.P. 54. Lok Capital LLC 55. Luxembourg Microfinance and Development
Fund - Social Venture Capital Sub-Fund 56. MicroCredit Enterprises 57. Microfinance Enhancement Facility SA 58. Microfinance Growth Fund 59. Microfinance Loan Obligations (MFLO 3) Com-
partment Sub Debt 60. MicroVentures Investments SA, SICAR 61. MicroVest II-A, LP 62. MicroVest Short Duration Fund, LP 63. MicroVest+Plus, LP 64. Minlam Microfinance Offshore Master Fund, LP 65. MV MicrofinPvt Ltd 66. MVH SpA (formerly MicroVentures SPA) 67. NMI Global Fund, KS 68. Oikocredit Ecumenical Development Co-
operative Society U.A. 69. Partners for the Common Good 70. Próspero Microfinanzas Fund, LP

THE STATE OF MICROFINANCE INVESTMENT 2013 Survey and Analysis of MIVs – 8th Edition
13
MIV Survey Participants (continued): 71. Regional MSME Investment Fund for Sub-
Saharan Africa (REGMIFA) 72. responsAbility Global Microfinance Fund 73. responsAbility SICAV (Lux) Financial Inclusion
Fund 74. responsAbility SICAV (Lux) Microfinance Lead-
ers 75. responsAbility SICAV (Lux) Mikrofinanz-Fonds 76. Rural Impulse Fund II 77. Rural Impulse Fund, SA 78. Sarona Frontier Markets Fund 1 LP 79. Sarona Risk Capital Fund 1 LP 80. Sarona Risk Capital Fund MEDA 81. ShoreCap International 82. SNS Institutional Microfinance Fund 83. SNS Institutional Microfinance Fund II 84. Societe Cooperative Fonds International de Gar-
antie 85. SolidaritéInternationale Pour le Développement et
L’Investissement 86. StichtingTriodos-Doen 87. The European Fund for Southeast Europe
SICAV-SIF 88. Triodos Fair Share Fund 89. Triodos SICAV II-Triodos Microfinance Fund 90. Unitus Equity Fund LP 91. VG Microfinance-Invest Nr. 1 GmbH 92. Wallberg Global Microfinance FCP II
MIVs that did not submit information: 1. Envest Microfinance Cooperative 2. Fonds Desjardins pour la Finance inclusive,
Société en commandite 3. Global Microfinance Equity Fund 4. Global Microfinance Facility 5. Latin American Challenge Investment Fund 6. Microfinance Loan Obligation Compartment LC 7. Microfinance Loan Obligations SA Compartment
Opportunity Eastern Europe 2005-1 8. NMI Frontier Fund, KS 9. Selectum SICAV SIF-BL Microfinance Fund 10. Solidus Investment fund

14
About Citi Microfinance Working across Citi’s businesses, product groups and geographies, Citi Microfinance serves 150 microfinance institu-tions (MFIs), networks and investors as clients and partners in nearly 50 countries with products and services span-ning the financial spectrum – from financing, access to capital markets, transaction services and hedging foreign ex-change risk, to credit, savings, remittances and insurance products - to expand access to financial services for the un-derserved. More information: www.citimicrofinance.com.
About Corporación Andina de Fomento Corporación Andina de Fomento (CAF) – development bank of Latin America – has the mission of stimulating sus-tainable development and regional integration by financing projects in the public and private sectors, and providing technical co-operation and other specialized services. Founded in 1970 and currently with 18 member countries from Latin America, the Caribbean, and Europe, along with 14 private banks, CAF is one of the main sources of multilat-eral financing and an important generator of knowledge for the region. For more information, visit www.caf.com.
About European Investment Bank The European Investment Bank (EIB) Group has a long-standing track record in microfinance, supporting leading microfinance institutions, fund providers and stakeholders, helping them to address specific market failures and pro-moting financing solutions to micro, small and medium-sized enterprises, as well as to low-income groups.
Since 2003, the EIB Group has committed EUR 881m to microfinance activities, in nearly 50 countries, inside the European Union, in EU Neighbouring and Candidate countries, and outside the European Union, where the Bank is active across the sub-Saharan African, Caribbean and Pacific regions as well as in the Mediterranean partner countries. For more information, visit: www.eib.org/products/microfinance/index.htm.
About the Grand-Duchy of Luxembourg The Grand-Duchy of Luxembourg was among the first countries in the EU to recognize the importance and the value of microfinance as a means to fight poverty.
Luxembourg now has an established position as a leading financial center, as growing numbers of international inves-tors recognize its various advantages. Indeed, the Luxembourg Government has implemented major legal and tax re-forms with the aim of permitting flexibility to meet the needs of international investors within a strong regulatory framework. Luxembourg has become today Europe’s number one investment fund center and the world’s leading hub for global fund distribution.
Luxembourg is a leading center for the domiciliation of MIVs. Approximately one-third of all MIVs, representing 49% of total MIV assets, are domiciled in Luxembourg. Six of the world’s ten largest MIVs are based in Luxembourg.
About LuxFLAG The Luxembourg Fund Labeling Agency (LuxFLAG) is an independent, non-profit-making association created in Luxembourg in July 2006 by seven founding partners who are the Charter Members. LuxFLAG supports the financ-ing of sustainable development by providing clarity for investors through awarding International Labels.
THE STATE OF MICROFINANCE INVESTMENT 2013 Survey and Analysis of MIVs – 8th Edition
15
The Agency aims to promote the raising of capital for Microfinance and Environment related sectors by awarding a recognizable label to eligible Microfinance Investment Vehicles (MIVs) and Environment-related Investment Vehicles (EIVs). Its objective is to reassure investors that the MIV/EIV actually invests, directly or indirectly, in the micro-finance/environment sector. The MIV/EIV may be domiciled in any jurisdiction that is subject to a level of national supervision equivalent to that available in European Union countries. For more information, visit: www.luxflag.org
About PwC Luxembourg PwC Luxembourg is the largest professional services firm in Luxembourg with 2,300 people employed from 57 dif-ferent countries. It provides audit, tax and advisory services to a wide variety of clients from local and middle market entrepreneurs to large multinational companies operating from Luxembourg and abroad. PwC has been active in the microfinance sector for several years and has assisted a number of microfinance investment vehicles to be established in Luxembourg. We assist our microfinance institution clients establish their governance, risk and controls (GRC) procedures and streamline operations. PwC is an active contributor to the European Microfinance Platform, LuxFLAG and ALFI’s (Association of the Luxembourg Fund Industry) Responsible Investing and Microfinance Sub-committees.
The global PwC network is the largest provider of professional services in audit, tax and advisory. We’re a network of independent firms in 158 countries and employ more than 180,000 people. Tell us what matters to you and find out more by visiting us at www.pwc.com and www.responsibleinvestments.lu.
The State of Microfinance Investment 2013: Survey and Analysis of MIVs – 8th Edition was made possible by the generous support of:
!!!!!!!!!!!!!!!!!!!! ! !!
! !!!!!!!!!!!!!!!!! ! !
To download The State of Microfinance Investment 2013, visit: www.microrate.com or email: [email protected].