micronutrient status in soil of central indiafile.scirp.org/pdf/ajps_2015120715255550.pdf · k. s....
TRANSCRIPT
American Journal of Plant Sciences, 2015, 6, 3025-3037 Published Online December 2015 in SciRes. http://www.scirp.org/journal/ajps http://dx.doi.org/10.4236/ajps.2015.619297
How to cite this paper: Patel, K.S., Chikhlekar, S., Ramteke, S., Sahu, B.L., Dahariya, N.S. and Sharma, R. (2015) Micronu-trient Status in Soil of Central India. American Journal of Plant Sciences, 6, 3025-3037. http://dx.doi.org/10.4236/ajps.2015.619297
Micronutrient Status in Soil of Central India Khageshwar Singh Patel*, Santosh Chikhlekar, Shobhana Ramteke, Bharat Lal Sahu, Nohar Singh Dahariya, Reetu Sharma School of Studies in Chemistry/Environmental Science, Pt. Ravishankar Shukla University, Raipur, India
Received 7 October 2015; accepted 4 December 2015; published 7 December 2015
Copyright © 2015 by authors and Scientific Research Publishing Inc. This work is licensed under the Creative Commons Attribution International License (CC BY). http://creativecommons.org/licenses/by/4.0/
Abstract Two major issues, i.e. large crop productions and huge anthropogenic activities (e.g. fuel burning and mineral roasting) disturb the micronutrient balance in the soil of India. In this work, the available and total status of eight micronutrients i.e. Fe, Mn, Cu, Zn, Co, Ni, Mo, and S of the soils in the most urbanized area: Raipur area, Chhattisgarh, India (extending over ≈ 2 × 10⁴ km2) is de-scribed. The available status of micronutrients i.e. Fe, Mn, Cu, Zn, Co, Ni, Mo and 2
4SO − in the soils (n = 100) was ranged from 30 - 8253, 205 - 2800, 2.0 - 8.1, 0.7 - 5.0, 2.2 - 31.2, 0.1 - 13.4, 0.1 - 8.9 and 41 - 747 mg/kg with mean value of (at 95% probability) 642 ± 186, 1178 ± 119, 4.3 ± 0.3, 2.3 ± 0.2, 12.8 ± 1.3, 3.9 ± 0.6, 1.5 ± 0.3 and 281 ± 25 mg/kg, respectively. The concentration variations, deficiencies and toxicities of the micronutrients in the soil are discussed.
Keywords Soil, Micronutrient, Available, Total Content
1. Introduction The micronutrients i.e. Fe, Cu, Zn, Mn, Co, Ni, Mo, and S in soil play a very important role in plant growth, productivity, soil fertility and animal nutrition [1]. The main functions of the micronutrients in living organism are structural components of cell constituents and its metabolically active compounds, in the maintenance of cellular organization, in energy transformation, in enzyme action, etc. [2]. The increment in nutrient supply beyond a certain limit resulting in the decreased yield of plants is often be associated with the production of spe-cific toxic effects [3]. The incidence of micronutrient deficiencies in soil and plants is increasing due to high and multiple plant yields. The quantification of both total and available (active form) of nutrients in soil is important [4]. The main sources of micronutrients in soils are rock weathering and atmospheric deposition in form of dust, precipitates, volatile compounds, etc. The micronutrients in soil occur in different chemical forms i.e. water so-
*Corresponding author.
K. S. Patel et al.
3026
luble, exchangeable, specifically adsorbed, chelated or complexed, secondary clay minerals or oxide, primary minerals, etc. [5].
Their available contents were leached out from soil with various extractants i.e. diethylenetriaminepenta acet-ic acid (DTPA), ammonium bicarbonate-DTPA (AB-DTPA), triethanolamine-DTPA (TEA-DTPA), Mehlich-1 (0.05 N HCl + 0.025 N H2SO4), Mehlich-3 (0.2 N CH3COOH + 0.25 N NH4NO3 + O.O15 N NH4F + 0.013 N HNO3 + 0.001 M EDTA), acid ammonium acetate-EDTA (AAA-EDTA), MgCl2, HCl (0.05 N), HNO3 (0.31 N), ammonium acetate, water, etc. [6]. However, most of these extractants were suffered from some shortcoming i.e. unable to extract several trace elements present in soil, not always efficient for all nutrients, etc. Thus now a days, multi-nutrient extractants i.e. Mehlich-3, AB-DTPA, TEA-DTPA, acid ammonium acetate-EDTA etc. were widely used for the extraction of micronutrients and trace elements from the soils [6]. Among them, AB-DTPA and TEA-DTPA were claimed better extractant than Melich-3 for Zn and Cu, but they extracted only Zn, Cu, Mn, and Fe. However, the AAA-EDTA leached out several nutrients i.e. Mn, Fe, Co, Ni, Cu, Zn, Al, Cd, Mo, Cr, Pb, Sr, P, etc. Ammonium oxalate, ammonium acetate, hot water, etc. were reported for the leaching of the available Mo from the soil. Of these oxalate is widely used for the extraction of available Mo from soil but it required prolonged extraction period (≈ 24 hr). The hot water extraction was recommended for leaching of the available Mo from the soil. Calcium chloride, Bray-1 (0.03N NH4F + 0.025 N HCl), Morgan’s reagent (sodium acetate-acetic acid, pH 4.8), deionized water, etc. were reported for the extraction of S from soil. The total con-tent of micronutrients in soil was leached out with acids i.e. aqua-regia, HClO4, HF, HClO4 + HNO3, H2SO4 + HCl + HNO3, etc. [6].
The micronutrient status in surface soils of some parts of India was reported [7]-[23]. However, the informa-tion on the levels of micronutrient i.e. Co, Ni and Mo in the soil is lacking. In this work, the status of eight mi-cronutrients i.e. Fe, Cu, Zn, Mn, Co, Ni, Mo, and S in surface soils of 100 villages of Raipur district is described. The concentration variations, deficiencies and toxicities of the micronutrients in the soil are discussed.
2. Materials and Methods 2.1. Study Area The most of urbanization and industrialization in central India has been marked nearby capital city, Raipur, Chhattisgarh state, India. Raipur area includes Raipur district (22˚33'N - 21˚14'N and 82˚6' - 81˚38'E) and sur-rounding districts i.e. Balodabazar and Gariabandh. They are situated in the fertile plains of Chhattisgarh region of the country. Hundred city, town and villages of Raipur area (≈2.0 × 10⁴ km2) were selected for determining the micronutrient status of the soil.
2.2. Sample Collection Generally, three different types of soil i.e. red laterite, gray, yellow soils occurred in this region. Three different types of soil from 100 villages of Raipur block were collected, Figure 1. Soils were taken from horizon of 0 - 15 cm depth. A total 300 soil samples were collected in February 2013 as described in the literature [24].
2.3. Analysis of pH and Extraction The soils were dried, ground and sieved through a 2-mm sieve. All samples were stored in a 500-mL wide mouth polythene bottles for the analysis. A 10.0 g weighed amount of soil was taken in a 100-mL polythene conical flask by mixing with 20 mL deionized water. The mixture was shaken for 6 hrs, and their pH and elec-trical conductivity (EC) values were measured with the Hanna sensor-HI 991300N.
A mixed solution of reagents (E. Merck) i.e. AAAA-EDTA for the extraction of nutrient i.e. Mn, Fe, Co, Ni, Cu, Zn and PO4
3−was used by dissolving 38.5 g ammonium acetate, 9.5 g Na2EDTA and 29 mL acetic acid (17 M) into 1 L deionized water [25]. A 10 g dried and ground soil sample was taken into a 250-mL polyethylene flask with subsequent addition of 100 mL AAAA-EDTA solution. The mixture was equilibrated for 1 hr with a shaker, and solution was filtered through a 0.45 µm glass fiber filter in a 100-mLpolyethylene volumetric flask.
For Mo, a 10 g soil sample was taken into 250-mL conical polyethylene flask by mixing with 100 mL deio-nized water [26]. It was heated at boiling temperature for 10 min by subsequent filtering the cold solution as above. The activated charcoal and hot water were employed for the extraction of the available content of sulfate. A 10 g soil sample was mixed with 1 g activated charcoal and 100 mL deionized water into a 250-mL conical

K. S. Patel et al.
3027
Figure 1. Representation of sampling locations in Chhattisgarh state of the country.
polyethylene flask. The mixture was shaken for a duration of 1 hr by a shaker and solution was filtered through a 0.45 µm glass fiber as above.
The mixed acid (H2SO4 + HCl + HNO3) was used for extraction of the total content of micronutrients i.e. Mn, Fe, Co, Ni, Cu and Zn. A 1.0 g dried and powdered soil sample was taken in a 100-mL Teflon beaker. Into it, 30.0 ml of mixed acid solution (H2SO4 + HCl + HNO3) was added. The mixture was heated until white fumes were no longer emitted. The residue was washed with hot dilute hydrochloric acid (0.01 N) and the hot water (50˚C). The mixture was filtered through a 0.45 µm glass fiber as above.
For leaching of total content of sulfate, a 1 g soil sample was mixed with 50 mL solution of acids: (HNO3 + HClO4) into a 100-mL Teflon beaker by keeping overnight (12 hr). The solution was concentrated to 20 mL by gentle heating, and the cold solution was filtered through a glass fiber as above. The filtrate was evaporated to the dryness by subsequent dissolving with deionized water in a 50-mL polyethylene flask.
2.4. Analysis of Micronutrients The Flame GBC 932AAwas used for analysis of metals i.e. Mn, Fe, Co, Ni, Cu, Zn and Mo in the soil. The Dionex ion chromatography-1100—was employed for analysis of 2
4SO − and 34PO − .
3. Results and Discussion 3.1. Soil Characteristics The agricultural land includes ≈ 50% area of the total land of the studied area. Three types of soils i.e. gray, yel-low and red are available in the studied area. The red and yellow soil was originated by weathering of various rocks i.e. quartz, feldspars, mica and iron coated quartz formed over different geological periods. The yellow color was ascribed to the higher degree of hydration of the ferric oxide in these soils. The color shaded was also varied from reddish yellow to yellowish brown with often fine textured. The pH and EC of soil was ranged from 4.7 -7.7 and 100 - 900 µS/cm.
K. S. Patel et al.
3028
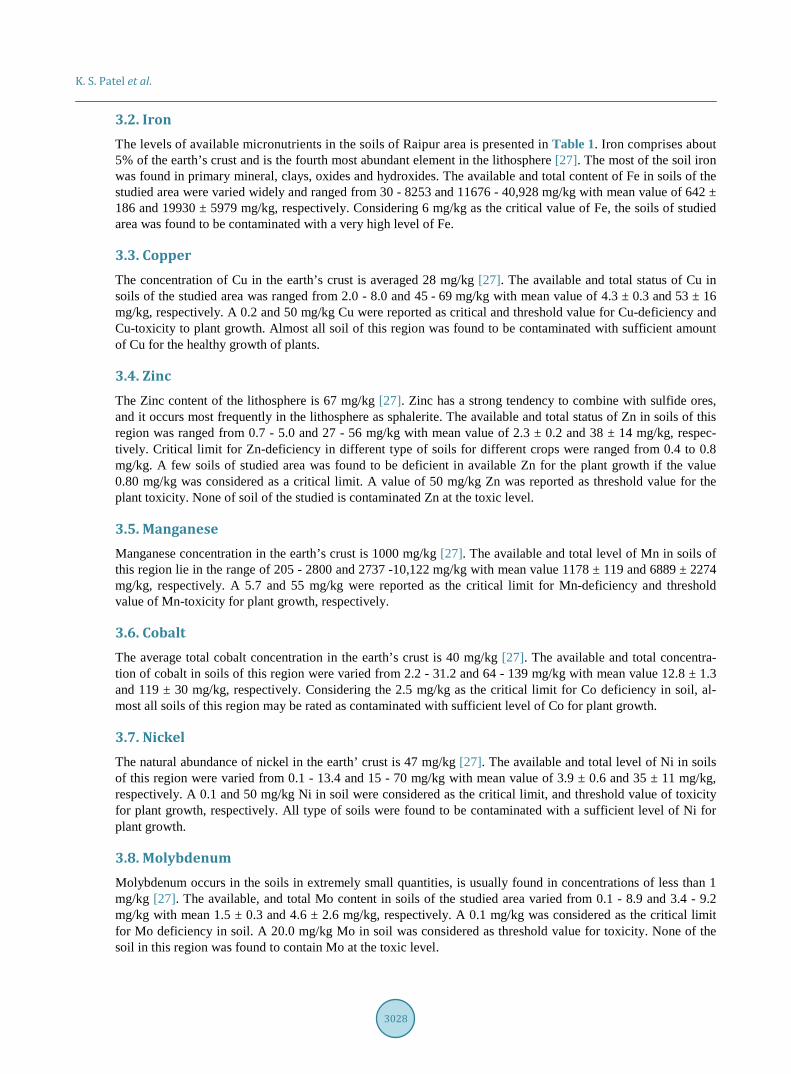
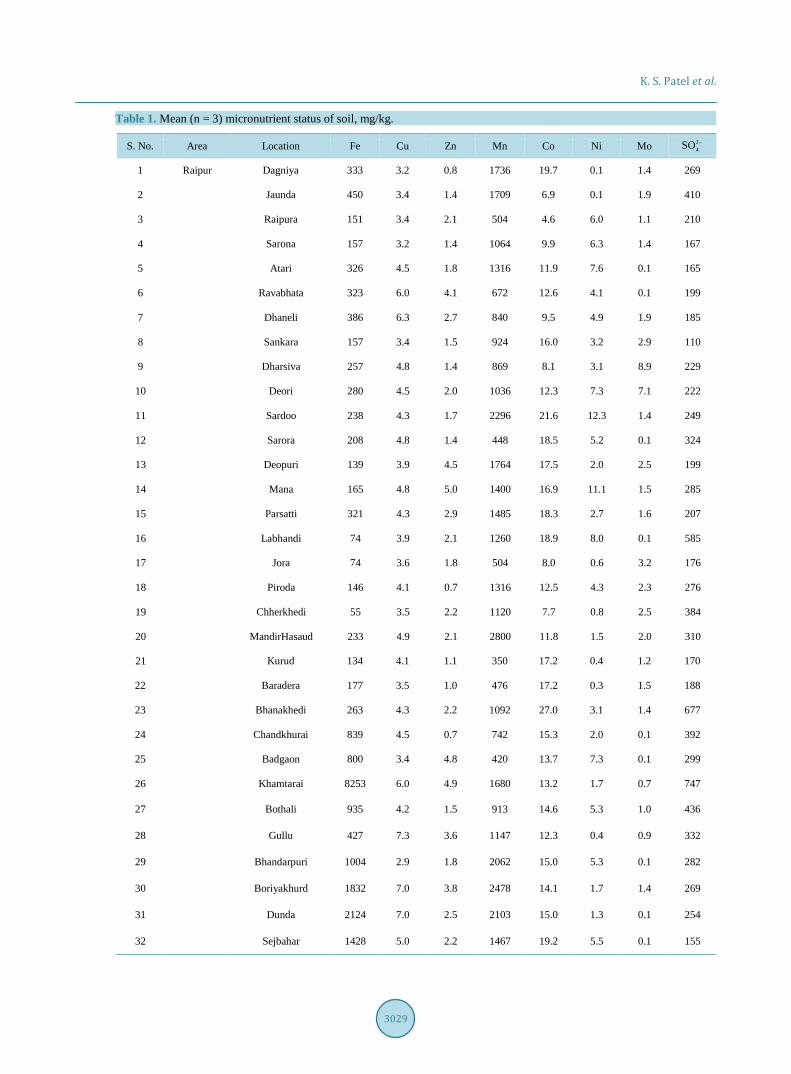
3.2. Iron The levels of available micronutrients in the soils of Raipur area is presented in Table 1. Iron comprises about 5% of the earth’s crust and is the fourth most abundant element in the lithosphere [27]. The most of the soil iron was found in primary mineral, clays, oxides and hydroxides. The available and total content of Fe in soils of the studied area were varied widely and ranged from 30 - 8253 and 11676 - 40,928 mg/kg with mean value of 642 ± 186 and 19930 ± 5979 mg/kg, respectively. Considering 6 mg/kg as the critical value of Fe, the soils of studied area was found to be contaminated with a very high level of Fe.
3.3. Copper The concentration of Cu in the earth’s crust is averaged 28 mg/kg [27]. The available and total status of Cu in soils of the studied area was ranged from 2.0 - 8.0 and 45 - 69 mg/kg with mean value of 4.3 ± 0.3 and 53 ± 16 mg/kg, respectively. A 0.2 and 50 mg/kg Cu were reported as critical and threshold value for Cu-deficiency and Cu-toxicity to plant growth. Almost all soil of this region was found to be contaminated with sufficient amount of Cu for the healthy growth of plants.
3.4. Zinc The Zinc content of the lithosphere is 67 mg/kg [27]. Zinc has a strong tendency to combine with sulfide ores, and it occurs most frequently in the lithosphere as sphalerite. The available and total status of Zn in soils of this region was ranged from 0.7 - 5.0 and 27 - 56 mg/kg with mean value of 2.3 ± 0.2 and 38 ± 14 mg/kg, respec-tively. Critical limit for Zn-deficiency in different type of soils for different crops were ranged from 0.4 to 0.8 mg/kg. A few soils of studied area was found to be deficient in available Zn for the plant growth if the value 0.80 mg/kg was considered as a critical limit. A value of 50 mg/kg Zn was reported as threshold value for the plant toxicity. None of soil of the studied is contaminated Zn at the toxic level.
3.5. Manganese Manganese concentration in the earth’s crust is 1000 mg/kg [27]. The available and total level of Mn in soils of this region lie in the range of 205 - 2800 and 2737 -10,122 mg/kg with mean value 1178 ± 119 and 6889 ± 2274 mg/kg, respectively. A 5.7 and 55 mg/kg were reported as the critical limit for Mn-deficiency and threshold value of Mn-toxicity for plant growth, respectively.
3.6. Cobalt The average total cobalt concentration in the earth’s crust is 40 mg/kg [27]. The available and total concentra-tion of cobalt in soils of this region were varied from 2.2 - 31.2 and 64 - 139 mg/kg with mean value 12.8 ± 1.3 and 119 ± 30 mg/kg, respectively. Considering the 2.5 mg/kg as the critical limit for Co deficiency in soil, al-most all soils of this region may be rated as contaminated with sufficient level of Co for plant growth.
3.7. Nickel The natural abundance of nickel in the earth’ crust is 47 mg/kg [27]. The available and total level of Ni in soils of this region were varied from 0.1 - 13.4 and 15 - 70 mg/kg with mean value of 3.9 ± 0.6 and 35 ± 11 mg/kg, respectively. A 0.1 and 50 mg/kg Ni in soil were considered as the critical limit, and threshold value of toxicity for plant growth, respectively. All type of soils were found to be contaminated with a sufficient level of Ni for plant growth.
3.8. Molybdenum Molybdenum occurs in the soils in extremely small quantities, is usually found in concentrations of less than 1 mg/kg [27]. The available, and total Mo content in soils of the studied area varied from 0.1 - 8.9 and 3.4 - 9.2 mg/kg with mean 1.5 ± 0.3 and 4.6 ± 2.6 mg/kg, respectively. A 0.1 mg/kg was considered as the critical limit for Mo deficiency in soil. A 20.0 mg/kg Mo in soil was considered as threshold value for toxicity. None of the soil in this region was found to contain Mo at the toxic level.
K. S. Patel et al.
3029
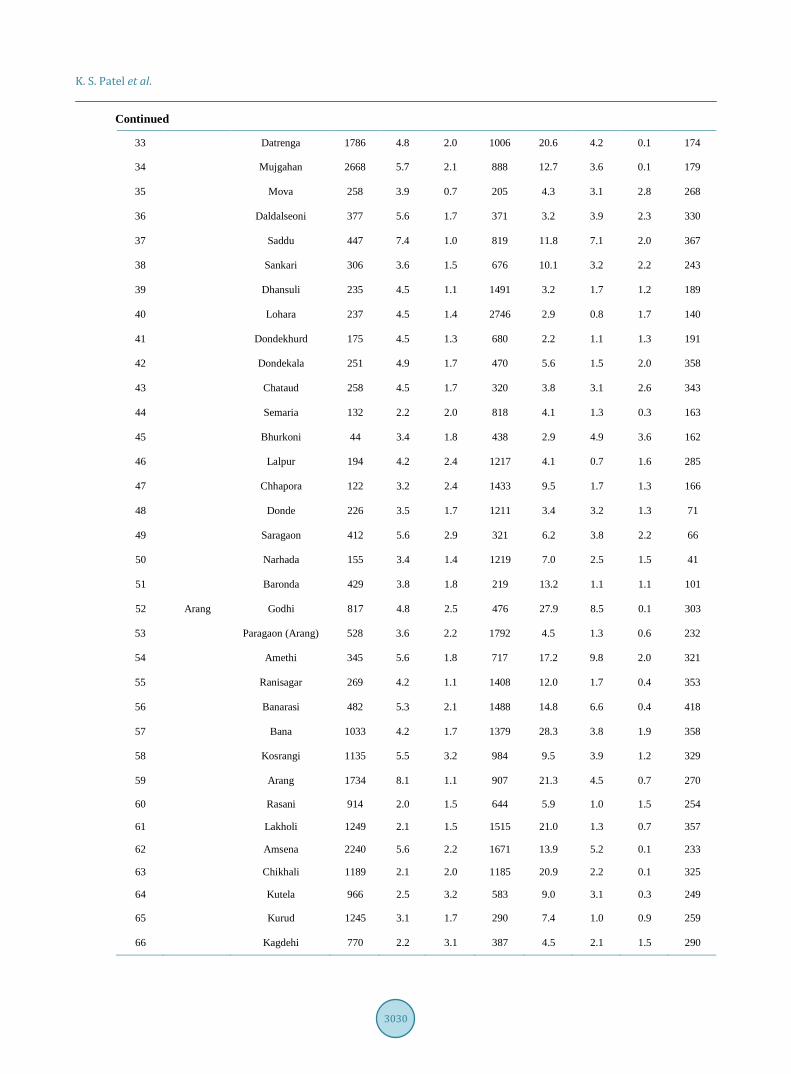
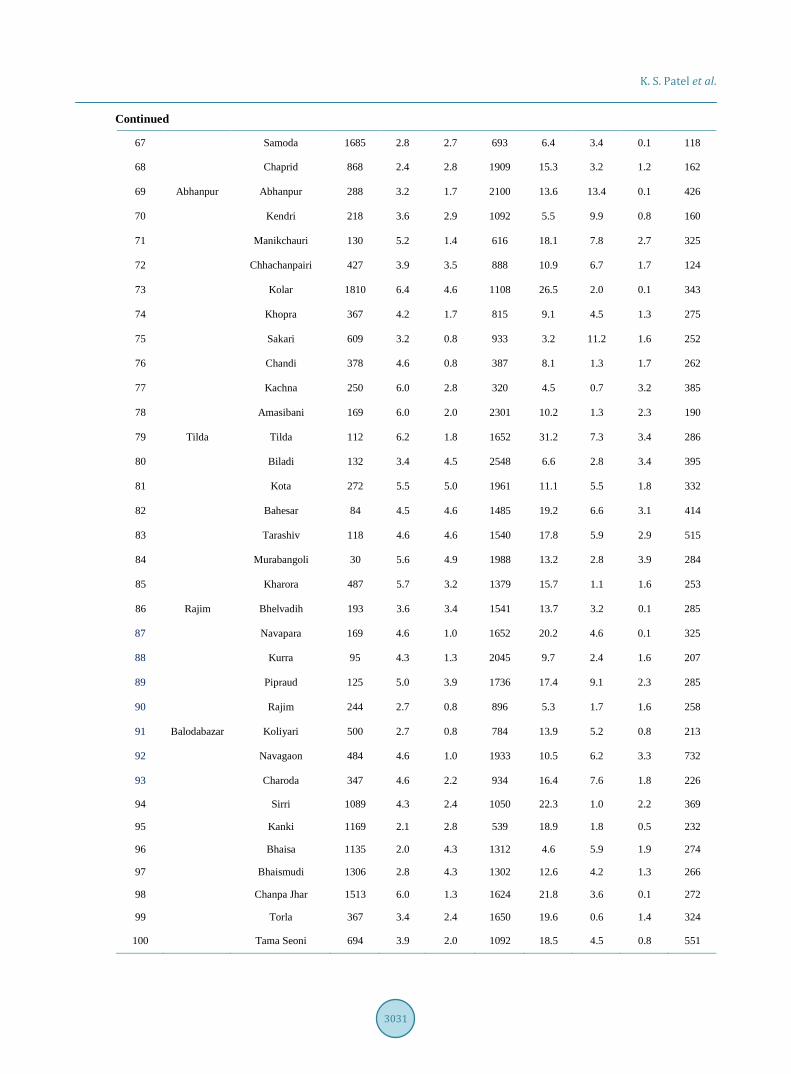
Table 1. Mean (n = 3) micronutrient status of soil, mg/kg.
S. No. Area Location Fe Cu Zn Mn Co Ni Mo 24SO −
1 Raipur Dagniya 333 3.2 0.8 1736 19.7 0.1 1.4 269
2 Jaunda 450 3.4 1.4 1709 6.9 0.1 1.9 410
3 Raipura 151 3.4 2.1 504 4.6 6.0 1.1 210
4 Sarona 157 3.2 1.4 1064 9.9 6.3 1.4 167
5 Atari 326 4.5 1.8 1316 11.9 7.6 0.1 165
6 Ravabhata 323 6.0 4.1 672 12.6 4.1 0.1 199
7 Dhaneli 386 6.3 2.7 840 9.5 4.9 1.9 185
8 Sankara 157 3.4 1.5 924 16.0 3.2 2.9 110
9 Dharsiva 257 4.8 1.4 869 8.1 3.1 8.9 229
10 Deori 280 4.5 2.0 1036 12.3 7.3 7.1 222
11 Sardoo 238 4.3 1.7 2296 21.6 12.3 1.4 249
12 Sarora 208 4.8 1.4 448 18.5 5.2 0.1 324
13 Deopuri 139 3.9 4.5 1764 17.5 2.0 2.5 199
14 Mana 165 4.8 5.0 1400 16.9 11.1 1.5 285
15 Parsatti 321 4.3 2.9 1485 18.3 2.7 1.6 207
16 Labhandi 74 3.9 2.1 1260 18.9 8.0 0.1 585
17 Jora 74 3.6 1.8 504 8.0 0.6 3.2 176
18 Piroda 146 4.1 0.7 1316 12.5 4.3 2.3 276
19 Chherkhedi 55 3.5 2.2 1120 7.7 0.8 2.5 384
20 MandirHasaud 233 4.9 2.1 2800 11.8 1.5 2.0 310
21 Kurud 134 4.1 1.1 350 17.2 0.4 1.2 170
22 Baradera 177 3.5 1.0 476 17.2 0.3 1.5 188
23 Bhanakhedi 263 4.3 2.2 1092 27.0 3.1 1.4 677
24 Chandkhurai 839 4.5 0.7 742 15.3 2.0 0.1 392
25 Badgaon 800 3.4 4.8 420 13.7 7.3 0.1 299
26 Khamtarai 8253 6.0 4.9 1680 13.2 1.7 0.7 747
27 Bothali 935 4.2 1.5 913 14.6 5.3 1.0 436
28 Gullu 427 7.3 3.6 1147 12.3 0.4 0.9 332
29 Bhandarpuri 1004 2.9 1.8 2062 15.0 5.3 0.1 282
30 Boriyakhurd 1832 7.0 3.8 2478 14.1 1.7 1.4 269
31 Dunda 2124 7.0 2.5 2103 15.0 1.3 0.1 254
32 Sejbahar 1428 5.0 2.2 1467 19.2 5.5 0.1 155
K. S. Patel et al.
3030
Continued
33 Datrenga 1786 4.8 2.0 1006 20.6 4.2 0.1 174
34 Mujgahan 2668 5.7 2.1 888 12.7 3.6 0.1 179
35 Mova 258 3.9 0.7 205 4.3 3.1 2.8 268
36 Daldalseoni 377 5.6 1.7 371 3.2 3.9 2.3 330
37 Saddu 447 7.4 1.0 819 11.8 7.1 2.0 367
38 Sankari 306 3.6 1.5 676 10.1 3.2 2.2 243
39 Dhansuli 235 4.5 1.1 1491 3.2 1.7 1.2 189
40 Lohara 237 4.5 1.4 2746 2.9 0.8 1.7 140
41 Dondekhurd 175 4.5 1.3 680 2.2 1.1 1.3 191
42 Dondekala 251 4.9 1.7 470 5.6 1.5 2.0 358
43 Chataud 258 4.5 1.7 320 3.8 3.1 2.6 343
44 Semaria 132 2.2 2.0 818 4.1 1.3 0.3 163
45 Bhurkoni 44 3.4 1.8 438 2.9 4.9 3.6 162
46 Lalpur 194 4.2 2.4 1217 4.1 0.7 1.6 285
47 Chhapora 122 3.2 2.4 1433 9.5 1.7 1.3 166
48 Donde 226 3.5 1.7 1211 3.4 3.2 1.3 71
49 Saragaon 412 5.6 2.9 321 6.2 3.8 2.2 66
50 Narhada 155 3.4 1.4 1219 7.0 2.5 1.5 41
51 Baronda 429 3.8 1.8 219 13.2 1.1 1.1 101
52 Arang Godhi 817 4.8 2.5 476 27.9 8.5 0.1 303
53 Paragaon (Arang) 528 3.6 2.2 1792 4.5 1.3 0.6 232
54 Amethi 345 5.6 1.8 717 17.2 9.8 2.0 321
55 Ranisagar 269 4.2 1.1 1408 12.0 1.7 0.4 353
56 Banarasi 482 5.3 2.1 1488 14.8 6.6 0.4 418
57 Bana 1033 4.2 1.7 1379 28.3 3.8 1.9 358
58 Kosrangi 1135 5.5 3.2 984 9.5 3.9 1.2 329
59 Arang 1734 8.1 1.1 907 21.3 4.5 0.7 270
60 Rasani 914 2.0 1.5 644 5.9 1.0 1.5 254
61 Lakholi 1249 2.1 1.5 1515 21.0 1.3 0.7 357
62 Amsena 2240 5.6 2.2 1671 13.9 5.2 0.1 233
63 Chikhali 1189 2.1 2.0 1185 20.9 2.2 0.1 325
64 Kutela 966 2.5 3.2 583 9.0 3.1 0.3 249
65 Kurud 1245 3.1 1.7 290 7.4 1.0 0.9 259
66 Kagdehi 770 2.2 3.1 387 4.5 2.1 1.5 290
K. S. Patel et al.
3031
Continued
67 Samoda 1685 2.8 2.7 693 6.4 3.4 0.1 118
68 Chaprid 868 2.4 2.8 1909 15.3 3.2 1.2 162
69 Abhanpur Abhanpur 288 3.2 1.7 2100 13.6 13.4 0.1 426
70 Kendri 218 3.6 2.9 1092 5.5 9.9 0.8 160
71 Manikchauri 130 5.2 1.4 616 18.1 7.8 2.7 325
72 Chhachanpairi 427 3.9 3.5 888 10.9 6.7 1.7 124
73 Kolar 1810 6.4 4.6 1108 26.5 2.0 0.1 343
74 Khopra 367 4.2 1.7 815 9.1 4.5 1.3 275
75 Sakari 609 3.2 0.8 933 3.2 11.2 1.6 252
76 Chandi 378 4.6 0.8 387 8.1 1.3 1.7 262
77 Kachna 250 6.0 2.8 320 4.5 0.7 3.2 385
78 Amasibani 169 6.0 2.0 2301 10.2 1.3 2.3 190
79 Tilda Tilda 112 6.2 1.8 1652 31.2 7.3 3.4 286
80 Biladi 132 3.4 4.5 2548 6.6 2.8 3.4 395
81 Kota 272 5.5 5.0 1961 11.1 5.5 1.8 332
82 Bahesar 84 4.5 4.6 1485 19.2 6.6 3.1 414
83 Tarashiv 118 4.6 4.6 1540 17.8 5.9 2.9 515
84 Murabangoli 30 5.6 4.9 1988 13.2 2.8 3.9 284
85 Kharora 487 5.7 3.2 1379 15.7 1.1 1.6 253
86 Rajim Bhelvadih 193 3.6 3.4 1541 13.7 3.2 0.1 285
87 Navapara 169 4.6 1.0 1652 20.2 4.6 0.1 325
88 Kurra 95 4.3 1.3 2045 9.7 2.4 1.6 207
89 Pipraud 125 5.0 3.9 1736 17.4 9.1 2.3 285
90 Rajim 244 2.7 0.8 896 5.3 1.7 1.6 258
91 Balodabazar Koliyari 500 2.7 0.8 784 13.9 5.2 0.8 213
92 Navagaon 484 4.6 1.0 1933 10.5 6.2 3.3 732
93 Charoda 347 4.6 2.2 934 16.4 7.6 1.8 226
94 Sirri 1089 4.3 2.4 1050 22.3 1.0 2.2 369
95 Kanki 1169 2.1 2.8 539 18.9 1.8 0.5 232
96 Bhaisa 1135 2.0 4.3 1312 4.6 5.9 1.9 274
97 Bhaismudi 1306 2.8 4.3 1302 12.6 4.2 1.3 266
98 Chanpa Jhar 1513 6.0 1.3 1624 21.8 3.6 0.1 272
99 Torla 367 3.4 2.4 1650 19.6 0.6 1.4 324
100 Tama Seoni 694 3.9 2.0 1092 18.5 4.5 0.8 551

K. S. Patel et al.
3032
3.9. Sulphur The earth’s crust contain about 0.06% Sulphur [27]. It is mostly present as sulfides, sulfates and organic combi-nations with C and N. The available and total 2
4SO − in this region was lie in the range of 41 - 747 and 294 - 1782 mg/kg with mean value of 281 ± 25 and 631 ± 180 mg/kg, respectively. The critical limit of 2
4SO − in the soil was reported to be 10 mg/kg. No soils of the studied area were found to be deficient in sulfur level.
3.10. Concentration Variations and Statistics The range, mean, median, kurtosis and skewness values of micronutrient concentration in soils of 100 villages of the studied area are presented in Table 2. The highest value of Fe or 2
4SO − , Cu, Zn, Mn, Co, Ni and Mo was observed in site i.e. Khamtarai, Arang, Murabangoli, Mandir Hasaud, Tilda, Abanpur and Dharsiva, respectively, Figure 2. The content of six micronutrients i.e. 2
4SO − , Cu, Zn, Co, Ni and Mo are symmetrically distributed in all locations, Figure 3. However, large variations in the content of two micronutrients i.e. Fe and Mn was seen, may be due to input by the industrial effluents, Figure 3. The data for seven micronutrients i.e. Cu, Zn, Mn, Co, Ni, Mo and 2
4SO − were found to be distributed normally and symmetrically with comparable median and mean values. A large variation in the case of Fe was noticed, may be due to asymmetric distribution of iron minerals in the soil. The available content of the micronutrients in soils of the studied area was found in the following de-creasing order: Mn > Fe > SO4
2−> Co > Cu > Ni > Zn > Mo, Figure 4. Among them, manganese was found to be at the highest level followed by Fe. However in the case of total levels, a different trend (Fe > Mn > SO4
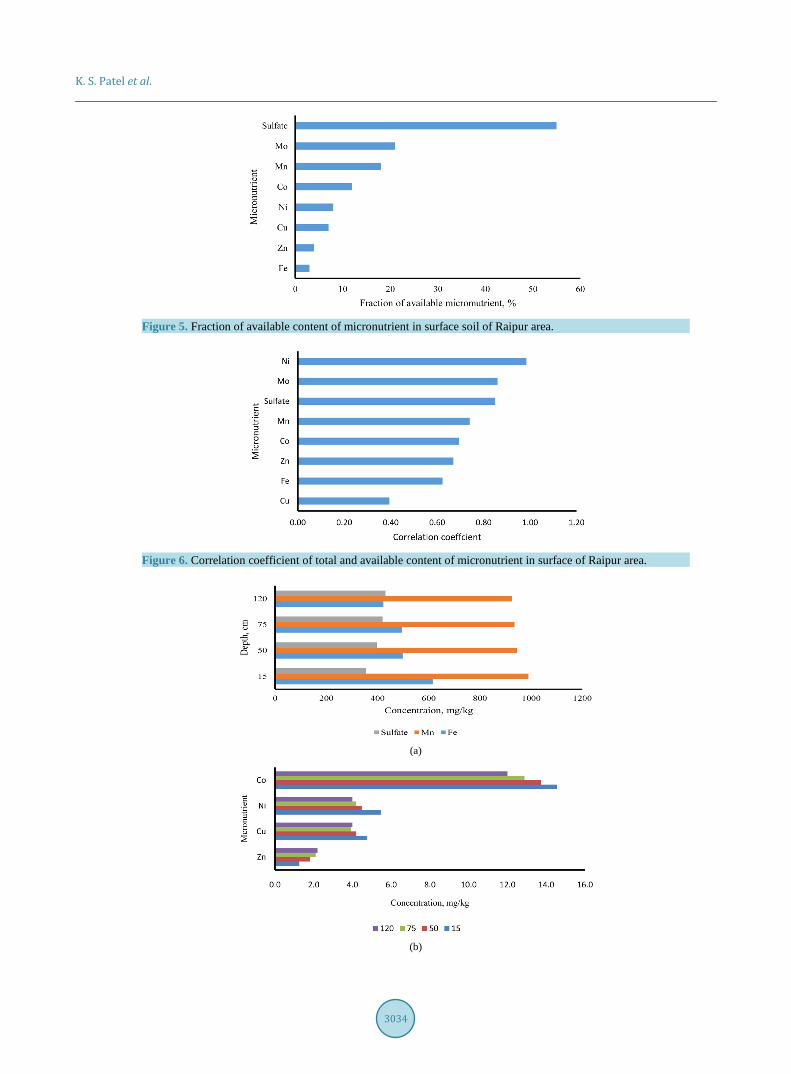
2−> Co > Cu > Zn > Ni > Mo) was observed, Figure 4. A large fraction of S was found to be available for the plant growth, Figure 5. However, low to moderate fractions of other micronutrients were available, Figure 5. All of them showed a positive correlation between the available and total metal content with the highest and lowest values for Ni and Cu, respectively, Figure 6.
The available content of all micronutrients except Zn and 24SO − was found to decrease as the soil profile was
increased from 0 to 120 cm, may be due to strong adsorption of the cations by the geomedia, Figure 7. The total content of all micronutrients except 2
4SO − was found to increase as the soil depth profile was increased from 0 to 120 cm due to their poor adsorption by the geo-media, Figure 8.
(a) (b)
Figure 2. Representation of locations showing maximum micronutrient concentration in studied area.
Table 2. Statistics for distribution of available micronutrients in the soil, (n = 100).
Parameter Fe Cu Zn Mn Co Ni Mo 24SO −
Minimum, mg/kg 30 2.0 0.7 205 2.2 0.1 0.1 41
Maximum, mg/kg 8253 8.1 5 2800 31.2 13.4 8.9 747
Mean, mg/kg 642 4.3 2.3 1178 12.8 3.9 1.5 281
Median, mg/kg 330 4.3 2.0 1100 12.6 3.2 1.4 269
Kurt 41.7 0.1 −0.1 −0.3 −0.3 0.8 9.9 3.3
Skew 5.5 0.4 0.9 0.5 0.4 1.0 2.3 1.4

K. S. Patel et al.
3033
(a)
(b)
Figure 3. Representation of distribution pattern of micronutrients in surface soil of Raipur area.
(a)
(b)
Figure 4. Mean value of total (T) and available (Av) content of micronutrient in the surface soil of Raipur area.
K. S. Patel et al.
3034
Figure 5. Fraction of available content of micronutrient in surface soil of Raipur area.
Figure 6. Correlation coefficient of total and available content of micronutrient in surface of Raipur area.
(a)
(b)

K. S. Patel et al.
3035
(c)
Figure 7. Depth profile studies of available content of micronutrient in soil of Raipur area.
(a)
(b)
(c)
Figure 8. Depth profile studies of total content of micronutrient in soil of Raipur area.
3.11. Micronutrient Deficiency and Toxicity The micronutrients i.e. Fe, Mn, Co, Ni, Cu, Zn, Mo and S are used in very small amounts. The presence of mi-cronutrients below critical limit often causes adverse effects in plant growth and in their yields. For each micro-nutrient, the critical levels, limit of deficiency, toxicity and optimal growth vary with the genotype and are pro-foundly affected by plant metabolism and by edaphic and environmental factor that affect the absorption of nu-trients. In the studied area, five micronutrients i.e. Co, Ni, Cu, Mo and S are found in soils at the sufficient levels. Two micronutrients i.e. Fe and Mn are present at toxic levels in all types of soils of this region. In some area, the
0 0.2 0.4 0.6 0.8 1 1.2 1.4 1.6
15
50
75
120
Mo concentration, mg/kg
Dep
th, c
m
0 5000 10000 15000 20000 25000
15
50
75
120
Concentration, mg
Dep
th, c
m
Mn Fe
0 100 200 300 400 500 600 700
SulfateCoNiCuZn
Concentration, mg/kg
Mic
ronu
trien
t
120 75 50 15
0.0 1.0 2.0 3.0 4.0 5.0 6.0 7.0
15
50
75
120
Mo concentration, mg/kg
Dep
th, c
m

K. S. Patel et al.
3036
Zn deficiency in the soils is observed. The iron chlorosis was commonly seen in the plants of this region which may be due to very high amount of Fe content in soil. The brown or purplish spots on leaves, on lower part of the stem and leaf margins are commonly marked in this region that may be due to manganese toxicity.The most visible zinc deficiency symptoms i.e. short internodes and a decrease in leaf size were observed in the plants of this region.
3.12. Comparison of Micronutrient Status The concentration of available maximum amount of Fe, Mn, Zn, 2
4SO − and Cu reported was 12234, 269, 121, 70, and 30 mg/kg, respectively [8] [11] [21]. The levels of micronutrients i.e. Fe, Mn, and S were found to be at the highest levels in this region. The content of Cu was present at moderated levels similar to other part of coun-try [7]. The Zn content was present low levels as occurred in other parts of the Country [7]. The level of Mo was present at moderate levels but high content of Fe, Mn, and S may cause Mo deficiency.
4. Conclusion All types of soils in Raipur area are found to be associated with high levels of Fe, Mn, S; moderate levels of Cu and low level of Mo and Zn. The relative abundance of free form of micronutrients (available content/total con-tent) in soils of this region is found in following decreasing order: S >> Mn > Mo > Cu >> Zn ≈ Fe. The adverse effects i.e. chlorosis of young leaves, premature fall of fruits, narcotics, stunned growth of plants/crops in plants of this region are frequently seen may be due to either Fe and Mn toxicities or Zn deficiency or their combina-tion. The Zn deficiency could be corrected by application of Zn compounds e.g. Zinc sulfate, Zinc oxide, Zinc phosphate, etc. in the soil.
Acknowledgements We are thankful to the Madhya Pradesh Council of Science & Technology, Raipur for granting scholarship to one of the author: SC.
References [1] Gupta, U.C., Kening, W. and Siyuan, L. (2008) Micronutrients in Soils, Crops and Livestock. Earth Science Frontiers,
15, 110-125. http://dx.doi.org/10.1016/S1872-5791(09)60003-8 [2] Renwick, A.G. and Walker, R. (2008) Risk Assessment of Micronutrients. Toxicology Letters, 180, 123-130.
http://dx.doi.org/10.1016/j.toxlet.2008.05.009 [3] Fageria, N.K., Baligar, V.C. and Clark, R.B. (2002) Micronutrients in Crop Production. Advances in Agronomy, 77,
185-268. http://dx.doi.org/10.1016/S0065-2113(02)77015-6 [4] Welch, R.M. and Shuman, L. (1995) Micronutrient Nutrition of Plants. Critical Reviews in Plant Sciences, 14, 49-82.
http://dx.doi.org/10.1080/07352689509701922 [5] Mortvedt, J.J., Cox, F.R., Shuman, L.M. and Welch, R.M. (1991) Micronutrients in Agriculture Second Edition Num-
ber 4 in the Soil Science Society of America Book Series Chapter 14. Soil Science Society of America, Inc., Madison. [6] Chatzistathis, T. (2014) Micronutrient Deficiency in Soils & Plants, Micronutrient Solubility and Availability in Soils.
Bentham Science Publishers Ltd., Oak Park. [7] Gupta, A.P. (2005) Micronutrient Status and Fertilizer Use Scenario in India. Journal of Trace Elements in Medicine
and Biology, 18, 325-331. http://dx.doi.org/10.1016/j.jtemb.2005.04.003 [8] Gowda, N.K.S., Ramana, J.V., Prasad, C.S. and Singh, K. (2004) Micronutrient Content of Certain Tropical Conven-
tional and Unconventional Feed Resources of Southern India. Tropical Animal Health and Production, 36, 77-94. http://dx.doi.org/10.1023/B:TROP.0000009522.30949.1d
[9] Yadav, B.K. (2011) Micronutrient Status of Soils under Legume Crops in Arid Region of Western Rajasthan, India. Academic Journal of Plant Sciences, 4, 94-97.
[10] Sharma, J.C. and Chaudhary, S.K. (2007) Vertical Distribution of Micronutrient Cations in Relation to Soil Characte-ristics in Lower Shiwalika of Solan District in North-West Himalayas. Journal of the Indian Society of Soil Science, 55, 40-44.
[11] Venkastesh, M.S., Majumdar, B.K. and Patriam, K. (2003) Status of Micronutrient Cations under Various Land Use Systems of Meghalaya. Journal of the Indian Society of Soil Science, 51, 60-64.

K. S. Patel et al.
3037
[12] Sharma, R.P., Singh, M. and Sharma, J.P. (2003) Correlation Studies on Micronutrients Vis-a-Vis Soil Properties in Some Soils of Nagaur Districts in Semi-Arid Region of Rajasthan. Journal of the Indian Society of Soil Science, 51, 522-527.
[13] Somasundaram, J., Singh, R.K., Parandiyal, A.K. and Prasad, S.N. (2009) Micronutrient Status of Soils under Different Land Use Systems in Chambal Ravines. Journal of the Indian Society of Soil Science, 57, 307-312.
[14] Yadav, R.L. and Meena, M.C. (2009) Available Micronutrient Status and Their Relationship with Soil Properties of Degana Soil Series of Rajasthan. Journal of the Indian Society of Soil Science, 57, 90-92.
[15] Hundal, H.S., Raj, K., Singh, D. and Machandra, J.S. (2006) Available Nutrient and Heavy Metal Status of Soils of Punjab, North-West India. Journal of the Indian Society of Soil Science, 54, 50-56.
[16] Anil, S., Sharma, P.K., Tur, N.S. and Nayyar, V.K. (2009) Micronutrient Status and Their Spatial Variability in Soils of Muktsar District of Punjab—A GIS Approach. Journal of the Indian Society of Soil Science, 57, 300-306.
[17] Kumar, M. and Babel, A.L. (2011) Available Micronutrient Status and Their Relationship with Soil Properties of Jhunjhunu Tehsil, District Jhunjhunu, Rajasthan, India. Journal of Agricultural Science, 3, 97-106. http://www.ccsenet.org/journal/index.php/jas/article/view/11011 http://dx.doi.org/10.5539/jas.v3n2p97
[18] Prasad, B. and Sinha, N.P. (1982) Changes in the Status of Micronutrients in Soil with Long Term Applications of Chemical Fertilizers, Lime and Manure. Plant and Soil, 64, 437-441. http://dx.doi.org/10.1007/BF02372526
[19] Arunachalam, P., Kannan, P., Prabukumar, G. and Govindaraj, M. (2013) Zinc Deficiency in Indian Soils with Special Focus to Enrich Zinc in Peanut. African Journal of Agricultural Research, 8, 6681-6688. http://eprints.icrisat.ac.in/id/eprint/12416
[20] Patra, P., Mondal, S. and Ghosh, G.K. (2012) Status of Available Sulphur in Surface and Sub-Surface Soils of Red and Lateritic Soils of West Bengal. International Journal of Plant Animal and Environmental Sciences, 2, 276-281.
[21] Singh, A.H., Kumarjit, S.R.K., Singh L.N., Gopimohan, S.N., Nandini, C. and Kumar, S.A.K. (2007) Sulphur Status and forms in Acid Soils of Manipur. Indian Journal of Agricultural Research, 41, 205-209.
[22] Velmurugana, R., Mahendranb, P.P., Wania, S.P., Uttama, K. and Prabhavathic, M. (2013) Molybdenum Status and Critical Limit in the Soil for Green Gram (Vigna radiata) Growing in Madurai and Sivagangai Districts of Tamil Nadu, India. Soil Science and Plant Nutrition, 59, 229-236. http://dx.doi.org/10.1080/00380768.2012.763021
[23] Dhamak, A.L., Meshram, N.A. and Waikar, S.L. (2014) Assessment of Micronutrient Indices in Soils of Ambajogai Tahsil of Beed District under Semiarid Agro Ecological Region (Maharashtra). Journal of Research in Agriculture and Animal Science, 2, 40-43. http://www.questjournals.org/
[24] Tan, K.H. (2005) Soil Sampling, Preparation and Analysis. 2nd Edition, CRC Press, Boca Raton. https://www.crcpress.com/Books-in-Soils-Plants-and-the-Environment/book-series/CRCBKSPE
[25] Sippola, J. (1994) Acid Ammonium Acetate-EDTA Universal Extractant in Soil Testing and Environmental Monitor-ing. Communications in Soil Science and Plant Analysis, 25, 1755-1761. http://dx.doi.org/10.1080/00103629409369149
[26] Zbiral, J. (1992) Determination of Molybdenum in Hot-Water Soil Extracts: Influence of pH and Available Iron on the Molybdenum Content. Communications in Soil Science and Plant Analysis, 23, 817-825. http://dx.doi.org/10.1080/00103629209368631
[27] Rudnick, R.L. and Gao, S. (2003) The Composition of the Continental Crust. In: Holland, H.D. and Turekian, K.K., Eds., Treatise on Geochemistry, Vol. 3, The Crust, Elsevier-Pergamon, Oxford, 1-64. http://dx.doi.org/10.1016/b0-08-043751-6/03016-4