status of micronutrient deficiencies in soils of haryana ... of micronutrients deficiencies...
TRANSCRIPT
Indian J. Fert., Vol. 11 (5), pp.16-27 (12 pages)
Arvind K. Shukla1, R. S. Malik2, Pankaj K. Tiwari1, Chandra Prakash1, Sanjib K. Behera1, Harendra Yadav 2 and R. P. Narwal2
1. AICRP on Micronutrients, ICAR–Indian Institute of Soil Science, Bhopal2. Chaudhary Charan Singh Haryana Agricultural University, Hisar
Corresponding author : pankajkumar [email protected]
Micronutrient deficiency is major constraints in crop production as well as crop quality. The deficiency of micronutrientsin soils leads to lower micronutrient content in edible plant parts and thereby causing a health problem in animaland human beings. Level of micronutrients in soils is determined by geologic substrate and subsequent geochemicaland pedogenic processes. However, their availability depends on soil pH, organic carbon content and absorptivesurface like CaCO3 and clay content and other physical, chemical and biological conditions of the rhizosphere. Theanalysis of 5673 soil samples collected across the Haryana state showed a wide variability in status of availablemicronutrient deficiency in soils. The current status of Zn, Fe, Mn, Cu and B varied from 1.11 to 36.5, 0.0-55.0, 0.0-48.6, 0.0-13.0 and 0.0-13.7%, respectively with an average deficiency of 15.3, 21.6, 6.1 5.2 and 3.3 %. Compared tomicronutrient deficiency estimated in previous years, Zn deficiency has declined due to regular use of zinc sulphatehowever, deficiency of Fe and Mn has increased significantly. Areas with multiple micronutrient deficiency is limited,thus standard fertilisers are sufficient to mitigate specific micronutrient deficiencies in specific areas. Dependingupon the crop, status of micronutrient deficiencies and their supplementation, positive response by almost all thecrops to external application corroborated with the micronutrients deficiency status in soils. The strong linkagebetween soil and plant micronutrients with animal and human health was evident from the studies conducted.However, in order to address micronutrient deficiency in animal and human being, new strategies responsible forhigher loading of micronutrients in crop need to be developed.
Indian Journal of Fertilisers, May 201516
Status of Micronutrient Deficiencies in Soils of HaryanaImpact on Crop Productivity and Human Health
INTRODUCTION
Haryana , one of theagriculturally important states ofIndia contributes about 7% to thenational food grain productionwith only about 1.33% ofgeographical area. Multiplecropping with two or morecereals or four to five vegetablecrops are being cultivated, ifmoisture is not a limiting factor(13). Soils of Haryana are one themost important arable soil typesin North India, improving theirproductivity is considered to be aneffective means of ensuringnational food security. Besidessoils being deficient in primarynutrients, crops grown in mostsoils suffer from deficiencies ofone or more micronutrients, eventhough the soils often containapparently adequate totalamounts of the micronutrients.
The status of any nutrient in soilsindicates its nutrient supplyingcapability to the crops growingon it. When seen along with cropdemand, this is the majordeterminant for external nutrientinput. Only a fraction of the totalnutrient present in the soil existsin readily or potentially availableform and, therefore a knowledge ofavailable nutrient status of soils isvery valuable in planningfertilisation of agriculture, it servesas an indicator of soil fertility andthus overall fertility status of a soilhas to be assessed for eachnutrient separately. Until now,micronutrients have mostly beenaddressed as one of the soilproblems but micronutrientdeficiencies and complexities havenow been observed abundantly incrops produced frommicronutrient deficient soils andthese in turn produce nutrient
deficient foods and fodder. Humanand animals depending on suchfoods have also shown mineraldeficiency symptoms (21).
The nature and extent ofmicronutrient deficiencies varywith soil type, crop genotype,management and agro-ecologicalsituations. With the intensivecropping of high yielding varietiesof rice and wheat in the state,deficiency of zinc (Zn) initially, andsubsequently deficiencies of iron(Fe) in rice and manganese (Mn) inwheat emerged as threats tosustaining high levels of foodgrainproduction (23). Micronutrientdeficiencies are now frequentlyobserved in intensively cultivatedareas of the state where cereals,oilseeds, pulses and vegetablecrops are grown. Due towidespread and regularapplication of Zn fertilisers, the
Indian Journal of Fertilisers, May 201517
occurrence of Zn deficiency hasdeclined in recent years, butm u l t i p l e - m i c r o n u t r i e n tdeficiencies may become aproblem in future, if notaddressed properly (4, 13, 21). Inorder to tackle the problems ofmicro- and secondary nutrientdeficiencies in the Haryana state,the Indian Council ofAgricultural Research (ICAR)formulated an All IndiaCoordinated Scheme ofMicronutrients in 1967 at Hisar.Since then, the centre is workingon emerging issues on micro- andsecondary nutrient problems andthe amelioration measures in thestate.
In order to apply nutrient basedon soil fertility, it is necessary toknow the location specificvariability in nutrient supply toovercome the mismatch offertiliser rates and crop nutrientdemand. The distribution ofavailable micronutrientsincluding multiple micro-nutrientdeficiencies is immensely neededto understand and establish linkbetween soil and availablemicronutrients and animal-human health. In animalnutrition, Zn an essentialmicronutrient, and positiverelationships between soil Zncontents or availability, Zncontents of forage and fodders, andanimal Zn status have been clearlyestablished. In many of thesestudies in animal nutrition, directlinkages between low soilmicronutrient contents and lownutrient contents of forage andfodders have been clearlyestablished. A typical example is astudy in Haryana, India, where lowlevels of Zn in buffalo milk couldbe directly linked to low Zn levelsin local soils and in fodderproduced on these soils (27). In thispaper, efforts had been made toassess available micronutrientstatus in Haryana soils and itsmapping in different categorieswhich would be helpful in devisingmanagement decision for bettercrop production and humanhealth. During the current study,the spatial variability of plantaccessible micronutrients viz., Zn,
Fe, Mn, Cu and B were investigatedusing geostatistical tools andgeographical information systemto create nutrient maps andprovide useful information for theapplication of inputs as per soilstatus and crop demand.
Soil Sampling, Analysis andPreparation of Deficiency Maps
A total of 5,673 surface soilsamples (0-15 cm depth) coveringall the talukas and districts of thestate were collected by adoptingthe standard procedures of soilsample collection during the year2009-2014, immediately afterharvest of predominant rice crop.The sampling size varied with thesize of the district, cropped areaand cropping intensity from all 21districts of the state, i.e., Ambala(86), Bhiwani (551), Faridabad (95),Fatehabad (464), Gurgaon (116),Hisar (607), Jhajjar (95), Jind (440),Kaithal (385), Karnal (362),Kurukshetra (396), Mewat (94),Mahendragarh (347), Palwal (249),Panchkula (76), Panipat (326),Rewari (90), Rohtak (142), Sirsa(510), Sonipat (140) and Yamuna-nagar (102).
The soil samples were analysedfor micronutrients (Zn, Fe, Mn, Cuand B) by adopting standardprocedures for soil analysis.Analysis of Zn, Fe Mn, and Cu wasperformed using DiethyleneTriamine Penta Acetic Acid (0.005DTPA+0.1 M Triethanolamine and0.01M Ca Cl2 solution buffer) asoutlined by Lindsay and Norwell(1978) while hot water soluble Bwas analysed suggested by Bergerand Truog (1939). The Soilmicronutrient maps wereprepared using kriging(geostatistics techniques) methodin ArcGIS. Descriptive statisticalanalysis was carried out first todetermine the mean, maximum,minimum, standard deviation andcoefficient of variation of thevariables of data. Critical limitsused for the study were 0.60 mgDTPA-extractable Zn kg-1 soil, 4.50mg DTPA-extractable Fe kg -1 soil,0.20 mg DTPA-extractable Cu kg-1
soil, 2.50 mg DTPA-extractable Mn
kg-1 soil and 0.50 mg hot water-soluble B kg-1 soil.
MICRONUTRIENTS STATUS OFSOILS OF HARYANA
A. Delineation and Mapping ofMicronutrients Deficiency
1. DTPA-extractable zinc and iron
Zinc soil fertility is a good index ofZn content in fodder and grain assignificant correlation is foundbetween available Zn content ofsoils and Zn content in grain evenunder farmers’ fields. The criticallimits of Zn used for this study was0.6 mg Zn kg-1soil however it varieswith soil and crop type. For clearprediction of possible deficiencies,the critical limit has to be refinedwith reference to the soilcharacteristics and plant parts forindividual crops as the soils andcrops vary widely in their nutrientsupplying and utilizationefficiency. Zinc deficiency in cropsis the common micronutrientproblem world over. Therefore, Znmalnutrition has become a majorhealth burden among the resourcepoor people (21).
Systematic survey and analysisof 5,673 soil samples analysedunder the aegis of AICRP-MSPEindicated deficiency of Zn to theextent of 15.3%, however, itvaries across soil types, agro-ecological zones and moreimportantly management andproductivity of crops and croppingsystems. The deficiency of Zn inHaryana is much lower than thenational average of 40%. Thereason for declining Zn deficiencyin Haryana is inadvertent use ofzinc sulphate. The zinc sulphateconsumption in the state isreported to be 14,651 tonnesmaking it third largest zincsulphate user state after Punjaband Andhra Pradesh (3). The Zndeficiency was reported to be lessthan five percent in Ambala,Faridabad, Kaithal, Kurukshetra,Panchkula, Rewari and Sonipat(Table 1). In the soils of Hisar,Fatehabad, Karnal, Rohtak, Jind,Palwal districts, the Zn deficiencyranged from 5-15%. Interestingly,

Indian Journal of Fertilisers, May 201518
out of 102 soil samples collectedin Yamunanagar, not even a singlesample was found to be in Zndeficient category. In terms ofquantitative availability of Zn insoils of state, it ranged from 0.08to 42.07 mg kg-1 soil. Among the 21districts, the highest Zndeficiency was recorded inBhiwani and Mahendragarhdistricts (more than 36%).
In Indian soils, Fe is anotherlimiting micronutrient for cropsas plant Fe deficiency is knownto occur since long in many partsof the country. In most soils, Fe ispresent in large quantities as itconstitutes about 3-5% of soil,making it fourth most abundantelement in the crust, after oxygen,silicon and aluminium. However,most of the Fe in soils isunavailable for plant absorption(10). For example, Fe deficiency iscommon in calcareous soils (whichhave high pH), because itsavailability to plant decreaseswith increasing pH. On the otherhand, Fe availability is generallyhigh in acid soils, moreover, Cu, Zn,Mn and phosphate ions are Feantagonists and their higher level
in soils reduces Fe uptake byplants.
Metabolically, Fe is essential forchlorophyll and protein formation,photosynthesis, electron transfer,oxidation and reduction ofnitrates and sulphates and otherenzyme activities. Its deficiencycauses interveinal chlorosis innewly emerging young leavesdue to reduced chlorophyllsynthesis resulting in poor growthand loss in yield (11). Amongcrops, Fe deficiency is frequentlynoticed in sugarcane and uplandrice, pulses and horticulturalcrops. The deficiency of Fe is furtheraggravated under excess ofcarbonate and bicarbonate ions,ionic imbalances, higher pH andlow water potential.
The Fe status in soils of Haryanastate has been a cause of concernfor the stakeholders since lastdecade. On average, 22% soils aredeficient in available Fe, however,it ranges from 0.12 to 81.43% anddistricts like Mahendragarh(55.04%), Hisar (48.27%),Fatehabad (46.12%), Sirsa (38.24%),Bhiwani (29.22%) and Rohtak
(26.06%) have been most affected(Table 1). Of the 21 districts, soilsof Ambala, Faridabad, Gurgaonand Sonipat did not show Fedeficiency. Soil samples collectedfrom Yamunanagar, Rewari,Panipat, Panchkula, Mewat,Kaithal and Kurukshetra exhibitedFe deficiency to the tune of 1 to2.50% only.
2. DTPA-extractable manganeseand copper
The parent material, geomorphic,physico-chemical, biologicalprocesses of soil control the totalMn content as well as itsdistribution in different forms insoils and its supply to cropsgrown on it. Although totalmanganese is present in largeamount in most of the soils, itsavailability becomes a problem insandy loam soils which frequentlyundergoes wetting and drying. InIndia, the deficiency of Mn has beenobserved in light textured andcalcareous soils (8). If the soil isalkaline, the availability of Mnbecomes a constraint as itsavailability is low at high pH (19,22).Widespread deficiency of
Table 1 – Available zinc and iron status (DTPA-extractable) in soils of different districts of HaryanaDistrict DTPA-Zn DTPA-Fe
Range Mean±SE PSD Range Mean±SE PSDAmbala 0.32-9.60 3.34±0.25 3.49 4.82-23.56 16.29±0.43 0.00Bhiwani 0.13-6.44 0.94±0.03 36.48 1.66-23.74 6.99±0.16 29.22Faridabad 0.28-7.32 2.29±0.16 5.26 7.01-33.40 17.51±0.69 0.00Fatehabad 0.14-6.83 1.63±0.05 13.79 0.69-30.24 7.11±0.26 46.12Gurgaon 0.32-3.82 1.51±0.07 18.10 4.95-34.28 9.35±0.50 0.00Hisar 0.08-5.54 1.62±0.04 14.99 0.68-33.00 6.68±0.24 48.27Jhajjar 0.10-3.88 1.23±0.07 15.79 1.20-57.80 15.60±1.33 14.74Jind 0.09-5.12 1.65±0.05 8.86 0.12-40.09 18.86±0.51 9.32Kaithal 0.35-25.28 2.80±0.13 4.94 0.44-42.61 22.79±0.35 1.30Karnal 0.34-5.55 1.74±0.07 14.36 2.25-21.48 12.92±0.27 7.73Kurukshetra 0.20-4.11 1.90±0.04 3.03 2.34-24.62 14.13±0.21 1.77Mewat 0.42-2.86 1.21±0.05 10.64 4.44-32.32 10.61±0.59 1.06Mahendragarh 0.20-4.00 0.95±0.03 36.02 1.14-16.32 4.68±0.11 55.04Palwal 0.14-42.07 2.29±0.30 6.43 2.26-44.70 14.97±0.74 10.04Panchkula 0.36-6.97 2.76±0.17 1.32 3.58-44.30 26.46±1.28 1.32Panipat 0.31-6.81 1.21±0.06 26.38 2.06-43.48 15.22±0.47 2.45Rewari 0.46-6.77 2.09±0.12 1.11 4.35-21.36 9.76±0.43 2.22Rohtak 0.30-5.61 1.32±0.08 14.08 1.34-81.43 11.83±0.83 26.06Sirsa 0.18-6.93 1.77±0.05 16.47 0.62-30.02 8.43±0.28 38.24Sonipat 0.44-4.26 1.99±0.09 2.86 4.80-36.30 15.88±0.48 0.00Yamuna nagar 0.92-8.00 2.55±0.14 0.00 1.78-52.26 31.06±1.12 1.96Haryana 0.08-42.07 1.70±0.02 15.30 0.12-81.43 12.29±0.12 21.60
Indian Journal of Fertilisers, May 201519
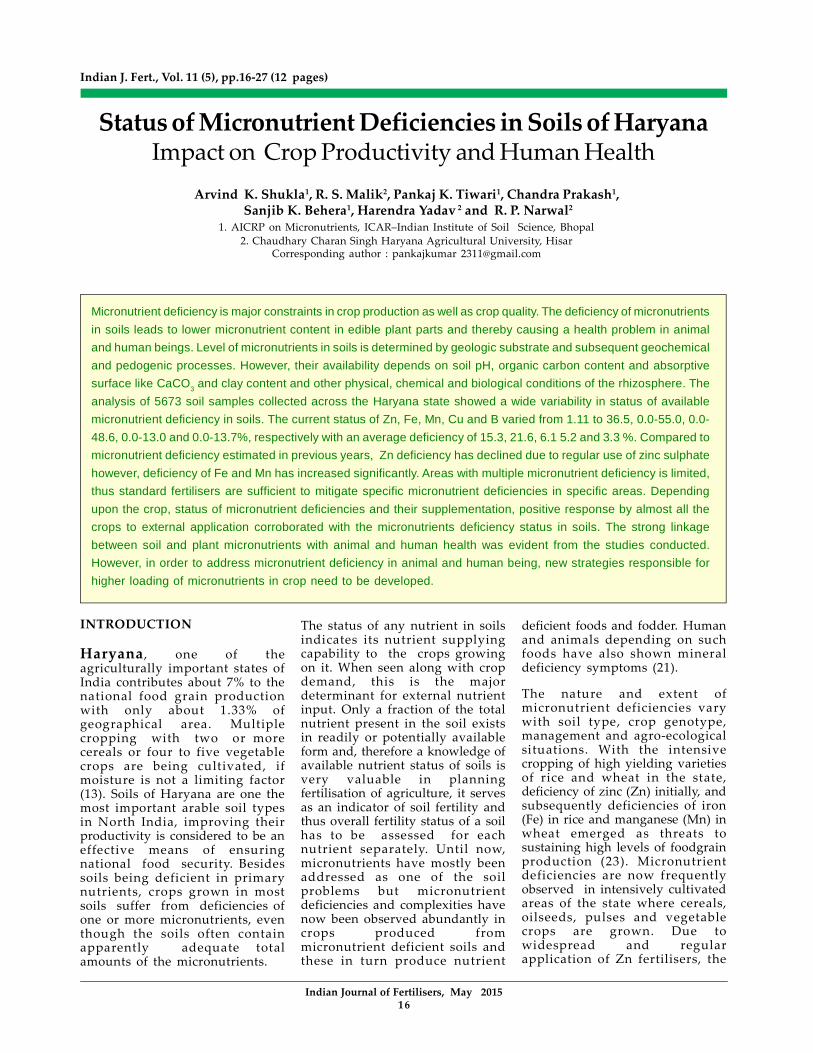
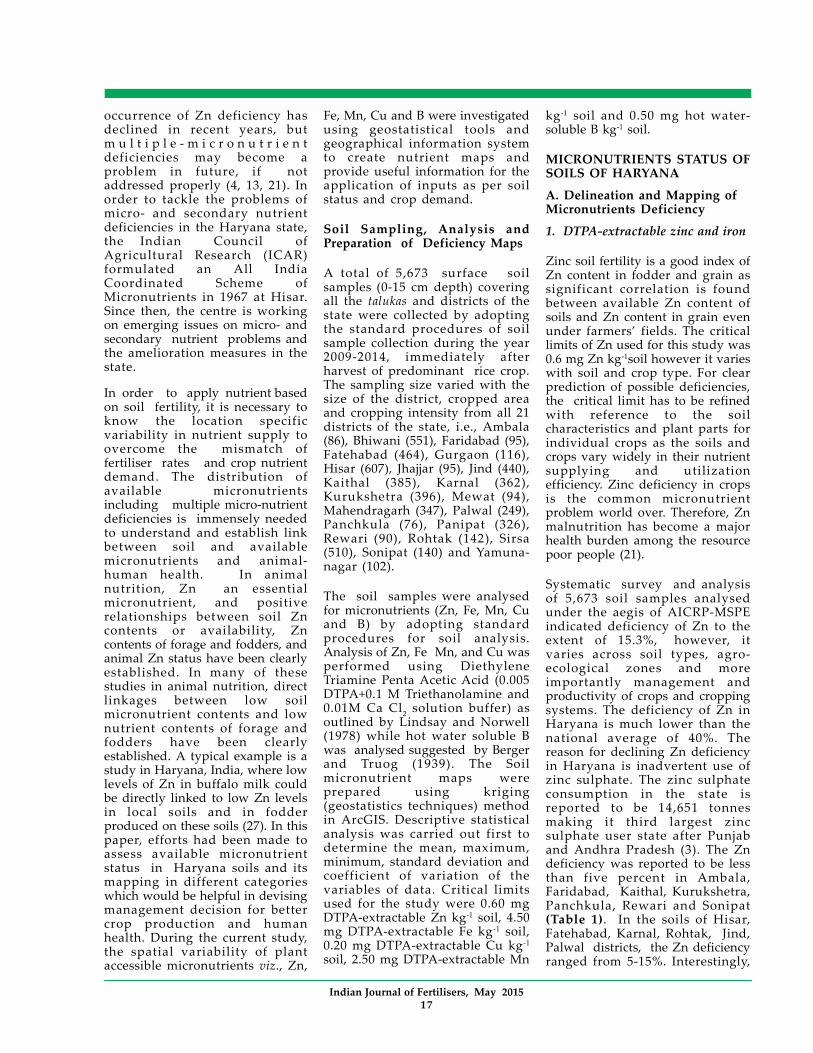
manganese (Mn) has beenreported in arid and semi-aridsoils (15, 25). Manganese is a mainconstraint for sustainable wheatproduction in coarse texturedsoils, low in organic mattercontent, with high calciumcarbonate content and high pH. Awide spread deficiency of Mn inwheat and berseem was reportedin the northwest India in the early1980s when farmers adopted arice-wheat cropping system onthe soils, which were coarse intexture and low in organic matter(20). Status and distribution ofDTPA extractable Zn and Fe indistricts of Haryana are given inMap 1 and Map 2.
The data given in Table 2revealed that DTPA-Mn in thesurface soils of Haryana variedfrom 0.15- 48.10 mg Mn kg -1soilwith an overall deficiency of 6.10%.The deficiency of Mn was foundto be 48.62, 10.05, 9.27 and 6.53%in the districts of Karnal, Hisar,Fatehabad and Bhiwani,respectively. However, most of thedistricts viz. Jind, Rohtak, Palwal,Panipat, Ambala, Faridabad,Gurgaon, Jhajjar, Kaithal, Mewat,Mahendragarh, Panchkula,
Sonipat and Yamuna nagar did nothave problem of Mn deficiency insoils (<1.0%).
After Zn and Fe, problem of Cudeficiency in soils of the state iscoming up to an alarmingsituation. Soils with high organicmatter favour complexation of Cuwith organic substances, thus,could result in Cu deficiency inplants. Though Haryana soils arevery poor in organic matter butCu deficiency has been observed.Deficiency of Cu negativelyimpacts grain, seed, and fruitformation (depending on the crop)to a greater degree than its effecton the vegetative growth. The Cudeficiency in Haryana is generallyattributed to high pH andcalcareousness of soils (1).
The DTPA-extractable Cu in soilsof Haryana ranged from 0.04 to21.22 mg kg -1 soil and overalldeficiency was observed to be5.20%. However, deficiency of Cuin soils of Mahendragarh (12.97%),Bhiwani (9.26%), Fatehabad(9.05%), Hisar (8.24%), Karnal(8.01%) and Sirsa (5.69%) districtshas been observed to be more than5% (Table 2).
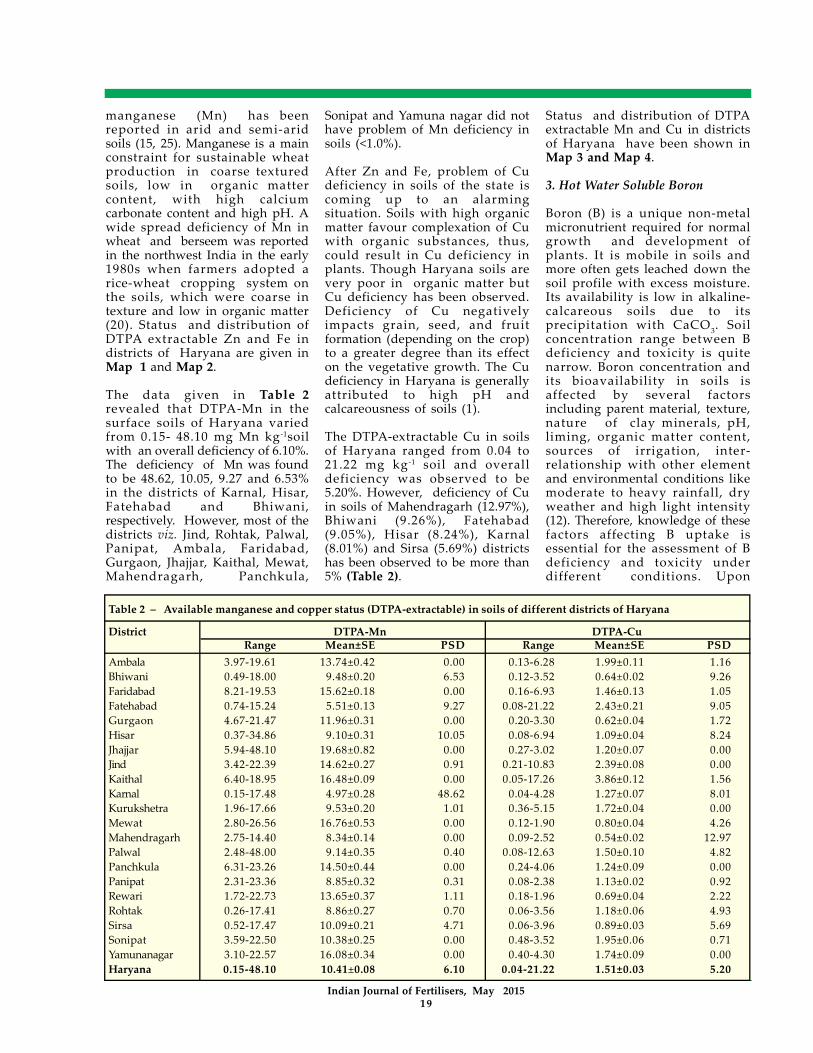
Status and distribution of DTPAextractable Mn and Cu in districtsof Haryana have been shown inMap 3 and Map 4.
3. Hot Water Soluble Boron
Boron (B) is a unique non-metalmicronutrient required for normalgrowth and development ofplants. It is mobile in soils andmore often gets leached down thesoil profile with excess moisture.Its availability is low in alkaline-calcareous soils due to itsprecipitation with CaCO3. Soilconcentration range between Bdeficiency and toxicity is quitenarrow. Boron concentration andits bioavailability in soils isaffected by several factorsincluding parent material, texture,nature of clay minerals, pH,liming, organic matter content,sources of irrigation, inter-relationship with other elementand environmental conditions likemoderate to heavy rainfall, dryweather and high light intensity(12). Therefore, knowledge of thesefactors affecting B uptake isessential for the assessment of Bdeficiency and toxicity underdifferent conditions. Upon
Table 2 – Available manganese and copper status (DTPA-extractable) in soils of different districts of Haryana
District DTPA-Mn DTPA-CuRange Mean±SE PSD Range Mean±SE PSD
Ambala 3.97-19.61 13.74±0.42 0.00 0.13-6.28 1.99±0.11 1.16Bhiwani 0.49-18.00 9.48±0.20 6.53 0.12-3.52 0.64±0.02 9.26Faridabad 8.21-19.53 15.62±0.18 0.00 0.16-6.93 1.46±0.13 1.05Fatehabad 0.74-15.24 5.51±0.13 9.27 0.08-21.22 2.43±0.21 9.05Gurgaon 4.67-21.47 11.96±0.31 0.00 0.20-3.30 0.62±0.04 1.72Hisar 0.37-34.86 9.10±0.31 10.05 0.08-6.94 1.09±0.04 8.24Jhajjar 5.94-48.10 19.68±0.82 0.00 0.27-3.02 1.20±0.07 0.00Jind 3.42-22.39 14.62±0.27 0.91 0.21-10.83 2.39±0.08 0.00Kaithal 6.40-18.95 16.48±0.09 0.00 0.05-17.26 3.86±0.12 1.56Karnal 0.15-17.48 4.97±0.28 48.62 0.04-4.28 1.27±0.07 8.01Kurukshetra 1.96-17.66 9.53±0.20 1.01 0.36-5.15 1.72±0.04 0.00Mewat 2.80-26.56 16.76±0.53 0.00 0.12-1.90 0.80±0.04 4.26Mahendragarh 2.75-14.40 8.34±0.14 0.00 0.09-2.52 0.54±0.02 12.97Palwal 2.48-48.00 9.14±0.35 0.40 0.08-12.63 1.50±0.10 4.82Panchkula 6.31-23.26 14.50±0.44 0.00 0.24-4.06 1.24±0.09 0.00Panipat 2.31-23.36 8.85±0.32 0.31 0.08-2.38 1.13±0.02 0.92Rewari 1.72-22.73 13.65±0.37 1.11 0.18-1.96 0.69±0.04 2.22Rohtak 0.26-17.41 8.86±0.27 0.70 0.06-3.56 1.18±0.06 4.93Sirsa 0.52-17.47 10.09±0.21 4.71 0.06-3.96 0.89±0.03 5.69Sonipat 3.59-22.50 10.38±0.25 0.00 0.48-3.52 1.95±0.06 0.71Yamunanagar 3.10-22.57 16.08±0.34 0.00 0.40-4.30 1.74±0.09 0.00Haryana 0.15-48.10 10.41±0.08 6.10 0.04-21.22 1.51±0.03 5.20
Indian Journal of Fertilisers, May 201520
Map 1 – Status and distribution of DTPA-extractable Znin the different districts of Haryana
Map 2 – Status and distribution of DTPA-extractableFe in the different districts of Haryana
Map 4 – Status and distribution of DTPA-extractable Cu in the different districts of Haryana
Map 3 – Status and distribution of DTPA-extractableMn in the different districts of Haryana
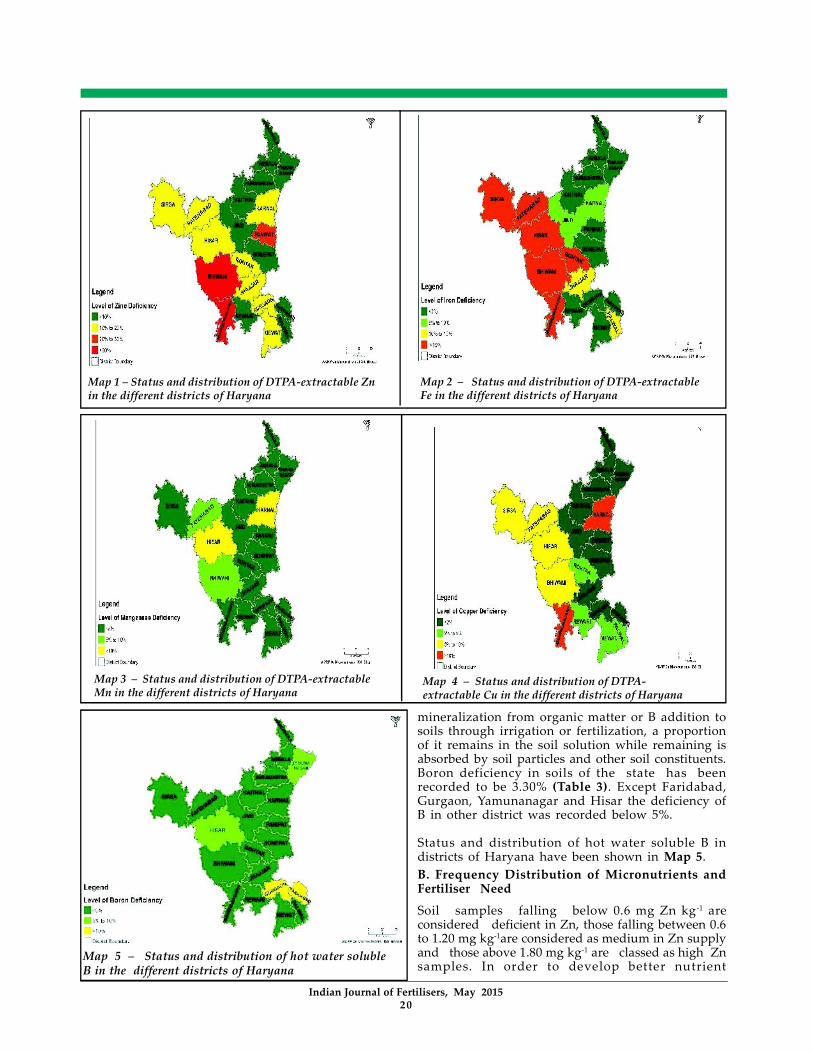
Map 5 – Status and distribution of hot water solubleB in the different districts of Haryana
mineralization from organic matter or B addition tosoils through irrigation or fertilization, a proportionof it remains in the soil solution while remaining isabsorbed by soil particles and other soil constituents.Boron deficiency in soils of the state has beenrecorded to be 3.30% (Table 3). Except Faridabad,Gurgaon, Yamunanagar and Hisar the deficiency ofB in other district was recorded below 5%.
Status and distribution of hot water soluble B indistricts of Haryana have been shown in Map 5.B. Frequency Distribution of Micronutrients andFertiliser Need
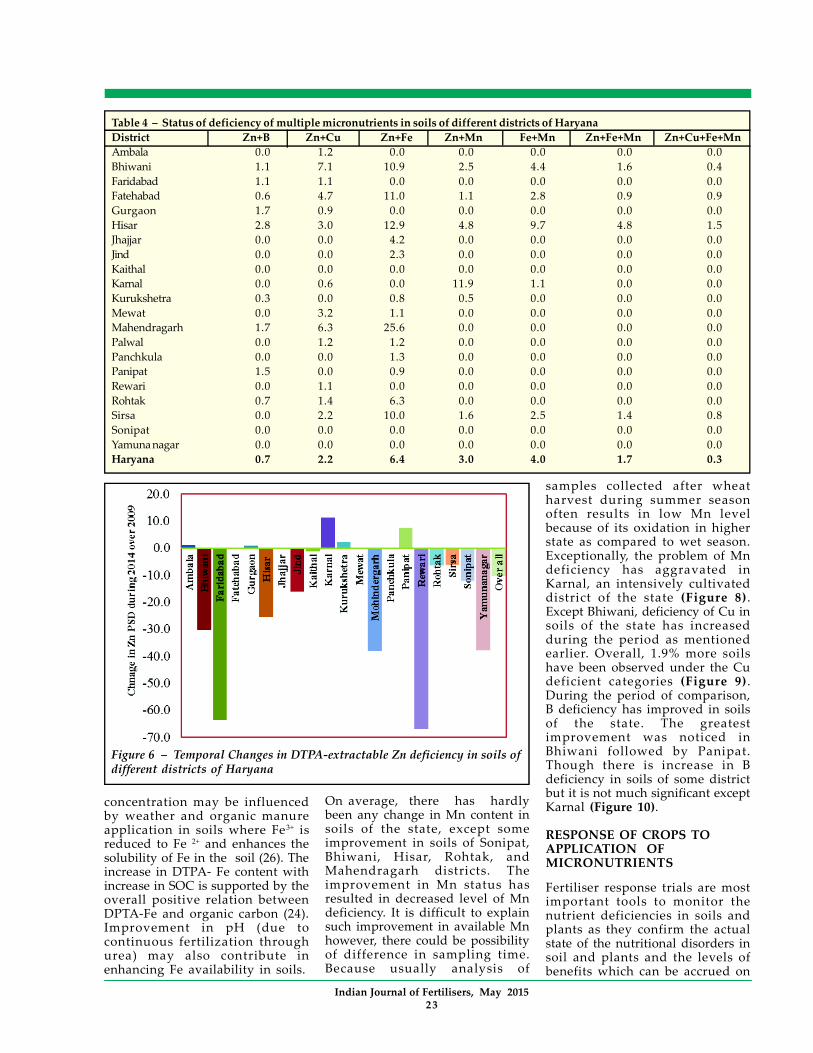
Soil samples falling below 0.6 mg Zn kg -1 areconsidered deficient in Zn, those falling between 0.6to 1.20 mg kg-1are considered as medium in Zn supplyand those above 1.80 mg kg-1 are classed as high Znsamples. In order to develop better nutrient
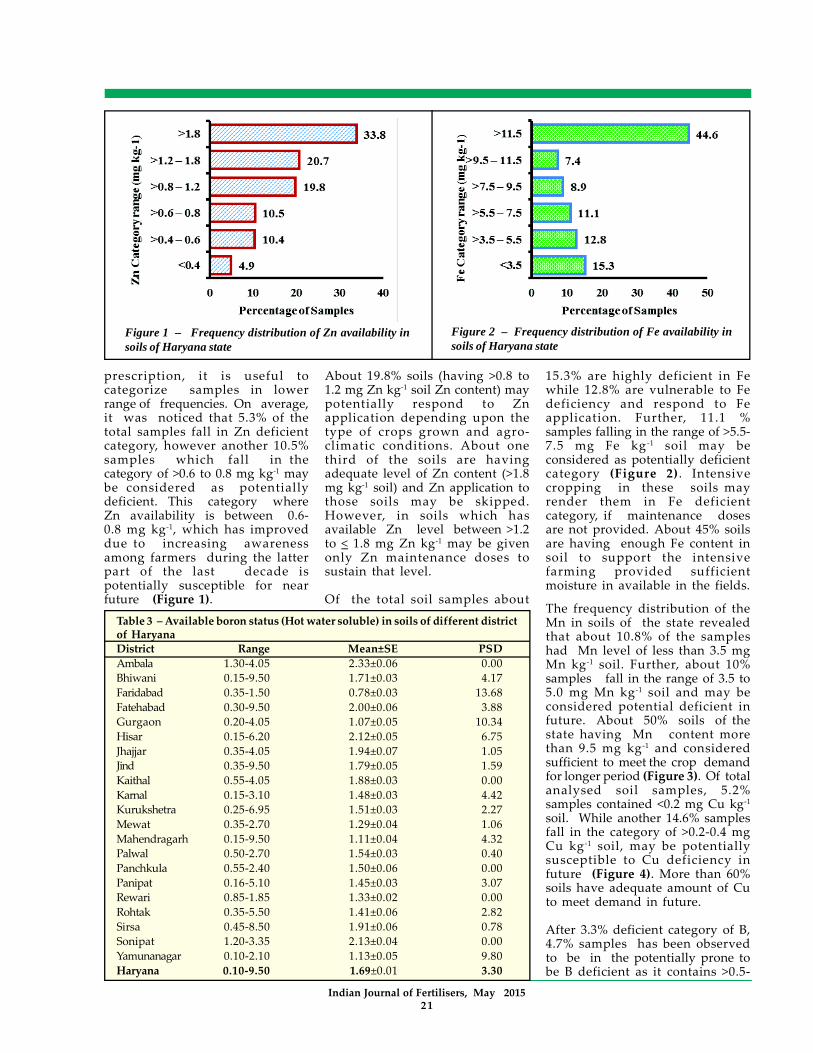
prescription, it is useful tocategorize samples in lowerrange of frequencies. On average,it was noticed that 5.3% of thetotal samples fall in Zn deficientcategory, however another 10.5%samples which fall in thecategory of >0.6 to 0.8 mg kg-1 maybe considered as potentiallydeficient. This category whereZn availability is between 0.6-0.8 mg kg-1, which has improveddue to increasing awarenessamong farmers during the latterpart of the last decade ispotentially susceptible for nearfuture (Figure 1).
Figure 1 – Frequency distribution of Zn availability insoils of Haryana state
Figure 2 – Frequency distribution of Fe availability insoils of Haryana state
About 19.8% soils (having >0.8 to1.2 mg Zn kg-1 soil Zn content) maypotentially respond to Znapplication depending upon thetype of crops grown and agro-climatic conditions. About onethird of the soils are havingadequate level of Zn content (>1.8mg kg-1 soil) and Zn application tothose soils may be skipped.However, in soils which hasavailable Zn level between >1.2to < 1.8 mg Zn kg-1 may be givenonly Zn maintenance doses tosustain that level.
Of the total soil samples about
15.3% are highly deficient in Fewhile 12.8% are vulnerable to Fedeficiency and respond to Feapplication. Further, 11.1 %samples falling in the range of >5.5-7.5 mg Fe kg -1 soil may beconsidered as potentially deficientcategory (Figure 2) . Intensivecropping in these soils mayrender them in Fe deficientcategory, if maintenance dosesare not provided. About 45% soilsare having enough Fe content insoil to support the intensivefarming provided sufficientmoisture in available in the fields.
The frequency distribution of theMn in soils of the state revealedthat about 10.8% of the sampleshad Mn level of less than 3.5 mgMn kg-1 soil. Further, about 10%samples fall in the range of 3.5 to5.0 mg Mn kg -1 soil and may beconsidered potential deficient infuture. About 50% soils of thestate having Mn content morethan 9.5 mg kg-1 and consideredsufficient to meet the crop demandfor longer period (Figure 3). Of totalanalysed soil samples, 5.2%samples contained <0.2 mg Cu kg-1
soil. While another 14.6% samplesfall in the category of >0.2-0.4 mgCu kg -1 soil, may be potentiallysusceptible to Cu deficiency infuture (Figure 4). More than 60%soils have adequate amount of Cuto meet demand in future.
After 3.3% deficient category of B,4.7% samples has been observedto be in the potentially prone tobe B deficient as it contains >0.5-
Table 3 – Available boron status (Hot water soluble) in soils of different districtof HaryanaDistrict Range Mean±SE PSDAmbala 1.30-4.05 2.33±0.06 0.00Bhiwani 0.15-9.50 1.71±0.03 4.17Faridabad 0.35-1.50 0.78±0.03 13.68Fatehabad 0.30-9.50 2.00±0.06 3.88Gurgaon 0.20-4.05 1.07±0.05 10.34Hisar 0.15-6.20 2.12±0.05 6.75Jhajjar 0.35-4.05 1.94±0.07 1.05Jind 0.35-9.50 1.79±0.05 1.59Kaithal 0.55-4.05 1.88±0.03 0.00Karnal 0.15-3.10 1.48±0.03 4.42Kurukshetra 0.25-6.95 1.51±0.03 2.27Mewat 0.35-2.70 1.29±0.04 1.06Mahendragarh 0.15-9.50 1.11±0.04 4.32Palwal 0.50-2.70 1.54±0.03 0.40Panchkula 0.55-2.40 1.50±0.06 0.00Panipat 0.16-5.10 1.45±0.03 3.07Rewari 0.85-1.85 1.33±0.02 0.00Rohtak 0.35-5.50 1.41±0.06 2.82Sirsa 0.45-8.50 1.91±0.06 0.78Sonipat 1.20-3.35 2.13±0.04 0.00Yamunanagar 0.10-2.10 1.13±0.05 9.80Haryana 0.10-9.50 1.69±0.01 3.30
Indian Journal of Fertilisers, May 201521
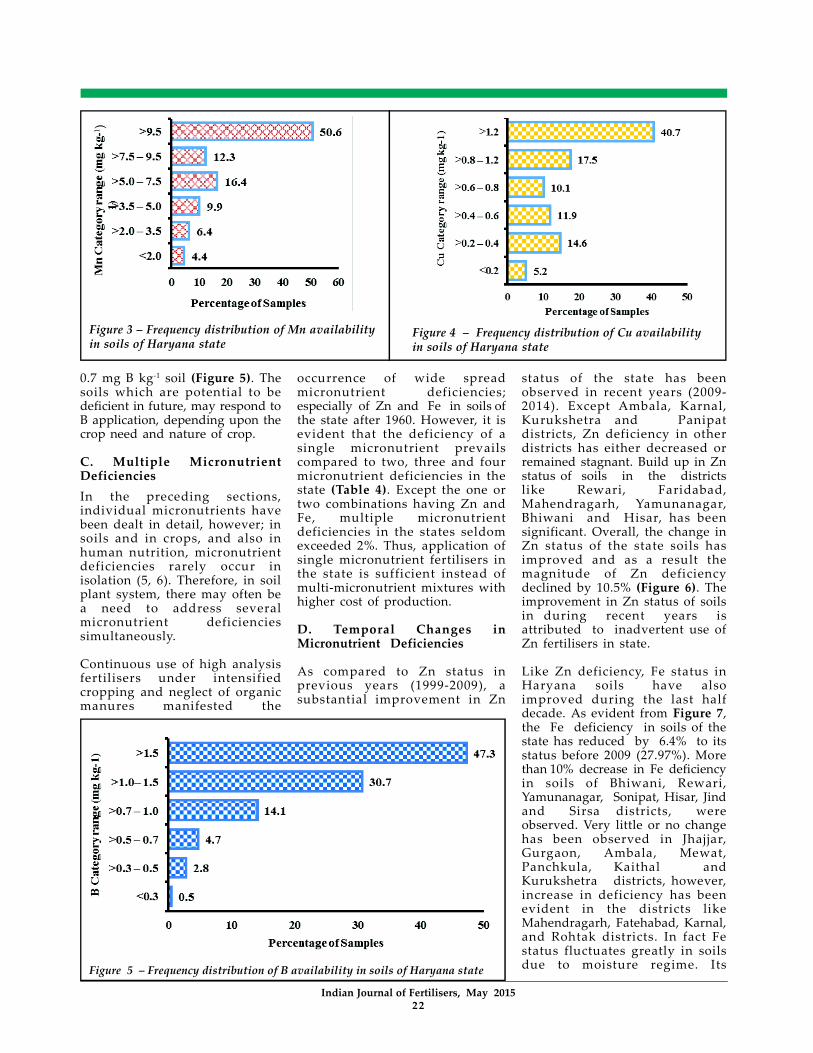
0.7 mg B kg-1 soil (Figure 5). Thesoils which are potential to bedeficient in future, may respond toB application, depending upon thecrop need and nature of crop.
C. Multiple MicronutrientDeficienciesIn the preceding sections,individual micronutrients havebeen dealt in detail, however; insoils and in crops, and also inhuman nutrition, micronutrientdeficiencies rarely occur inisolation (5, 6). Therefore, in soilplant system, there may often bea need to address severalmicronutrient deficienciessimultaneously.
Continuous use of high analysisfertilisers under intensifiedcropping and neglect of organicmanures manifested the
Figure 3 – Frequency distribution of Mn availabilityin soils of Haryana state
Figure 4 – Frequency distribution of Cu availabilityin soils of Haryana state
Figure 5 – Frequency distribution of B availability in soils of Haryana state
Indian Journal of Fertilisers, May 201522
occurrence of wide spreadmicronutrient deficiencies;especially of Zn and Fe in soils ofthe state after 1960. However, it isevident that the deficiency of asingle micronutrient prevailscompared to two, three and fourmicronutrient deficiencies in thestate (Table 4). Except the one ortwo combinations having Zn andFe, multiple micronutrientdeficiencies in the states seldomexceeded 2%. Thus, application ofsingle micronutrient fertilisers inthe state is sufficient instead ofmulti-micronutrient mixtures withhigher cost of production.
D. Temporal Changes inMicronutrient Deficiencies
As compared to Zn status inprevious years (1999-2009), asubstantial improvement in Zn
status of the state has beenobserved in recent years (2009-2014). Except Ambala, Karnal,Kurukshetra and Panipatdistricts, Zn deficiency in otherdistricts has either decreased orremained stagnant. Build up in Znstatus of soils in the districtslike Rewari, Faridabad,Mahendragarh, Yamunanagar,Bhiwani and Hisar, has beensignificant. Overall, the change inZn status of the state soils hasimproved and as a result themagnitude of Zn deficiencydeclined by 10.5% (Figure 6). Theimprovement in Zn status of soilsin during recent years isattributed to inadvertent use ofZn fertilisers in state.
Like Zn deficiency, Fe status inHaryana soils have alsoimproved during the last halfdecade. As evident from Figure 7,the Fe deficiency in soils of thestate has reduced by 6.4% to itsstatus before 2009 (27.97%). Morethan 10% decrease in Fe deficiencyin soils of Bhiwani, Rewari,Yamunanagar, Sonipat, Hisar, Jindand Sirsa districts, wereobserved. Very little or no changehas been observed in Jhajjar,Gurgaon, Ambala, Mewat,Panchkula, Kaithal andKurukshetra districts, however,increase in deficiency has beenevident in the districts likeMahendragarh, Fatehabad, Karnal,and Rohtak districts. In fact Festatus fluctuates greatly in soilsdue to moisture regime. Its
1 )
Indian Journal of Fertilisers, May 201523
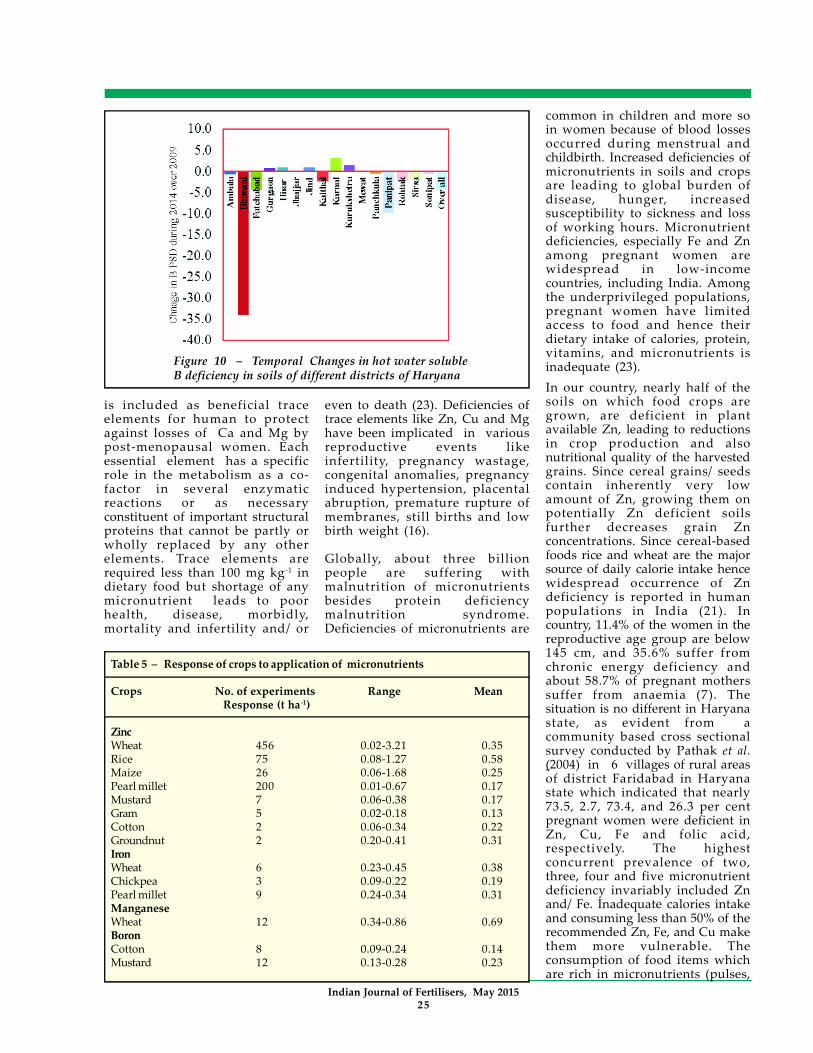
samples collected after wheatharvest during summer seasonoften results in low Mn levelbecause of its oxidation in higherstate as compared to wet season.Exceptionally, the problem of Mndeficiency has aggravated inKarnal, an intensively cultivateddistrict of the state (Figure 8) .Except Bhiwani, deficiency of Cu insoils of the state has increasedduring the period as mentionedearlier. Overall, 1.9% more soilshave been observed under the Cudeficient categories (Figure 9) .During the period of comparison,B deficiency has improved in soilsof the state. The greatestimprovement was noticed inBhiwani followed by Panipat.Though there is increase in Bdeficiency in soils of some districtbut it is not much significant exceptKarnal (Figure 10).
RESPONSE OF CROPS TOAPPLICATION OFMICRONUTRIENTS
Fertiliser response trials are mostimportant tools to monitor thenutrient deficiencies in soils andplants as they confirm the actualstate of the nutritional disorders insoil and plants and the levels ofbenefits which can be accrued on
Table 4 – Status of deficiency of multiple micronutrients in soils of different districts of HaryanaDistrict Zn+B Zn+Cu Zn+Fe Zn+Mn Fe+Mn Zn+Fe+Mn Zn+Cu+Fe+MnAmbala 0.0 1.2 0.0 0.0 0.0 0.0 0.0Bhiwani 1.1 7.1 10.9 2.5 4.4 1.6 0.4Faridabad 1.1 1.1 0.0 0.0 0.0 0.0 0.0Fatehabad 0.6 4.7 11.0 1.1 2.8 0.9 0.9Gurgaon 1.7 0.9 0.0 0.0 0.0 0.0 0.0Hisar 2.8 3.0 12.9 4.8 9.7 4.8 1.5Jhajjar 0.0 0.0 4.2 0.0 0.0 0.0 0.0Jind 0.0 0.0 2.3 0.0 0.0 0.0 0.0Kaithal 0.0 0.0 0.0 0.0 0.0 0.0 0.0Karnal 0.0 0.6 0.0 11.9 1.1 0.0 0.0Kurukshetra 0.3 0.0 0.8 0.5 0.0 0.0 0.0Mewat 0.0 3.2 1.1 0.0 0.0 0.0 0.0Mahendragarh 1.7 6.3 25.6 0.0 0.0 0.0 0.0Palwal 0.0 1.2 1.2 0.0 0.0 0.0 0.0Panchkula 0.0 0.0 1.3 0.0 0.0 0.0 0.0Panipat 1.5 0.0 0.9 0.0 0.0 0.0 0.0Rewari 0.0 1.1 0.0 0.0 0.0 0.0 0.0Rohtak 0.7 1.4 6.3 0.0 0.0 0.0 0.0Sirsa 0.0 2.2 10.0 1.6 2.5 1.4 0.8Sonipat 0.0 0.0 0.0 0.0 0.0 0.0 0.0Yamuna nagar 0.0 0.0 0.0 0.0 0.0 0.0 0.0Haryana 0.7 2.2 6.4 3.0 4.0 1.7 0.3
Figure 6 – Temporal Changes in DTPA-extractable Zn deficiency in soils ofdifferent districts of Haryana
concentration may be influencedby weather and organic manureapplication in soils where Fe3+ isreduced to Fe 2+ and enhances thesolubility of Fe in the soil (26). Theincrease in DTPA- Fe content withincrease in SOC is supported by theoverall positive relation betweenDPTA-Fe and organic carbon (24).Improvement in pH (due tocontinuous fertilization throughurea) may also contribute inenhancing Fe availability in soils.
On average, there has hardlybeen any change in Mn content insoils of the state, except someimprovement in soils of Sonipat,Bhiwani, Hisar, Rohtak, andMahendragarh districts. Theimprovement in Mn status hasresulted in decreased level of Mndeficiency. It is difficult to explainsuch improvement in available Mnhowever, there could be possibilityof difference in sampling time.Because usually analysis of
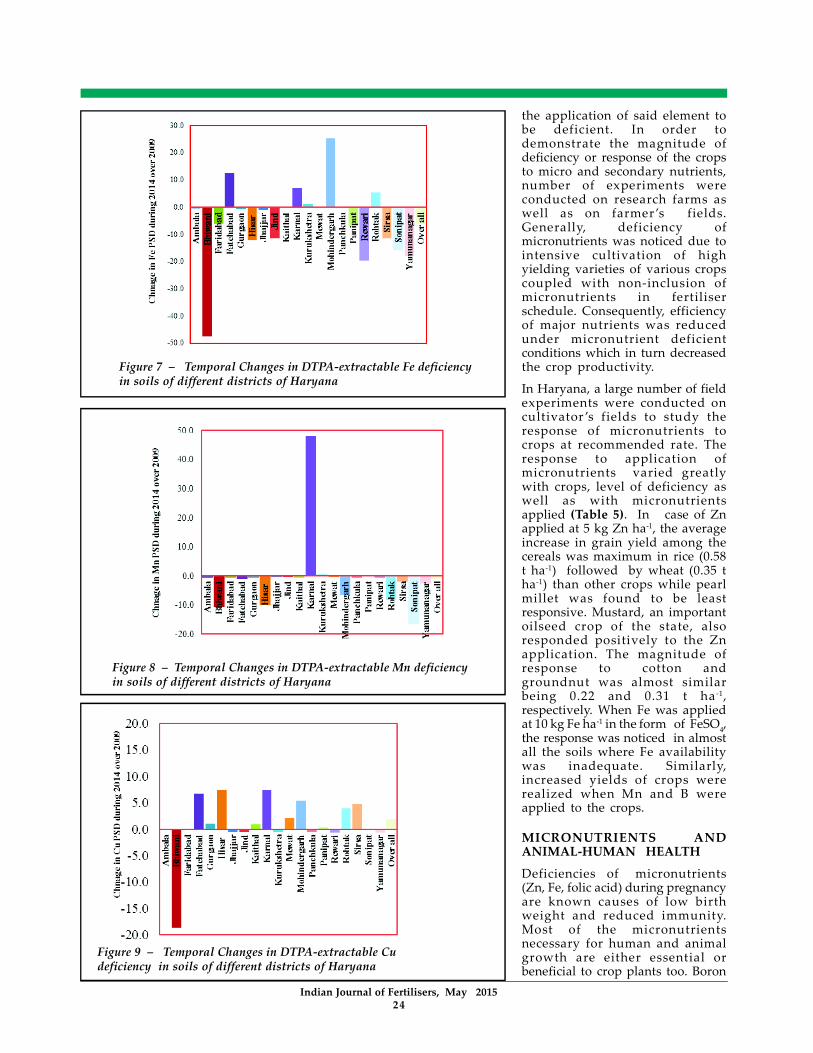
Figure 8 – Temporal Changes in DTPA-extractable Mn deficiencyin soils of different districts of Haryana
Indian Journal of Fertilisers, May 201524
the application of said element tobe deficient. In order todemonstrate the magnitude ofdeficiency or response of the cropsto micro and secondary nutrients,number of experiments wereconducted on research farms aswell as on farmer ’s fields.Generally, deficiency ofmicronutrients was noticed due tointensive cultivation of highyielding varieties of various cropscoupled with non-inclusion ofmicronutrients in fertiliserschedule. Consequently, efficiencyof major nutrients was reducedunder micronutrient deficientconditions which in turn decreasedthe crop productivity.
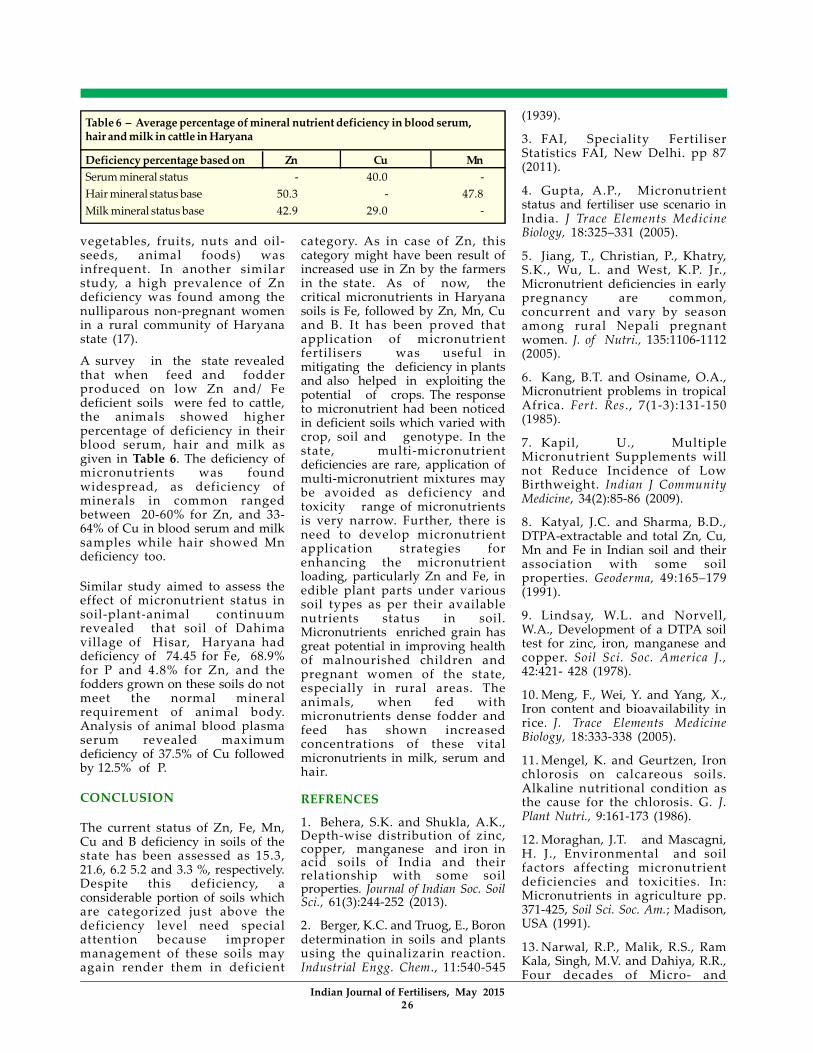
In Haryana, a large number of fieldexperiments were conducted oncultivator ’s fields to study theresponse of micronutrients tocrops at recommended rate. Theresponse to application ofmicronutrients varied greatlywith crops, level of deficiency aswell as with micronutrientsapplied (Table 5). In case of Znapplied at 5 kg Zn ha-1, the averageincrease in grain yield among thecereals was maximum in rice (0.58t ha-1) followed by wheat (0.35 tha-1) than other crops while pearlmillet was found to be leastresponsive. Mustard, an importantoilseed crop of the state, alsoresponded positively to the Znapplication. The magnitude ofresponse to cotton andgroundnut was almost similarbeing 0.22 and 0.31 t ha -1,respectively. When Fe was appliedat 10 kg Fe ha-1 in the form of FeSO4,the response was noticed in almostall the soils where Fe availabilitywas inadequate. Similarly,increased yields of crops wererealized when Mn and B wereapplied to the crops.
MICRONUTRIENTS ANDANIMAL-HUMAN HEALTH
Deficiencies of micronutrients(Zn, Fe, folic acid) during pregnancyare known causes of low birthweight and reduced immunity.Most of the micronutrientsnecessary for human and animalgrowth are either essential orbeneficial to crop plants too. Boron
Figure 7 – Temporal Changes in DTPA-extractable Fe deficiencyin soils of different districts of Haryana
Figure 9 – Temporal Changes in DTPA-extractable Cudeficiency in soils of different districts of Haryana
Indian Journal of Fertilisers, May 201525
is included as beneficial traceelements for human to protectagainst losses of Ca and Mg bypost-menopausal women. Eachessential element has a specificrole in the metabolism as a co-factor in several enzymaticreactions or as necessaryconstituent of important structuralproteins that cannot be partly orwholly replaced by any otherelements. Trace elements arerequired less than 100 mg kg -1 indietary food but shortage of anymicronutrient leads to poorhealth, disease, morbidly,mortality and infertility and/ or
even to death (23). Deficiencies oftrace elements like Zn, Cu and Mghave been implicated in variousreproductive events likeinfertility, pregnancy wastage,congenital anomalies, pregnancyinduced hypertension, placentalabruption, premature rupture ofmembranes, still births and lowbirth weight (16).
Globally, about three billionpeople are suffering withmalnutrition of micronutrientsbesides protein deficiencymalnutrition syndrome.Deficiencies of micronutrients are
common in children and more soin women because of blood lossesoccurred during menstrual andchildbirth. Increased deficiencies ofmicronutrients in soils and cropsare leading to global burden ofdisease, hunger, increasedsusceptibility to sickness and lossof working hours. Micronutrientdeficiencies, especially Fe and Znamong pregnant women arewidespread in low-incomecountries, including India. Amongthe underprivileged populations,pregnant women have limitedaccess to food and hence theirdietary intake of calories, protein,vitamins, and micronutrients isinadequate (23).In our country, nearly half of thesoils on which food crops aregrown, are deficient in plantavailable Zn, leading to reductionsin crop production and alsonutritional quality of the harvestedgrains. Since cereal grains/ seedscontain inherently very lowamount of Zn, growing them onpotentially Zn deficient soilsfurther decreases grain Znconcentrations. Since cereal-basedfoods rice and wheat are the majorsource of daily calorie intake hencewidespread occurrence of Zndeficiency is reported in humanpopulations in India (21). Incountry, 11.4% of the women in thereproductive age group are below145 cm, and 35.6% suffer fromchronic energy deficiency andabout 58.7% of pregnant motherssuffer from anaemia (7). Thesituation is no different in Haryanastate, as evident from acommunity based cross sectionalsurvey conducted by Pathak et al.(2004) in 6 villages of rural areasof district Faridabad in Haryanastate which indicated that nearly73.5, 2.7, 73.4, and 26.3 per centpregnant women were deficient inZn, Cu, Fe and folic acid,respectively. The highestconcurrent prevalence of two,three, four and five micronutrientdeficiency invariably included Znand/ Fe. Inadequate calories intakeand consuming less than 50% of therecommended Zn, Fe, and Cu makethem more vulnerable. Theconsumption of food items whichare rich in micronutrients (pulses,
Figure 10 – Temporal Changes in hot water solubleB deficiency in soils of different districts of Haryana
Table 5 – Response of crops to application of micronutrients
Crops No. of experiments Range Mean Response (t ha-1)
ZincWheat 456 0.02-3.21 0.35Rice 75 0.08-1.27 0.58Maize 26 0.06-1.68 0.25Pearl millet 200 0.01-0.67 0.17Mustard 7 0.06-0.38 0.17Gram 5 0.02-0.18 0.13Cotton 2 0.06-0.34 0.22Groundnut 2 0.20-0.41 0.31IronWheat 6 0.23-0.45 0.38Chickpea 3 0.09-0.22 0.19Pearl millet 9 0.24-0.34 0.31ManganeseWheat 12 0.34-0.86 0.69BoronCotton 8 0.09-0.24 0.14Mustard 12 0.13-0.28 0.23
Indian Journal of Fertilisers, May 201526
(1939).
3. FAI, Speciality FertiliserStatistics FAI, New Delhi. pp 87(2011).
4. Gupta, A.P., Micronutrientstatus and fertiliser use scenario inIndia. J Trace Elements MedicineBiology, 18:325–331 (2005).
5. Jiang, T., Christian, P., Khatry,S.K., Wu, L. and West, K.P. Jr.,Micronutrient deficiencies in earlypregnancy are common,concurrent and vary by seasonamong rural Nepali pregnantwomen. J. of Nutri., 135:1106-1112(2005).
6. Kang, B.T. and Osiname, O.A.,Micronutrient problems in tropicalAfrica. Fert. Res., 7(1-3):131-150(1985).
7. Kapil, U., MultipleMicronutrient Supplements willnot Reduce Incidence of LowBirthweight. Indian J CommunityMedicine, 34(2):85-86 (2009).
8. Katyal, J.C. and Sharma, B.D.,DTPA-extractable and total Zn, Cu,Mn and Fe in Indian soil and theirassociation with some soilproperties. Geoderma, 49:165–179(1991).
9. Lindsay, W.L. and Norvell,W.A., Development of a DTPA soiltest for zinc, iron, manganese andcopper. Soil Sci. Soc. America J.,42:421 428 (1978).
10. Meng, F., Wei, Y. and Yang, X.,Iron content and bioavailability inrice. J. Trace Elements MedicineBiology, 18:333-338 (2005).
11. Mengel, K. and Geurtzen, Ironchlorosis on calcareous soils.Alkaline nutritional condition asthe cause for the chlorosis. G. J.Plant Nutri., 9:161-173 (1986).
12. Moraghan, J.T. and Mascagni,H. J., Environmental and soilfactors affecting micronutrientdeficiencies and toxicities. In:Micronutrients in agriculture pp.371-425, Soil Sci. Soc. Am.; Madison,USA (1991).
13. Narwal, R.P., Malik, R.S., RamKala, Singh, M.V. and Dahiya, R.R.,Four decades of Micro- and
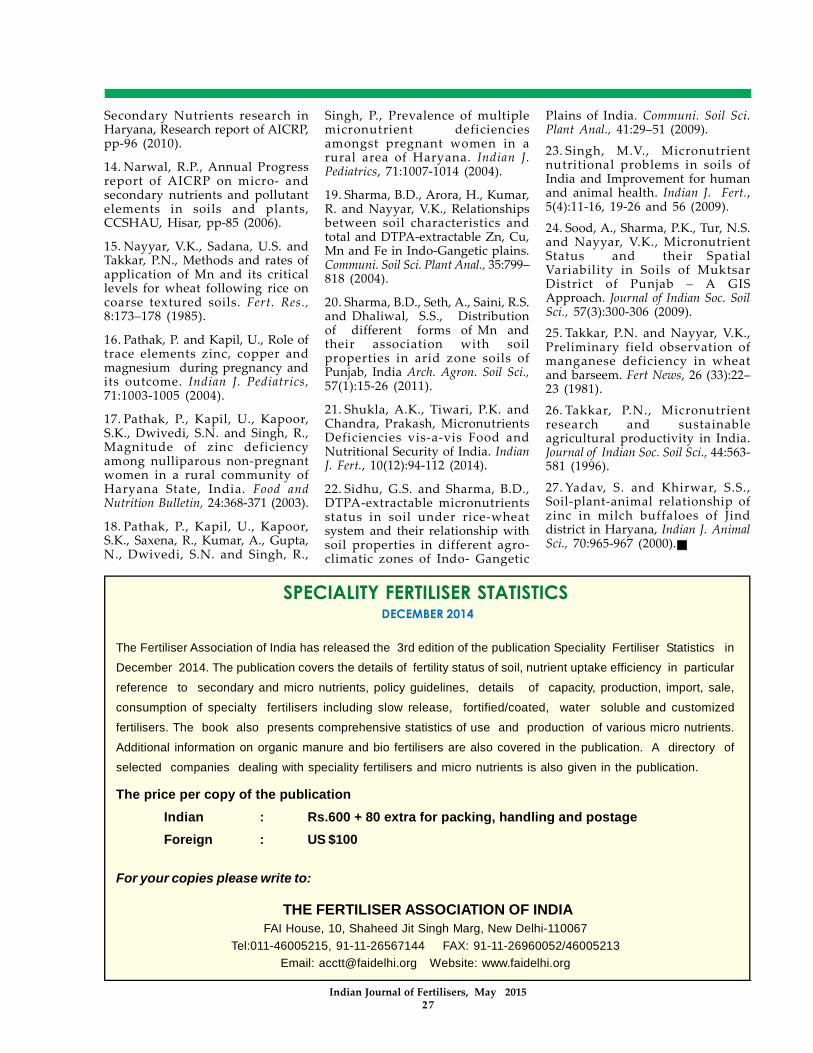
Table 6 – Average percentage of mineral nutrient deficiency in blood serum,hair and milk in cattle in Haryana
Deficiency percentage based on Zn Cu MnSerum mineral status - 40.0 -Hair mineral status base 50.3 - 47.8Milk mineral status base 42.9 29.0 -
vegetables, fruits, nuts and oil-seeds, animal foods) wasinfrequent. In another similarstudy, a high prevalence of Zndeficiency was found among thenulliparous non-pregnant womenin a rural community of Haryanastate (17).
A survey in the state revealedthat when feed and fodderproduced on low Zn and/ Fedeficient soils were fed to cattle,the animals showed higherpercentage of deficiency in theirblood serum, hair and milk asgiven in Table 6. The deficiency ofmicronutrients was foundwidespread, as deficiency ofminerals in common rangedbetween 20-60% for Zn, and 33-64% of Cu in blood serum and milksamples while hair showed Mndeficiency too.
Similar study aimed to assess theeffect of micronutrient status insoil-plant-animal continuumrevealed that soil of Dahimavillage of Hisar, Haryana haddeficiency of 74.45 for Fe, 68.9%for P and 4.8% for Zn, and thefodders grown on these soils do notmeet the normal mineralrequirement of animal body.Analysis of animal blood plasmaserum revealed maximumdeficiency of 37.5% of Cu followedby 12.5% of P.
CONCLUSION
The current status of Zn, Fe, Mn,Cu and B deficiency in soils of thestate has been assessed as 15.3,21.6, 6.2 5.2 and 3.3 %, respectively.Despite this deficiency, aconsiderable portion of soils whichare categorized just above thedeficiency level need specialattention because impropermanagement of these soils mayagain render them in deficient
category. As in case of Zn, thiscategory might have been result ofincreased use in Zn by the farmersin the state. As of now, thecritical micronutrients in Haryanasoils is Fe, followed by Zn, Mn, Cuand B. It has been proved thatapplication of micronutrientfertilisers was useful inmitigating the deficiency in plantsand also helped in exploiting thepotential of crops. The responseto micronutrient had been noticedin deficient soils which varied withcrop, soil and genotype. In thestate, multi-micronutrientdeficiencies are rare, application ofmulti-micronutrient mixtures maybe avoided as deficiency andtoxicity range of micronutrientsis very narrow. Further, there isneed to develop micronutrientapplication strategies forenhancing the micronutrientloading, particularly Zn and Fe, inedible plant parts under varioussoil types as per their availablenutrients status in soil.Micronutrients enriched grain hasgreat potential in improving healthof malnourished children andpregnant women of the state,especially in rural areas. Theanimals, when fed withmicronutrients dense fodder andfeed has shown increasedconcentrations of these vitalmicronutrients in milk, serum andhair.
REFRENCES
1. Behera, S.K. and Shukla, A.K.,Depth-wise distribution of zinc,copper, manganese and iron inacid soils of India and theirrelationship with some soilproperties. Journal of Indian Soc. SoilSci., 61(3):244-252 (2013).
2. Berger, K.C. and Truog, E., Borondetermination in soils and plantsusing the quinalizarin reaction.Industrial Engg. Chem., 11:540-545
Indian Journal of Fertilisers, May 201527
Secondary Nutrients research inHaryana, Research report of AICRP,pp-96 (2010).
14. Narwal, R.P., Annual Progressreport of AICRP on micro- andsecondary nutrients and pollutantelements in soils and plants,CCSHAU, Hisar, pp-85 (2006).
15. Nayyar, V.K., Sadana, U.S. andTakkar, P.N., Methods and rates ofapplication of Mn and its criticallevels for wheat following rice oncoarse textured soils. Fert. Res.,8:173–178 (1985).
16. Pathak, P. and Kapil, U., Role oftrace elements zinc, copper andmagnesium during pregnancy andits outcome. Indian J. Pediatrics,71:1003-1005 (2004).
17. Pathak, P., Kapil, U., Kapoor,S.K., Dwivedi, S.N. and Singh, R.,Magnitude of zinc deficiencyamong nulliparous non-pregnantwomen in a rural community ofHaryana State, India. Food andNutrition Bulletin, 24:368-371 (2003).
18. Pathak, P., Kapil, U., Kapoor,S.K., Saxena, R., Kumar, A., Gupta,N., Dwivedi, S.N. and Singh, R.,
Singh, P., Prevalence of multiplemicronutrient deficienciesamongst pregnant women in arural area of Haryana. Indian J.Pediatrics, 71:1007-1014 (2004).
19. Sharma, B.D., Arora, H., Kumar,R. and Nayyar, V.K., Relationshipsbetween soil characteristics andtotal and DTPA-extractable Zn, Cu,Mn and Fe in Indo-Gangetic plains.Communi. Soil Sci. Plant Anal., 35:799–818 (2004).
20. Sharma, B.D., Seth, A., Saini, R.S.and Dhaliwal, S.S., Distributionof different forms of Mn andtheir association with soilproperties in arid zone soils ofPunjab, India Arch. Agron. Soil Sci.,57(1):15-26 (2011).
21. Shukla, A.K., Tiwari, P.K. andChandra, Prakash, MicronutrientsDeficiencies vis-a-vis Food andNutritional Security of India. IndianJ. Fert., 10(12):94-112 (2014).
22. Sidhu, G.S. and Sharma, B.D.,DTPA-extractable micronutrientsstatus in soil under rice-wheatsystem and their relationship withsoil properties in different agro-climatic zones of Indo- Gangetic
Plains of India. Communi. Soil Sci.Plant Anal., 41:29–51 (2009).
23. Singh, M.V., Micronutrientnutritional problems in soils ofIndia and Improvement for humanand animal health. Indian J. Fert.,5(4):11-16, 19-26 and 56 (2009).
24. Sood, A., Sharma, P.K., Tur, N.S.and Nayyar, V.K., MicronutrientStatus and their SpatialVariability in Soils of MuktsarDistrict of Punjab – A GISApproach. Journal of Indian Soc. SoilSci., 57(3):300-306 (2009).
25. Takkar, P.N. and Nayyar, V.K.,Preliminary field observation ofmanganese deficiency in wheatand barseem. Fert News, 26 (33):22–23 (1981).
26. Takkar, P.N., Micronutrientresearch and sustainableagricultural productivity in India.Journal of Indian Soc. Soil Sci., 44:563-581 (1996).
27. Yadav, S. and Khirwar, S.S.,Soil-plant-animal relationship ofzinc in milch buffaloes of Jinddistrict in Haryana, Indian J. AnimalSci., 70:965-967 (2000).
SPECIALITY FERTILISER STATISTICSDECEMBER 2014
The Fertiliser Association of India has released the 3rd edition of the publication Speciality Fertiliser Statistics in
December 2014. The publication covers the details of fertility status of soil, nutrient uptake efficiency in particular
reference to secondary and micro nutrients, policy guidelines, details of capacity, production, import, sale,
consumption of specialty fertilisers including slow release, fortified/coated, water soluble and customized
fertilisers. The book also presents comprehensive statistics of use and production of various micro nutrients.
Additional information on organic manure and bio fertilisers are also covered in the publication. A directory of
selected companies dealing with speciality fertilisers and micro nutrients is also given in the publication.
The price per copy of the publicationIndian : Rs.600 + 80 extra for packing, handling and postageForeign : US $100
For your copies please write to:
THE FERTILISER ASSOCIATION OF INDIAFAI House, 10, Shaheed Jit Singh Marg, New Delhi-110067
Tel:011-46005215, 91-11-26567144 FAX: 91-11-26960052/46005213Email: [email protected] Website: www.faidelhi.org