microbial processes affecting alanine and glutamic acid in anoxic marine sediments
TRANSCRIPT
FEMS Microbiology Ecology 85 (1991) 211-232 © 1991 Federation of European Microbiological Societies 0168-6496/91/$03.50 Published by Elsevier ADONIS 016864969100075B
211
FEMSEC 00330
Microbial processes affecting alanine and glutamic acid in anoxic marine sediments
D a v i d J. Burdige
Department of Oceanography, Old Dominion University, Norfolk, VA, U.S.A.
Received 23 July 1990 Revision received 18 January 1991
Accepted 22 January 1991
Key words: Amino acid; Sulfate reduction; Fermentation; Carbon and nitrogen cycling
1. S U M M A R Y
The utilization of glutamic acid and alanine in anoxic marine sediments was studied using sedi- ments collected from a tidal flat on the Atlantic Ocean side of Virginia's Eastern Shore (Bordens- take Bay) and a site in the mid-Chesapeake Bay. At both sites volatile fatty acids (VFAs) were produced as intermediates in the catabolism (or oxidation) of both amino acids. In contrast, meth- ylated amines were not produced as metabolic intermediates from either amino acid. The ad- dition of 20 mM molybdate to sediment slurries (to inhibit bacterial sulfate reduction) led to the continuous production of VFAs from both amino acids, indicating that the majority of this VFA production from these amino acids occurred by fermentative processes. Non-catabolic uptake of these amino acids (presumably into bacterial bio- mass) also appeared to be an important process in removing alanine and glutamic acid from these
Correspondence to." D.J. Burdige, Department of Oceanogra- phy, Old Dominion University, Norfolk, VA 23529-0276, U.S.A.
sediment slurries. A kinetic model used to analyze these data indicated that - 8 5 % of the alanine catabolism occurred by fermentative processes, with remineralization by sulfate reducing bacteria accounting for the difference. In contrast, all of the glutamic acid catabolism appeared to occur by fermentation. Calculations using data on VFA and ~?CO 2 production in molybdate inhibited sediments also suggested that acetate and formate were the predominant VFAs produced by the fer- mentation of alanine, and perhaps glutamic acid as well. The oxidation of dissolved, free amino acids appeared to account for a significant frac- tion of the ammonium production in these anoxic marine sediments, although amino acids repre- sented less than - 2% of the carbon sources/elec- tron donors used by sulfate reduction. These ob- servations suggest that the general pathway of amino acid utilization in anoxic sediments in- volves their oxidation by fermentative bacteria to produce compounds such as VFA or H 2 which are then themselves used as substrates by either sulfate reducing or methanogenic bacteria. As such, dis- solved free amino acids appear to play an im- portant role as intermediates in carbon and nitrogen cycling in these environments.

212
2. I N T R O D U C T I O N
In anoxic sediments, the decomposition of organic matter to inorganic nutrients, CO 2 and CH 4 occurs through microbial metabolic reactions that produce increasingly less complex, dissolved, organic compounds from the sedimentary organic matter. The end products of one set of reactions are generally utilized as substrates by another group of organisms, leading eventually to the com- plete remineralization of the sedimentary organic matter [1]. These processes appear to 'feed' into a limited number of substrates (e.g., acetate and H2) which are then consumed by the appropriate terminal organisms (either sulfate reducers or methanogens). Abiotic processes such as adsorp- tion [2-4] or geopolymerization [5-7] may also remove dissolved organic matter from solution in pore waters, although the importance of these latter processes has been re-examined in several recent papers [8]. Interest in better describing the processes affecting dissolved organic compounds in anoxic marine sediments stems from a desire to further elucidate their role in elemental (i.e., carbon and nitrogen) cycling in these environ- ments. Such information is also important in fur- ther understanding the factors controlling pre- servation versus remineralization of sedimentary organic matter (e.g. see ref. 9).
Amino acids are a class of compounds whose biogeochemical cycling has been shown to play an important role in the diagenesis of organic carbon and nitrogen in anoxic sediments [9 12]. Dis- solved free amino acids (DFAAs) in the pore waters are likely important intermediates in these processes [11,12]. The production of DFAAs is generally thought to occur through the hydrolysis of proteinaceous materials in the sediments, pre- sumably by fermentative proteolytic bacteria [13,14]. Dissolved free amino acids can be re- moved from solution by abiotic processes such as reversible or irreversible adsorption, or by con- densation reactions with other types of organic compounds [2 4,6,15]. Biotic processes in anoxic sediments that may utilize DFAAs include re-in- corporation into sedimentary bacterial biomass, as well as metabolism by either sulfate reducing, fermentative and possibly methanogenic bacteria
[11,12A6 19]. The metabolism of these com- pounds by fermentative and sulfate reducing bacteria has previously been shown in pure culture studies [20-24], although to date the direct metabolism of amino acids by methanogenic bacteria has not been demonstrated.
Utilization of amino acids by sulfate reducing bacteria can either involve their complete oxida- tion to CO 2, or their partial oxidation to organic acids such as acetate, propionate or pyruvate [22,23]. Metabolism of DFAAs by fermentative organisms also generally produces these short chain organic acids, as well as Hz [20,21]. Other possible end products (or intermediates) of amino acid fermentation are methylated amines, which could be formed if decarboxylation of the amino acid precedes deamination. However, in a study by Christensen and Blackburn [17], production of these compounds was not observed when 14C- labelled alanine was added to anoxic marine sedi- ments.
The results of these previous studies have indi- cated the possible roles that sulfate reduction and fermentation may play in amino acid cycling in anoxic marine sediments. However these previous studies have not directly examined the roles of these processes in sedimentary amino acid cycling. In this paper the microbial processes affecting alanine and glutamic acid in anoxic marine sedi- ments have been examined in this context. The results of this study will also allow for a further characterization of the role of dissolved free amino acids in biogeochemical processes such as sulfate reduction and ammonium production in organic rich marine sediments.
3. MATERIALS AND METHODS
3.1. Study sites and collection of sediments The experiments described here were per-
formed with sediments collected from two anoxic marine sediments. The first is a tidal flat on the Atlantic Ocean side of Virginia's Eastern Shore (Bordenstake Bay), and the second a site in the mid-Chesapeake Bay.
Bordenstake Bay is semi-enclosed backbarrier

island lagoon located on Virginia's Eastern Shore (coordinates 37030 ' N, 75o44 ' W). The bay en- compasses approximately 1.12 km 2, is almost en- tirely surrounded by salt marshes, and has water depths ranging from < I m at low tide to > 2 m at high tide. Salinities in the Bay range from 29 to 34%0. The site in mid-Chesapeake Bay studied here is located in the mesohaline region of the Bay at 38056 ' N, 76023 ' W. The water depth is approx. 31 m, and the bot tom waters have salini- ties ranging from 16 to 20%0. The geochemical characteristics of the sediments at these sites are discussed below in SECTION 4.1.
Sediments from Bordenstake Bay were col- lected by directly inserting 2-inch i.d. plexiglass core tubes into the sediments. Surface sediments from this mid-Chesapeake Bay site were collected using an acrylic box corer designed for soft sedi- ments (Fabrau, Ramona, CA). Sub-cores were col- lected from this box core also using 2-inch i.d. plexiglass core tubes. Cores to be used for pore water analyses were processed as described below (SECTION 3.4), while the surface sediments (upper 10 cm) to be used in the experiments described here were transferred to Mason jars that were filled to the top with sediment, These jars were then stored refrigerated in the dark until use.
3.2. Collection of sediments and preparation of sedi- ment slurries
Sediment slurries were prepared by diluting sediments 1 : 1 (w/w) with either filtered (0.22/xm membrane filter) Bordenstake Bay (BB) seawater or mid-Chesapeake Bay (CB) bot tom water (as appropriate). The pH of BB seawater ranged from 7.8 to 8.1 while that of CB bot tom water was 7.3-7.9. In the 10/87 experiment the pH of the slurry solutions was also measured at the start and the end of the experiments. For the CB experi- ments on this date these pH values (7.7-7.9) were essentially the same as that of CB bot tom water. In the BB experiments, the slurries had slightly lower pH values (7.6-7.5) relative to BB seawater.
Sediment slurries were prepared inside of a Coy anaerobic chamber (Coy Laboratory Products, Ann Arbor, MI) containing N2 and 0.5-1% H 2. A Pd catalyst system inside the chamber removed traces of oxygen which might leak or diffuse into
213
the chamber. Oxygen and hydrogen concentra- tions inside of the chamber were monitored with a Coy Laboratory Products Model 10 Gas Analyzer.
In the anaerobic chamber slurries were first well mixed and then dispensed and sealed in screw-cap bottles. The bottles were next placed inside of GasPak anaerobic jars (BBL), which were themselves sealed, removed from the anaerobic chamber and placed on stirring plates inside of a constant temperature incubator ( T = 25 +_ 2°C). Oxygen concentrations in the GasPak jars were monitored with methylene blue indicator strips (BBL). In one experiment (the 2 /89 experi- ment) the slurries were dispensed into 125 ml serum bottles filled almost to the top and sealed inside the anaerobic chamber with rubber septa and aluminum crimp seals. These bottles were then placed inside the 25°C incubator and manu- ally shaken once per day. A 25°C incubation temperature was chosen primarily for consistency among experiments, although it also represents an upper limit of the temperatures found in the bot- tom waters at this mid-Chesapeake Bay site and an intermediate temperature for Bordenstake Bay waters (temperatures in Bordenstake Bay range from 3 to - 33°C).
Over the 5 -8 days of a given experiment the slurries were sampled once a day for dissolved sulfate and ammonium (to determine the rates of sulfate reduction and ammonium production) and dissolved free amino acids (to establish the back- ground concentrations of these compounds). Sedi- ment slurries (in both screw-cap bottles and serum bottles) were returned to the anaerobic chamber for sampling, to maintain anoxic conditions in the experiments (samples from serum bottles were taken by removing the crimp seal and rubber septa inside the anaerobic chamber to open the bottle). Slurry aliquots were placed in screw-cap centrifuge tubes, centrifuged for 10 min and the resulting supernatant then filtered through a 0.45 /xm membrane filter. A portion of this sample was acidified to pH < 2 and stored refrigerated for later analysis of dissolved sulfate (turbidimetri- cally as BaSO 4 [25]) and ammonium (colorimetri- cally using a modification of the procedure de- scribed by Solorzano [26]). A second, unacidified portion was stored frozen until analyzed for dis-

214
solved free amino acids using an HPLC technique [11,27].
After a minimum 3-day 'pre-incubation ' period (from the time the slurry was prepared), a portion of each slurry was transferred to a smaller vessel (either a 100 ml screw-cap bottle or a 50 ml screw- cap centrifuge tube). Radiolabelled amino acids (either uniformly labelled [14C]glutamic acid or -alanine) and (if appropriate) microbial inhibitors, antibiotics or fixatives were then added to the slurry. The radiolabelled amino acids were gener- ally added 10 min after the addition of these inhibitors, antibiotics or fixatives. However in the 10/87 experiment this was reversed, and molyb- date and mercuric chloride were added 10 rain after the addition of the radiolabelled amino acids. Radiolabelled amino acids from sterile stock solu- tions (ICN Radiochemicals or New England Nuclear) were diluted with the appropriate filtered seawater and added to an initial activity of ap- prox. 2 × 10⁴ dpm per ml of sediment slurry. Concentrations (in /xM) of these added radio- labelled amino acids are listed in Table 2. Inhibi- tots, antibiotics and fixatives were added from concentrated solutions and had the following final concentrations in the sediment slurries: sodium molybdate (Na2MoO4) , 20 mM; mercuric chlo- ride (HgC12), 10 raM; glutaraldehyde, 1%; penicil- lin G, streptomycin, tetracycline HCI, or chlor- amphenicol, all 50/~g/ml .
Over the 4 -9 h of these experiments, 5-ml slurry aliquots were removed as a function of time and immediately frozen for later analysis of the 14C activity in the total dissolved inorganic carbon (2;CO2), base volatile (i.e., methylated amines), volatile fatty acid (VFAs) and unreacted amino acid fractions.
3.3. Label extraction procedure In these procedures, one slurry aliquot was
subjected to a sequential process to remove labelled 22CO 2, total VFAs, and amino acids from the sample. A separate slurry aliquot was used for the determination of labelled methylated amines. All of the fractions collected by these procedures were counted on a Model 460C Packard liquid scintillation counter, using Aquasol 2 as the scin- tillation fluor. Quench corrections were performed
by external standardization. Control experiments using acetate, H C O 3 , alanine and glutamic acid (all uniformly 14C-labelled) added to autoclaved sediment slurries indicated that these procedures have efficiencies of > 90% for the recovery of ~4C in the 21CO2, VFA and amino acid pools. Al- though the efficiency of the procedure used here for recovering radiolabelled methylated amines was not determined, similar procedures have been reported to have efficiencies of > 70% [28,29].
To r e m o v e ,~214C02, 5 ml of 10% H3PO 4 was added to a partially thawed 5-ml slurry aliquot, which was then stripped with N 2 in a closed system for 30 rain. The 14C02(g) produced by acidifying slurry samples was trapped in three scintillation vials in series, each containing 10 ml of 0.5 M KOH. Upstream of the KOH traps a 0.5 M zinc acetate trap (at pH 4) was installed, to sequester the large amount of sulfide produced by acidifying these anoxic sediments. At this low pH, 14CO2(g) passes through the zinc acetate solution without loss by precipitation or conversion to soluble bicarbonate or carbonate.
The acidified slurry mixture was next subjected to vacuum distillation to separate labelled VFAs from the sediments. The procedure used here is essentially that described by Christensen and Blackburn [17]. Two distillations were performed (to near dryness), with 0.5 ml of an unlabelled VFA mixture added prior to each distillation. This mixture was added as a carrier to increase the recovery of labelled fatty acids, and contained 0.1 M each formic acid, acetic acid, propionic acid, butyric acid and isobutyric acid at pH 3.
After this vacuum distillation procedure, unre- acted labelled amino acids were recovered from the sediments by sequential extractions with 10 ml each of 5% H3PO 4, 0.2 /~m filtered seawater and 0.5 M KOH. After addition of each solution to the sediments, they were vortexed briefly and allowed to sit for 5 rain. The samples were then centri- fuged, and the supernatants decanted into scintil- lation vials for liquid scintillation counting. It was observed here that almost all of the labelled amino acids were recovered in the first acid extraction (78 85% of the total amount recovered by all three extractions), with the seawater extraction recovering slightly more than the base extraction

(11-15% and 3-8%, respectively). Labelled methylated amines were removed and
quantified by adding 5 ml of 0.5 N K O H to a separate, partially frozen 5-ml slurry aliquot, heat- ing it to 65°C, and stripping the mixture with N 2 in a closed system for 1 h. The methylated amines were trapped in three scintillation vials in series, each containing 10 ml of 5% phosphoric acid. Liquid scintillation counting of these samples was performed as described above.
3.4. Pore water collection and analysis Cores from Bordenstake Bay sediments were
extruded and sectioned in a N2-filled glove bag, and the pore waters then obtained by centrifuga- tion. Pore waters from mid-Chesapeake Bay sedi- ments were obtained by pressure filtration using sediment squeezers [30]. Pore waters were analyzed for dissolved sulfate, ammonium and free amino acids as discussed above.
4. RESULTS
4.1. Geochemical characteristics of Bordenstake Bay and mid-Chesapeake Bay sediments
The sediments of Bordenstake Bay are silty sands containing - 1 . 1 % organic carbon in the surface sediments. The sedimentation rate in Bordenstake Bay sediments (based on 21°pb dat- ing over 60 cm) is 0.76_+ 0.21 c m / y r [31]. In contrast, the sediments at this mid-Chesapeake Bay site are fine grained silts and clays and have an organic carbon content in the surface sedi- ments of 3-4% (G. Cutter, unpublished data).
The sediments of Bordenstake Bay and this mid-Chesapeake Bay site are similar to other anoxic marine sediments, based on the observed sulfate depletions in the pore waters, and the concomitant production of ammonium, phosphate and S C O 2 (see Fig. 1; phosphate and ,~CO 2 data not shown here). However the higher concentra- tion of organic matter in mid-Chesapeake Bay sediments leads to greater amounts of mineraliza- tion, and the occurrence of more ' reducing' condi- tions, in these sediments. In Bordenstake Bay sedi- ments the maximum depletion of sulfate in the pore waters is only 8-10 mM and occurs over a
rm
A. B o r d e n s t a k e B a y
Sulfate (mM)
20 214 28 .
",
4o \
6C * i , ~ , i , i ,
02 0.4 06 08
Ammonium (pM)
215
TDFAA (ltM)
4 8 12
e~ to 300 p.M . / I
d d
~ ~0 ¸
2 0
B. m i d - C h e s a p e a k e B a y
Sulfate (raM)
4 8 12 16
' ~ ° ~
TDFAA(pM)
2 4 6 °~ i . i J (
i I
T
!
Ammonium (laM}
Fig. 1. Concentrations of dissolved sulfate (e), a m m o n i u m (©) and total dissolved free amino acids (e; TDFAA), all versus depth, in cores collected from: (A) Bordenstake Bay (9 /91 /86) ; and (B) a site in the mid-Chesapeake Bay (2 /10 /88) . With the exception of the T D F A A data from Bordenstake Bay, all of the data in this figure represent average values from parallel cores. The sulfate and ammon ium data from Bordenstake Bay
are from Herrenkohl [31].
depth range of 60 cm, while in these mid- Chesapeake Bay sediments total reduction of pore water sulfate occurs in the upper 10-20 cm (see Fig. 1). These differences also express themselves in similar trends in the inorganic nutrient profiles (i.e., higher concentrations of these constituents are found in the pore waters of the mid- Chesapeake Bay sediments; see Fig. 1). Finally, pore water sulfide concentrations in these mid- Chesapeake Bay sediments can be as high as 300 /xM just below the sediment-water interface, with concentrations increasing up to 3 mM in the up- per 5 cm of sediments (M.L.C. San Diego-Mc- Glone, unpublished data). In contrast, dissolved sulfide in the pore waters of Bordenstake Bay
216
sediments rarely exceeds 100/~M, and these values are only observed at depths below 40 cm [31].
Profiles of dissolved free amino acids (DFAA) in cores collected from both sites are similar to those observed in other anoxic marine sediments [4,11], both in terms of concentrations of total DFAAs and individual amino acids (see Fig. 1). As in these other sediments, glutamic acid, /3- aminoglutaric acid, alanine and glycine are the dominant free amino acids in the pore waters of Bordenstake Bay and mid-Chesapeake Bay sedi- ments. Total (acid) hydrolyzable amino acids in Bordenstake Bay surface sediments are somewhat lower in concentration (27.1 + 5.3 #m o le /g dry wt.) than in mid-Chesapeake Bay sediments (124.2 + 15.4 /zmol/g dry wt.). However, the distribu- tion of individual amino acids in both sediments is similar to that observed in other anoxic marine sediments, with aspartic acid, glutamic acid, glycine and alanine predominating [4,10].
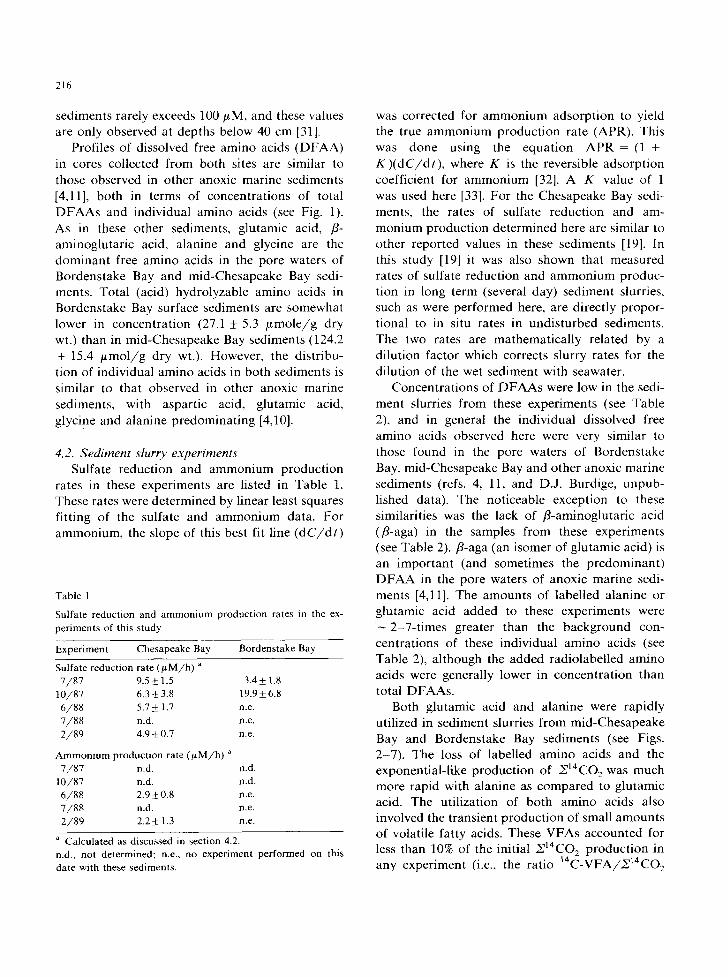
4. 2. Sediment slurry experiments Sulfate reduction and ammonium production
rates in these experiments are listed in Table 1. These rates were determined by linear least squares fitting of the sulfate and ammonium data. For ammonium, the slope of this best fit line (dC/dt)
Table 1
Sulfate reduction and ammonium production rates in the ex- periments of this study
Experiment Chesapeake Bay Bordenstake Bay
Sulfate reduction rate (/xM/h) a 7/87 9.5 ± 1.5 3.4 -t- 1.8
10/87 6.3 ± 3.8 19.9 + 6.8 6/88 5.7 ± 1.7 n.e. 7/88 n.d. n.e. 2/89 4.9±0.7 n.e.
Ammonium production rate (/LM/h) a 7/87 n.d. n.d.
10/87 n.d. n.d. 6/88 2.9±0.8 n.e. 7/88 n.d. n.e. 2/89 2.2 ± 1.3 n.e.
a Calculated as discussed in section 4.2. n.d., not determined; n.e., no experiment performed on this date with these sediments.
was corrected for ammonium adsorption to yield the true ammonium production rate (APR). This was done using the equation APR = (1 + K)(dC/dt), where K is the reversible adsorption coefficient for ammonium [32]. A K value of 1 was used here [33]. For the Chesapeake Bay sedi- ments, the rates of sulfate reduction and am- monium production determined here are similar to other reported values in these sediments [19]. In this study [19] it was also shown that measured rates of sulfate reduction and ammonium produc- tion in long term (several day) sediment slurries, such as were performed here, are directly propor- tional to in situ rates in undisturbed sediments. The two rates are mathematically related by a dilution factor which corrects slurry rates for the dilution of the wet sediment with seawater.
Concentrations of DFAAs were low in the sedi- ment slurries from these experiments (see Table 2), and in general the individual dissolved free amino acids observed here were very similar to those found in the pore waters of Bordenstake Bay, mid-Chesapeake Bay and other anoxic marine sediments (refs. 4, 11, and D.J. Burdige, unpub- lished data). The noticeable exception to these similarities was the lack of /3-aminoglutaric acid (/3-aga) in the samples from these experiments (see Table 2). /3-aga (an isomer of glutamic acid) is an important (and sometimes the predominant) DFAA in the pore waters of anoxic marine sedi- ments [4,11]. The amounts of labelled alanine or glutamic acid added to these experiments were
2-7-times greater than the background con- centrations of these individual amino acids (see Table 2), although the added radiolabelled amino acids were generally lower in concentration than total DFAAs.
Both glutamic acid and utilized in sediment slurries Bay and Bordenstake Bay 2-7). The loss of labelled
alanine were rapidly from mid-Chesapeake sediments (see Figs.
amino acids and the exponential-like production of z~14CO2 was much more rapid with alanine as compared to glutamic acid. The utilization of both amino acids also involved the transient production of small amounts of volatile fatty acids. These VFAs accounted for less than 10% of the initial .a~14C02 production in any experiment (i.e., the ratio t4C-VFA/~laC02

was generally less than 0.1 during the early por- tions of these experiments).
The addit ion of molybdate (a specific inhibitor of bacterial sulfate reduct ion [34,35]) caused dif- ferent pathways of amino acid utilization in these sediments (see Figs. 4-7) . In the presence of molybdate, cont inuous product ion of significant amounts of 14C-labelled VFAs occurred from both amino acids. Molybdate decreased !14CO2 pro- duct ion from alanine and also slightly decreased its removal (see e.g. Fig. 4). In contrast, both !14CO2 product ion from glutamic acid and its removal appeared to be unaffected by the addit ion of molybda te (see e.g. Fig. 5).
217
As discussed in the INTRODUCTION, methylated amines represent another potential class of inter- mediates in amino acid metabol ism in anoxic marine sediments. However in contrast to VFAs, the product ion of methylated amines (MA) was not observed from either glutamic acid or alanine either in the presence or absence of molybdate (see e.g. Figs. 2 and 3). Al though not shown in Figs. 4 and 5, the product ion of methylated amines was also not observed in the 2 / 8 9 experiments. Samples f rom the 10 /87 experiments were not analyzed for methylated amines.
The total activity recovered ( T C R = I C O 2 + V F A + M A + G l u / A l a activities) also decreased
£L m,
20
"i0
A. Bordenstake Bay - 7/87
2 0
TCR (x l000)
NNo Ala (x1000)
~ ° ~ o _ _ ~ o ~ o
t I I t ~ I 2 4 8 1
~_.CO2 (x1000)
VFA (x'i 00)
o
MA (xl 0 • ° l I ~ o - -
0 4 8 12
B. Chesapeake Bay - 7/87
~s 0.- £3
20
10
~__,t~,~ R (x l000)
~ ° " N . o ~ o __~____ - Ala (x1000) ~ o - - o o
I I ~ I 0
4 8 12 0
YCO2 (x l000)
VFA (x l00) , MA (x100)
4 8 12
Time (hr)
Fig. 2. (A) The activities of: total counts recovered (TCR, A) and alanine (Ala, ©) (left figure); ICO 2 (ICO2, II), volatile fatty acids (VFAs, o) and methylated amines (MA, a) (right figure); all versus time, in Bordenstake Bay sediment slurries to which U-14C-labelled alanine was added at t = 0. Note the difference in the activity scaling factors for the VFA and MA curves. (B) Same as A, except with mid-Chesapeake Bay sediment slurries. Note that the MA symbols are obscured by the VFA symbols along the
x-axis.

218
with t ime in all of these exper iments (see Figs. 2 - 5 , 8). This accoun ted for approx. 20-40% of the label led amino acids ini t ia l ly a d d e d to the experi- ments . This suggested that amino acids were also ei ther taken up by bac te r ia in anabo l i c processes (e.g., i nco rpora t ion into bac ter ia l b iomass) or were removed from solut ion by ' i r revers ib le ' ab io t ic processes ( ' i r revers ib le ' in the sense that they could not be recovered by the acid, seawater and base ex t rac t ion p rocedures used here). To d i f fe ren t ia te these two types of processes exper iments were pe r fo rmed in which 10 m M mercur ic ch lor ide was a d d e d to sed iment slurries to inhibi t mic rob ia l activity. As can be seen in Fig. 8, be tween 75 and 90% of this loss of T C R s in Bordens take Bay
sed iments was a p p a r e n t l y due to mic rob ia l processes (based on a c ompa r i son of the loss of ei ther T C R s or label led a m i n o acids in the pres- ence and absence of mercur ic chloride) . In con- trast, in s imi lar exper iments wi th mid -Chesapeake Bay sediments , the add i t i on of mercur ic ch lor ide ei ther had no effect or m a y have even sl ightly s t imula ted microb ia l act iv i ty (see Figs. 7 and 8). Possible exp lana t ions of this la t te r obse rva t ion will be discussed be low (SECTION 5.1).
To fur ther examine the processes respons ib le for these non-ox ida t ive losses of amino acids in Chesapeake Bay sediments , a series of add i t i ona l exper iments were unde r t aken in which a range of o ther microb ia l inhibi tors , an t ib io t ics and fixa-
-~ 8
D_ 4
A. Bordenstake Bay - 7/87
Glu (xl000) ~ o ~ °
0 2 4 6 8 1 0
2- j i
~CO~ I/
i I /
VFA (xl00) MA (xl00)
CO~o..~-.°---; ~ ~ _ _ ~ 2 4 6 8 10
12-
8
0_ 4 a
B. Chesapeake Bay - 7/87
~ TCR (xl000)
o~ Glu (xl0(C) ~ o
2 4 6 8 1 0
2 ECO2 (x1000)
0 2 4 6 8 t0
T ime (hr)
Fig. 3. (A) The activities of: total counts recovered (TCR, A) and glutamic acid ((3lu, o ) (left figure); .~CO 2 (~'CO2, I), volatile fatty acids (VFAs, ©) and methylated amines (MA, A) (right figure); all versus time, in Bordenstake Bay sediment slurries to which uJac-labelled glutamic acid was added at t = 0. Note the differences in the activity scaling factors for the VFA and MA curves, and that the MA symbols are partially obscured by the VFA symbols along the x-axis. (B) Same as A, except with mid-Chesapeake Bay
sediment slurries.

tives were added to sediment slurries (see Table 3). These experiments yielded inconclusive results since with the exception of glutaraldehyde, all of these compounds either had no effect or only partially inhibited 14CO2 production or amino acid or TCR loss. While the addition of glutaraldehyde led to an almost complete inhibition of :4CO2 production from either amino acid, it also led to - 20-45% loss of labelled amino acids that could not be recovered in either the amino acid, ~ C O 2 or volatile fatty acid fractions (hence the TCR ratios in Table 3 that are greater than 1). The kinetics of amino acid loss in the presence of glutaraldehyde was also distinctly different than that observed in all of the other experiments of this study. Here the loss of labelled free amino acids occurred within the first 5-10 min of the
219
experiment, with no additional changes in amino acid activity occurring over the remaining 6 h of the experiments (data not shown). This removal is therefore most likely due to a chemical reaction between glutaraldehyde and the labelled amino acids, and is not caused by the biotic a n d / o r abiotic processes discussed above (e.g., incorpora- tion into bacterial biomass, irreversible adsorp- tion). The product of this reaction is apparently not extracted by the procedures used in this study.
5. DISCUSSION
5.1. General trends in the data The results of these studies suggest that the
oxidation of alanine and glutamic acid in these
Chesapeake Bay - 2/89
ra a
12 ~ C O 2
/m--•
/ ?
A M ( x l 0 0 0 )
o * I i I 1 2
8 • A lan ine
' °
A C (x1000)
0 i i i i 0 1 2
V F A 6 T
o s o ~ ° A M ( x l 000 ) o
v
0 0 • ~ ' -
1 8
1 6
14
12
10
T C R
• o - -
1 2
Time (hr)
Fig. 4. The activities of: ~ C O 2 (,~CO2), volatile fatty acids (VFAs), alanine and total counts recovered (TCR); all versus time, in mid-Chesapeake Bay sediment slurries to which U-14C-labelled alanine was added at t = 0. AC (11) indicates control experiments (no additions other than labelled alanine), while AM (0 ) represent slurries to which 20 m M molybdate was added 10 min before the addition of the labelled amino acid. Note the difference in the activity scaling factor for the AC VFA curve. Although not indicated on this figure, no production of methylated amines was observed in this experiment in either the presence or absence of molybdate.
All of the data points in this figure represent averages from duplicate experiments.

220
sediments may be generally described by the fol- lowing two-step process,
14C-amino acid ~ 14C-VFA + 14CO2 + N H 3 + H 2
(1)
1 4 C - V F A ~ 1 4 C O 2 (2)
These equations are written in a generic sense since the specific VFAs, and the absolute amounts of ammonium, CO 2 and H 2 that are produced depend both on the actual amino acid being utilized and the conditions under which the fermentative organisms are growing (e.g., ref. 20).
Reaction 1 is apparently performed primarily by fermentative bacteria, based on the results of the molybdate inhibition experiments (see Figs. 4-7). The transient accumulation of VFAs in sedi- ments to which molybdate was not added is then related to the initial 'pulse ' of labelled amino acid
added to the slurry at the beginning of the experi- ment, and the subsequent approach to steady state (i.e., production = consumption) and isotopic equilibrium of the activity in the VFA pool. These kinetics are somewhat similar to those reported by Christensen and Blackburn [17], in their studies of alanine turnover in Danish coastal marine sedi- ments. In the absence of molybdate they also observed the initial production of small amount of VFAs from labelled alanine added to the sedi- ments, although the activity of the VFA pool remained constant or decreased slowly over the one to two hours of their experiments.
The loss of TCRs in these experiments sug- gested that the non-catabolic utilization of these amino acids is an important process in these sedi- ments (see Fig. 8). In Bordenstake Bay sediments, the results of the mercuric chloride experiments suggested that this loss is microbially mediated,
Chesapeake Bay - 2/89
6- ZC02 VFA
"E 0 o $
n 20 tm
10
GM (xl000) ~ o
o ~ " ~ GC (xl000)
i i i 2 4 6
Glutamic Acid
GM (xlD00)
2
GM (xl000)
~4~v ~ °
0 o 1 " " " 0 2 4 6
20
10
TCR
~ u o ~ , / o ~ . GM (xl000) o
GC (xl000)
I i i 4
2 4 6
T i m e (hr)
Fig. 5. The activities of: ~CO 2 (~CO2), volatile fatty acids (VFAs), glutamic acid and total counts recovered (TCR); all versus time, in mid-Chesapeake Bay sediment slurries to which U-14C-labelled glutamic acid was added at t = 0. GC (11) indicates control experiments (no additions other than labelled glutamic acid), while GM (0) represent slurries to which 20 mM molybdate was added 10 min before the addition of the labelled amino acid. Note the differences in the activity scaling factor for the GC VFCA curve. Although not indicated on this figure, no production of methylated amines was observed in this experiment in either the presence or
absence of molybdate. All of the data points in this figure represent averages from duplicate experiments.

221
with incorporation of the radiolabelled amino acids into bacterial biomass being the most likely explanation. Attempts to examine these processes responsible in mid-Chesapeake Bay sediments were inconclusive, as a wide range of microbial inhibi- tors and antibiotics at best only partially inhibited microbial activity (see Figs. 7 and 8 and Table 3). The possible stimulation of microbial activity by the addition of mercuric chloride (see Fig. 8) is similar to that observed by Capone et al. [36] in
anoxic, salt marsh sediments, and may have been related to the high dissolved sulfide levels in these mid-Chesapeake Bay sediments. Hg 2+ added to the slurries may have been rapidly (and quantita- tively) removed from these slurries as an insoluble sulfide, decreasing any sulfide inhibition of micro- bial activity in these sediments and thus possibly stimulating microbial activity.
In these mid-Chesapeake Bay sediments then, it is not possible to differentiate between abiotic
A. Bordenstake Bay, Alanine - 10/87
E
o .
13_ C)
12 ¸
0=
ZCO2
' , . /~ AC IxlOOOl~, • ~ ~ 2
° o Q
AM (x1000)
AH (x 1000)
I I I I O! 2 4 6 8
3 VFA
AM (xl000) ~ o
~ _ o / O / I AH (xl000)
• • ~1 I •
2 4 6
20 Alanine
10
0 8
AH (xl000)
~'~°-o.--..~o__~M (xl O00l " 1 . 1 ~ O
- ' - - ' - - ' - ' - - - ' - i AC (xl000) • I I I
2 4 6 8
B. Bordenstake Bay, Glutamic Acid - 10/87
E 2- $
13_ 1- t'~
3. ycc ,2 3 VFA
0 , 1 - - o
,
,x, o o ,
1
" ~ GH (xl000) ~.
I I I I I 01 2 4 6 8 10 0
20
10
~ R" . . . . , . . . . . . .~ " GC (xl00)
~ - ~ - ~ ' ~ " - - - r - - - - , , - - - T ~ " - - ~ " o 2 4 6 8 110
Glutamic Acid
GH (x1000)
ooo) ---..~,_------, GC (xl000)
I I I I ! 2 4 6 8 1 o
Time (hr) Fig. 6. The activities of: ,~CO 2 (~CO2), volatile fatty acids (VFA), and~alanine or glutamic acid; all versus time, in Bordenstake Bay sediment slurries to which U-14C-labelled alanine (A) or glutamic acid (B) was added at t = 0. AC or GC ( I ) indicates control experiments (no additions other than labelled alanine or ghitamic acid), AM or GM (©) represent slurries to which 20 mM molybdate was added 10 min after the addition of the labelled amino acids, and AH or GH (=) represent slurries to which 10 mM mercuric chloride was also added 10 min after the addition of the labelled amino acids, The time of the addition of these inhibitors is
indicated by an arrow in each figure.

222
processes and anabolic (biotic, yet non-oxidative) processes that take up alanine and glutamic acid (and therefore account for these observed losses of TCRs). For now it will be assumed that by anal- ogy to the results from Bordenstake Bay sediments that this loss of amino acids in mid-Chesapeake Bay sediments is also due to uptake of amino acids into bacterial biomass. It should be noted, however, that a more definitive resolution of this question is of some importance, since the processes
responsible for this non-metabolic utilization of small organic molecules such as dissolved amino acids appears to be important in the cycling of dissolved organic matter in marine sediments, and may also play an important role in overall sedi- mentary carbon and nitrogen cycling.
The 20-40% of the added labelled amino acids that was apparently incorporated into bacterial biomass in these experiments is similar to that observed by Christensen and Blackburn [l 7]. They
A. Chesapeake Bay, Alanine - 10/87
cl c~
1 2 -
8 -
O z
~CO2
'o
2 4
4 VFA 10-
3 ¸
2
1
0 0
~ o
5
. AC (x 100(3)
~ = ~ x 1000)
-'~ ~ * - o 2 4
Alanine 1o approx. 20 (at t=0)
i\,
i - - i
2 4
B. Chesapeake Bay, Glutamic Acid - 10/87
12-
(3.
Q_ I~] 4"
ZCO2
, r - - " - - GC (xl000)
/ j l ~ GM (xl000)
0 I ~ I I 110 0 . 0 2 4 6 8
VFA
oc ,x,,oo 2 4 6 8 10
20
10
Glutamic Acid
2 4 6 8
Time (hr) Fig. 7. The activities of: ~?CO 2 (XCO2), volatile fatty acids (VFA) and alanine or glutamic acid; all versus time in mid-Chesapeake Bay sediment slurries to which u-X4C-alanine (A) or glutamic acid (B) was added at t = 0. AC or GC (lI) indicates control experiments (no additions other than labelled amino acids), AM or GM ( 0 ) represent slurries to which 20 mM molybdate was added 10 rain after the addition of the labelled amino acids, and A H or G H (A) represent slurries to which 10 mM mercuric chloride was added 10 min after the addition of the labelled amino acids. The time of the addition of these inhibitors is indicated by an arrow in
each figure.

observed that approx. 20% of the alanine that was added to anoxic, Danish coastal marine sediments was not catabolized, and presumably was incorpo- rated into bacterial biomass. Higher proportions of apparent incorporation of radiolabelled amino acids into bacterial biomass were observed in oxic to sub-oxic, low organic carbon Alaskan sedi- ments ( > 40% [12]) and in anoxic salt marsh sedi- ments (50-95% [16]). As discussed in Christensen and Blackburn [17], such differences in the amounts of amino acid incorporation (relative to
223
oxidation to CO2) are likely dependent on the nitrogen status of the sediments.
5.2. A kinetic model for dissolved free amino acid utilization
To quantify the processes occurring in these experiments, the data have been examined using a kinetic model modified from those described by King and Klug [37] and Sugai and Henrichs [12]. This model is schematically illustrated in Fig. 9. In this model dissolved free amino acids can be:
2 d E
0 o II
~ -2 .g
c~ 9 -4
~-~ -6
A. Bordens take
Total Counts Recovered (TCR) from Alanine
I I I
2 4 6
Bay - 10/87
2 T Total Counts Recovered (TCR) from Glutamic Acid
/
-4 ~ 1 1
. o
- 8 I I I I I
2 4 6 8 10
,-: 2
~-o a 0
-# "~ -2 ~::z. ~
~ -4 E3 o
-8
B. Chesapeake Bay - 10/87
l Total Counts Recovered (TCR) from Alanine
n n ~ AC
-4, ~ AH
-6.
n I g I - 8
2 4
0 i
G H ~ n u ~ n n
I I I I 2 4 6 8
Total Counts Recovered (TCR) from Glutamic Acid
Time (hr) Time (hr)
10
Fig. 8. The activities of total counts recovered (TCR) in the 10/87 experiments. AC and GC (11) indicate control experiments (no additions other than labelled alanine or glutamic acid), while AH or GH (A) represent slurries to which 10 mM mercuric chloride was
added 10 min after the addition of the labelled amino acids. To more clearly illustrate the effects of mercuric chloride on microbial processes in the sediment slurries, all TCR values shown here are relative to those at t = 10 min (the time at which the mercuric
chloride was added). Note that the ~ C O 2, VFA and amino acid data from these experiments are shown in Figs. 6 and 7.

224
Table 2
Concentrations of glutamic acid, alanine and total dissolved free amino acids in the experiments of this study
TDFAA - Total dissolved free amino acids. Other amino acids whose mole percentages were greater than 5% of the TDFAAs were: aspartic acid, serine, and glycine; tyrosine and leucine (all except 10/87 CB); isoleucine (7/87 and 10/87 BB only); cysteic acid (2/89 CB only); glutamine (10/87 CB only); histidine (10/87 BB only); y-aminobutyric acid and 6- aminovaleric acid (2/89 CB only); and phenylalanine (7/87 BB only), n.d., not determined.
Experiment Glutamic Alanine TDFAA acid (ffM) (ffM) (ffM)
Bordenstake Bay 7/87 C " < 0.01 0.05 0.32
RA b 0.026 0.067 10/87 C 0.01 0.01 0.10
RA 0.043 0.067
Chesapeake Bay 7/87 C 0.01 0.02 0.33
RA 0.022 0.072 10/87 C 0.01 < 0.01 0.03
RA 0.042 0.070 6/88 C n.d. n.d. n.d.
RA 0.042 0.068 2/89 C 0.01 0.01 0.15
RA 0.057 0.030
a This is the average of the chemically measured (HPLC) concentrations from samples collected over the course of the experiment.
b This is the concentration of added radiolabelled amino acids, based on the specific activity of each amino acid and the initial amino acid activity added to the experiment.
oxidized (or catabolized) to products such as VFAs or CO 2 (by both fermentation and sulfate reduc- tion); reversibly adsorbed to sediment particles; 'permanent ly ' removed from solution by uptake into bacterial biomass (note that for this model the actual mechanism of this latter removal pro- cess is not important). Reversible adsorption has also been included here because it has been ob- served to play an important role in affecting the cycling of pore water amino acids [2-4,12,17]. However, in the equations presented below these two amino acid pools ( A A d i s and A A a d s ) will be combined into a single amino acid fraction (AA r), primarily because the extraction procedure used here does not separately quantify these two pools.
Table 3
Effect of several antibiotics and glutaraldehyde on 2,'CO 2 pro- duction, and amino acid and TCR loss from alanine and glutamic acid by mid-Chesapeake Bay sediments
GC02 ~'~ AA bx TC R c,~
Glutamic acid experiments Penicillin G 1.05 0.87 0.70 Tetracycline 1.09 0.84 0.61 Streptomycin 0.84 0.91 0.99 Antibiotic mix a 0.80 0.70 0.61 Glutaraldehyde 0.01 0.83 1.60
Alanine experiments Chloramphenicol 0.75 0.77 0.92 Glutaraldehyde 0.01 0.57 3.56
a Activity in the )-.~14CO2 fraction in the inhibitor flask at 6 h, relative to that in the control flask at the same time.
h L o s s of activity in the amino acid fraction in the inhibitor flask over 6 h, relative to that in the control flask over the same time period.
c Loss of TCRs in the inhibitor flask over 6 h, relative to that in the control flask over the same time period.
d Tetracycline, pencillin G and streptomycin, each at 50 ffg/ml (final conc.)
" Complete inhibition results in a ratio of 0 while lack of inhibition results in a ratio of 1. With the exception of the glutaraldehyde experiments, the time courses of v~4('Oa production and amino acid or TCR loss in these experiments were similar to those seen in the other experiments of this study.
Rather than modelling each of the catabolic processes (e.g., Eqns. 1 and 2) individually, the activity in the VFA and CO 2 pools has been summed into a single 'Product ' pool. The kinetics
Amino acids incorporated into bacterial biomass
k4 . . . . . . .
AAd is 4 " AAac~
. . . . . . . . . . . . . . . . . . . . .
• _ " k l
Products (~CO2 + VFAs)
Fig. 9. A schematic representation of the model used to de- scribe the behavior of amino acids in these sediments. A box has been placed around AAdis, AAad s and the arrows repre- senting reversible adsorption/desorption to indicate that the procedures used here do not differentiate between these two
pools of amino acids.
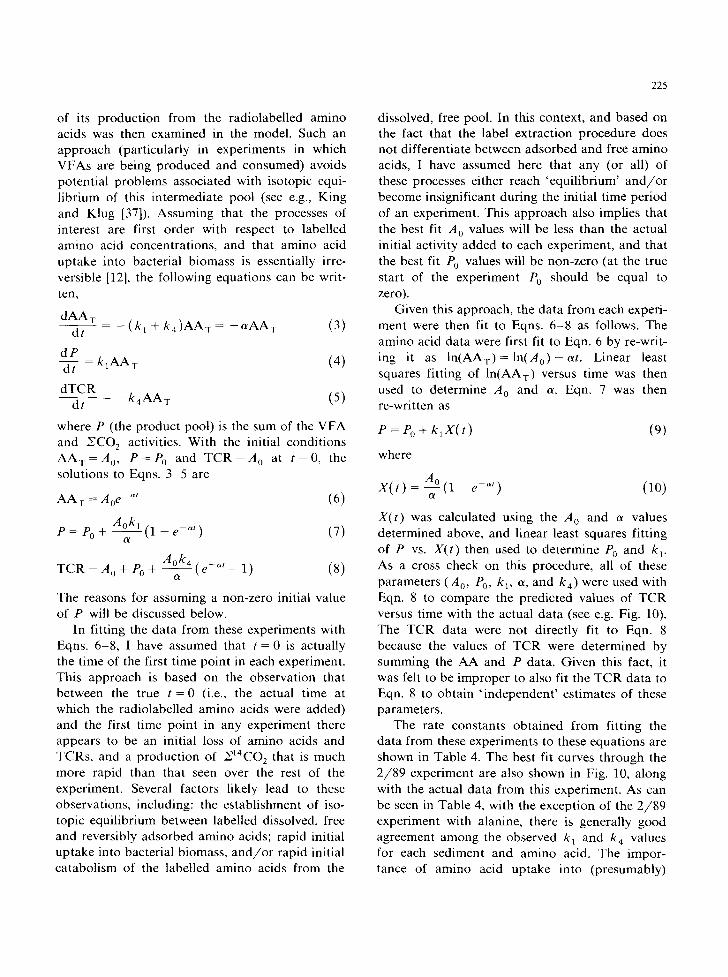
of its production from the radiolabelled amino acids was then examined in the model. Such an approach (particularly in experiments in which VFAs are being produced and consumed) avoids potential problems associated with isotopic equi- librium of this intermediate pool (see e.g., King and Klug [37]). Assuming that the processes of interest are first order with respect to labelled amino acid concentrations, and that amino acid uptake into bacterial biomass is essentially irre- versible [12], the following equations can be writ- ten,
dAA T - (k I + k4)AA T = - a A A w (3) dt
d P dt = k lAAT (4)
dTCR dt k 4 A A T (5)
where P (the product pool) is the sum of the VFA and ~JCO 2 activities. With the initial conditions A A T = A 0 , P = P o and T C R = A 0 at t = 0 , the solutions to Eqns. 3 5 are
A A T = Aoe ~' (6)
A°k~ 1 e ~t) P = Po + ~ ( - (7)
Aok4 TCR = A 0 + Po + ~ - ( e - ~ ' - 1) (8)
The reasons for assuming a non-zero initial value of P will be discussed below.
In fitting the data from these experiments with Eqns. 6 8, I have assumed that t = 0 is actually the time of the first time point in each experiment. This approach is based on the observation that between the true t = 0 (i.e., the actual time at which the radiolabelled amino acids were added) and the first time point in any experiment there appears to be an initial loss of amino acids and TCRs, and a production of ~14C02 that is much more rapid than that seen over the rest of the experiment. Several factors likely lead to these observations, including: the establishment of iso- topic equilibrium between labelled dissolved, free and reversibly adsorbed amino acids; rapid initial uptake into bacterial biomass, a n d / o r rapid initial catabolism of the labelled amino acids from the
225
dissolved, free pool. In this context, and based on the fact that the label extraction procedure does not differentiate between adsorbed and free amino acids, I have assumed here that any (or all) of these processes either reach 'equilibrium' a n d / o r become insignificant during the initial time period of an experiment. This approach also implies that the best fit A 0 values will be less than the actual initial activity added to each experiment, and that the best fit Po values will be non-zero (at the true start of the experiment P0 should be equal to zero).
Given this approach, the data from each experi- ment were then fit to Eqns. 6 -8 as follows. The amino acid data were first fit to Eqn. 6 by re-writ- ing it as l n ( A A T ) = l n ( A o ) - ~ t . Linear least squares fitting of ln(AAT) versus time was then used to determine A 0 and a, Eqn, 7 was then re-written as
P = Po + k , X ( t ) (9)
where
A° e '~') x ( t ) = - ( 1 0 )
X(t ) was calculated using the A o and a values determined above, and linear least squares fitting of P vs. X(t ) then used to determine P0 and k~. As a cross check on this procedure, all of these parameters (A 0' P0, kl, c~, and k4) w e r e used with Eqn. 8 to compare the predicted values of T C R versus time with the actual data (see e.g. Fig. 10). The TCR data were not directly fit to Eqn. 8 because the values of TCR were determined by summing the AA and P data. Given this fact, it was felt to be improper to also fit the T C R data to Eqn. 8 to obtain ' independent ' estimates of these parameters.
The rate constants obtained from fitting the data from these experiments to these equations are shown in Table 4. The best fit curves through the 2 /89 experiment are also shown in Fig. 10, along with the actual data from this experiment. As can be seen in Table 4, with the exception of the 2 /89 experiment with alanine, there is generally good agreement among the observed k~ and k 4 values for each sediment and amino acid. The impor- tance of amino acid uptake into (presumably)

226
Table 4
Rate constants and p0 values obtained from fitting the data from these experiments to the model described in the text
kl ( h - l ) k4 ( h - l ) kl.m/kl., p o / p f ,
Glutamic acid, Chesapeake Bay 7/87 expt. GC 0.031 0.045
10/87 expt. GC 0.035 0.072 1.18 b GM 0.041 0.009
2/89 expt. GC 0.038 0.051 1.80 1.72 GM 0.069 0.022
Glutamic acid, Bordenstake Bay 7 /87 expt. GC 0.026 0.053
10/87 expt. GC 0.011 0.049 2.32 b GM 0.025 0.003
Alanine, Chesapeake Bay 7/87 expt. AC 0.112 0
10/87 expt. AC 0.264 0.040 0.71 b AM 0.187 0.075
2/89 expt. AC 0.702 0 0.95 0.89 AM 0.666 0
Alanine, Bordenstake Bay 7/87 expt. AC 0.038 0.041
10/87 expt. AC 0.038 0.097 1.22 h AM 0.046 0.038
,t The subscript 'm ' indicates k 1 or p0 values from the molybdate inhibited experiments (i.e., AM or GM). The subscript 'c ~ indicates k 1 or p0 values from "control' experiments (AC or GC) to which molybdate was not added.
b These ratios could not be determined for reasons discussed in the text.
bacterial biomass can be seen here when compar- ing the magnitude of the k 4 and k 1 values from many of the experiments. However it can also be seen that for alanine in mid-Chesapeake Bay sedi- ments, the vast majority of this uptake into bacterial biomass appears to occur during the initial portions of these experiments. This is ob- served both in the actual data from these experi- ments (see e.g., Figs. 3 and 5), and in the results in Table 4 from two of the three experiments (7/87 and 2/89), in which kl = a, leading to k 4 values of 0 for these experiments. Lastly, it can also be seen in Table 4 that the alanine rate constants are generally larger (in some cases 10-20 times) than those for glutamic acid. Similar differences among rate constants for different amino acid have also been observed previously [12,16].
5.3. Processes affecting alanine and glutamic acid in anoxic marine sediments
Production of CO 2 and VFAs from an amino acid may occur by either fermentation or sulfate reduction. Therefore, a comparison of the oxida-
tive rate constant k 1 in the presence and absence of molybdate should allow for an estimation of the relative importance of these two processes in consuming alanine and glutamic acid. This is also shown in Table 4 as the ratio of the kl values in the presence and absence of molybdate. For alanine in Chesapeake Bay sediments, it can be seen that this ratio varies from 0.71 to 0.95. Alanine is therefore used by both sulfate reducing and fermentative bacteria in these sediments, al- though fermentative processes appear to pre- dominate. In contrast, this ratio in Bordenstake Bay sediments is 1.22. As will be discussed below, ratios that are greater than 1 are difficult to inter- pret although they suggest that alanine is not utilized by sulfate reducing bacteria in these sedi- ments.
As a cross-check on these calculations I have also examined the ratios of the initial P0 values in the presence and absence of molybdate. This ratio should be indicative of the relative importance of sulfate reduction and fermentation in oxidizing amino acids during the initial portions of the
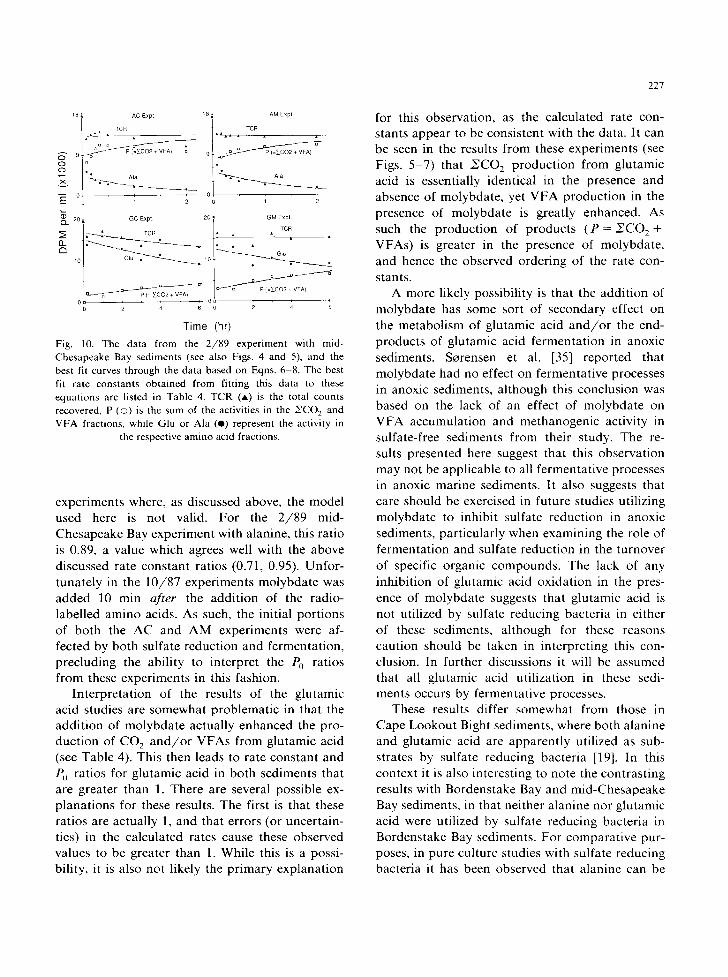
18 ,~ AC Expt 18 ~ AM Expt
1 TCR t TC ! u u
. . . . . , °
E 0 1 2 0 1 2
GC Expt 2O • GM Expl
o,/t t P (= ~CO2 + VFA)
0c 0 0 2 4 6 0 2 4 6
Time (hr)
Fig. 10. The data from the 2/89 experiment with mid- Chesapeake Bay sediments (see also Figs. 4 and 5), and the best fit curves through the data based on Eqns. 6-8. The best fit rate constants obtained from fitting this data to these equations are listed in Table 4. TCR (A) is the total counts recovered, P (©) is the sum of the activities in the NCO 2 and VFA fractions, while Glu or Ala (e) represent the activity in
the respective amino acid fractions.
experiments where, as discussed above, the model used here is not valid. For the 2 /89 mid- Chesapeake Bay experiment with alanine, this ratio is 0.89, a value which agrees well with the above discussed rate constant ratios (0.71, 0.95). Unfor- tunately in the 10/87 experiments molybdate was added 10 min after the addit ion of the radio- labelled amino acids. As such, the initial portions of both the AC and AM experiments were af- fected by both sulfate reduction and fermentation, precluding the ability to interpret the P0 ratios from these experiments in this fashion.
Interpretat ion of the results of the glutamic acid studies are somewhat problematic in that the addit ion of molybdate actually enhanced the pro- duction of CO 2 a n d / o r VFAs from glutamic acid (see Table 4). This then leads to rate constant and P0 ratios for glutamic acid in both sediments that are greater than 1. There are several possible ex- planations for these results. The first is that these ratios are actually 1, and that errors (or uncertain- ties) in the calculated rates cause these observed values to be greater than 1. While this is a possi- bility, it is also not likely the primary explanation
227
for this observation, as the calculated rate con- stants appear to be consistent with the data. It can be seen in the results from these experiments (see Figs. 5-7) that NCO 2 production from glutamic acid is essentially identical in the presence and absence of molybdate, yet VFA production in the presence of molybdate is greatly enhanced. As such the production of products ( P = NCO z + VFAs) is greater in the presence of molybdate, and hence the observed ordering of the rate con- stants.
A more likely possibility is that the addi t ion of molybdate has some sort of secondary effect on the metabolism of glutamic acid a n d / o r the end- products of glutamic acid fermentation in anoxic sediments. Sorensen et al. [35] reported that molybdate had no effect on fermentative processes in anoxic sediments, although this conclusion was based on the lack of an effect of molybdate on VFA accumulation and methanogenic activity in sulfate-free sediments from their study. The re- sults presented here suggest that this observation may not be applicable to all fermentative processes in anoxic marine sediments. It also suggests that care should be exercised in future studies utilizing molybdate to inhibit sulfate reduction in anoxic sediments, particularly when examining the role of fermentation and sulfate reduction in the turnover of specific organic compounds. The lack of any inhibition of glutamic acid oxidation in the pres- ence of molybdate suggests that glutamic acid is not utilized by sulfate reducing bacteria in either of these sediments, although for these reasons caution should be taken in interpreting this con- clusion. In further discussions it will be assumed that all glutamic acid utilization in these sedi- ments occurs by fermentative processes.
These results differ somewhat from those in Cape Lookout Bight sediments, where both alanine and glutamic acid are apparent ly utilized as sub- strates by sulfate reducing bacteria [19]. In this context it is also interesting to note the contrasting results with Bordenstake Bay and mid-Chesapeake Bay sediments, in that neither alanine nor glutamic acid were utilized by sulfate reducing bacteria in Bordenstake Bay sediments. For comparative pur- poses, in pure culture studies with sulfate reducing bacteria it has been observed that alanine can be

228
used by such organisms, while glutamic acid ap- parently cannot [21-23,38].
Assuming that these results are representative in general of the relative importance of sulfate reduction and fermentation in metabolizing dis- solved free amino acids in these sediments, it would therefore appear that most amino acid utili- zation occurs here by fermentative processes. This observation agrees with the results of Henrichs and Sugai [39] who reported that molybdate had no 'significant' effect on the mineralization rates of several amino acids in the anoxic sediments of Skan Bay, suggesting that fermentation was prim- arily responsible for the metabolism of dissolved, free amino acids in these sediments as well. In contrast, Smith and Klug [18] reported that sulfate reduction accounted for 85% of the remineraliza- tion of amino acids in eutrophic lake sediments.
5.4. Volatile fatty acid production from alanine and glutamic acid
VFAs appear to be the predominant inter- mediates of alanine and glutamic acid utilization in mid-Chesapeake Bay and Bordenstake Bay sediments. In the model described above, VFAs and CO, were summed together into a single prod- uct pool. However their production rates in the molybdate inhibition experiments can also be used to estimate the 'average' VFA produced from each of these amino acids. Re-writing Eqn. 1 as
Amino acid (m carbons) - , VFA(m n carbons)
+ n CO 2 (11)
and neglecting for now the production of H2 or any other reduced compounds required for fermentative mass balance, the following expres- sions for VFA and CO x production can be writ- ten.
dVFA m n dt - kl n AA7 (12)
dCO~ m
- k 1 ~ A A T (13) d5
Note that summing Eqns. 12 and 13 yields Eqn. 4
for dP/d t . Dividing these two equations by each other gives
dVFA m - ;7 1 dCO~ - ;1 - R 1 (14)
where R = n/re. Based on plots of the VFA activ- ity versus CO 2 activity from the 10/87 and 2/89 experiments and the resulting slopes of the best fit lines through these data, R~m , ranges from 0.52 to 0.72, while RgLu varies from 0.52 to 0.67. Since alanine has 3 carbons (m =3) , n is therefore between 1.6 and 2.2, and the 'average' VFA pro- duced from alanine fermentation has 0.8 1.4 carbons (i.e., m n in Eqn. 12). This predicts that formate and acetate are likely the predominant products of alanine fermentation in these sedi- ments, since if only formate were produced the value of m--n would be 1, while equal production of formate and acetate would lead to an m n value of 1.5.
For glutamic acid (with 5 carbons) the range of Rgh , values predicts that n is between 2.6 and 3.4, and that the average VFA produced has 1.6 2.4 carbons. Interpreting this calculation is more dif- ficult, in part because of difficulties in explaining the results of the molybdate inhibition experi- ments with glutamic acid (see previous section). Furthermore, because of the larger number of volatile fatty acids that can be produced during the partial oxidation of glutamic acid (i.e., VFAs with one to four carbons) the individual VFAs resulting from this process cannot be uniquely determined with only this m-n value. However an m n value of 1.6 is consistent with approximately equal production of formate and acetate from glutamic acid fermentation, while values of m-n that are greater than 2 suggest that 3 and 4 carbon VFAs (propionate and butyrate) are produced along with acetate a n d / o r formate (e.g., if glutamic acid fermentation results in production of 60% acetate, 30% propionate and 10% formate, then m-n would equal 2.2).
Pure culture studies have shown that VFAs such as formate, acetate, propionate and butyrate can all be produced from these amino acids by anaerobic fermentative bacteria [21,40,41]. How- ever a further comparison of the results presented here with these previous studies is not possible

because the exact stoichiometry of such fermenta- tion reactions has been shown to depend quite strongly on the growth conditions of the organisms. For example, Stams and Hansen [21] have shown that the relative amounts of acetate, formate, and propionate produced by Acidamino- bacter hydrogenoformans during glutamic acid fer- mentation depends quite strongly on whether the organisms is grown alone or in co-culture with sulfate reducing or methanogenic bacteria.
5.5. The role of dissolved, free amino acids in am- monium production and sulfate reduction in anoxic marine sediments
The results of the 2 /89 experiment with the mid-Chesapeake Bay sediments can be used to further examine the role of dissolved free amino acids in the processes of ammonium production or sulfate reduction in these sediments. This will involve a slight re-examination of the question discussed above, to estimate what percentage of bacterial sulfate reduction can be accounted for by amino acid oxidation.
The results of these calculations are shown in Table 5, in which the rates of alanine and glutamic acid mineralization are presented along with estimates of the rate of total DFAA (TDFAA) mineralization. This latter rate has been calculated using the range of rate constants observed for alanine and glutamic acid. In spite of the many assumptions made in these calculations, they il- lustrate several important points. The first is that mineralization of dissolved free amino acids ap- pears to account for up to - 6 0 % of the total ammonium production in these sediments. The results of these calculations also illustrate that dissolved free amino acids are not significant elec- tron donors ( < 2%) for sulfate reduction in anoxic marine sediments. These results agree well with the observation that dissolved free amino acids also account for a similar small fraction ( - 1-3%) of the sulfate reduction in the anoxic sediments of Cape Lookout Bight [19].
The mineralization of sedimentary amino acids has been shown to account for a significant frac- tion of the total nitrogen regeneration ( = ammonium production) in anoxic sediments [10]. The results presented here have also shown that
229
Table 5
The role of dissolved, free amino acid remineralization in ammonium production and sulfate reduction in anoxic sedi-
ments, based on the results of the 2 / 8 9 mid-Chesapeake Bay
sediment experiments
Amino acid MR a (p~M/h) M R / A P R b %SR c
Alanine 0.014 0.6% 0.04%
Glutamic acid 0.001 0.04% 0% TDFAA (d, e) 0.013 0.24 0.6-11.9% 0.02 0.4%
(d, f) 0.064-1.16 3.2-57.5% 0.1-1.9%
a MR = mineralization rate = k 1 ([AA]dis + [AA]ads ). Values of k 1 are listed in Table 3, while the dissolved free amino
acid concentrations were taken from Table 2. [AA]ads was calculated using the reversible linear adsorption isotherm
equation, [AA]ads = K [AA]dis [42]. K values for alanine and glutamic acid were estimated from parti t ion coefficients
(K *) reported by Henrich and Farrington [4] and the equa-
tion K = K *pds(1- ¢,)/g, [42]. g,, the porosity of the sedi-
ment slurry was 0.95, and Pd~ (the dry sediment density) was
assumed to be 2.5 g / c m 3. b APR = ammonium production rate ( = 2.2_+1.3 /~M/h; see
Table 1). MR values were converted to #mol D F A A - N / h by assuming that the average DFAA in these sediments contains
1.09 mol N / m o l DFAA [11]. c %SR = the percentage of sulfate reduction that occurs with
amino acids as substrates. These values were determined by
assuming that the following percentages of amino acid mineralization are due to bacterial sulfate reduction (see
Table 3): alanine, 15%; glutamic acid, 0%; TDFAAs, 8% (on
average). This calculation also assumes a 1 : 1 stochiometry
between moles of sulfate reduced and moles of amino acid
oxidized. The sulfate reduction rate in this experiment was
4.9_+0.7/zM/h (see Table 1).
d This range is based on the range of k 1 values reported for
alanine and glutamic acid and the TDFAA concentrations
reported in Table 2. e The K value used here (1.3) was based on a weighted
average of the partition coefficients in Henrich and Farring-
ton [4], using the mole percentages of DFAAs in this experi-
ment. f The K value used here is an upper limit for this quanti ty (10)
discussed in Burdige and Martens [11].
DFAA metabolism (primarily by fermentative processes) may account for a significant amount of the ammonium production in anoxic sediments (see Table 5). Taken together, these two observa- tions support the model presented in Burdige and Martens [11] in which dissolved free amino acids are proposed to be important intermediates in the overall mineralization of sedimentary amino acids. Given the key role of amino acid cycling in overall

230
c a r b o n a n d n i t r o g e n cyc l ing in a n o x i c m a r i n e
s e d i m e n t s [4,10] t hese o b s e r v a t i o n s f u r t h e r ind i -
ca te the i m p o r t a n c e of d i s so lved free a m i n o ac ids
as i n t e r m e d i a t e s in overa l l o r g a n i c m a t t e r re-
m i n e r a l i z a t i o n in a n o x i c m a r i n e s e d i m e n t s [11,12].
A C K N O W L E D G E M E N T S
I w o u l d like to t h a n k B a r b a r a M o w e r y , R o b e r t
W i l l i a m s o n a n d M a r k H e r r e n k o h l for he lp w i th
b o t h the l a b o r a t o r y a n d f ield w o r k of th is s tudy . I
w o u l d a lso like to t h a n k Ed S h o l k o v i t z for p r o v i d -
ing m e wi th t ime on his c ru ises to co l lec t s o m e of
the C h e s a p e a k e Bay s amp le s , a n d G r e g C u t t e r for
a l l o w i n g m e to use his b o x c o r e r to co l lec t the
C h e s a p e a k e Bay s a m p l e s . Iris A n d e r s o n , H e n r y
B l a c k b u r n a n d two a n o n y m o u s r ev iewers p r o v i d e d
he lp fu l c o m m e n t s on ear l ie r ve r s i ons of the
m a n u s c r i p t . Th i s w o r k was s u p p o r t e d by N S F
G r a n t s O C E - 8 6 0 8 2 7 6 a n d OCE-8817409 .
R E F E R E N C E S
[1] Laanbroek, H.J. and Veldkamp, H. (1982) Microbial in- teractions in sediment communities. Phil. Trans. Roy. Soc. Lond. B 297, 533 550.
[2] Rosenfeld, J.K. (1979) Amino acid diagenesis and adsorp- tion in nearshore anoxic marine sediments. Limnol. Oc- eanogr. 24, 1014 1021.
[3] Hedges, J.l. and Hare, P.E. (1987) Amino acid adsorption by clay minerals in distilled water. Geochim. Cosmochim. Acta. 51, 255-259.
[4] Henrichs, S.M. and Farrington, J.W. (1987) Early diagen- esis of amino acids and organic matter in two coastal marine sediments. Geochim. Cosmochim. Acta. 51, 1 15.
[5] Welte, D. (1973) Recent advances in organic geochemistry of humic substances and kerogen. A review, in Advances in Organic Geochemistry (Tissot, B. and Bienner, F., Eds.), pp. 3-13. Edition Technip., Paris.
[6] Hedges, J.I. (1978) The formation and clay mineral reac- tions of melanaoidins. Geochim. Cosmochim. Acta. 42, 69-76.
[7] Krom, M.D. and Westrich, J.T. (1981) Dissolved organic matter in the pore waters of recent marine sediments; a review, in Biogeochemistry of Organic Matter at the Sedi- ment-Water Interface, pp. 103-111, CNRS Int. Colloq.
[8] Tegelaar, E.W., Leeuw, J.W.d., Derenne, S. and Largeau, C. (1989) A reappraisal of kerogen formation. Geochim. Cosmochim. Acta. 53, 3103 3106.
[9] Henrichs, S.M. (1990) Early diagenesis of organic matter in marine sediments, progress and perplexity. Mar. Chem., in press.
[10] Burdige, D.J. and Martens, C.S. (1988) Biogeochemical cycling in an organic-rich marine basin -10. The role of amino acids in sedimentary carbon and nitrogen cycling. Geochim. Cosmochim. Acta. 52, 1571-1584.
[11] Burdige, D.J. and Martens, C.S. (1990) Biogeochemical cycling in an organic-rich marine basin -11. The sedimen- tary cycling of dissolved free amino acids. Geochim. Cos- mochim. Acta. 54, 3033 3052.
[12] Sugai, S.F. and Henrichs, S.M. (1991) Rates of amino acid decomposition in Resurrection Bay (Alaska) sediments. submitted to Appl. Environ. Microbiol.
[13] Reichardt, W. (1986) Enzymatic potential for decomposi- tion of detrital biopolymers in sediments from Kiel Bay. Ophelia. 26, 369-384.
[14] Mayer, E.M. (1989) Extracellular proteolytic enzyme ac- tivity in sediments of an intertidal mudflat. Limnol. Oc- eanogr. 34, 973-981.
[15] Abelson. P.H. and Hare, P.E. (1971) Reactions of amino acids with natural and artificial humus and kerogen. Carnegie Inst. Wash. Yearb. 70, 327-334.
[16] Hanson, R.B. and Gardner, W.S. (1978) Uptake and metabolism of two amino acids by anaerobic micro- organisms in four diverse salt marsh soils. Mar. Biol. 46. 101-107.
[17] Christensen, D. and Blackburn, T.H. (1980) Turnover of tracer (14C, 3H labelled) alanine in inshore marine sedi- ments. Mar. Biol. 58, 97 103.
[18] Smith, R.I. and Klug, M.J. (1981) Electron donors utilized by sulfate-reducing bacteria in eutrophic lake sediments. Appl. Environ. Microbiol. 42, 116 121.
[19] Burdige, D.J. (1989) The effects of sediment slurrying on microbial processes, and the role of amino acids as sub- strates for sulfate reduction in anoxic marine sediments. Biogeochemistry 8, 1-23.
[20] Barker, H.A. (1981) Amino acid degradation by anaerobic bacteria. Annu. Rev. Biochem. 50, 23--40.
[21] Stams, A.J.M. and Hansen. T.A. (1984) Fermentation of glutamate and other compounds by Acidaminohacter hy- drogenoformans gen. nov. sp. nov., an obligate anaerobe isolated from black mud. Studies with pure cultures and mixed cultures with sulfate-reducing and methanogenic bacteria. Arch. Microbiol. 137, 329-337.
[22] Stares, A.J.M. and Hansen, T'.A. (1986) Metabolism of L-alanine in Desulfotomaculum rurnims and two marine Desulfovibrio strains. Arch. Microbiol. 145, 277 ~279.
[23] Stares, A.J.M., ttansen, T.A. and Skyring, G.W. (1985) Utilization of amino acids as energy substrates by two marine DesulJot,ihrio strains. FEMS Microbiol. Ecol.. 31, 11 15.
[24] Stams, A.J.M., Hoekstra, E.G. and Hansen, T.A. (1986) Utilization of L-alanine as carbon and nitrogen source by Desulfovibrio HL21. Arch. Microbiol. 145, 272 276.
[25] Tabatabai, M.A. (1974)A rapid method for determination of sulfate in water samples. Environ. kerr. 7, 237 243.

[26] Solorzano, L. (1969) Determination of ammonia in natu- ral waters by the phenolhypochlorite method. Limnol. Oceanogr. 14, 799-801.
[27] Lindroth, P. and Mopper, K. (1979) HPLC determination of subpicomole amounts of amino acids by precolumn fluorescence derivitization with o-phthaldialdehyde. Anal. Chem. 51, 1667-1674.
[28] King, G.M., Klug, M.J. and Lovely, D.R. (1983) Metabo- lism of acetate, methanol, and methylated amines in inter- tidal sediments of Lowes Cove, Maine. Appl. Environ. Microbiol. 45, 1848-1853.
[29] Huang, C.M. (1989) Identification and quantification of volatile amines in marine sediments. M.S. Thesis, Old Dominion University.
[30] Reeburgh, W.S. (1967) An improved interstitial water sampler. Limnol. Oceanogr. 12, 163-165.
[31] Herrenkohl, M.J. (1988) Nutrient cycling in Bordenstake Bay Sediments: a backbarrier lagoon. M.S. thesis, Old Dominion University.
[32] Rosenfeld, J.K. (1979) Ammonium adsorption in nearshore anoxic sediments. Limnol. Oceanogr. 24, 356- 364.
[33] Mackin, J.E. and Aller, R.C. (1984) Ammonium adsorp- tion in marine sediments. Limnol. Oceanogr. 29, 250-257.
[34] Oremland, R.S. and Taylor, B.F. (1978) Sulfate reduction and methanogenesis in marine sediments. Geochim. Cos- mochim. Acta 42, 209-214.
231
[35] Sorensen, J., Christensen, D. and Jorgensen, B.B. (1981) Volatile fatty acids and hydrogen as substrates for sulfate-reducing bacteria in anaerobic marine sediments. Appl. Environ. Microbiol. 42, 5-11.
[36] Capone, D.G., Reese, D.D. and Kiene, R.P. (1983) Effects of metals on methanogenesis, sulfate reduction, carbon dioxide evolution, and microbial biomass in anoxic salt marsh sediments. Appl. Environ. Microbiol. 45, 1586- 1591.
[37] King, G.M. and Klug, M.J. (1982) Glucose metabolism in sediments of a eutrophic lake: tracer analysis of uptake and product formation. Appl. Environ. Microbiol. 44, 1308-1317.
[38] Coleman, G.S. (1960) A sulfate reducing bacterium from the sheep rumen. J. Gen. Microbiol. 22, 423-436.
[39] Henrichs, S.M. and Sugai, S.F. (1989) Decomposition of amino acids in Skan Bay (Alaska) sediments. Abstract presented at the 1989 ASLO Annual Meeting.
[40] Doelle, H.W. (1975) Bacterial Metabolism, Academic Press.
[41] Gottschalk, G. (1979) Microbial Metabolism, Springer- Verlag.
[42] Berner, R.A. (1980) Early Diagenesis, A Theoretical Ap- proach, Princeton University Press.