microbial community changes in tnt spiked soil
TRANSCRIPT
MICROBIAL COMMUNITY CHANGES IN TNT SPIKED SOIL BIOREMEDIATIONTRIAL USING BIOSTIMULATION, PHYTOREMEDIATION AND
BIOAUGMENTATION
Hiie Nolvak1, Jaak Truu2, Baiba Limane3, Marika Truu4,Guntis Cepurnieks5, Vadims Bartkevics6, Jaanis Juhanson7, Olga Muter8
1, 7Institute of Molecular and Cell Biology, Faculty of Science and Technology, University of Tartu,
23 Riia str., 51010 Tartu, Estonia1, 2, 4Institute of Ecology and Earth Sciences, Faculty of Science and Technology, University of Tartu,
46 Vanemuise str., 51014 Tartu, Estonia3, 8Institute of Microbiology and Biotechnology, University of Latvia, 4 Kronvalda blvd.,
LV-1586 Riga, Latvia4, 5, 6Institute of Food Safety, Animal Health and Environment (BIOR), 3 Lejupes str.,
LV-1076 Riga, Latvia
Submitted 6 Mar. 2012; accepted 14 Aug. 2012
Abstract. Trinitrotoluene (TNT), a commonly used explosive for military and industrial applications, can cause
serious environmental pollution. 28-day laboratory pot experiment was carried out applying bioaugmentation using
laboratory selected bacterial strains as inoculum, biostimulation with molasses and cabbage leaf extract, and
phytoremediation using rye and blue fenugreek to study the effect of these treatments on TNT removal and changes
in soil microbial community responsible for contaminant degradation. Chemical analyses revealed significant
decreases in TNT concentrations, including reduction of some of the TNT to its amino derivates during the 28-day
tests. The combination of bioaugmentation-biostimulation approach coupled with rye cultivation had the most
profound effect on TNT degradation. Although plants enhanced the total microbial community abundance, blue
fenugreek cultivation did not significantly affect the TNT degradation rate. The results from molecular analyses
suggested the survival and elevation of the introduced bacterial strains throughout the experiment.
Keywords: TNT, bioaugmentation, biostimulation, phytoremediation, microbial community.
Reference to this paper should be made as follows: Nolvak, H.; Truu, J.; Limane, B.; Truu, M.; Cepurnieks, G.;Bartkevics, V.; Juhanson, J.; Muter, O. 2013. Microbial community changes in TNT spiked soil bioremediation trialusing biostimulation, phytoremediation and bioaugmentation, Journal of Environmental Engineering and LandscapeManagement 21(3): 153�162. http://dx.doi.org/10.3846/16486897.2012.721784
Introduction
The nitroaromatic explosive, 2,4,6-trinitrotoluene (TNT),
has been extensively used for over 100 years, and this
persistent toxic organic compound has resulted in soil
contamination and environmental problems at many
former explosives and ammunition plants, as well as
military areas (Stenuit, Agathos 2010). TNT has been
reported to have mutagenic and carcinogenic potential
in studies with several organisms, including bacteria
(Lachance et al. 1999), which has led environmental
agencies to declare a high priority for its removal from
soils (van Dillewijn et al. 2007).
Both bacteria and fungi have been shown to
possess the capacity to degrade TNT (Kalderis et al.
2011). Bacteria may degrade TNT under aerobic or
anaerobic conditions directly (TNT is source of carbon
and/or nitrogen) or via co-metabolism where addi-
tional substrates are needed (Rylott et al. 2011). Fungi
degrade TNT via the actions of nonspecific extracel-
lular enzymes and for production of these enzymes
growth substrates (cellulose, lignin) are needed. Con-
trary to bioremediation technologies using bacteria or
bioaugmentation, fungal bioremediation requires
an ex situ approach instead of in situ treatment (i.e.
soil is excavated, homogenised and supplemented
with nutrients) (Baldrian 2008). This limits applicabil-
ity of bioremediation of TNT by fungi in situ at a field
scale.
Corresponding author: Jaak TruuE-mail: [email protected]
JOURNAL OF ENVIRONMENTAL ENGINEERING AND LANDSCAPE MANAGEMENT
ISSN 1648-6897 print/ISSN 1822-4199 online
2013 Volume 21(3): 153�162
doi:10.3846/16486897.2012.721784
Copyright ª 2013 Vilnius Gediminas Technical University (VGTU) Presswww.tandfonline.com/teel
Copyright © 2015 Vilnius Gediminas Technical University (VGTU) Presswww.tandfonline.com/teel
JOURNAL OF ENVIRONMENTAL ENGINEERING AND LANDSCAPE MANAGEMENTISSN 1648–6897 / eISSN 1822-4199
2015 Volume 23(03): 163–171http://dx.doi.org/10.3846/16486897.2015.1050399
Corresponding author: Lei YuE-mail: [email protected]
as social elements associated with warning of a danger, searching for food or religious ceremonies. Soundscape is a ‘scape’ formed by sound, human and space (Schafer 1977). Sound preference is an aesthetic response of people reacting to a soundscape.
In relation to soundscape research, sound identifi-cation and its effects on aural perceptions have been stu-died using a cognitive approach in terms of sound ecology (Dubois et al. 2006). A study in a number of urban open spaces shows that sound preference evaluation could be influenced by many other factors rather than just sound pressure level (SPL) (Yang, Kang 2005), and a systema-tic analysis concerning the effects of social, physical and psychological factors indicates that sound preference eva-luation is rather complicated in terms of various types of sound sources and spatial and temporal situations they are heard (Yu, Kang 2010).
The aim of this study is to use artificial neural networks (ANN) to predict sound preference evaluation in urban open spaces, in order to provide a useful tool to aid landscape architects and urban designers at a de-sign stage. ANN technique has been proven useful in
usInG ann To sTudy sound prEfErEncE EValuaTIon In urBan opEn spacEs
Lei YUa, Jian KANGb a Shenzhen Graduate School, Harbin Institute of Technology, Shenzhen, China
b School of Architecture, University of Sheffield, Western Bank, Sheffield, S10 2TN, United Kingdom
Submitted 12 Nov. 2014; accepted 08 May 2015
abstract. In soundscape research, subjective preference evaluation of a sound is crucial. Based on a series of field studies and laboratory experiments, influence of sound category and psychoacoustic parameters on sound preference evaluation is examined. It has been found that sound category and loudness and sharpness are important. Regarding a previous study, age and education level are also important to influence sound preference evaluation. In order to un-derstand user’s preference in terms of sound at a design stage, prediction of sound preference evaluation is essential. As sound preference evaluation is complicated and influenced by various factors linearly and non-linearly, artificial neural network (ANN) has been explored to make predictions of sound preference evaluation. A number of developed ANN models have been demonstrated, and it has been found that the models including input factors of sound catego-ry, loudness and sharpness produce better predictions than others. The best prediction model is the one that is based on an individual case study site. Based on the best prediction model, a mapping tool for sound preference evaluation has been developed and its usefulness for aiding landscape architects and urban designers has been demonstrated.
Keywords: sound preference evaluation, urban open space, ANN modelling.
Introduction
Urban noise has been paid much attention and great efforts have been made to reduce its levels in large urban areas. However, recent research has found that attenuation on sound level is insufficient in reducing noise annoyan-ce whereas approaches from soundscape perspective have been proven to be often effective and feasible (Schulte-Fortkamp 2002; Kang 2006; Brown, Muhar 2004). Diffe-rent from a physical noise environment, soundscape refers to a subjective sound environment with an emphasis on the way that sounds are perceived as a whole. As a result, sounds are recognised as essential and crucial compo-nents in a soundscape, which have been studied by many authors (Sémidor 2006; Yang, Kang 2005; Yu, Kang 2010; Yang, Kang 2013).
Physically, sound can be measured by frequency and pressure level. Its effects on human’s perception can be evaluated by psychoacoustic parameters such as loudness, sharpness and roughness (zwicker, Fastl 1999). Psycholo-gically, sounds can be recognised by causing an informati-ve aural sensation in our brains through the auditory me-chanism (Moore 1997). In real world, sounds are realised

L. Yu, J. Kang. Using ANN to study sound preference evaluation in urban open spaces164
predicting soundscape evaluation. Previous studies have shown that an ANN model would be efficient and accu-rate if the inputs are closely related to the outputs (Ling, Liu 2004; Yu, Kang 2009; Meng, Kang 2012). In this pa-per, based on the data of a series of field and laboratory studies, relationships between factors of sound category and psychoacoustic parameters and the sound preference evaluation are examined. Important influencing factors obtained from this and a previous study (Yu, Kang 2010) are selected as the input variables for developing ANN models to predict sound preference evaluation. As a re-sult, a number of ANN models are developed to predict preference evaluation of various single sounds with res-pect to various locations and situations. According to the predictions made with a well-trained successful model, a mapping method is proposed and developed for visually aiding urban designers and planners.
1. sound preference evaluation
In order to develop ANN models to predict sound prefe-rence evaluation, factors significantly related with sound
preference evaluation has to be obtained. According to a previous study, factors of social/demographic, physical, and behaviour/psychological aspect have been found ba-sically insignificant related to sound preference evaluation except age and education level (Yu, Kang 2010). Using data collected in the previous study, sound category and psychoacoustic parameters influencing sound preference evaluation are explored and demonstrated in the following sections.
1.1. field studies
The field studies were firstly carried out in 14 urban squa-res, two each in seven European cities. Following Europe-an study, more works were carried out in 5 Chinese urban squares, 2 in Beijing and 3 in Shanghai (Yu 2009). In to-tal, 10,000 individuals were interviewed in 19 urban open spaces. The field study sites were rather varied according to their functions and locations, also with a wide range of physical conditions and users social backgrounds. The sound preference evaluation was scaled in a range of –1–0–1, in which –1 means favourite, 0 for neutral, and 1 for annoyed. In the study, two kinds of sound category have been studied, one is based on sound type and the other is in terms of sound function. Sound type regards to the meaning of a sound source and can be categorised as natural, human, and mechanical ones as shown in the Ta-ble 2 of Yu, Kang (2010). Sound function refers to a sound with different actions. However, this study concerns the influence of sound type on sound preference evaluation.
Using data collected in the field study sites, sound ca-tegory influencing sound preference evaluation has been examined. Figure 1 presents the percentage of sound pre-ference evaluation for the examined sounds in the field study sites. It can be seen that most natural sounds (bird, water, insect) have a high favourite percentage and a low annoyance percentage, whereas mechanical sounds (car passing, buses passing, vehicle parking and construction) usually have a low favourite percentage but a high anno-yance percentage. Medium percentages are found for hu-man sounds (speaking, footstep, children shouting). In ot-her words, natural sounds are most preferred, mechanical sounds are most annoyed, and human sounds are percei-ved as neutral. The result indicates that to various sound, sound preference evaluation is rather different according to sound category.
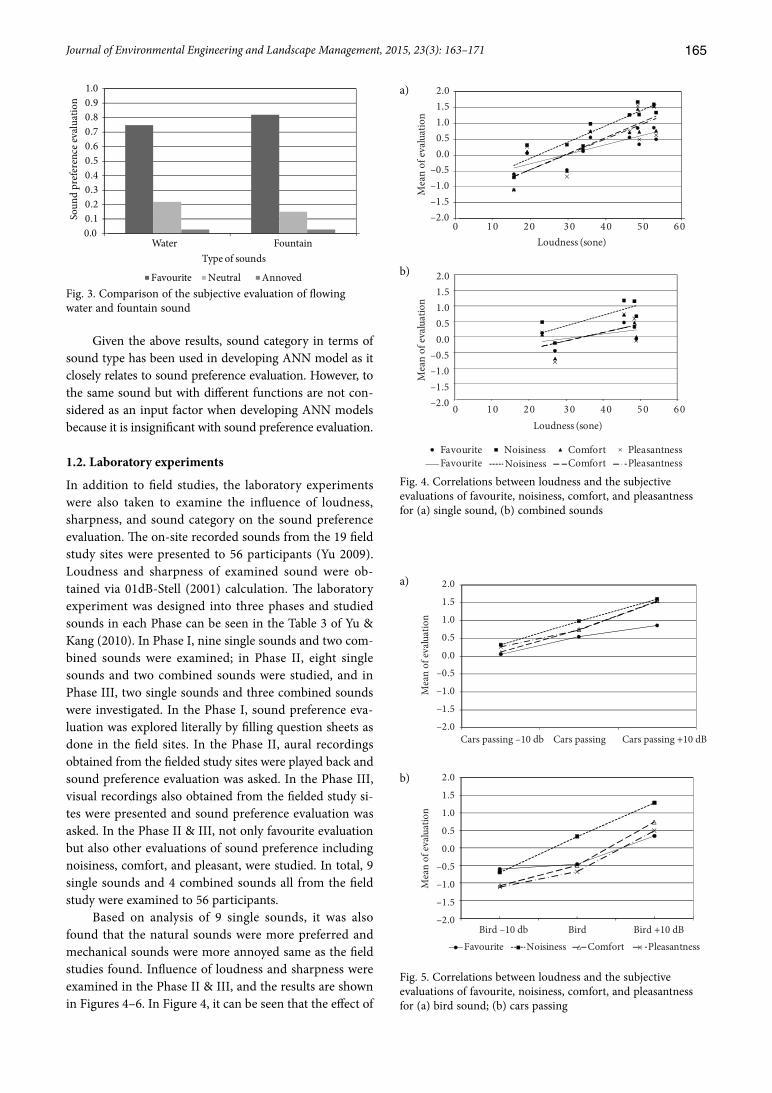
In addition, sound preference evaluation might differ to the sounds from the same category but with different functions related to activities (Dubois et al. 2006). Figu-re 2 compares the preference evaluation of church bell and clock bell while Figure 3 compares the preference evaluation of flowing water and fountain. It can be seen that there are slightly differences with the sounds from the same source but different functions although the differen-ces are insignificant (p > 0.05, Pearson correlation).
Fig. 1. Subjective evaluations on studied sounds
Fig. 2. Comparison of the subjective evaluation of church bell and clock bell
0.00.10.20.30.40.50.60.70.80.91.0
bird
wat
er
foun
tain
inse
ct
spea
k
foot
step
child
ren
car p
assin
g
bus p
assin
g
park
ing
cons
truct
ion
Studied sounds
Favorite Neutral Annoyance
Soun
d pr
efer
ence
eval
uatio
n
0.00.10.20.30.40.50.60.70.80.91.0
Type of sound
Favourite Neutral Annoyed
Soun
d pr
efer
ence
eval
uatio
n
Church bell Clock bell
Journal of Environmental Engineering and Landscape Management, 2015, 23(3): 163–171 165
Given the above results, sound category in terms of sound type has been used in developing ANN model as it closely relates to sound preference evaluation. However, to the same sound but with different functions are not con-sidered as an input factor when developing ANN models because it is insignificant with sound preference evaluation.
1.2. laboratory experiments
In addition to field studies, the laboratory experiments were also taken to examine the influence of loudness, sharpness, and sound category on the sound preference evaluation. The on-site recorded sounds from the 19 field study sites were presented to 56 participants (Yu 2009). Loudness and sharpness of examined sound were ob-tained via 01dB-Stell (2001) calculation. The laboratory experiment was designed into three phases and studied sounds in each Phase can be seen in the Table 3 of Yu & Kang (2010). In Phase I, nine single sounds and two com-bined sounds were examined; in Phase II, eight single sounds and two combined sounds were studied, and in Phase III, two single sounds and three combined sounds were investigated. In the Phase I, sound preference eva-luation was explored literally by filling question sheets as done in the field sites. In the Phase II, aural recordings obtained from the fielded study sites were played back and sound preference evaluation was asked. In the Phase III, visual recordings also obtained from the fielded study si-tes were presented and sound preference evaluation was asked. In the Phase II & III, not only favourite evaluation but also other evaluations of sound preference including noisiness, comfort, and pleasant, were studied. In total, 9 single sounds and 4 combined sounds all from the field study were examined to 56 participants.
Based on analysis of 9 single sounds, it was also found that the natural sounds were more preferred and mechanical sounds were more annoyed same as the field studies found. Influence of loudness and sharpness were examined in the Phase II & III, and the results are shown in Figures 4–6. In Figure 4, it can be seen that the effect of
Fig. 3. Comparison of the subjective evaluation of flowing water and fountain sound
0.00.10.20.30.40.50.60.70.80.91.0
Type of sounds
Favourite Neutral Annoyed
Soun
d pr
efer
ence
eval
uatio
n
Water Fountain
a)
b)
–2.0–1.5–1.0–0.5
0.00.51.01.52.0
0 10 20 30 40 50 60Loudness (sone)
Favourite Noisiness Comfort PleasantnessFavourite Noisiness Comfort Pleasantness
Mea
n of
evalu
atio
n0 10 20 30 40 50 60–2.0
–1.5–1.0–0.5
0.00.51.01.52.0
Mea
n of
evalu
atio
nLoudness (sone)
a)
b)
Fig. 4. Correlations between loudness and the subjective evaluations of favourite, noisiness, comfort, and pleasantness for (a) single sound, (b) combined sounds
Fig. 5. Correlations between loudness and the subjective evaluations of favourite, noisiness, comfort, and pleasantness for (a) bird sound; (b) cars passing
Cars passing –10 db Cars passing Cars passing +10 dB
Favourite Noisiness Comfort PleasantnessBird –10 db Bird Bird +10 dB
–2.0
–1.5
–1.0
–0.5
0.0
0.5
1.0
1.5
2.0
Mea
n of
evalu
atio
n
–2.0
–1.5
–1.0
–0.5
0.0
0.5
1.0
1.5
2.0
Mea
n of
evalu
atio
n

L. Yu, J. Kang. Using ANN to study sound preference evaluation in urban open spaces166
loudness on single sound is greater than that of on com-bined sounds, evidenced by higher R2 values for single sounds; the R2 is 0.858 for noisiness and 0.677 for favouri-te to the single sounds but to the combined sounds these values are only 0.566 and 0.264 respectively. Moreover, with single sounds the correlations are significant (p < 0.01, Pearson correlation) and with combined sound the correlations are not significant.
Figure 4 also shows that a louder sound is less pre-ferred, either for single or combined sound. This is furt-her confirmed by the results in Figure 5, where the eva-luations of favourite, noisiness, comfort, and pleasantness are shown with different sound levels. In Figure 5, –10 dB means is 10 dB lower than the original sound, and +10 dB means 10 dB higher than the original one when doing lab experiments. Figure 6 shows the effects of sharpness on the sound preference evaluations in terms of favourite, noisiness, comfort, and pleasantness.
It can be seen that there are opposite tendencies for single and combined sounds. A negative relationship is shown for the single sounds, implying that a sharper single sound is more preferred; whereas a positive relationship is shown for the combined sounds, suggesting that a sharper combined sound is less preferred. It is noted that in Figu-re 6, the correlations between sharpness and favourite and pleasantness evaluations for single sounds are significant (p < 0.05, Pearson correlation), and other correlations are not at a significant level.
Generally speaking, in the laboratory experiments, it is found that sound category has significant influence on sound preference evaluation. Loudness and sharpness parameters are also closed to sound preference evaluation especially for single sounds. According to analyses of both field studies and laboratory experiments, it can be con-cluded that sound category are considerably important to influence sound preference evaluation, while loudness, sharpness are also important. As a significant relationship is crucial to develop a well preforming ANN model (Yu, Kang 2009), these factors are therefore considered to be included in developing ANN models for sound preference evaluation in this study.
2. sound preference evaluation ann models
ANN model has been proven better compared with con-versional linear regression models in the study of model-ling the subjective evaluation of sound level and acoustic comfort (Yu, Kang 2009). This is likely because the su-bjective evaluation of soundscape is complicated and is influenced by various factors linearly and non-linearly. Therefore, ANN modeling technique is considered useful to predict sound preference evaluation. Using the factors closely related to sound preference evaluation as conclu-ded in the above Section and also as studied in the Yu, Kang (2010), ANN models for predicting sound preferen-ce evaluation are developed as demonstrated in the follo-wing paragraphs.
The ANN modelling software used in this study is NeuroSolutions (NeuroDimension 1995), which combi-nes a modular design interface with advanced backpro-pagation learning procedures, giving flexibility to design the neural network. A typical NeuroSolutions network is constructed by several interconnecting components (Axon and Synapse) with basic neurons called perceptron elements (PEs). A backpropagation plane is used to trans-mit error information from the output to the network. The test set in NeuroSolutions is called cross validation (CV). In NeuroSolutions, Mean Square Error (MSE) and correlation coefficient are two indices to decide the model performance. The rule is that the closer the correlation co-efficient is to 1, the better performance the model has. The closer the MSE of training and test set is to 0, the better learning the network makes.
As the relationships between input and output is crucial in determining the accuracy of an ANN model’s prediction, input variables selected for developing ANN models of sound preference evaluation regard to their si-gnificance with the outputs. As discussed in Section 2, the most related factors with sound preference evaluation are sound category, loudness, sharpness, and some other soci-al/demographic factors including age and education level (Yu, Kang 2010), but such importance is varied according
Fig. 6. Correlations between sharpness and the subjective evaluations of favourite, noisiness, comfort, and pleasantness for (a) single sound; (b) combined sound
a)
b)
–2.0 –1.5 –1.0 –0.5
0.0 0.5 1.0 1.5 2.0
0 0.5 1.0 1.5 2.0 2.5 3.0Sharpness (acum)
Favourite Noisiness Comfort PleasantnessFavourite Noisiness Comfort Pleasantness
Mea
n of
evalu
atio
n
–2.0 –1.5 –1.0 –0.5
0.0 0.5 1.0 1.5 2.0
Mea
n of
evalu
atio
n
0 0.5 1.0 1.5 2.0 2.5 3.0Sharpness (acum)

Journal of Environmental Engineering and Landscape Management, 2015, 23(3): 163–171 167
different studied site or situations. Therefore, a number of models according to the study sites were developed and examined. For each developing model, significant factors via analysed by SPSS are chosen as input factors to build ANN models. In the study, three single sounds namely bird, children shouting, and car passing are explored re-presenting sound category from natural to mechanical. In modelling sound preference evaluation, combined sound is not studied due to more complicated influencing varia-bles exist, where further specific study is required.
2.1. field study models
Using NeuroSolutions, thirteen ANN models were deve-loped with the data collected in the field studies, as shown in Table 1. Four individual models, named JdP models, were explored according to the case study site Jardin de Perolles in Frobourg, Switzerland, in predicting the sound preference evaluation, considering three single sound, bird, children shouting, car passing, and the preference evaluation of combining these three sounds together. The other models were based on the data of the EU and China group respectively, called group models; and on the data of the all sites, called the general model, where conside-ring the same sound preference.
A number of ANN network structures were explored for the JdP models. The optimal networks are presented in Table 2. It can be seen that the best network for the indi-vidual JdP model is the one in prediction of the preferen-ce evaluations of bird, children shouting, and car passing sound together in which sound category is available as an input variable. It can be seen that a correlation coefficient of 0.71 for training set and 0.67 for testing set is found for the best model, whereas the other three models are rather poor with a correlation coefficient of less than 0.32 for the training set as well as test set. A reason for the good per-formance with the three sounds together might be that the sound type is included as a variable.
Table 3 shows the optimised networks and their prediction results for the group models (EU models and China models) and the general models for bird, children shouting or car passing sound, respectively. It can be seen that all models’ performance is poor with a rather low cor-relation coefficient. For preference evaluation of bird, chil-dren shouting, and car passing sound together, the group or general models no results are shown in Table 3 in terms of all three sounds together since the results were similar to that of the individual models. Comparing the indivi-dual, group and general models, it is interesting to note that their predictions for single sounds are similar, which is different from the result of the sound level and acoustic comfort models, where the individual models gave a much better prediction than the group or general models (Yu, Kang 2009).
Table 1. ANN models list
Model name Model typesJdP – 1
Individual models
All three soundsJdP – 2 BirdJdP – 3 Children shoutingJdP – 4 Car passingEU – 1
EUGroup models
Bird soundEU – 2 Children shoutingEU – 3 Car passingChina – 1
ChinaGroup models
BirdChina – 2 Children shoutingChina – 3 Car passingGeneral – 1
General modelsBird sound
General – 2 Children shoutingGeneral – 3 Car passingLab – 1
Lab modelsAll three sounds
Lab – 2 BirdLab – 3 Car passing
Table 2. JdP – Individual models for predicting sound preference evaluations
Network architecture Result
Input Output layer PEsCoefficient MSETrain CV Train CV
S1, 3, 4, SC
Eva. of sounds 2
90.71 0.67 0.06 0.06
5
S1, 3, 4; Phy2
Eva. of bird 2
110.34 0.23 0.03 0.03
5
S1, 3, 4; Psy2
Eva. ofchildren 2
110.32 0.15 0.07 0.09
5Phy2; Psy1S1, 3, 4
Eva. ofcar passing
29
0.19 0.11 0.05 0.054
Note: Phy2 – Time of day, Psy1 – Site preference, Psy2 – View assessment, S1 – Age, S3 – Occupation, S4 – Education, SC – Sound category
2.2. laboratory experiment models
Using the laboratory experiment data, three models were developed as shown in Table 1 too. The Lab – 1 model was developed to predict preference evaluation of favou-rite, noisiness, comfort, and pleasantness to bird, chil-dren shouting, and car passing sound. The Lab – 2 and Lab – 3 models were developed for predicting preference evaluation of ‘favourite’ of bird and car passing sound res-pectively. For the laboratory experiment model, no mo-del was made only for predicting preference evaluation of children shouting since no sound level difference was examined in the laboratory experiment. Input variables

L. Yu, J. Kang. Using ANN to study sound preference evaluation in urban open spaces168
The optimised networks and their prediction results elicited from the laboratory experiment models are shown in Table 4. It can be seen that all models give a very good prediction, compared with the models based on field stu-dies. The model for the bird sound evaluation provides the best prediction performance, with a correlation coefficient of 0.71 for training set and 0.60 for testing set. A possible reason for the better performance of the laboratory models is that the evaluation was made from the same group of su-bjects and the input variables including loudness and shar-pness closely related with output – sound preference eva-luation, which was not the case in the field studies. In Table 4, it is also interesting to note that the network architecture for all laboratory models is rather similar, in which factors: age, gender, loudness and sharpness, are used as inputs.
2.3. discussion
Compared to the models based on field studies, the mo-dels based on laboratory experiments gave considerably better predictions. A possible reason is that loudness and sharpness, which are closely related to the sound preferen-ce evaluations, were not used as inputs in the field study models but used in the laboratory models.
The individual JdP – 1 model as well as all the lab models makes a better prediction compared to other mo-dels. This suggests that the sound preference evaluation is more related to the sound itself, such as the meaning of sound (sound category) and its psychoacoustic characte-ristics, rather than the sites where the sound was heard.
It is noted that the JdP – 1 model gave a better pre-diction than the lab model considering all three sounds. Perhaps this is because four outputs were set for the Lab – 1 model, which needs more training samples, whereas for the JdP – 1 model, only one output was set; And moreover, there are considerably rather larger training samples (2260 cases) can be used for the JdP – 1 model than the Lab – 1 model.
Overall, the prediction accuracy of the ANN models was acceptable, with the highest test correlation coefficient less than 0.8 for the JdP – 1 model. It is then considered that the JdP – 1 model, which has the highest correlation coefficient, is feasible to be used to predict the sound pre-ference evaluation. This model is going to be used in the following Section to make a prediction for a hypothesis open space, and the predictions of sound preference obtai-ned from the JdP – 1 model will be used to make a sound preference map to present a distribution of the sound pre-ference according to the potential space users.
3. Mapping sound preference
3.1. a hypothetic square
Based on the JdP – 1 model, a mapping method is propo-sed and developed to provide a feasible tool for presenting
Table 3. Group and general models for predicting sound preference evaluations
Network architecture Result
Input Output Lay-er PEs
Coefficient MSETrain CV Train CV
EU
S1, 2, 3, 4
Eva. of bird 2
220.27 0.23 0.03 0.04
11
S1, 3 Eva. of children 2
300.10 0.09 0.11 0.11
20Phy1, Psy1, B5S1, 4
Eva. of car passing
240
0.14 0.11 0.06 0.0820
Chi-na
S1, 4 Eva. of bird 2
170.20 0.10 0.00 0.02
8
S1, 2 Eva. of children 2
160.17 0.16 0.10 0.11
8
S1, 4Eva. of car passing
1 21 0.34 0.23 0.06 0.06
Ge-ne-ral
S1, 2, 3, 4
Eva. of bird 2
120.18 0.11 0.04 0.04
8
S1, 3, 4
Eva. of children 3
250.13 0.12 0.11 0.1112
5
Phy1, S1, 2, 4, 5
Eva. of car passing
340
0.16 0.06 0.07 0.072010
Note: Phy1 – Season, Psy1 – Site preference, S1 – Age, S2 – Gen-der, S3 – Occupation, S4 – Education, S5 – Residential status
Table 4. Lab models in predicting the sound preference evaluations
Network architecture Results
Input Output Lay-er PEs
Coefficient MSETrain CV Train CV
S1, 2, L, S, SC
Eva. of sounds 2
40.53 0.52 0.08 0.05
4S1, 2L, S Eva. of bird 1 4 0.71 0.60 0.08 0.08
S1, 2L, S
Eva. of car passing 2
40.64 0.46 0.06 0.07
4
Note: S1 – Age, S2 – Gender, L – Loudness, S – Sharpness, SC – Sound category
for the Lab models were chosen based on the statistical analyses as discussed in Section 2. As loudness and shar-pness are two factors significantly related to the sound preference evaluation, they were used as inputs. For the Lab – 1 model, the sound category (SC) is also an input available in modelling.

Journal of Environmental Engineering and Landscape Management, 2015, 23(3): 163–171 169
potential users’ evaluation of sound preference in a hypot-hetic open square derived from a real world as shown in Figure 7. It is supposed that via studying a sound preferen-ce evaluation map in terms of bird sound, children shou-ting and car passing sound assumed in the square, a fea-sible tool can be provided for presenting potential users’ sound preference evaluation in aiding landscape architects and urban designers.
According to the Square, three areas with a diffe-rent activity functions are hypothesized. In the Figure 7, it can be seen that in the below area of the Square is a playground for children playing, the upper is arranged with plenty trees and natural elements, the left-hand side is set with a passing through road. In such an open square, very possible sounds to dominate the whole area are bird, children shouting, and car passing as shown in Figure 8. The square is assigned as 100 × 100 square meters, which is because that with such a distance, the sound level would approximately reduce over 20 dB lower and the effect of a single sound to another one could be ignored, therefore each sound has its own influencing area.
In the Figure 8, it can be seen that the car passing sound dominates the left-hand side of the Square; the bird sound occupies the Square’s upper area, and the children shouting sound mainly occurs in the Square’s below area.
According to the sound distribution as shown in Fi-gure 8, the Figure 9 shows the domination area of each hypothesized existing sound. It shows that the area A is mostly dominated by bird sound, the area B by children shouting sound, and the area C by car passing sound, whilst the area D is mostly dominated by these sounds combination. In order to predict preference evaluation of these sounds, potential users assumed to use this Square are considered to be from two age groups, 18–24 years old and 55–65 years old. Their other social and demographic factors are assumed to follow the normal distribution.
3.2. Maps for the sound preference evaluation
According to the Section 3, the best prediction ANN model for anticipating the preference evaluation of bird, children shouting, and car passing sound together is the individual JdP – 1 model, it is therefore to use this model to predict the sound preference evaluation of the hypothe-tic Square; and the prediction values of sound preference were mapped in order to provide a visible tool to aid ur-ban designers and landscape architects.
Using the well-developed individual JdP – 1 model, 100 potential users’ preference evaluations of bird, chil-dren shouting, and car passing sound in the hypothetic square are obtained, in which half of them are assumed to be from 18–24 year’s group, and the other half from 55–65 year’s group. Correspondingly, Figure 10 shows two maps created in terms of the preference evaluations
Fig. 7. A hypothetic open square regarding a real situation
Fig. 8. Sound distributions in the hypothetic square
Fig. 9. SPL distribution (dB) in the hypothetic square

L. Yu, J. Kang. Using ANN to study sound preference evaluation in urban open spaces170
Fig. 10. Sound preference evaluation maps in terms of ‘favourite’ for (a) 18–24 age group; (b) 55–64 age group
of ‘favourite’. The maps are drawn according to the mean values calculated based on the individual JdP – 1 model outputs in terms of the average values of the preference ‘favourite’ evaluations of a given group. It can be seen that the Figure 10(a) presents the sound preference evaluation of potential users aged from 18–24 years old while the Fi-gure 10(b) presents the evaluations of the users aged from 55–64 years old. Comparing Figure 10(a) and (b), it is found that the younger age group prefers bird sound and children shouting less than the older age group, whereas in terms of car passing sound, the evaluations of the two age groups are rather similar. In this paper, as ANN mo-dels developed for a combined sound (a sound from more than two sounds mixed) are not examined. Therefore, the sound preference evaluation of the area D in the potential Square is not studied since that area is mostly dominated by a combination of bird, children shouting, or car passing sound mixed.
conclusions
In terms of the influencing factors on sound preference evaluation, this study shows that sound category is si-gnificant, while the psychoacoustic parameters including loudness and sharpness are also significant for preference evaluation of single sound. Regarding social/demographi-cal and behavioural factors, a previous study showed that age and education level are important to sound preference
evaluation to some field study sites. Using significant va-riables obtained from this and previous studies, ANN models for predicting sound preference evaluation are explored.
By exploring a number of ANN models, it was found that the laboratory models generally made better predictions than the field study models, although the in-dividual JdP – 1 model, elicited from the field study site Jardin de Perolles in Frobourg, Switzerland, gave the best predictions to the preference evaluations of bird, children shouting, and car passing sound.
As no significant prediction difference has been found among different locations, based on the best pre-diction model, JdP – 1 model, a mapping tool for sound preference evaluation has been explored and the useful-ness has been demonstrated, for aiding landscape archi-tects and urban designers.
acknowledgements
The data in this paper are mainly from two research pro-jects funded by the European Commission and the British Academy. The authors are indebted to Drs. R. Harrison, M. zhang, and other project partners for useful discus-sion.
references
01dB-Stell. 2001. Symphonie measurement system – Getting star-ted manual. Limonest: 01dB-Stell.
Brown, A. L.; Muhar, A. 2004. An approach to the acoustic desi-gn of outdoor space, Journal of Environmental Planning and Management 47(6): 827–842.
http://dx.doi.org/10.1080/0964056042000284857Dubois, D.; Guastavino, C.; Raimbault, M. A. 2006. A cognitive
approach to urban soundscape: using verbal data to access everyday life auditory categories, Acta Acustica United with Acustica 92(6): 862–874.
Kang, J. 2006. Urban sound environment. London: Taylor & Fran-cis incorporating Spon.
Ling, F. Y.; Liu, M. 2004. Using neural network to predict per-formance of design-build projects in Singapore, Building and Environment 39: 1263–1274.
http://dx.doi.org/10.1016/j.buildenv.2004.02.008Meng, Q.; Kang, J. 2012. Prediction of subjective loudness in un-
derground shopping streets using artificial neural network, Noise Control Engineering Journal 2012(3): 329–339.
http://dx.doi.org/10.3397/1.3701010Moore, B. C. J. 1997. An introduction to the psychology of hearing.
4th ed. San Diego, California, London: Academic Press.NeuroDimension. 1995. NeuroSolutions users manual. Gainesvil-
le, Florida: NeuroDimensions Inc.Schulte-Fortkamp, B. 2002. The meaning of annoyance in re-
lation to the quality of acoustic environments, Noise and Health 2002 4(15): 13–18.
Sémidor, C. 2006. Listening to a city with the soundwalk met-hod, Acta Acustica United with Acustica 92(6): 959–964.
a)
b)
Journal of Environmental Engineering and Landscape Management, 2015, 23(3): 163–171 171
Schafer, R. M. 1977. The tuning of the world. Toronto: McClel-land & Stewart.
Yang, M.; Kang, J. 2013. Psychoacoustic evaluation of natural and urban sounds in soundscapes, The Journal of the Acoustical Society of America 131(1): 840–851.
http://dx.doi.org/10.1121/1.4807800Yang, W.; Kang, J. 2005. Soundscape and sound preferences in
urban squares: a case study in Sheffield, Urban Design 10(1): 69–88.
Yu, L. 2009. Soundscape evaluation and ANN modelling in urban open spaces: Dissertation. University of Sheffield.
Yu, L.; Kang, J. 2010. Factors influencing the sound preference in urban open spaces, Applied Acoustics 71(7): 622–633.
http://dx.doi.org/10.1016/j.apacoust.2010.02.005Yu, L.; Kang, J. 2009. Modelling subjective evaluation of
soundscape quality in urban open spaces: an artificial neural network approach, The Journal of the Acoustical Society of America 126(3): 1163–1174.
http://dx.doi.org/10.1121/1.3183377zwicker, E.; Fastl, H. 1999. Psychoacoustics: facts and models. 2nd
ed. Berlin, New York: Springer. http://dx.doi.org/10.1007/978-3-662-09562-1
lei yu is an Associate Professor at the Faculty of Urban Planning and Management, the Shenzhen Graduate School, Harbin Institute of Technology. She obtained her PhD from the Sheffield University. She has more than twenty years urban and architecture design practice. Her research interest is in urban soundscape and green architecture design. She has published over 10 refereed journal papers and more than 30 conference papers.
Jian KanG has been Professor of Acoustics at the University of Sheffield, School of Architecture since 2003. He obtained his PhD from the University of Cambridge. He has published 3 books, over 200 refereed journal papers and book chapters, and over 600 conference papers and technical reports.