microarray technology - expression profiling of mrna and microrna
TRANSCRIPT
5
MicroArray Technology - Expression Profiling of MRNA and MicroRNA in Breast Cancer
Aoife Lowery, Christophe Lemetre, Graham Ball and Michael Kerin 1Department of Surgery, National University of Ireland Galway,
2John Van Geest Cancer Research Centre, School of Science & Technology, Nottingham Trent University, Nottingham
1Ireland 2UK
1. Introduction
Breast cancer is the most common form of cancer among women. In 2009, an estimated
194,280 new cases of breast cancer were diagnosed in the United States; breast cancer was
estimated to account for 27% of all new cancer cases and 15% of cancer-related mortality in
women (Jemal et al, 2009). Similarly, in Europe in 2008, the disease accounted for some 28%
and 17% of new cancer cases and cancer-related mortality in women respectively (Ferlay et
al, 2008). The increasing incidence of breast cancer worldwide will result in an increased
social and economic burden; for this reason there is a pressing need from a health and
economics perspective to develop and provide appropriate, patient specific treatment to
reduce the morbidity and mortality of the disease. Understanding the aetiology, biology and
pathology of breast cancer is hugely important in diagnosis, prognostication and selection of
primary and adjuvant therapy. Breast tumour behaviour and outcome can vary
considerably according to factors such as age of onset, clinical features, histological
characteristics, stage of disease, degree of differentiation, genetic content and molecular
aberrations. It is increasingly recognised that breast cancer is not a single disease but a
continuum of several biologically distinct diseases that differ in their prognosis and
response to therapy (Marchionni et al, 2008; Sorlie et al, 2001). The past twenty years has
seen significant advances in breast cancer management. Targeted therapies such as
hormonal therapy for estrogen receptor (ER) positive breast tumours and trastuzumab for
inhibition of HER2/neu signalling have become an important component of adjuvant
therapy and contributed to improved outcomes (Fisher et al, 2004; Goldhirsch et al, 2007;
Smith et al, 2007). However, our understanding of the molecular basis underlying breast
cancer heterogeneity remains incomplete. It is likely that there are significant differences
between breast cancers that reach far beyond the presence or absence of ER or HER2/neu
amplification. Patients with similar morphology and molecular phenotype based on ER, PR
and HER2/neu receptor status can have different clinical courses and responses to therapy.
There are small ER positive tumours that behave aggressively while some large high grade
ER negative, HER2/neu receptor positive tumours have an indolent course. ER-positive
tumours are typically associated with better clinical outcomes and a good response to
www.intechopen.com

Computational Biology and Applied Bioinformatics
88
hormonal therapies such as tamoxifen (Osborne et al, 1998). However, a subset of these
patients recur and up to 40% develop resistance to hormonal therapy (Clarke et al, 2003).
Furthermore, clinical studies have shown that adding adjuvant chemotherapy to tamoxifen
in the treatment of node negative, ER positive breast cancer improves disease outcome
(Fisher et al, 2004). Indeed, treatment with tamoxifen alone is only associated with a 15%
risk of distant recurrence, indicating that 85% of these patients would do well without, and
could be spared the cytotoxic side-effects of adjuvant chemotherapy. The heterogeneity of outcome and response to adjuvant therapy has driven the discovery of further molecular predictors. Particular attention has focused on those with prognostic significance which may help target cancer treatment to the group of patients who are likely to derive benefit from a particular therapy. There has been a huge interest in defining the gene expression profiles of breast tumours to further understand the aetiology and progression of the disease in order to identify novel prognostic and therapeutic markers. The sequencing of the human genome and the advent of high throughput molecular profiling has facilitated comprehensive analysis of transcriptional variation at the genomic level. This has resulted in an exponential increase in our understanding of breast cancer molecular biology. Gene expression profiling using microarray technology was first introduced in 1995 (Schena et al, 1995). This technology enables the measurement of expression of tens of thousands of mRNA sequences simultaneously and can be used to compare gene expression within a sample or across a number of samples. Microarray technology has been productively applied to breast cancer research, contributing enormously to our understanding of the molecular basis of breast cancer and helping to achieve the goal of individualised breast cancer treatment. However as the use of this technology becomes more widespread, our understanding of the inherent limitations and sources of error increases. The large amount of data produced from such high throughput systems has necessitated the use of complex computational tools for management and analysis of this data; leading to rapid developments in bioinformatics. This chapter provides an overview of current gene expression profiling techniques, their application to breast cancer prognostics and the bioinformatic challenges that must be overcome to generate meaningful results that will be translatable to the clinical setting. A literature search was performed using the PubMed database to identify publications relevant to this review. Citations from these articles were also examined to yield further relevant publications.
2. Microarray technology – principles & technical considerations
2.1 High throughput genomic technology
There are a multitude of high throughput genomic approaches which have been developed to simultaneously measure variation in thousands of DNA sequences, mRNA transcripts, peptides or metabolites:
• DNA microarray measures gene expression
• Microarray comparative genomic hybridisation (CGH) measures genomic gains and losses or identifies differences in copy number for genes involved in pathological states (Oosterlander et al, 2004)
• Single nucleotide polymorphism (SNP) microarray technology (Huang et al, 2001) has been developed to test for genetic aberrations that may predispose an individual to disease development.
www.intechopen.com

MicroArray Technology - Expression Profiling of MRNA and MicroRNA in Breast Cancer
89
• CpG arrays (Yan et al , 2000) can be used to determine whether patterns of specific epigenetic alterations correlate with pathological parameters.
• Protein microarrays (Stoll et al, 2005) consisting of antibodies, proteins, protein fragments, peptides or carbohydrate elements, are used to detect patterns of protein expression in diseased states.
• ChIP-on-chip (Oberley et al, 2004) combines chromatin immunoprecipitation (ChIP) with glass slide microarrays (chip) to detect how regulatory proteins interact with the genome.
All of these approaches offer unique insights into the genetic and molecular basis of disease development and progression. This chapter focuses primarily on gene expression profiling and cDNA microarrays, however many of the issues raised, particularly in relation to bioinformatics are also applicable to the other “-omic” technologies. Gene expression which is a measurement of gene “activity” can be determined by the abundance of its messenger RNA (mRNA) transcripts or by the expression of the protein which it encodes. ER, PR and HER2/neu receptor status are determined in clinical practice using immunohistochemistry (IHC) to quantitate protein expression or fluorescence in situ hybridisation (FISH) to determine copy number. These techniques are semi-quantitative and are optimal when determining the expression of individual or a small number of genes. Microarray technology is capable of simultaneously measuring the expression levels of
thousands of genes in a biological sample at the mRNA level. The abundance of individual
mRNA transcripts in a sample is a reflection of the expression levels of corresponding genes.
When a complementary DNA (cDNA) mixture reverse transcribed from the mRNA is
labelled and hybridised to a microarray, the strength of the signal produced at each address
shows the relative expression levels of the corresponding gene.
cDNA microarrays are miniature platforms containing thousands of DNA sequences which
act as gene specific probes, immobilised on a solid support (nylon, glass, silicon) in a parallel
format. They are reliant on the complementarity of the DNA duplex i.e. reassembly of
strands with base pairing A to T and C to G which occurs with high specificity. There are
microarray platforms available containing bound librarys of oligonucleotides representing
literally all known human genes e.g. Affymetrix GeneChip (Santa Clara, CA), Agilent array
(Santa Clara, CA), Illumina bead array (San Diego, CA). When fluorescence-labelled cDNA
is hybridised to these arrays, expression levels of each gene in the human genome can be
quantified using laser scanning microscopes. These microscopes measure the intensity of the
signal generated by each bound probe; abundant sequences generate strong signals and rare
sequences generate weaker signals. Despite differences in microarray construction and
hybridization methodologies according to manufacturing, microarray-based measurements
of gene expression appear to be reproducible across a range of different platforms when the
same starting material is used, as demonstrated by the MicroArray Quality Control project
(Shi et al, 2006).
2.2 Experimental approach
There are experimental design and quality control issues that must be considered when undertaking a microarray experiment. The experiment should be designed appropriately to answer a specific question and samples must be acquired from either patients or cultured cells which are appropriate to the experimental setup. If the aim of a microarray experiment
www.intechopen.com

Computational Biology and Applied Bioinformatics
90
is to identify differentially expressed genes between two groups of samples i.e. “experiment” and “control”, it is critical that the largest source of variation results from the phenotype under investigation (e.g. patient characteristic or treatment). The risk of confounding factors influencing the results can be minimised by ensuring that the groups of samples being compared are matched in every respect other than the phenotype under investigation. Alternatively, large sample numbers can be used to increase the likelihood that the experimental variable is the only consistent difference between the groups. For a microarray experiment, fresh frozen tissue samples are required which have been snap-frozen in liquid nitrogen or collected in an RNARetain™ or RNA LaterTM solution to preserve the quality of the RNA. Formalin-fixed and paraffin embedded tissue samples are generally unsuitable for microarray studies as the RNA in the sample suffers degradation during tissue processing (Cronin et al, 2004; Masuda et al, 1999, Paik et al, 2005). Due to the omnipresence of ribonucleases and the inherent instability of RNA, it is essential to measure the integrity of RNA after extraction. Only samples of the highest integrity should be considered for reverse transcription to cDNA and hybridisation to the microarray platform (figure 1). Once obtained, intensity readings must be background adjusted and transformed; this data is then normalised and analysed and results are generally interpreted according to biological knowledge. The success of microarray experiments is highly dependent on replication. Technical replication refers to the repeated assaying of the same biological sample to facilitate quality assessment. Even more important is biological replication on larger sample sets. The accuracy of microarray expression measurements must be confirmed using a reliable independent technology, such as real-time quantitative PCR, and validated on a larger set of independent biological samples. It is independent validation studies that determine the strength or clinical relevance of a gene expression profile.
Fig. 1. The steps involved in a cDNA microarray experiment
www.intechopen.com

MicroArray Technology - Expression Profiling of MRNA and MicroRNA in Breast Cancer
91
3. Molecular profiling – unlocking the heterogeneity of breast cancer
Breast cancer researchers were quick to adopt high throughput microarray technology, which is unsurprising considering the opportunity it provides to analyse thousands of genes simultaneously.
3.1 Class discovery
Microarray studies can be used in three different manners;
• class comparison
• class prediction
• class discovery (Simon et al, 2003) All of these approaches have been applied to the study of breast cancer. Class discovery involves analyzing a given set of gene expression profiles with the goal of discovering subgroups that share common features. The early gene expression profiling studies of breast cancer (Perou et al, 2000; Sorlie et al, 2001) were class discovery studies. Researchers used an unsupervised method of analysis, in which tumours were clustered into subgroups by a 496-gene “intrinsic” gene set that reflects differences in gene expression between tumours without using selection criteria. The tumour subtype groupings consist of luminal like subtypes which are predominantly ER and PR positive, basal-like subtypes which are predominantly triple negative for ER, PR and HER2/neu, HER2/neu-like subtypes which have increased expression of the HER2/neu amplicon and a normal-like subtype (Perou et al, 2000). Subsequent studies from the same authors, on a larger cohort of patients with follow-up data showed that the luminal subgroup could be further subdivided into at least two groups, and that these molecular subtypes were actually associated with distinct clinical outcomes (Sorlie et al 2001). These molecular subtypes of breast cancer have been confirmed and added to in subsequent microarray datasets (Hu et al, 2006; Sorlie et al, 2003; Sotiriou et al, 2003). Given the importance of the ER in breast cancer biology, it is not surprising that the most striking molecular differences were identified between the ER-positive (luminal) and ER-negative subtypes. These differences have been repeatedly identified and validated with different technologies and across different platforms (Fan et al, 2006; Farmer et al, 2005; Sorlie et al, 2006). The luminal subgroup has been subdivided into two subgroups of prognostic significance:
• luminal A tumours which have high expression of ER –activated genes, and low expression of proliferation related genes
• luminal B tumours which have higher expression of proliferation related genes and a poorer prognosis than luminal A tumours (Geyer et al, 2009; Paik et al, 2000; Parker et al, 2009; Sorlie et al, 2001, 2003).
The ER negative tumours are even more heterogeneous and comprise the:
• basal-like subgroup which lack ER and HER2/neu expression and feature more frequent overexpression of basal cytokeratins, epidermal growth factor receptor and c-Kit (Nielsen et al, 2004)
• HER2/neu subgroup which overexpress HER2/neu and genes associated with the HER2/neu pathway and/or the HER2/neu amplicon on chromosome 17.
The HER2/neu and basal-like subtypes have in common an aggressive clinical behaviour but appear to be more responsive to neoadjuvant chemotherapy than the luminal subtypes (Carey et al, 2007; Rouzier et al, 2005). Also clustering with the ER negative tumours are the normal-like breast cancers; these are as yet poorly characterised and have been shown to
www.intechopen.com
Computational Biology and Applied Bioinformatics
92
cluster with fibroadenoma and normal breast tissue samples (Peppercorn et al, 2008). It is important at this point to acknowledge the limitations of this molecular taxonomy; intrasubtype heterogeneity has been noted despite the broad similarities defined by these large subtypes (Parker et al, 2009). In particular the basal-like subgroup can be divided into multiple additional subgroups (Kreike et al, 2007; Nielsen et al, 2004). Additionally, although the luminal tumours have been separated into subgroups of prognostic significance, meta-analysis of published expression data has suggested that these luminal tumours actually form a continuum and their separation based on expression of proliferation genes may be subjective (Shak et al, 2006; Wirapati et al, 2008). Furthermore, the clinical significance of the normal-like subtype is yet to be determined; it has been proposed that this subgroup may in fact represent an artefact of sample contamination with a high content of normal breast tissue (Parker et al, 2009; Peppercorn et al, 2008). Due to these limitations and the subjective nature of how the molecular subtypes were identified, the translation of this taxonomy to the clinical setting as a definitive classification has been difficult (Pustzai et al, 2006). The development of a prognostic test based on the intrinsic subtypes has not been feasible to date. However, the seminal work by Sorlie and Perou (Perou et al, 2000; Sorlie et al, 2001) recognized for the first time the scale of biological heterogeneity within breast cancer and led to a paradigm shift in the way breast cancer is perceived.
3.2 Class comparison
A number of investigators undertaking microarray expression profiling studies in breast
cancer have since adopted class comparison studies. These studies employ supervised
analysis approaches to determine gene expression differences between samples which
already have a predefined classification. The “null hypothesis” is that a given gene on the
array is not differentially expressed between the two conditions or classes under study. The
alternative hypothesis is that the expression level of that gene is different between the two
conditions. An example of this approach is the microarray experiments that have been
undertaken to define differences between invasive ductal and invasive lobular carcinomas
(Korkola, 2003; Weigelt, 2009; Zhao, 2004), between hereditary and sporadic breast cancer
(Berns, 2001; Hedenfalk, 2001) and between different disease stages of breast cancer
(Pedraza, 2010).
3.3 Class prediction
Perhaps the most clinically relevant use of this technology, however, are the microarray
class prediction studies which have been designed to answer specific questions regarding
gene expression in relation to clinical outcome and response to treatment. The latter
approach attempts to identify predictive markers, as opposed to the prognostic markers
which were identified in the “intrinsic gene-set”. There is frequently some degree of
confusion regarding the terms of “prognostic” and “predictive biomarkers”. This is partially
due to the fact that many prognostic markers also predict response to adjuvant therapy. This
is particularly true in breast cancer where, for example, the ER is prognostic, and predictive
of response to hormonal therapy, but also predictive of a poorer response to chemotherapy
(Carey 2007; Kim, 2009; Rouzier 2005,).
One of the first microarray studies designed to identify a gene-set predictive of prognosis in
breast cancer was that undertaken by van’t Veer and colleagues (van’t Veer et al, 2002). They
www.intechopen.com

MicroArray Technology - Expression Profiling of MRNA and MicroRNA in Breast Cancer
93
developed a 70-gene set capable of predicting the development of metastatic disease in a
group of 98 patients made up of 34 who had developed metastasis within 5-years of follow-
up, 40 patients who remained disease-free at 5-years, 18 patients with a BRCA-1 mutation,
and 2 patients with a BRCA-2 mutation. The 70-gene signature was subsequently validated
in a set of 295 breast cancers, including the group used to train the model, and shown to be
more accurate than standard histopathological parameters at predicting outcome in these
breast cancer patients (van de Vijver et al, 2002). The signature includes many genes
involved in proliferation, and genes associated with invasion, metastasis, stromal integrity
and angiogenesis are also represented. This 70-gene prognostic signature classifies patients
based on correlation with a “good-prognosis” gene expression profile; a coefficient of
greater than 0.4 is classified as good prognosis. The signature was initially criticised for the
inclusion of some patients in both the discovery and validation stages (van de Vijver et al,
2002). However, it has been subsequently validated in multiple cohorts of node-positive and
node-negative patients and has been shown to outperform traditional clinical and
histological parameters at predicting prognosis (Buyse et al, 2006; Mook et al, 2009).
3.3.1 Mammaprint assay
The 70-gene signature was approved by the FDA to become the MammaPrint Assay (Agendia BV, Amsterdam, The Netherlands); the first fully commercialized microarray based multigene assay for breast cancer. This prognostic tool is now available and can be offered to women under the age of 61 years with lymph node negative breast cancer. The MammaPrint test results are dichotomous, indicating either a high or low risk of disease recurrence, and the test performs best at the extremes of the spectrum of disease outcome i.e. identifying patients with a very good or a very poor prognosis. The MammaPrint signature is a purely prognostic tool, and its role as a predictive marker for response to therapy was not examined at the time it was developed. Its’ clinical utility is currently being assessed, however, in a prospective clinical trial called microarray in node negative and 1 to 3 positive lymph node disease may avoid chemotherapy (MINDACT) trial (Cardoso et al, 2008). The trial aims to recruit 6000 patients, all of whom will be assessed by standard clinicopathologic prognostic factors and by the MammaPrint assay. In cases where there is concordance between the standard prognostic factors and the molecular assay, patients will be treated accordingly with adjuvant chemotherapy with or without endocrine therapy for poor prognosis patients. If both assays predict a good prognosis, no adjuvant chemotherapy is given, and adjuvant hormonal therapy is given alone where indicated. In cases where there is disconcordance between the standard clinicopathological prognostic factors and the MammaPrint assays’ prediction of prognosis the patients are randomised to receive adjuvant systemic therapy based on either the clinicopathological or the MammaPrint prognostic prediction results. The expected outcome is that there will be a reduction of 10-15% in the number of patients requiring adjuvant chemotherapy based on the MammaPrint assay prediction. It is envisaged that this trial will answer the questions of what patients can be spared chemotherapy and still have a good prognosis, thus accelerating progress towards the goal of more tailored therapy for breast cancer patients.
3.3.2 Oncotype Dx assay
While MammaPrint was developed as a prognostic assay, the other most widely established commercialized multigene assay Oncotype Dx was developed in a more context specific
www.intechopen.com
Computational Biology and Applied Bioinformatics
94
manner as a prognostic and predictive test to determine the benefit of chemotherapy in women with node-negative, ER-positive breast cancer treated with tamoxifen (Paik et al, 2004). The authors used published microarray datasets, including those that identified the intrinsic breast cancer subtypes and the 70-gene prognostic signature identified by the Netherlands group to develop real time quantitative polymerase chain reaction (RQ-PCR) tests for 250 genes. Research undertaken by the National Surgical Adjuvant Breast and Bowel Project (NSABP) B14 protocol using three independent clinical series, resulted in the development of an optimised 21-gene predictive assay (Paik et al, 2004). The assay has been commercialised as Oncotype® DX by Genomic Health Inc1 and consists of a panel of 16 discriminator genes and 5 endogenous control genes which are detected by RQ-PCR using formalin-fixed paraffin embedded (FFPE) sections from standard histopathology blocks. The ability to use FFPE tissue facilitates clinical translation and has allowed retrospective analysis of archived tissue in large cohorts with appropriate follow up data. The assay has been used to generate Recurrence Scores (RS) by differentially weighting the constituent genes which are involved in:
• proliferation (MKI67, STK15, BIRC5/Survivin, CCNB1, MYBL2)
• estrogen response (ER, PGR, SCUBE2)
• HER2/neu amplicon (HER2/neu/ERBB2, GRB7),
• invasion (MMP11, CTSL2)
• apoptosis (BCL2, BAG1)
• drug metabolism (GSTM1)
• macrophage response (CD68). The assay was evaluated in 651 ER positive lymph node negative breast cancer patients who were treated with either tamoxifen or tamoxifen and chemotherapy as part of the NSABP B20 protocol (Paik et al, 2006). It was found that patients with high recurrence scores had a large benefit from chemotherapy, with a 27.6% mean decreased in 10 year distance recurrence rates, while those with a low recurrence score derived virtually no benefit from chemotherapy. The RS generated by the expression of the 21 genes is a continuous variable ranging from 1-100, but has been divided into three groups for clinical decision making; low (<18), intermediate (18-31) and high (>31). It has been shown in a number of independent datasets that ER positive breast cancer patients with a low RS have a low risk of recurrence and derive little benefit from chemotherapy. Conversely, ER positive patients with high RS have a high risk of recurrence but do benefit from chemotherapy (Goldstein, 2006; Habel, 2006; Mina, 2007; Paik, 2006). The ability of the 21-gene signature to so accurately predict prognosis has led to the inclusion of the Oncotype Dx assay in American Society of Clinical Oncology (ASCO) guidelines on the use of tumour markers in breast cancer as a predictor of recurrence in ER-positive, node-negative patients. However, despite the accurate performance of the assay for high and low risk patients, there remains uncertainty regarding the management of patients with intermediate RS (18-31). This issue is being addressed in a prospective randomized trial assigning individual options for treatment (TAILORx) sponsored by the National Cancer Institute (Lo et al, 2007). This multicentre trial aims to recruit 10,000 patients with ER –positive, lymph node negative breast cancer who are assigned to one of three groups based on their RS; low<11, intermediate 11-25 and high >25. Notably, the RS criteria have been changed for the TAILORx trial, with the intermediate
1http://www.genomichealth.com/OncotypeDX
www.intechopen.com

MicroArray Technology - Expression Profiling of MRNA and MicroRNA in Breast Cancer
95
range being changed from RS 18-30 to RS 11-25 to avoid exluding patients who may derive a small benefit from chemotherapy (Sparano et al, 2006). Patients in the intermediate RS group are randomly assigned to receive either adjuvant chemotherapy and hormonal therapy, or hormonal therapy alone. The primary aim of the trial is to determine if ER positive patients with an intermediate RS benefit from adjuvant chemotherapy or not. The MammaPrint and Oncotype Dx gene signatures both predict breast cancer behaviour, however there are fundamental differences between them (outlined in table 1). This chapter has focused on these signatures as they were the first to be developed, have been extensively validated, and are commercially available. However it is important to note that there are other multi-gene based assays that have been developed and commercialized but are not discussed in detail as they are not yet as widely utilized (Loi et al, 2007; Ma et al, 2008; Ross et al, 2008; Wang et al, 2005 ).
Assay MammaPrint Oncotype Dx
Manufacturer Agendia BV Genomic Health, Inc.
Development of Signature From candidate set of 25,000
genes in 98 patients From candidate set of 250
genes in 447 patients
Gene signature 70 genes 21 genes
Patient cohort Stage I & II breast cancer
Lymph node negative <55yrs
Stage I & II breast cancer Lymph node negative
ER positive Receiving Tamoxifen
Platform cDNA Microarray RQ-PCR
Sample requirements Fresh frozen tissue or
collected in RNA preservative
FFPE tissue
Outcome 5-year distant relapse free
survival 10-year distant relapse free
survival
Test Results
Dichotomous correlation coefficient
>4.0 = good prognosis <4.0 = poor prognosis
Continuous recurrence score <18 = low risk
18-31= intermediate risk >31 = high risk
Predictive No; purely prognostic Yes
Prospective Trial MINDACT TAILORx
FDA approved Yes No
ASCO Guidelines No Yes
Table 1. Comparison of commercially available prognostic assays MammaPrint and Oncotype Dx
4. Microarray data integration
4.1 Setting standards for microarray experiments
It must be acknowledged that despite the multitude of breast cancer prognostic signatures available, the overlap between the gene lists is minimal (Ahmed, 2005; Brenton, 2005; Fan et
www.intechopen.com

Computational Biology and Applied Bioinformatics
96
al, 2006; Michiels et al, 2005). This lack of concordance has called into question the applicability of microarray analysis across the entire breast cancer population. In order to facilitate external validation of signatures and meta-analysis in an attempt to devise more robust signatures, it is important that published microarray data be publicly accessible to the scientific community. In 2001 the Microarray Gene Expression Data Society proposed experimental annotation standards known as minimum information about a microarray experiment (MIAME), stating that raw data supporting published studies should be made publicly available in one of a number of online repositories (table 2), these standards are now upheld by leading scientific journals and facilitating in depth interrogation of multiple datasets simultaneously.
Public Database for Microarray
Data URL Organization Description
Array Express http://www.ebi.ac.uk/arrayexpress/ European Bioinformatics Institute (EBI)
Public data deposition and queries
GEO Gene Expression Omnibus
http://www.ncbi.nlm.nih.gov/geo/ National Centre for Biotechnology Information (NCBI)
Public data deposition and queries
CIBEX Center for Information Biology Gene Expression Database
http://cibex.nig.ac.jp/index.jsp National Institute of Genetics
Public data deposition and queries
ONCOMINE Cancer Profiling Database
http://www.oncomine.org/main/index.jsp
University of Michigan
Public queries
PUMAdb Princeton University MicroArray database
http://puma.princeton.edu/ Princeton University
Public queries
SMD Stanford Microarray Database
http://genome-www5.stanford.edu/
Stanford Univeristy Public queries
UNC Chapel Hill Microarray database
https://genome.unc.edu/ University of North Carolina at Chapel Hill
Public queries
Table 2. List of Databases with Publicly Available Microarray Data
4.2 Gene ontology
The volume of data generated by high throughput techniques such as microarray poses the challenge of how to integrate the genetic information obtained from large scale experiments with information about specific biological processes, and how genetic profiles relate to functional pathways. The development of the Gene Ontology (GO) as a resource for
www.intechopen.com

MicroArray Technology - Expression Profiling of MRNA and MicroRNA in Breast Cancer
97
experimentalists and bioinformaticians has contributed significantly to overcoming this challenge (Ashburner et al, 2000). The GO Consortium was established with the aim of producing a structured, precisely defined, common, controlled vocabulary for describing the roles of genes and gene products in any organism. Initially a collaboration between three organism databases: Flybase (The Flybase Consortium, 1999), Mouse Genome Informatics (Blake et al, 2000) and the Saccharomyces Genome Database (Ball et al, 2000), the GO Consortium has grown to include several of the world’s major repositories for plant, animal and microbial genomes. The Gene Ontology provides a structure that organizes genes into biologically related groups according to three criteria. Genes and gene products are classified according to:
• Molecular Function: biochemical activity of gene products at the molecular level
• Biological Process: biological function of a gene product
• Cellular Component: location in the cell or extracellular environment where molecular events occur
Every gene is described by a finite, uniform vocabulary. Each GO entry is defined by a
numeric ID in the format GO#######. These GO identifiers are fixed to the textual
definition of the term, which remains constant. A GO annotation is the specific association
between a GO identifier and a gene or protein and has a distinct evidence source that
supports the association. A gene product can take part in one or more biological process and
perform one or more molecular functions. Thus, a well characterized gene product can be
annotated to multiple GO terms in the three GO categories outlined above. GO terms are
related to each-other such that each term is placed in the context of all of the other terms in a
node-directed acyclic graph (DAC). The relationships used by the GO are: “is_a”, “part_of”,
“regulates”, “positively_regulates”, “negatively_regulates” and “disjoint_from”. Each term
in the DAC may have one or more parent terms and possibly one or more child nodes, and
the DAC gives a graphical representation of how GO terms relate to each other in a
hierarchical manner.
The development of Gene Ontology has facilitated analysis of microarray gene sets in the
context of the molecular functions and pathways in which they are involved (Blake &
Harris, 2002). GO-term analysis can be used to determine whether genetic “hits” show
enrichment for a particular group of biological processes, functions or cellular
compartments. One approach uses statistical analysis to determine whether a particular GO
is over or under-represented in the list of differentially expressed genes from a microarray
experiment. The statistical tests used for such analysis include hypergeometric, binomial or
Chi-square tests (Khatri et al, 2005).
An alternative approach known as “gene-set testing” has been described which involves
beginning with a known set of genes and testing whether this set as a whole is differentially
expressed in a microarray experiment (Lamb et al, 2003; Mootha et al, 2003). The results of
such analyses inform hypotheses regarding the biological significance of microarray
analyses.
Several tools have been developed to facilitate analysis of microarray data using GO, and a
list of these can be found at: http://www.geneontology.org/GO.tools.microarray.shtml
Analysing microarray datasets in combination with biological knowledge provided by GO
makes microarray data more accessible to the molecular biologist and can be a valuable
strategy for the selection of biomarkers and the determination of drug treatment effect in
breast cancer (Arciero et al, 2003; Cunliffe et al, 2003).
www.intechopen.com

Computational Biology and Applied Bioinformatics
98
4.3 Microarray meta-analysis – combining datasets
Meta-analyses have confirmed that different prognostic signatures identify similar
biological subgroups of breast cancer patients (Fan et al, 2006) and have also shown that the
designation of tumours to a “good prognosis”/”low risk” group or a “poor
prognosis”/”high risk” group is largely dependent on the expression patterns of
proliferative genes. In fact, some of these signatures have been shown to have improved
performance when only the proliferative genes are used (Wirapati, 2008). Metanalyses of the
signatures have also proposed that the prognostic ability of the signatures is optimal in the
ER positive and HER2-negative subset of breast tumours (Desmedt, 2008; Wirapati, 2008),
the prognosis of this group of tumours being governed by proliferative activity.
Despite obvious clinical application, none of these prognostic assays are perfect, and they all
carry a false classification rate. The precise clinical value for these gene expression profiles
remains to be established by the MINDACT and TAILORx trials. In the interim the
performance of these assays is likely to be optimised by combining them with data from
traditional clinicopathological features, an approach which has been shown to increase
prognostic power (Sun et al, 2007).
Microarray technology has undoubtedly enhanced our understanding of the molecular
mechanisms underlying breast carcinogenesis; profiling studies have provided a myriad of
candidate genes that may be implicated in the cancer process and are potentially useful as
prognostic and predictive biomarkers or as therapeutic targets. However, as yet there is
little knowledge regarding the precise regulation of these genes and receptors, and further
molecular categories are likely to exist in addition to and within the molecular subtypes
already delineated. Accumulating data reveal the incredible and somewhat foreboding
complexity and variety of breast cancers and while mRNA expression profiling studies are
ongoing, a new player in breast cancer biology has come to the fore in recent years; a
recently discovered RNA species termed MiRNA (miRNA) which many scientists believe
may represent a crucial link in the cancer biology picture.
5. MicroRNA - a recently discovered layer of molecular complexity
It has been proposed that the discovery of miRNAs as regulators of gene expression represents a paradigm changing event in biology and medicine. This discovery was made in 1993 by researchers at the Ambros laboratory in Dartmouth Medical School, USA at which time it was thought to be a biological entity specific to the nematode C. Elegans (Lee et al, 1993). In the years following this discovery, hundreds of miRNAs were identified in animals and plants. However it is only in the past 5 years that the field of miRNA research has really exploded with the realisation that miRNAs are critical to the development of multicellular organisms and the basic functions of cells (Bartel, 2004). MiRNAs are fundamental to genetic regulation, and their aberrant expression and function have been linked to numerous diseases and disorders (Bartel, 2004; Esquela-Kerscher & Slack, 2006). Importantly, miRNA have been critically implicated in the pathogenesis of most human cancers, thus uncovering an entirely new repertoire of molecular factors upstream of gene expression.
5.1 MicroRNA - novel cancer biomarkers
The first discovery of a link between miRNAs and malignancy was the identification of a translocation-induced deletion at chromosome 13q14.3 in B-cell Chronic Lymphocytic
www.intechopen.com

MicroArray Technology - Expression Profiling of MRNA and MicroRNA in Breast Cancer
99
Leukaemia (Calin et al, 2002). Loss of miR-15a and miR-16-1 from this locus results in increased expression of the anti-apoptotic gene BCL2. Intensifying research in this field, using a range of techniques including miRNA cloning, quantitative PCR, microarrays and bead-based flow cytometric miRNA expression profiling has resulted in the identification and confirmation of abnormal miRNA expression in a number of human malignancies including breast cancer (Heneghan et al, 2010; Lowery et al, 2007). MiRNA expression has been observed to be upregulated or downregulated in tumours compared with normal tissue, supporting their dual role in carcinogenesis as either oncogenic miRNAs or tumour suppressors respectively (Lu et al, 2005). The ability to profile miRNA expression in human tumours has led to remarkable insight and knowledge regarding the developmental lineage and differentiation states of tumours. It has been shown that distinct patterns of miRNA expression are observed within a single developmental lineage, which reflect mechanisms of transformation, and support the idea that miRNA expression patterns encode the developmental history of human cancers. In contrast to mRNA profiles it is possible also to successfully classify poorly differentiated tumours using miRNA expression profiles (Volinia et al, 2006). In this manner, miRNA expression could potentially be used to accurately diagnose poorly differentiated tissue samples of uncertain histological origin, e.g. metastasis with an unknown primary tumour, thus facilitating treatment planning. MicroRNAs exhibit unique, inherent characteristics which make them particularly attractive
for biomarker development. They are known to be dysregulated in cancer, with
pathognomonic or tissue specific expression profiles and even a modest number of miRNAs
is sufficient to classify human tumours, which is in contrast to the relatively large mRNA
signatures generated by microarray studies (Lu et al, 2005). Importantly, miRNA are
remarkably stable molecules. They undergo very little degradation even after processing
such as formalin fixation and remain largely intact in FFPE clinical tissues, lending
themselves well to the study of large archival cohorts with appropriate follow-up data (Li et
al, 2007; Xi et al, 2007). The exceptional stability of miRNAs in visceral tissue has stimulated
investigation into their possible preservation in the circulation and other bodily fluids
(urine, saliva etc.). The hypothesis is that circulating miRNAs, if detectable and quantifiable
would be the ideal biomarker accessible by minimally invasive approaches such as simple
phlebotomy (Cortez et al, 2009; Gilad et al, 2008; Mitchell et al, 2008).
5.2 MicroRNA microarray
The unique size and structure of miRNAs has necessitated the modification of existing
laboratory techniques, to facilitate their analysis. Due to the requirement for high quality
large RNA molecules, primarily for gene expression profiling, many laboratories adopted
column-based approaches to selectively isolate large RNA molecules, discarding small RNA
fractions which were believed to contain degradation products. Modifications to capture
miRNA have been made to existing protocols to facilitate analysis of the miRNA fraction.
Microarray technology has also been modified to facilitate miRNA expression profiling.
Labelling and probe design were initially problematic due to the small size of miRNA
molecules. Reduced specificity was also an issue due to the potential of pre-miRNA and pri-
miRNAs to produce signals in addition to active mature miRNA. Castoldi et al described a
novel miRNA microarray platform using locked nucleic acid (LNA)-modified capture
probes (Castoldi et al, 2006). LNA modification improved probe thermostability and
increased specificity, enabling miRNAs with single nucleotide differences to be
www.intechopen.com

Computational Biology and Applied Bioinformatics
100
discriminated - an important consideration as sequence-related family members may be
involved in different physiological functions (Abbott et al, 2005). An alternative high
throughput miRNA profiling technique is the bead-based flow cytometric approach
developed by Lu et al.; individual polystyrene beads coupled to miRNA complementary
probes are marked with fluorescent tags (Lu et al, 2005). After hybridization with size-
fractioned RNAs and streptavidin-phycoerythrin staining, the beads are analysed using a
flow-cytometer to measure bead colour and pycoerythrin, denoting miRNA identity and
abundance respectively. This method offered high specificity for closely related miRNAs
because hybridization occurs in solution. The high-throughput capability of array-based
platforms make them an attractive option for miRNA studies compared to lower
throughput techniques such as northern blotting and cloning; which remain essential for the
validation of microarray data.
5.2.1 MicroRNA microarray - application to breast cancer
Microarray analysis of miRNA expression in breast cancer is in its’ infancy relative to
expression profiling of mRNA. However, there is increasing evidence to support the
potential for miRNAs as class predictors in breast cancer. The seminal report of aberrant
miRNA expression in breast cancer by Iorio et al. in 2005 identified 29 miRNAs that were
differentially expressed in breast cancer tissue compared to normal, a subset of which could
correctly discriminate between tumour and normal with 100% accuracy (Iorio et al, 2005).
Among the leading miRNAs differentially expressed; miR-10b, miR-125b and mR-145 were
downregulated whilst miR-21 and miR-155 were consistently over-expressed in breast
tumours. In addition, miRNA expression correlated with biopathological features such as
ER and PR expression (miR-30) and tumour stage (miR-213 and miR-203). Mattie et al.
subsequently identified unique sets of miRNAs associated with breast tumors defined by
their HER2/neu or ER/PR status (Mattie et al, 2006). We have described 3 miRNA
signatures predictive of ER, PR and Her2/neu receptor status, respectively, which were
identified by applying artificial neural network analysis to miRNA microarray expression
data (Lowery et al, 2009). Blenkiron et al used an integrated approach of both miRNA and
mRNA microarray expression profiling to classify tumours according to “intrinsic subtype”.
This approach identified a number of miRNAs that are differentially expressed according to
intrinsic breast cancer subtype and associated with clinicopathological factors including ER
status and tumour grade. Importantly, there was overlap between the differentially
expressed miRNAs identified in these studies.
There has been interest in assessing the prognostic value of miRNAs, and expression studies in this regard have focused on detecting differences in miRNA expression between primary breast tumours and metastatic lymph nodes. This approach has identified numerous miRNA that are dysregulated in primary breast tumours compared to metastatic lymph nodes (Baffa et al 2009; Huang et al, 2008). MiRNA have also been identified that are differentially expressed in patients who had a “poor prognosis” or a short time to development of distant metastasis (Foekens et al, 2008); miR-516-3p, miR-128a, miR-210, and miR-7 were linked to aggressiveness of lymph node-negative, ER-positive human breast cancer. The potential predictive value of miRNA is also under investigation. Preclinical studies have reported associations between miRNA expression and sensitivity to adjuvant breast cancer therapy including chemotherapy, hormonal therapy and HER2/neu targeted therapy (Ma
www.intechopen.com

MicroArray Technology - Expression Profiling of MRNA and MicroRNA in Breast Cancer
101
et al, 2010; Tessel et al, 2010; Wang et al, 2010), prompting analysis of tumour response in clinical samples. Rodriguez-Gonzalez et al attempted to identify miRNAs related to response to tamoxifen therapy by exploiting the Foekens dataset (Foekens, 2008) which comprised miRNA expression levels of 249 miRNAs in 38 ER positive breast cancer patients. Fifteen of these patients were hormone naive and experienced relapse, which was treated with tamoxifen. Ten patients responded and five did not, progressing within 6 months. Five miRNAs (miR-4221, miR-30a-3p, miR-187, miR-30c and miR-182) were the most differentially expressed between patients who benefitted from tamoxifen and those who failed therapy. The predictive value for these miRNAs was further assessed in 246 ER positive primary tumours of hormone naive breast cancer patients who received tamoxifen as monotherapy for metastatic disease. MiR-30a-3p, miR-30c and miR-182 were significantly associated with response to tamoxifen, but only miR-30c remained an independent predictor on multivariate analysis (Rodriguez-Gonzalez, 2010). Microarray-based expression profiling has also been used to identify circulating miRNAs which are differentially expressed in breast cancer patients and matched healthy controls. Zhao et al profiled 1145 miRNAs in the plasma of 20 breast cancer patients and 20 controls, identifying 26 miRNAs with at least two-fold differential expression which reasonably separated the 20 cases from the 20 controls (Zhao et al, 2010). This is the first example of genome-wide miRNA expression profiling in the circulation of breast cancer patients and indicates potential for development of a signature of circulating miRNAs that may function as a diagnostic biomarker of breast cancer. At present diagnostic, prognostic and predictive miRNA signatures and markers remain hypothesis generating. They require validation in larger, independent clinical cohorts prior to any consideration for clinical application. Furthermore as additional short non-coding RNAs are continuously identified through biomarker discovery programmes, the available profiling technologies must adapt their platforms to incorporate newer potentially relevant targets. MicroRNAs possess the additional attraction of potential for development as therapeutic targets due to their ability to regulate gene expression. It is likely that future microarray studies will adopt and integrated approach of miRNA and mRNA expression analysis in an attempt to decipher regulatory pathways in addition to expression patterns.
6. Limitations of microarray technology & bioinformatic challenges
In addition to the great promises and opportunities held by microarray technologies, several issues need to be borne in mind and appropriately addressed in order to perform reliable and non-questionable experiments. As a result, several steps need to be addressed in order to identify and validate reliable biomarkers in the scope of potential future clinical application. This is one of the reasons why, despite the promises of using powerful high-throughput technologies as such as microarray, only very few useful biomarkers have been identified so far and/or have been translated to useful clinical assay or companion diagnostics (Mammaprint®, Oncotype DX®). There still remains a lack of clinically relevant biomarkers (Rifai et al, 2006). Amongst the limitations and pitfalls around the technology and the use of microarrays, some of the most important are the reported lack of reproducibility, as well as the massive amount of data generated, often extremely noisy and with an increasing complexity. As for example, in the recent Affymetrix GeneChip 1.0 ST microarray platform (designed to target all known and predicted exons in human, mouse and rat genomes), where there is approximately 1.2 million exon clusters corresponding to
www.intechopen.com
Computational Biology and Applied Bioinformatics
102
over 1.4 million probesets (Lancashire et al, 2009). As a result, it appears clearly that extracting any relevant key component from such datasets requires robust mathematical and/or statistical models running on efficient hardware to perform the appropriate analyses. With this in mind, it is clear that the identification of new biomarkers still requires a
concerted, multidisciplinary effort. It requires the expertise of the biologist or pathologist, to
extract the samples, the scientist to perform the analysis on the platform and then the
bioinformatician/biostatistician to analyse and interpret the output. The data-mining
required to cope with these types of data needs careful consideration and specific
computational tools, and as such remains a major challenge in bioinformatics.
6.1 Problems with the analysis of microarray data 6.1.1 Dimensionality and false discovery
The statistical analysis of mRNA or miRNA array data poses a number of challenges. This
type of data is of extremely high dimensionality i.e. has a large number of variables. Each of
these variables represents the relative expression of a mRNA or miRNA in a sample. Each of
these components contain noise, are non-linear may not follow a normal distribution
through a population and may be strongly correlated with other probes in the profile. These
characteristics mean that the data may violate many of the assumptions of conventional
statistical techniques, particularly with parametric tests.
The dimensionality of the data poses a significant problem, and remains as one of the most
critical when analysing microarray data. When one analyses this type of data, one has to
consider what is referred to as the curse of dimensionality, firstly described by Bellman in 1961
as the “exponential growth of the search space as a function of dimensionality” (Bellman, 1961;
Bishop, 1995). This occurs in highly dimensional systems where the number of dimensions
masks the true importance of an individual single dimension (variable). It is particularly
true in a microarray experiment when the number of probes representing the number of
miRNA/mRNA studied far exceeds the number of available samples. So there is the
potential for a probe that is in reality of high importance to be missed when considered with
a large number of other probes. This problem is overcome by breaking down the analysis
into single or small groups of variables and repeating the analysis rather than considering
the whole profile in one single analysis. Other methods consists of using pre-processing
methods and feature extraction algorithms in order to only analyse a subset of the data
supposed to hold the most relevant features (Bishop, 1995), as determined by the pre-
processing steps.
High dimensionality also creates problems due to false discovery. The false discovery rate
(FDR) introduced by Benjamini and Hochberg (Benjamini and Hochberg, 1995) is a measure
of the number of features incorrectly identified as “differential” and various approaches
have been suggested to accurately control the FDR. In this case if one has a high number of
dimensions and analyses each singly (as above) a proportion can appear to be of high
importance due to random chance considering the distribution, even when they are not. To
overcome this one has to examine a rank order of importance and when testing for
significance one has to correct the threshold for significance by dividing it by the number of
dimensions. So for example when analysing the significance of single probes from a profile
with 4,000 probes in it the threshold becomes P < 0.05 divided by 4,000 i.e. P < 0.0000125.
www.intechopen.com

MicroArray Technology - Expression Profiling of MRNA and MicroRNA in Breast Cancer
103
6.1.2 Quality and noise
Noise also poses a problem in the analysis of mRNA or miRNA data. The inherent technical and biological variability necessarily induces noise within the data, eventually leading to biased results. The noise may lead to misinterpretation of sample groups that may actually have no biological relevance. As a consequence extreme care needs to be taken to address the problem of noise. Noise may be random where it is applied to all parts of the miRNA equally or systematic where particular probes inherently have more noise than others because of the nature of the component miRNA or genomic code that they represent. It is now widely acknowledged that the reported high level of noise found in microarray
data is the most critical pull-back of microarray-based studies, as it is pointed by the MAQC
Consortium (Shi et al, 2006; Klebanov and Yakovlev, 2007).
6.1.3 Complexity and non-normality
Because of the complex nature of the profile a particular mRNA or miRNA may be non-normally distributed through a population. Such non-normality will immediately invalidate any statistical test that uses parametric statistics i.e. depends on the assumption of a normal distribution. Invalidated tests would include ANOVA and t-test. To overcome this, the data would have to be transformed mathematically to follow a normal distribution or an alternative non parametric test would have to be employed. Examples of non-parametric tests include Kruskal-Wallis and Mann Whitney U which are ANOVA and unpaired T-Test alternatives respectively. Generally non-parametric tests lack power compared to their parametric alternatives and this may prove to be a problem in high dimensional space due to the reasons described previously.
6.1.4 Reproducibility
Reproducibility has a marked effect on the accuracy of any analysis conducted. Furthermore
reproducibility has a profound effect on the impact of other issues such as dimensionality
and false detection. Robust scientific procedures requires that the results have to be
reproducible in order to reduce the within sample variability, the variability between
sample runs and the variability across multiple reading instruments. Aspects of variability
can be addressed using technical and experimental replicates. The averaging of samples
profiles can be used to increase the confidence in the profiles for comparison (Lancashire et
al., 2009). Technical replicates provide information on the variability associated with
instrumental variability whilst experimental (or biological) replicates give a measure of the
natural sample to sample variation. Problems in data analysis occur when the technical
variability is high. In this situation the problem in part can be resolved by increasing the
number of replicates. If however the technical variation is higher than the biological
variation then the sample cannot be analysed.
6.1.5 Auto-correlation or co-correlation
Auto correlation exists when two components within a system are strongly linearly correlated with one another. In any complicated system there are likely to be a number of components that are auto correlated. This is especially true in array profiling of biological samples. Firstly due to biological processes one protein in a set of samples is likely to interact or correlate with another through a population.
www.intechopen.com

Computational Biology and Applied Bioinformatics
104
Auto correlation becomes a problem when using linear based regression approaches. This is because one of the assumptions of regression using multiple components is that the components are not auto correlated. If intensity for multiple miRNA probes are to be added into a regression to develop a classifier these components should not be auto correlated. Auto correlation can be tested for using the Durbin Watson test.
6.1.6 Generality
The whole purpose of biomarker (or set of biomarkers) identification, using high-throughput technologies or any other, is to provide the clinicians with an accurate model in order to assess a particular aspect. However, a model is only as good as its ability to generalize to unseen real world data. A model only able to explain the population on which it was developed would be purely useless for any application. As a result, if one is to develop classifiers from mRNA or miRNA array data the features
identified should be generalised. That is they will predict for new cases in the general
population of cases. When analysing high dimensional data there is an increased risk of over
fitting, particularly when the analysis methods imply supervised training on a subset of the
population. So for example, when a large number of mRNA or miRNA are analysed there is
the potential for false detection to arise. If a random element identified through false
detection is included as a component of a classifier (model) then the generality of that
classifier will be reduce; i.e. it is not a feature that relates to the broader population but is a
feature specific to the primary set of data used to develop the classifier. Standards of
validation required to determine generality have been defined by Michiels et al, 2007. Generality of classifiers can be increased by the application of bootstrapping or cross validation approaches. Some algorithms and approaches, that usually involve supervised training, suffer from
over-fitting (sometimes called memorisation). This is a process where a classifier is
developed for a primary dataset but models the noise within the data as well as the relevant
features. This means that the classifier will not accurately classify for new cases i.e. it does
not represent a general solution to the problem which is applicable to all cases. This is
analogous, for example, to one developing a classifier that predicts well the risk of
metastasis for breast cancer patients from Nottingham but will not predict well for a set of
cases from Denmark. Over fitted classifiers seldom represent the biology of the system being
investigated and the features identified are often falsely detected.
One of the most common solutions to avoid over-fitting is to apply a Cross Validation
technique in combination with the supervised training. Random sample cross validation is a
process of mixing data. Firstly the data are divided into two or three parts (figure 2); the first
part is used to develop the classifier and the second or second and third parts are used to
test the classifier. These parts are sometimes termed training, test and validation data sets
respectively. In certain classifiers such as Artificial Neural Network based classifiers the
second blind set is used for optimisation and to prevent over fitting. In random sample cross
validation the random selection and training process is repeated a number of times to create
a number of models each looking at the global dataset in a number of different ways (figure
2). Often the mean performance of these models is considered.
Leave one out cross validation is an approach also used to validate findings. In this case one sample is left out of the analysis. Once training is complete the sample left out is tested. This process is repeated a number of times to determine the ability of a classifier to predict
www.intechopen.com

MicroArray Technology - Expression Profiling of MRNA and MicroRNA in Breast Cancer
105
unseen cases. This approach of random sample cross validation drives the classifier solution to a generalised one by stopping the classifier from training too much on a seen dataset and stopping the training earlier based on a blind dataset.
7. Methods used to analyse microarray data and their limitations
With the advent of cutting edge new technologies such as microarrays, the analysis tools for the data produced need to be appropriately applied. Although expression arrays have brought high hopes and expectations, they have brought tremendous challenges with them. They have been proven to suffer from different limitations as previously discussed. However, innovative computational analysis solutions have been developed and have been proven efficient and successful at identifying markers of interest regarding particular questions. This section presents some of the most common methods employed to overcome the limitations discuss above, and to analyse expression array data.
7.1 Application of ordination techniques
If we are to utilise the mRNA or miRNA profile we have to identify robust features despite its high dimensionality that are statistically valid for the general population not just for a subset. Ordination techniques are used to map the variation in data. They are not directly predictive and cannot classify directly unless combined with another classification technique.
Fig. 2. Illustration of Cross Validation technique, here with three subsets: the training subset used to train the classifier, the test subset used to stop the training when it has reached an optimal performance on this subset, and a validation subset to evaluate the performance (generalization ability) of the trained classifier.
www.intechopen.com
Computational Biology and Applied Bioinformatics
106
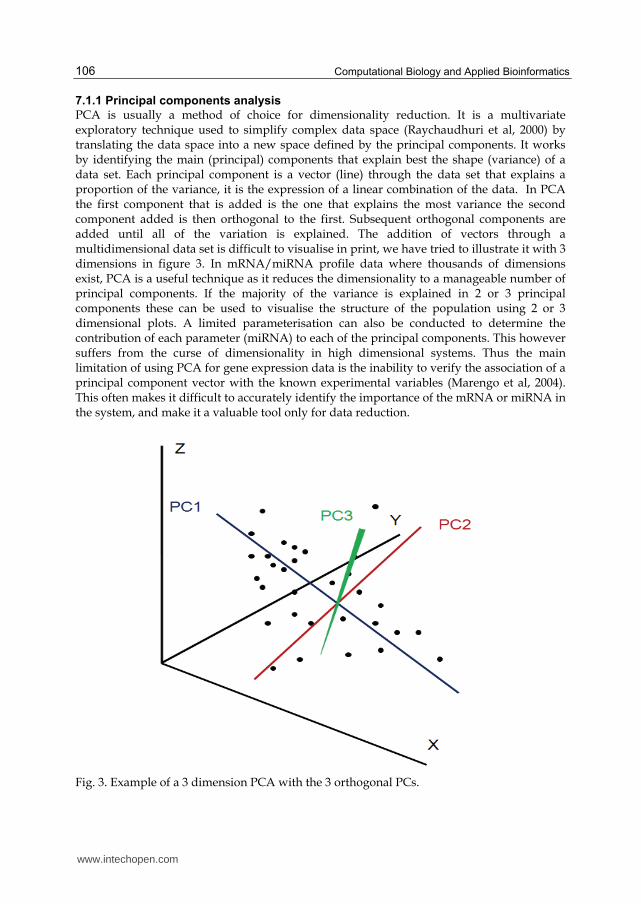
7.1.1 Principal components analysis
PCA is usually a method of choice for dimensionality reduction. It is a multivariate exploratory technique used to simplify complex data space (Raychaudhuri et al, 2000) by translating the data space into a new space defined by the principal components. It works by identifying the main (principal) components that explain best the shape (variance) of a data set. Each principal component is a vector (line) through the data set that explains a proportion of the variance, it is the expression of a linear combination of the data. In PCA the first component that is added is the one that explains the most variance the second component added is then orthogonal to the first. Subsequent orthogonal components are added until all of the variation is explained. The addition of vectors through a multidimensional data set is difficult to visualise in print, we have tried to illustrate it with 3 dimensions in figure 3. In mRNA/miRNA profile data where thousands of dimensions exist, PCA is a useful technique as it reduces the dimensionality to a manageable number of principal components. If the majority of the variance is explained in 2 or 3 principal components these can be used to visualise the structure of the population using 2 or 3 dimensional plots. A limited parameterisation can also be conducted to determine the contribution of each parameter (miRNA) to each of the principal components. This however suffers from the curse of dimensionality in high dimensional systems. Thus the main limitation of using PCA for gene expression data is the inability to verify the association of a principal component vector with the known experimental variables (Marengo et al, 2004). This often makes it difficult to accurately identify the importance of the mRNA or miRNA in the system, and make it a valuable tool only for data reduction.
Fig. 3. Example of a 3 dimension PCA with the 3 orthogonal PCs.
www.intechopen.com

MicroArray Technology - Expression Profiling of MRNA and MicroRNA in Breast Cancer
107
7.1.2 Hierarchical clustering
Although several clustering techniques exist, the most used in the context of microarray data analysis is hierarchical clustering. Hierarchical clustering is used to identify the structure of a given population of cases or a given set of markers such as proteins. Every case is considered to have a given position in multidimensional space. Hierarchical clustering determines the similarity of cases in this space based on the distance between points. There are various linkage methods used for calculating distance, such as single linkage, complete linkage and average linkage. Single linkage computes the distance as the distance between the two nearest points in the clusters being compared. Complete linkage computes the distance between the two farthest points, whilst average linkage averages all distances across all the points in the clusters being compared. One commonly used distance measure is Euclidian distance which is the direct angular distance between two points. In fact it considers the distance in multidimensional space between each point and every other point. In this way a hierarchy of distances is determined. This hierarchy is plotted in the form of a dendrogram (figure 4). From this dendrogram we can identify clusters of cases or markers that are similar at a given distance. The one major problem concerning clustering is that it suffers from the curse of
dimensionality when analysing complex datasets. In a high dimensional space, it is likely
that for any given pair of points within a cluster there will exist dimensions on which these
points are far apart from one another. Therefore distance functions using all input features
equally may not be truly effective (Domeniconi et al, 2004). Furthermore, clustering methods
will often fail to identify coherent clusters due to the presence of many irrelevant and
redundant features (Greene et al, 2005). Additionally, the important number of different
distance measure may add an additional bias: it has been reported that the choice of a
distance measure can greatly affect the results and produce different outcomes after the
analysis (Quackenbush, 2001). Dimensionality is also of importance when one is examining
the structure of a population through ordination techniques. This is particularly the case
when utilising hierarchical cluster analysis. This approach is of limited suitability for high
dimensional data as in a high dimensional space the distance between individual cases
reaches convergence making all cases appear the same (Domeniconi et al, 2004). This makes
it difficult to identify the real structure in the data or clusters of similar cases.
7.2 Application of modelling techniques
This second part of the section focusing on analysis tools considers more evolved techniques with what is known as machine learning. There are however a number of other techniques that can be employed in a predictive or classification capacity. Others include hidden Markov and Bayesian methods. These are widely described in the literature.
7.2.1 Decision tree based methodologies
Decision tree methodologies include, boosted decision trees, classification and regression trees, random forest methodologies. This approach is based on splitting a population into groups based on a hierarchy of rules (figure 5). Thus a given case is split into a given class based on a series of rules. This approach has been modified in a number of ways. Generally, a decision is made based on a feature that separates classes (one branch of the cluster dendrogram from another) within the population. This decision is based on a logical or numerical rule. Although their use in the analysis of miRNA data has been limited, decision
www.intechopen.com

Computational Biology and Applied Bioinformatics
108
trees have been used in the analysis of miRNA data derived to classify cancer patients (Xu, et al, 2009).
Fig. 4. Example of a hierarchical clustering analysis result aiming to find clusters of similar cases.
Fig. 5. Schematic example of the basic principle of Decision Trees
www.intechopen.com

MicroArray Technology - Expression Profiling of MRNA and MicroRNA in Breast Cancer
109
Boosted decision trees take the primary decision tree algorithm and boost it. Boosting is a
process where classifiers are derived to allow prediction of those not correctly predicted by
earlier steps. This means that a supervised classification is run where the actual class is
known. A decision tree is created that classifies correctly as many cases as possible. Those
cases that are incorrectly classified are given more weighting. A new tree is then created
with these boosted weights. This process is similar to the iterative leaning that is conducted
with the Artificial Neural Network back propagation algorithm.
Random forest approaches take the basic decision tree algorithm and couple it with random
sample cross validation. In this way a forest of trees is created. Integration of a number of
decision trees identifies a combined decision tree which, as it is developed on blind cases,
represents what approaches a generalised solution for the problem being modelled
(Breiman et al, 2001). This approach has been shown to be very good at making generalised
classifications. The approach essentially derives each tree from a random vector with
equivalent distribution from within the data set, essentially an extensive form of cross
validation. Yousef et al, (2010) have used random forest as one method for the identification
of gene targets for miRNAs. Segura et al (2010) have used random forests as a part of an
analysis to define post recurrence survival in melanoma patients.
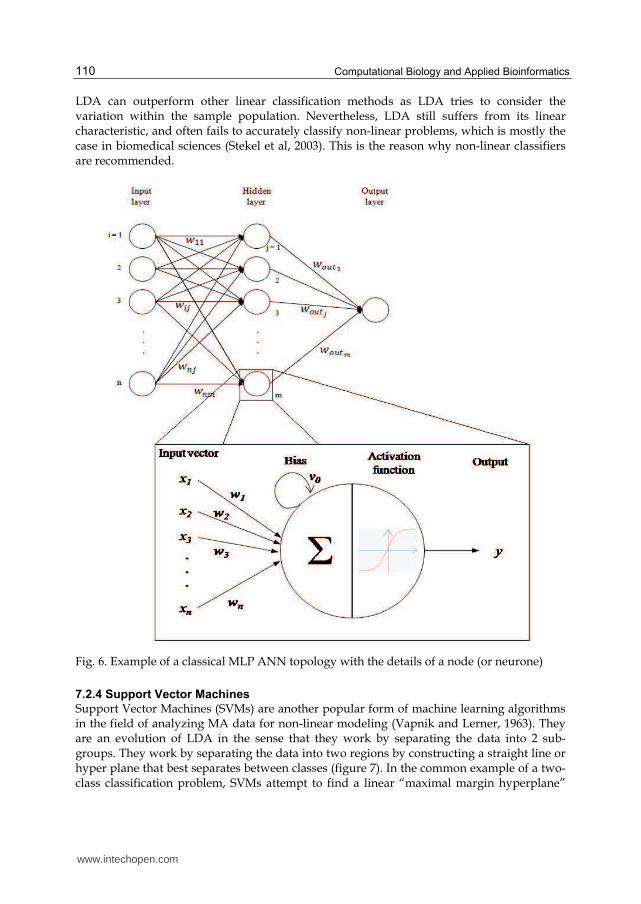
7.2.2 Artificial Neural Networks
Artificial Neural Networks are a non linear predictive system that may be used as a classifier. A popular form of ANN is the multi-layer perceptron (MLP) and is used to solve many types of problems such as pattern recognition and classification, function approximation, and prediction. The approach is a form of artificial intelligence in that it “learns” a solution to a problem from a preliminary set of samples. This is achieved by comparing predicted versus actual values for a seen data set (the training data set described earlier) and using the error of the predicted values from the ANN to iteratively develop a solution that is better able to classify. In MLP ANNs, learning is achieved by updating the weights that exist between the processing elements that constitute the network topology (figure 6). The algorithm fits multiple activation functions to the data to define a given class in an iterative fashion, essentially an extension of logistic regression. Once trained, ANNs can be used to predict the class of an unknown sample of interest. Additionally, the variables of the trained ANN model may be extracted to assess their importance in the system of interest. ANNs can be coupled with Random sample cross validation or any other cross validation method (LOO or MCCV) in order to ensure that the mode developed is not over fitted. One of the advantages of ANNs is that the process generates a mathematical model that can be interrogated and explored in order to elucidate further biological details and validate the model developed on a wide range of cases. A review of their use is in a clinical setting presented in Lisboa and Taktak (2006). Back propagation MLP ANNs have been proposed for use in the identification of biomarkers from miRNA data by Lowery et al, 2009.
7.2.3 Linear Discriminant Analysis (LDA)
Linear discriminant analysis attempts to separate the data into two subgroups by calculating
the optimal linear line that best splits the population. Calculation of this discriminating line
is conducted by taking into account sample variation within similar classes, and minimizing
it between classes. As a result, any additional sample has its class determined by the side of
the discriminating line it falls.
www.intechopen.com
Computational Biology and Applied Bioinformatics
110
LDA can outperform other linear classification methods as LDA tries to consider the variation within the sample population. Nevertheless, LDA still suffers from its linear characteristic, and often fails to accurately classify non-linear problems, which is mostly the case in biomedical sciences (Stekel et al, 2003). This is the reason why non-linear classifiers are recommended.
Fig. 6. Example of a classical MLP ANN topology with the details of a node (or neurone)
7.2.4 Support Vector Machines
Support Vector Machines (SVMs) are another popular form of machine learning algorithms in the field of analyzing MA data for non-linear modeling (Vapnik and Lerner, 1963). They are an evolution of LDA in the sense that they work by separating the data into 2 sub-groups. They work by separating the data into two regions by constructing a straight line or hyper plane that best separates between classes (figure 7). In the common example of a two-class classification problem, SVMs attempt to find a linear “maximal margin hyperplane”
www.intechopen.com

MicroArray Technology - Expression Profiling of MRNA and MicroRNA in Breast Cancer
111
able to accurately discriminate the classes (Dreiseitlet al, 2001), similarly to what does Linear Discriminant Analysis. If no such linear hyperplane can be found, usually due to the inherent non-linearity of the dataset, the data are mapped into a high-dimensional feature space using a kernel function (for example polynomial or radial basis functions) in which the two classes can now be separated by a hyperplane which corresponds to a non-linear classifier (Furey et al, 2000). The class of the unknown sample is then determined by the side of the “maximal marginal hyper plane” on which it lies. SVMs have been used to analyse miRNA data by Xue et al, 2005.
Fig. 7. Schematic representation of the principle of SVM. SVM tries to maximise the margin from the hyperplane in order to best separate the two classes (red positives from blue negatives).
8. Conclusion
The capability of microarray to simultaneously analyse expression patterns of thousands of
DNA sequences, mRNA or miRNA transcripts has the potential to provide a unique insight
into the molecular biology of malignancy. However, the clinical relevance and value of
microarray data is highly dependent on a number of crucial factors including appropriate
experimental design and suitable bioinformatic analysis. Breast cancer is a heterogeneous
disease with many biological variables which need to be considered to generate meaningful
results. Cohort selection is critical and sufficient biological and technical replicates must be
included as part of microarray study design. Experimental protocols should be appropriate
to the research question. The research community have enthusiastically applied high
throughput technologies to the study of breast cancer. Class prediction, class comparison
and class discovery studies have been undertaken in an attempt to unlock the heterogeneity
of breast cancer and identify novel biomarkers. Molecular signatures have been generated
which attempt to outperform current histopathological parameters at prognostication and
www.intechopen.com

Computational Biology and Applied Bioinformatics
112
prediction of response to therapy. Two clinical tests based on gene expression profiling
(Oncotype DX and Mammaprint) are already in clinical use and being evaluated in
multicentre international trials. It is essential that the potential of microarray signatures is
carefully validated before they are adopted as prognostic tools in the clinical setting.
Standards have been set for the reporting of microarray data (MIAME) and such data is
publically available to facilitate external validation and meta-analysis. It is imperative that
the data is integrated with knowledge normally processed in the clinical setting if we are to
overcome the difficulties in reproducibility, standardization and lack of proof of significance
beyond traditional clinicopathological tools that are limiting the incorporation of microarray
based tools into today’s standard of care.
Deriving biologically and clinically relevant results from microarray data is highly dependent on bioinformatic analysis. Microarray data is limited by inherent characteristics that render traditional statistical approaches less effective. These include high dimensionality, false discovery rates, noise, complexity, non-normality and limited reproducibility. High dimensionality remains one of the most critical challenges in the analysis of microarray data. Hierarchical clustering approaches, which have been widely used in the analysis of breast cancer microarray data, do not cope well with dimensionality. In overcoming this challenge supervised machine learning techniques have been adapted to the clinical setting to complement the existing statistical methods. The majority of machine learning techniques originated in weak-theory domains such as business and marketing. However, these approaches including Artificial Neural Networks and Support Vector Machines have been successfully applied to the analysis of miRNA microarray data in the context of clinical prognostication and prediction. It is clear that the goal of translating microarray technology to the clinical setting requires close collaboration between the involved scientific disciplines.If the current momentum in microarray-based miRNA and mRNA translational research can be maintained this will add an exciting new dimension to the field of diagnostics and prognostics and will bring us closer to the ideal of individualized care for breast cancer patients.
9. References
Abbott AL, Alvarez-Saavedra E, Miska EA et al( 2005) The let-7 MiRNA family members
mir-48, mir-84, and mir-241 function together to regulate developmental timing in
Caenorhabditis elegans. Dev Cell. 9(3):403-14.
Adam BL, Qu Y, Davis JW, Ward MD et al (2002) Serum protein fingerprinting coupled with
a pattern-matching algorithm distinguishes prostate cancer from benign prostate
hyperplasia and healthy men. Cancer Research 62:3609-3614.
Ahmed AA, Brenton JD (2005) Microarrays and breast cancer clinical studies: forgetting
what we have not yet learnt. Breast Cancer Res 7:96–99.
Arciero C, Somiari SB, Shriver CD, et al. (2003). Functional relationship and gene ontology
classification of breast cancer biomarkers. Int. J. Biol. Markers 18: 241-272.
Ashburner M, Ball CA, Blake JA et al (2000). Gene Ontology: tool for the unification of
biology. Nat Genet. 25(1): 25–29.
Baffa R, Fassan M, Volinia S et al.(2009) MicroRNA expression profiling of human metastatic
cancers identifies cancer gene targets. J Pathol, 219(2), 214‐221
www.intechopen.com

MicroArray Technology - Expression Profiling of MRNA and MicroRNA in Breast Cancer
113
Ball CA, Dolinski K, Dwight SS, et al (2000). Integrating functional genomic information into
the Saccharomyces Genome Database. Nucleic Acids Res;28:77–80
Ball G, Mian S, Holding F, et al (2002) An integrated approach utilizing artificial neural
networks and SELDI mass spectrometry for the classification of human tumours
and rapid identification of potential biomarkers. Bioinformatics 18:3395-3404.
Bartel DP. (2004) MiRNAs: genomics, biogenesis, mechanism and function. Cell; 116:281-97.
Bellman RE (1961) Adaptive Control Processes. Princeton University Press, Princeton, NJ
Benjamini Y, Hochberg Y (1995) Controlling the False Discovery Rate: A Practical and
Powerful Approach to Multiple Testing. Journal of the Royal Statistical Society.
Series B (Methodological);57:289-300.
Berns EM, van Staveren IL, Verhoog L et al (2001) Molecular profiles of BRCA1-mutated and
matched sporadic breast tumours: relation with clinico-pathological features.British
journal of cancer;85(4):538-45.
Bishop C (1995) Neural networks for pattern recognition. Oxford University Press.
Blake JA, Eppig JT, Richardson JE, Davisson MT (2000). The Mouse Genome Database
(MGD): expanding genetic and genomic resources for the laboratory mouse.
Nucleic Acids Res.;28:108–111
Blake JA, Harris MA (2002) The Gene Ontology (GO) project: structured vocabularies for
molecular biology and their application to genome and expression analysis. Curr
Protoc Bioinformatics. Chapter 7:Unit 7.2.
Blenkiron C, Goldstein LD, Thorne NP, et al (2007) MicroRNA expression profiling of
human breast cancer identifies new markers of tumor subtype. Genome Biol
8(10):R214
Brenton JD, Carey LA, Ahmed AA, Caldas C (2005). Molecular classification and molecular
forecasting of breast cancer: ready for clinical application? J Clin Oncol 23:7350–
7360.
Breiman L. Random Forests (2001) Machine Learning 45:5-32.
Buyse M, Loi S, van’t Veer L, et al. (2006) Validation and clinical utility of a 70-gene
prognostic signature for women with node-negative breast cancer. J Natl Cancer
Inst. 98(17):1183-1192.
Calin GA, Dumitru CD, Shimizu M, et al (2002) Frequent deletions and down-regulation of
micro- RNA genes miR15 and miR16 at 13q14 in chronic lymphocytic leukemia
PNAS.;99(24):15524-9.
Cardoso F, Van’t Veer L, Rutgers E, et al. (2008) Clinical application of the 70-gene profile:
the MINDACT trial. J Clin Oncol; 26:729–735.
Carey LA, Dees EC, Sawyer L et al (2007). The triple negative paradox: Primary tumor
chemosensitivity of breast cancer subtypes. Clin Cancer Res 2007; 13:2329 –2334.
Castoldi M, Schmidt S, Benes V, et al (2006) A sensitive array for MiRNA expression
profiling (miChip) based on locked nucleic acids (LNA). RNA;12(5):913-20.
Clarke R, Liu MC, Bouker KB, et al (2003). Antiestrogen resistance in breast cancer and the
role of estrogen receptor signaling. Oncogene;22(47):7316-39.
Cortez MA, Calin GA (2009). MiRNA identification in plasma and serum: a new tool to
diagnose and monitor diseases. Expert Opin Biol Ther;9(6):703-711.
www.intechopen.com

Computational Biology and Applied Bioinformatics
114
Cronin, M, Pho M, Dutta D et al (2004). Measurement of gene expression in archival
paraffin-embedded tissues: development and performance of a 92-gene reverse
transcriptase-polymerase chain reaction assay. Am J Pathol. 164:35–42
Cunliffe HE, Ringner M, Bilke S, et al. (2003). The gene expression response of breast cancer
to growth regulators: patterns and correlation with tumor expression profiles.
Cancer Res. 63:7158-7166.
Desmedt C, Haibe-Kains B, Wirapati P, et al (2008). Biological processes associated with
breast cancer clinical outcome depend on the molecular subtypes. Clin Cancer Res
;14:5158-65.
Domeniconi C, Papadopoulos D, Gunopulos D, et al (2004). Subspace clustering of high
dimensional data. Proceedings 4th SIAM International Conference on Data
Mining, pp. 517-521. Lake Buena Vista, FL, SIAM, 3600 UNIV CITY SCIENCE
CENTER, PHILADELPHIA, PA 19104-2688 USA.
Dreiseitl S, Ohno-Machado L, Kittler H, et al (2001). A Comparison of Machine Learning
Methods for the Diagnosis of Pigmented Skin Lesions. Journal of Biomedical
Informatics;34:28-36.
Esquela-Kerscher A, Slack FJ.(2006) Oncomirs - MiRNAs with a role in cancer. Nature
reviews;6(4):259-69.
Fan C, Oh DS, Wessels L, et al (2006) Concordance among gene-expression-based predictors
for breast cancer. N Engl J Med;355:560–9.
Farmer P, Bonnefoi H, Becette V, et al (2005) Identification of molecular apocrine breast
tumours by microarray analysis.Oncogene;24:4660–71.
Ferlay J, Parkin DM, Steliarova-Foucher E (2010) Estimates of cancer incidence and mortality
in Europe in 2008. Eur J Cancer; 46:765-781.
Fisher B, Jeong JH, Bryant J, et al (2004). Treatment of lymph-node-negative, oestrogen
receptor-positive breast cancer: Long-term findings from National Surgical
Adjuvant Breast and Bowel Project randomised clinical trials. Lancet;364:858–868
Foekens JA, Sieuwerts AM, Smid M et al (2008) Four miRNAs associated with
aggressiveness of lymph node negative, estrogen receptor-positive human breast
cancer.PNAS;105(35):13021-6.
Furey T S, Cristianini N, Duffy N, et al (2000). Support vector machine classification and
validation of cancer tissue samples using microarray expression data.
Bioinformatics16:906-914.
Geyer FC, Lopez-Garcia MA, Lambros MB, Reis-Filho JS (2009) Genetic Characterisation of
Breast Cancer and Implications for Clinical Management. J Cell Mol Med (10):4090
103.
Gilad S, Meiri E, Yogev Y, et al (2008). Serum MiRNAs are promising novel biomarkers.
PLoS ONE. ;3(9):e3148.
Goldhirsch A, Wood WC, Gelber RD,et al (2007). Progress and promise: highlights of the
international expert consensus on the primary therapy of early breast cancer 2007.
Ann Oncol;18(7):1133-44.
Goldstein LJ, Gray R, Badve S, et al (2008) Prognostic utility of the 21-gene assay in hormone
receptor-positive operable breast cancer compared with classical clinicopathologic
features. J Clin Oncol;26:4063–4071
www.intechopen.com

MicroArray Technology - Expression Profiling of MRNA and MicroRNA in Breast Cancer
115
Greene D, Cunningham P, Jorge A, et al. (2005). Producing accurate interpretable clusters
from high-dimensional data, Proceedings 9th European Conference on Principles
and Practice of Knowledge Discovery in Databases (PKDD), pp. 486-494, Porto
Portugal.
Habel LA, Shak S, Jacobs MK, et al (2006). A population-based study of tumor gene
expression and risk of breast cancer death among lymph node-negative patients.
Breast Cancer Res;8:R25.
Hedenfalk I, Duggan D, Chen Y, et al (2001) Gene expression profiles in hereditary breast
cancer. N Engl J Med.;344(8):539-48.
Heneghan HM, Miller N, Kerin MJ. (2010)MiRNAs as biomarkers and therapeutic targets in
cancer. Curr Opin Pharmacol;10(5):543-50.
Hu Z, Fan C, Oh DS,, et al. (2006) The molecularportraits of breast tumors are conserved
across microarray platforms. BMC Genom ;7:96.
Huang JX, Mehrens D, Wiese R,, et al. 2001. High-throughput genomic and Proteomic
analysis using microarray technology. Clinical Chem, 47: 1912-16.
Huang Q, Gumireddy K, Schrier M et al.(2008) The microRNAs miR‐373 and miR‐520c
promote tumour invasion and metastasis. Nat Cell Biol;10(2):202‐210
Izmirlian G (2004) Application of the random forest classification algorithm to a SELDI-TOF
proteomics study in the setting of a cancer prevention trial. Annals of the New
York Academy of Sciences; 1020:154-174
Iorio MV, Ferracin M, Liu CG, et al (2005). MicroRNA gene expression deregulation in
human breast cancer. Cancer research;65: 7065-70.
Jemal A, Siegel R, Ward E, et al. (2009) Cancer statistics, 2009. CA Cancer J Clin;59:225-249.
Khatri, P., Draghici, S. (2005), Ontological analysis of gene expression data: current tools,
limitations, and open problems. Bioinformatics; 21: 3587–3595.
Kim C, Taniyama Y, Paik S (2009). Gene-expression-based prognostic and predictive
markers for breast cancer- A primer for practicing pathologists Crit Rev Oncol
Hematol.;70(1):1-11.
Klebanov L, Yakovlev A (2007) How high is the level of technical noise in microarray data?
Biology Direct;2:9.
Kreike B, van Kouwenhove M, Horlings H et al (2007). Gene expression profiling and
histopathological characterization of triple-negative/basal-like breast carcinomas.
Breast Cancer Res;9:R65.
Korkola JE, DeVries S, Fridlyand J, et al (2003). Differentiation of lobular versus ductal
breast carcinomas by expression microarray analysis. Cancer Res;63:7167–7175.
Lamb J, Ramaswamy S, Ford HL, et al (2003). A mechanism of cyclin D1 action encoded in
the patterns of gene expression in human cancer. Cell; 114(3):323-34.
Lancashire LJ, Lemetre C, Ball GR (2009). An introduction to artificial neural networks in
bioinformatics--application to complex microarray and mass spectrometry datasets
in cancer studies. Briefings in Bioinformatics;10:315-329.
Lee RC, Feinbaum RL, Ambros V. (1993) The C. elegans heterochronic gene lin-4 encodes
small RNAs with antisense complementarity to lin-14. Cell.;75(5):843-54.
Leopold E, Kindermann J (2006). Content Classification of Multimedia Documents using
Partitions of Low-Level Features. Journal of Virtual Reality and Broadcasting 3(6).
www.intechopen.com

Computational Biology and Applied Bioinformatics
116
Li J, Smyth P, Flavin R, et al. (2007) Comparison of miRNA expression patterns using total
RNA extracted from matched samples of formalin- fixed paraffin-embedded (FFPE)
cells and snap frozen cells. BMC biotechnology;7:36
Lisboa PJ, Taktak AF(2006). The use of artificial neural networks in decision support in
cancer: A systematic review. Neural Networks;19:408-415.
Lo SS, Norton J, Mumby PB et al(2007). Prospective multicenter study of the impact of the
21-gene recurrence score (RS) assay on medical oncologist (MO) and patient (pt)
adjuvant breast cancer (BC) treatment selection. J Clin Oncol;25(18 suppl):577
Loi S, Haibe-Kains B, Desmedt C, et al (2007). Definition of clinically distinct molecular
subtypes in estrogen receptor-positive breast carcinomas through genomic grade. J.
Clin. Oncol. 25, 1239–1246
Lowery AJ, Miller N, McNeill RE, Kerin MJ (2008). MicroRNAs as prognostic indicators and
therapeutic targets: potential effect on breast cancer management. Clin Cancer Res.
;14(2):360-5.
Lowery AJ, Miller N, Devaney A, et al (2009) . MicroRNA signatures predict estrogen
receptor, progesterone receptor and Her2/neu receptor status in breast cancer.
Breast Cancer Res.;11(3):R27.
Lu J, Getz G, Miska EA, et al.(2005) MiRNA expression profiles classify human cancers.
Nature. 2005;435(7043):834-8
Ma XJ, Hilsenbeck SG, Wang W et al (2006). The HOXB13:IL17BR expression index is a
prognostic factor in early-stage breast cancer. J Clin Oncol; 24:4611– 4619.
Ma J, Dong C, Ji C (2010). MicroRNA and drug resistance. Cancer Gene Ther, 17(8), 523‐531
Manning AT, Garvin JT, Shahbazi RI, et al (2007). Molecular profiling techniques and
bioinformatics in cancer research Eur J Surg Oncol;33(3):255-65.
Marchionni L, Wilson RF, Wolff AC, et al (2008). Systematic review: gene expression
profiling assays in early-stage breast cancer. Ann Intern Med.;148(5):358-369.
Marengo E, Robotti E, Righetti PG, et al (2004). Study of proteomic changes associated with
healthy and tumoral murine samples in neuroblastoma by principal component
analysis and classification methods. Clinica Chimica Acta;345:55-67.
Masuda N, Ohnishi T, KawamotoS , et al (1999) Analysis of chemical modification of RNA
from formalin-fixed samples and optimization of molecular biology applications
for such samples. Nucleic Acids Res. 27, 4436–4443
Matharoo-Ball B, Ratcliffe L, Lancashire L, et al (2007). Diagnostic biomarkers differentiating
metastatic melanoma patients from healthy controls identified by an integrated
MALDI-TOF mass spectrometry/bioinformatic approach. Proteomics Clinical
Applications; 1:605-620
Mattie MD, Benz CC, Bowers J, et al (2006). Optimized high-throughput MiRNA expression
profiling provides novel biomarker assessment of clinical prostate and breast
cancer biopsies. Molecular cancer;5:24
Michiels S, Koscielny S, Hill C (2005). Prediction of cancer outcome with microarrays: a
multiple random validation strategy. Lancet;365: 488-92.
Michiels S, Koscielny S, Hill C (2007). Interpretation of microarray data in cancer. British
Journal of Cancer;96:1155–1158.
www.intechopen.com

MicroArray Technology - Expression Profiling of MRNA and MicroRNA in Breast Cancer
117
Mina L, Soule SE, Badve S, et al. (2007) Predicting response to primary chemotherapy: gene
expression profiling of paraffin-embedded core biopsy tissue. Breast Cancer Res
Treat ;103:197–208.
Mitchell PS, Parkin RK, Kroh EM, et al (2008).Circulating MiRNAs as stable blood- based
markers for cancer detection.PNAS;105(30):10513-8
Mook S, Schmidt MK, Viale G, et al (2009). The 70-gene prognosis signature predicts disease
outcome in breast cancer patients with 1–3 positive lymph nodes in an
independent validation study. Breast Cancer Res Treat;116:295–302.
Mootha VK, Lindgren CM, Eriksson KF, et al (2003). PGC-1alpha Responsive Genes
Involved in Oxidative Phosphorylation are Coordinately Downregulated in Human
Diabetes, Nature Genetics 34(3):267-73
Nielsen TO, Hsu FD, Jensen K et al (2004). Immunohistochemical and clinical
characterization of the basal-like subtype of invasive breast carcinoma. Clin Cancer
Res ;10:5367-74.
Oberley MJ, Tsao J, Yau P, Farnham PJ (2004). Highthroughput screening of chromatin
immunoprecipitates using CpG-island microarrays. Methods Enzymol;376: 315-
34.
Oostlander AE, Meijer GA, Ylstra B (2004). Microarraybased comparative genomic
hybridization and its applications in human genetics. Clin Genet, 66: 488-495.
Osborne CK(1998) Tamoxifen in the treatment of breast cancer. N Engl J Med;339(22):1609-
18.
Paik S, Shak S, Tang G, et al (2004). A multigene assay to predict recurrence of tamoxifen-
treated, node-negative breast cancer. N Engl J Med;351(27):2817-26.
Paik, S. Kim, C. Y, Song, Y. K. & Kim, W. S. (2005) Technology insight: application of
molecular techniques to formalin-fixed paraffin-embedded tissues from breast
cancer. Nat. Clin. Pract. Oncol;2:246–254
Paik S, Tang G, Shak S, , et al(2006). Gene expression and benefit of chemotherapy in women
with node-negative, estrogen receptor-positive breast cancer. J Clin Oncol; 24 (23) :
3726-34.
Parker JS, Mullins M, Cheang MC, et al (2009). Supervised risk predictor of breast cancer
based on intrinsic subtypes. J Clin Oncol;27:1160–1167.
Pedraza V, Gomez-Capilla JA, Escaramis G, et al (2010) Gene expression signatures in breast
cancer distinguish phenotype characteristics, histologic subtypes, and tumor
invasiveness. Cancer.;116(2):486-96.
Peppercorn J, Perou CM, Carey LA. (2008) Molecular subtypes in breast cancer evaluation
and management: divide and conquer. Cancer Invest;26:1–10.
Perou CM, Sorlie T, Eisen MB, et al (2000). Molecular portraits of human breast tumours.
Nature;406: 747-52.
Pusztai L, Mazouni C, Anderson K, et al (2006). Molecular classification of breast cancer:
limitations and potential. Oncologist;11:868–877.
Quackenbush J (2001). Computational analysis of microarray data. Nature Reviews Genetics
;2:418-27.
www.intechopen.com

Computational Biology and Applied Bioinformatics
118
Raychaudhuri S, Stuart JM, Altman RB (2000). Principal components analysis to summarize
microarray experiments: application to sporulation time series. In Pacific
Symposium on Biocomputing, pp. 455–466.
Rifai N, Gillette MA, Carr SA (2006). Protein biomarker discovery and validation: the long
and uncertain path to clinical utility. Nature biotechnology;24:971-983
Rouzier R, Perou CM, Symmans WF et al (2005). Breast cancer molecular subtypes
respond differently to preoperative chemotherapy. Clin Cancer Res;11:5678 –
5685.
Schena M, Shalon D, Davis RW, Brown PO (1995). Quantitative monitoring of
gene expression patterns with a complementary DNA microarray. Science;270:467-
70.
Segura MF, Belitskaya-Lévy I, Rose A, et al (2010) Melanoma MicroRNA Signature Predicts
Post-Recurrence Survival. Clinical Cancer Research;16:1577.
Shak S, Baehner FL, Palmer G, et al (2006) Subtypes of breast cancer defined by
standardized quantitative RT–PCR analysis of 10 618 tumors. Breast Cancer Res
Treat 2006;100:S295–295.
Shi L, Reid LH, Jones WD, et al (2006)The microarray quality control (MAQC) project shows
inter- and intraplatform reproducibility of gene expression measurements. Nature
Biotechnologie;24:1151–1161.
Simon RM, Korn EL, McShane LM, et al (2003). Design and analysis of DNA microarray
investigations. Springer New York
Smith I, Procter M, Gelber RD, et al (2007). 2-year follow up of trastuzumab after adjuvant
chemotherapy in HER2-positive breast cancer: a randomised controlled trial.
Lancet. ;369(9555):29-36.
Sorlie T, Perou CM, Tibshirani R, et al (2001) Gene expression patterns of breast
carcinomas distinguish tumor subclasses with clinical implications.PNAS;98: 10869-
74.
Sorlie T, Tibshirani R, Parker J, et al (2003). Repeated observation of breast tumor subtypes
in independent gene expression data sets. PNAS;100:8418–8423.
Sorlie T, Perou CM, Fan C, et al (2006) Gene expression profiles do not consistently predict
the clinical treatment response in locally advanced breast cancer. Mol Cancer
Ther;5:2914–8.
Sotiriou C, Neo SY, McShane LM, et al (2003) Breast cancer classification and prognosis
based on gene expression profiles from a population based study.PNAS;100:10393–
10398
Sparano JA. (2006). TAILORx: Trial assigning individualized options for treatment (Rx). Clin
Breast Cancer;7:347–350.
Stekel D. (2003). Microarray bioinformatics. Cambrigde University Press,
Stoll D, Templin MF, Bachmann J, Joos TO (2005). Protein microarrays: applications and
future challenges. Curr Opin Drug Discov Devel, 8: 239-252.
Sun Y, Goodison S. Li J, Liu L., Farmerie W (2007). Improved breast cancer prognosis
through the combination of clinical and genetic markers, Bioinformatics;23:30–
37
www.intechopen.com

MicroArray Technology - Expression Profiling of MRNA and MicroRNA in Breast Cancer
119
Tessel MA, Krett NL, Rosen ST (2010).Steroid receptor and microRNA regulation in cancer.
Curr Opin Oncol;22(6):592‐597
The FlyBase Consortium (1999). The FlyBase database of the Drosophila Genome Projects
and community literature. Nucleic Acids Res;27:85–88.
van de Vijver M, He Y, van’t Veer L, et al (2002). A gene-expression signature as a predictor
of survival in breast cancer. N Engl J Med;347:1999–2009.
van’t Veer L, Dai H, van de Vijver M, et al (2002). Gene expression profiling predicts clinical
outcome of breast cancer. Nature;415:530–6.
Vapnik V, Lerner A (1963). Pattern recognition using generalized portrait method.
Automation and Remote Control 1963;24:774-780.
Volinia S, Calin GA, Liu CG, et al (2006). A MiRNA expression signature of human solid
tumors defines cancer gene targets. PNAS.;103(7):2257-61.
Wadsworth JT, Somers KD, Cazares LH, et al (2004) Serum protein profiles to identify head
and neck cancer. Clinical Cancer Research;10:1625-1632.
Wang Y, Klijn JG, Zhang Y et al (2005). Gene-expression profiles to predict
distant metastasis of lymph-node-negative primary breast cancer. Lancet;365:671–
679.
Warnat P, Eils R, Brors B (2005). Cross-platform analysis of cancer microarray data
improves gene expression based classification of phenotypes. BMC
bioinformatics 2;6: 265.
Weigelt B, Geyer FC, Natrajan R, et al (2010) The molecular underpinning of lobular
histological growth pattern: a genome-wide transcriptomic analysis of invasive
lobular carcinomas and grade- and molecular subtype-matched invasive ductal
carcinomas of no special type. J Pathol;220(1):45-57
Wirapati P, Sotiriou C, Kunkel S, et al (2008). Meta-analysis of gene expression profiles in
breast cancer: toward a unified understanding of breast cancer subtyping and
prognosis signatures. Breast Cancer Res;10:R65.
Wong JWH, Cagney G, Cartwright HM (2005). SpecAlign—processing and alignment of
mass spectra datasets. Bioinformatics;21:2088-2090
Xi Y, Nakajima G, Gavin E, et al (2007). Systematic analysis of MiRNA expression of RNA
extracted from fresh frozen and formalin-fixed paraffin-embedded samples.
RNA;13(10):1668-74.
Xue C, Li F, He T, Liu GP, Li Y, Xuegong Z (2005). Classification of real and pseudo
microRNA precursors using local structure-sequence features and support vector
machine. BMC Bioinformatics;6:310.
Xu R, Xu J, Wunsch DC (2009). Using default ARTMAP for cancer classification with
MicroRNA expression signatures, International Joint Conference on Neural Networks,
pp.3398-3404,
Yan PS, Perry MR, Laux DE, et al (2000). CpG island arrays: an application toward
deciphering epigenetic signatures of breast cancer. Clinical Cancer Research; 6:
1432-38.
Yousef M, Najami N, Khalifa W (2010). A comparison study between one-class and two-
class machine learning for MicroRNA target detection. Journal of Biomedical
Science and Engineering ;3:247-252.
www.intechopen.com

Computational Biology and Applied Bioinformatics
120
Zhao H, Langerod A, Ji Y, et al (2004) Different gene expression patterns in invasive lobular
and ductal carcinomas of the breast. Mol Biol Cell;15:2523–2536.
Zhao H, Shen J, Medico L, et al (2010). A Pilot Study of Circulating miRNAs as Potential
Biomarkers of Early Stage Breast Cancer. PLoS One;5(10),e137:5 , 2010
Zheng T, Wang J, Chen X, Liu L (2010) Role of microRNA in anticancer drug resistance. Int J
Cancer;126(1):2-10.
www.intechopen.com

Computational Biology and Applied BioinformaticsEdited by Prof. Heitor Lopes
ISBN 978-953-307-629-4Hard cover, 442 pagesPublisher InTechPublished online 02, September, 2011Published in print edition September, 2011
InTech EuropeUniversity Campus STeP Ri Slavka Krautzeka 83/A 51000 Rijeka, Croatia Phone: +385 (51) 770 447 Fax: +385 (51) 686 166
InTech ChinaUnit 405, Office Block, Hotel Equatorial Shanghai No.65, Yan An Road (West), Shanghai, 200040, China
Phone: +86-21-62489820 Fax: +86-21-62489821
Nowadays it is difficult to imagine an area of knowledge that can continue developing without the use ofcomputers and informatics. It is not different with biology, that has seen an unpredictable growth in recentdecades, with the rise of a new discipline, bioinformatics, bringing together molecular biology, biotechnologyand information technology. More recently, the development of high throughput techniques, such asmicroarray, mass spectrometry and DNA sequencing, has increased the need of computational support tocollect, store, retrieve, analyze, and correlate huge data sets of complex information. On the other hand, thegrowth of the computational power for processing and storage has also increased the necessity for deeperknowledge in the field. The development of bioinformatics has allowed now the emergence of systems biology,the study of the interactions between the components of a biological system, and how these interactions giverise to the function and behavior of a living being. This book presents some theoretical issues, reviews, and avariety of bioinformatics applications. For better understanding, the chapters were grouped in two parts. InPart I, the chapters are more oriented towards literature review and theoretical issues. Part II consists ofapplication-oriented chapters that report case studies in which a specific biological problem is treated withbioinformatics tools.
How to referenceIn order to correctly reference this scholarly work, feel free to copy and paste the following:
Aoife Lowery, Christophe Lemetre, Graham Ball and Michael Kerin (2011). MicroArray Technology -Expression Profiling of MRNA and MicroRNA in Breast Cancer, Computational Biology and AppliedBioinformatics, Prof. Heitor Lopes (Ed.), ISBN: 978-953-307-629-4, InTech, Available from:http://www.intechopen.com/books/computational-biology-and-applied-bioinformatics/microarray-technology-expression-profiling-of-mrna-and-microrna-in-breast-cancer
www.intechopen.com

www.intechopen.com

© 2011 The Author(s). Licensee IntechOpen. This chapter is distributedunder the terms of the Creative Commons Attribution-NonCommercial-ShareAlike-3.0 License, which permits use, distribution and reproduction fornon-commercial purposes, provided the original is properly cited andderivative works building on this content are distributed under the samelicense.