identification of novel transcription factor-microrna-mrna
TRANSCRIPT

Page 1 of 15
© Annals of Translational Medicine. All rights reserved. Ann Transl Med 2021;9(2):133 | http://dx.doi.org/10.21037/atm-20-7759
Identification of novel transcription factor-microRNA-mRNA co-regulatory networks in pulmonary large-cell neuroendocrine carcinoma
Cunliang Cai1^, Qianli Zeng2, Guiliang Zhou2, Xiangdong Mu1
1Department of Respiratory and Critical Care Medicine, Beijing Tsinghua Changgung Hospital, School of Clinical Medicine, Tsinghua University,
Beijing, China; 2The South China Center for Innovative Pharmaceuticals, Guangzhou, China
Contributions: (I) Conception and design: C Cai, X Mu; (II) Administrative support: X Mu; (III) Provision of study materials or patients: C Cai; (IV)
Collection and assembly of data: Q Zeng, G Zhou; (V) Data analysis and interpretation: Q Zeng, G Zhou; (VI) Manuscript writing: All authors; (VII)
Final approval of manuscript: All authors.
Correspondence to: Dr. Xiangdong Mu. Department of Respiratory and Critical Care Medicine, Beijing Tsinghua Changgung Hospital, School of
Clinical Medicine, Tsinghua University, Beijing, China. Email: [email protected].
Background: Large cell neuroendocrine carcinoma (LCNEC) of the lung is a rare neuroendocrine neoplasm. Previous studies have shown that microRNAs (miRNAs) are widely involved in tumor regulation through targeting critical genes. However, it is unclear which miRNAs play vital roles in the pathogenesis of LCNEC, and how they interact with transcription factors (TFs) to regulate cancer-related genes. Methods: To determine the novel TF-miRNA-target gene feed-forward loop (FFL) model of LCNEC, we integrated multi-omics data from Gene Expression Omnibus (GEO), Transcriptional Regulatory Relationships Unraveled by Sentence-Based Text Mining (TRRUST), Transcriptional Regulatory Element Database (TRED), and The experimentally validated microRNA-target interactions database (miRTarBase database). First, expression profile datasets for mRNAs (GSE1037) and miRNAs (GSE19945) were downloaded from the GEO database. Overlapping differentially expressed genes (DEGs) and differentially expressed miRNAs (DEMs) were identified through integrative analysis. The target genes of the FFL were obtained from the miRTarBase database, and the Gene Ontology (GO) and Kyoto Encyclopedia of Genes and Genomes (KEGG) functional enrichment analyses were performed on the target genes. Then, we screened for key miRNAs in the FFL and performed gene regulatory network analysis based on key miRNAs. Finally, the TF-miRNA-target gene FFLs were constructed by the hypergeometric test.Results: A total of 343 DEGs and 60 DEMs were identified in LCNEC tissues compared to normal tissues, including 210 down-regulated and 133 up-regulated genes, and 29 down-regulated and 31 up-regulated miRNAs. Finally, the regulatory network of TF-miRNA-target gene was established. The key regulatory network modules included ETS1-miR195-CD36, TAOK1-miR7-1-3P-GRIA1, E2F3-miR195-CD36, and TEAD1-miR30A-CTHRC1.Conclusions: We constructed the TF-miRNA-target gene regulatory network, which is helpful for understanding the complex LCNEC regulatory mechanisms.
Keywords: Large cell neuroendocrine carcinoma (LCNEC); microRNA (miRNA); feed-forward loop (FFL);
transcription factor-miRNA co-regulatory network (TF-miRNA co-regulatory network)
Submitted Nov 03, 2020. Accepted for publication Jan 06, 2021.
doi: 10.21037/atm-20-7759
View this article at: http://dx.doi.org/10.21037/atm-20-7759
133
Original Article
^ ORCID: 0000-0003-4934-2493.

Cai et al. The miRNA-mRNA co-regulatory networks in LCNEC
© Annals of Translational Medicine. All rights reserved. Ann Transl Med 2021;9(2):133 | http://dx.doi.org/10.21037/atm-20-7759
Page 2 of 15
Introduction
Pulmonary high-grade neuroendocrine carcinoma includes the following 2 clinicopathological entities classified based on their morphological and biological features: large cell neuroendocrine carcinoma (LCNEC) and small cell lung cancer (SCLC) (1,2). LCNEC and SCLC share several histological features, including rosette formation, molding of nuclei, and lack of apparent glandular formation and keratinization (3,4). LCNEC, diagnosed in approximately 3% of all patients with lung cancer, is generally associated with a high metastasis rate and poor prognosis (5,6). It is characterized by occult onset, strong invasiveness, and poor survival regardless of surgery, chemotherapy, radiotherapy, or other treatments (7). For the treatment of LCNEC, surgical resection remains the only curative treatment for early-stage patients. For advanced-stage LCNECs, the standard treatment is debated. Some clinicians favor chemotherapy similar to SCLC (platinum-etoposide) while others prefer NSCLC-type chemotherapy regimens, like gemcitabine/pemetrexed combined with platinum. Therefore, because there is a paucity in the understanding of the precise molecular mechanisms underlying LCNEC, it is of great importance to find biological markers for early diagnosis and novel treatment targets of LCNEC.
Transcription factors (TFs) are DNA-binding proteins that can function as tumor suppressors or oncogenes (8). TFs play significant roles in the regulation of gene expression, and can induce avoidance of apoptosis and uncontrolled growth (9). A previous study demonstrated the presence of thyroid transcription factor-1 (TTF-1) in a significant subset of pulmonary neuroendocrine tumors, including 35% of typical carcinoids, 100% of atypical carcinoids, 75% of large cell neuroendocrine tumors, and 95% of small cell carcinomas (10). Huang et al. found that POU2F3 is an essential master regulator of cell identity in the neuroendocrine variant of SCLC. Epithelial-mesenchymal transition (EMT) plays an important role in tumor invasion and metastasis, and is an important mechanism by which many tumor cell types acquire invasion and metastasis capabilities (11). Snail, a major TF regulator of EMT, directly inhibits the expression of E-cadherin (E-cad) and up-regulates the expression of interstitial cell marker molecules such as N-cadherin (N-cad), thereby promoting the oncogenesis of non-small cell lung cancer (NSCLC) (12). Jin et al. found that metformin-induced repression of miR-381-YAP-Snail axis activity can disrupt NSCLC growth and metastasis. Thus, they postulated that
the miR-381-YAP-Snail signal axis might be a suitable diagnostic marker and a potential therapeutic target for lung cancer (13). Foxp3 has been reported as a key regulatory gene of regulatory T cells (Tregs). Foxp3+ Tregs accumulate in the center of lung tumors and in metastatic lymph nodes, suggesting a role in the formation of immunosuppressive tumor microenvironment (14). Shih et al. validated that MYC, YAP1, or MMP13 overexpression increased the incidence of lung adenocarcinoma brain metastasis by case-controlled analyses of genomic alterations and functional assessment in patient-derived xenograft mouse models (15).
MicroRNAs (miRNAs) are short, non-coding RNAs consisting of 18-25 nucleotides that regulate the translation of mRNAs (16). Mature miRNAs can recognize and bind to the 3' untranslated region of mRNAs and regulate translation at the post-transcriptional level through repression or degradation of the targeted mRNAs (17). Recent studies have documented the relationship between the aberrant expression of a class of miRNAs and the pathogenesis of many human cancers, including lung cancer (18,19). Lee et al. found that miR-21 and miR-155 were differentially expressed according to the histological subtypes of pulmonary neuroendocrine tumors, and the expression level of miR-21 was significantly higher in carcinoid tumors with lymph node metastasis than in carcinoid tumors without lymph node metastasis (20). Other links between lung cancer and miRNA have also been reported, including let-7 in lung cancers (21), and high expression and oncogenic function of mir-17-92 cluster in human B cell lymphomas as well as in lung cancers (22). The expression of 5 miRNAs (hsa-mir-155, hsamir-17-3p, hsa-let-7a-2, hsa-mir-145, and hsa-mir-21) has been shown to be significantly altered in lung cancers, and also has a prognostic impact on survival (18).
Regulatory network analysis, such as feedback loop and feed-forward loop (FFL), is a powerful way to investigate the underlying global relationships between molecular networks. MiRNA-TF co-regulation is one of the most important FFL types. TFs and miRNAs are crucial regulators at the transcriptional and post-transcriptional levels. Understanding the cross-talk between these 2 regulators and their targets is critical to unveiling the complex molecular regulatory mechanisms of cancers. Numerous studies have revealed that TFs regulate gene expression by interacting with miRNAs (23). There are currently no detailed reports of the TFs and TF-miRNA-mRNA network in LCNEC.
Recently, by identifying key cancer-related genes, non-

Annals of Translational Medicine, Vol 9, No 2 January 2021 Page 3 of 15
© Annals of Translational Medicine. All rights reserved. Ann Transl Med 2021;9(2):133 | http://dx.doi.org/10.21037/atm-20-7759
coding RNAs, and TFs, bioinformatics analysis has gradually been utilized to explore the mechanisms of oncogenesis and cancer progression. In this study, we investigated the comprehensive miRNA-TF co-regulatory network in LCNEC. Firstly, we identified the potential targets of LCNEC-related TFs and miRNAs. We used a public database to find the TFs that regulate the dysregulated genes. MiRNAs were further predicted according to the TFs that targeted the differentially expressed genes (DEGs), and interactions between miRNAs and TFs were predicted with online tools. Based on our findings, a TF-miRNA-mRNA network was then constructed to reveal a transcriptional regulation model to identify key genes and miRNAs associated with LCNEC, which helps to reveal the complicated regulatory mechanisms underlying LCNEC and novel markers or targets for the diagnosis and treatment of LCNEC.
We present the following article in accordance with the MDAR checklist (available at http://dx.doi.org/10.21037/atm-20-7759).
Methods
Collection of datasets
A flowchart of the study design is shown in Figure 1. The mRNA expression profile (GSE1037) and the miRNA expression profile (GSE19945) datasets were downloaded from the Gene Expression Omnibus (GEO) database (http://www.ncbi.nlm.nih.gov/gds/). All of the datasets were selected based on the following criteria: (I) there were no fewer than 6 samples, (II) the samples were from human LCNEC tissues, and (III) the datasets included case-control groups.
The study was conducted in accordance with the Declaration of Helsinki (as revised in 2013).
Screening LCNEC-related miRNAs and genes
To obtain the dysregulated miRNAs in LCNEC, we searched the miR2Disease (http://www.mir2disease.org/), PhenomiR2.0 (http://mips.helmholtz-muenchen.de/phenomir), and HMDD2.0 (http://www.cuilab.cn/hmdd) databases by using the keywords “large-cell neuroendocrine carcinoma” or “LCNEC”. Finally, mapped unique miRNAs were retrieved as LCNEC-related miRNAs. The miRTarBase8.0 (http://mirtarbase.cuhk.edu.cn/php/index.php) was used for annotation miRNA-target genes. The R
limma 10.0 package in Bioconductor version 3.10 (http://www.bioconductor.org/) was utilized to identify DEGs and aberrantly expressed miRNAs in LCNEC tissues compared with normal lung tissues. The Benjamini and Hochberg false discovery rate (FDR) and adjusted P values (adj.p) were applied to provide a balance between the probability of obtaining false positives and the probability of discovering statistically significant genes. The cutoff values for aberrantly expressed miRNAs were |log2FC| ≥2 and FDR <0.05, and for mRNAs, |log2FC| ≥1 and FDR <0.05.
Function enrichment analysis
To investigate potential biological functions and pathways, the online Database for Annotation, Visualization, and Integrated Discovery (DAVID; https://david.ncifcrf.gov/) was used to analyze and visualize Gene Ontology (GO) terms and the Kyoto Encyclopedia of Genes and Genomes (KEGG) pathways.
Identification of critical TF-miRNA-mRNA regulation loops
The FunRich (http://funrich.org) analysis tool was used to predict the differential miRNA TFs (overlapping with DEGs). The TargetScan (http://www.targetscan.org/vert_72/), miRanda (http://www.microrna.org/microrna/home.do), and mirDB (http://mirdb.org/) databases were used to predict biological targets (overlapping with DEGs) of differentially expressed miRNAs (DEMs). TRED (http://rulai.cshl.edu/TRED) was used to annotate transcriptional regulatory factors. TRRUST version2 (https://www.grnpedia.org/trrust/) was used to predict the transcriptional regulatory network. Finally, a TF-miRNA-mRNA network was constructed to show the potential molecular mechanisms of LCNEC oncogenesis and progression.
Statistical analysis
Statistical analysis was performed using R 3.6.3. Numerical data are presented as the mean ± standard deviation. Differences between means were analyzed using Student's t-test. ANOVA analysis was employed to estimate the miRNA and mRNA expression difference among different groups. The significantly DEMs and DEGs were investigated using the limma R package. A threshold value of |log2FC|≥2 and FDR<0.05 of miRNA and |log2FC|≥1

Cai et al. The miRNA-mRNA co-regulatory networks in LCNEC
© Annals of Translational Medicine. All rights reserved. Ann Transl Med 2021;9(2):133 | http://dx.doi.org/10.21037/atm-20-7759
Page 4 of 15
mRNA
Diff-mRNA 2384
Significant difference mRNA 343: up 133
down 210
Overlapping 77 target mRNA
Negative correlation mRNA and miRNA
mRNA transcription factor prediction
miRNA and target network
miRNA mRNA and transcription factor network network netNetwork
miRNA mRNA transcription factor and pathway network
miRNA transcription factor prediction
miRNA KEGG GO analysis
mRNA KEGG GO analysis
miRanda target genes (3658)
TargetScan target genes
(3660)
Overlapping 1685 target
genes
miRNA
Diff-miRNA 594
Significant difference miRNA 60 Up 36 Down 24
Normal 19 vs. Tumor 8
Normal 8 vs. Tumor 11
Figure 1 A flowchart of the study design. miRNA, microRNA; Diff, differentially; KEGG, the Kyoto Encyclopedia of Genes and Genomes; GO, Gene Ontology.
and FDR<0.05 of mRNAs was determined. The heat mapping was performed using ggplot 2 and pheatmap package.
Results
Microarray datasets from the GEO
The mRNA expression profiles were obtained from the GSE1037 dataset, and miRNA profiles were obtained from the GSE19945 dataset. There were 19 normal and 8 LCNEC tissues included in the GSE1037 dataset, while 20 Barrett’s esophagus, 8 normal, and 11 LCNEC tissues were included in the GSE19945 dataset.
Screening LCNEC-related TFs and miRNAs
To identify DEGs, the GEO mRNA expression profile
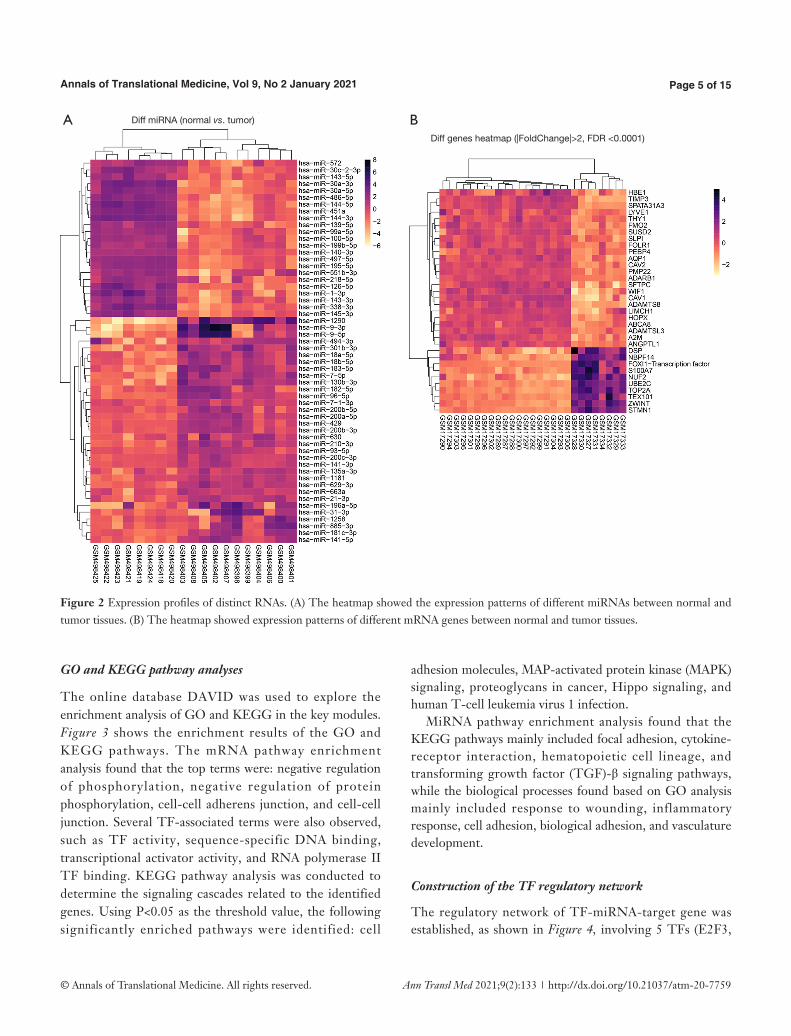
datasets were analyzed. A total of 343 DEGs were finally obtained by examining genes from the GSE1037 dataset (Figure 2). Among the DEGs, 133 genes were up-regulated in LCNEC, while the remaining 210 genes were down-regulated (|log2FC| ≥1, adjusted P value <0.05). The top down-regulated genes (HBE1, TIMP3, SPATA31A3, LYVE1, FMO2, SUSD2, SLPI, FOLR1, PEBP4, AQP1, CAV2, PMP2, ADARB1, LIMCH1, HOPX, ABCA8, ADAMTSL3, A2M, ANGPTL1) and the top up-regulated genes (DSP, NBPF14, FOXI1, S100A7, NUF2, UBE2C, TOP2A, TEX101, ZWINT, STMN1) were identified in the DEGs dataset (Table 1). In particular, the TF FOXI1 was significantly overexpressed in LCNEC. A total of 60 DEMs were identified between LCNEC tissues and normal tissues. Among them, 29 miRNAs were significantly down-regulated in LCNEC, while the other 31 miRNAs were up-regulated (|log2FC| ≥1, adjusted P value <0.05; Figure 2).
Annals of Translational Medicine, Vol 9, No 2 January 2021 Page 5 of 15
© Annals of Translational Medicine. All rights reserved. Ann Transl Med 2021;9(2):133 | http://dx.doi.org/10.21037/atm-20-7759
GO and KEGG pathway analyses
The online database DAVID was used to explore the enrichment analysis of GO and KEGG in the key modules. Figure 3 shows the enrichment results of the GO and KEGG pathways. The mRNA pathway enrichment analysis found that the top terms were: negative regulation of phosphorylation, negative regulation of protein phosphorylation, cell-cell adherens junction, and cell-cell junction. Several TF-associated terms were also observed, such as TF activity, sequence-specific DNA binding, transcriptional activator activity, and RNA polymerase II TF binding. KEGG pathway analysis was conducted to determine the signaling cascades related to the identified genes. Using P<0.05 as the threshold value, the following significantly enriched pathways were identified: cell
adhesion molecules, MAP-activated protein kinase (MAPK) signaling, proteoglycans in cancer, Hippo signaling, and human T-cell leukemia virus 1 infection.
MiRNA pathway enrichment analysis found that the KEGG pathways mainly included focal adhesion, cytokine-receptor interaction, hematopoietic cell lineage, and transforming growth factor (TGF)-β signaling pathways, while the biological processes found based on GO analysis mainly included response to wounding, inflammatory response, cell adhesion, biological adhesion, and vasculature development.
Construction of the TF regulatory network
The regulatory network of TF-miRNA-target gene was established, as shown in Figure 4, involving 5 TFs (E2F3,
Figure 2 Expression profiles of distinct RNAs. (A) The heatmap showed the expression patterns of different miRNAs between normal and tumor tissues. (B) The heatmap showed expression patterns of different mRNA genes between normal and tumor tissues.
A BDiff miRNA (normal vs. tumor)
Diff genes heatmap (|FoldChange|>2, FDR <0.0001)
Cai et al. The miRNA-mRNA co-regulatory networks in LCNEC
© Annals of Translational Medicine. All rights reserved. Ann Transl Med 2021;9(2):133 | http://dx.doi.org/10.21037/atm-20-7759
Page 6 of 15
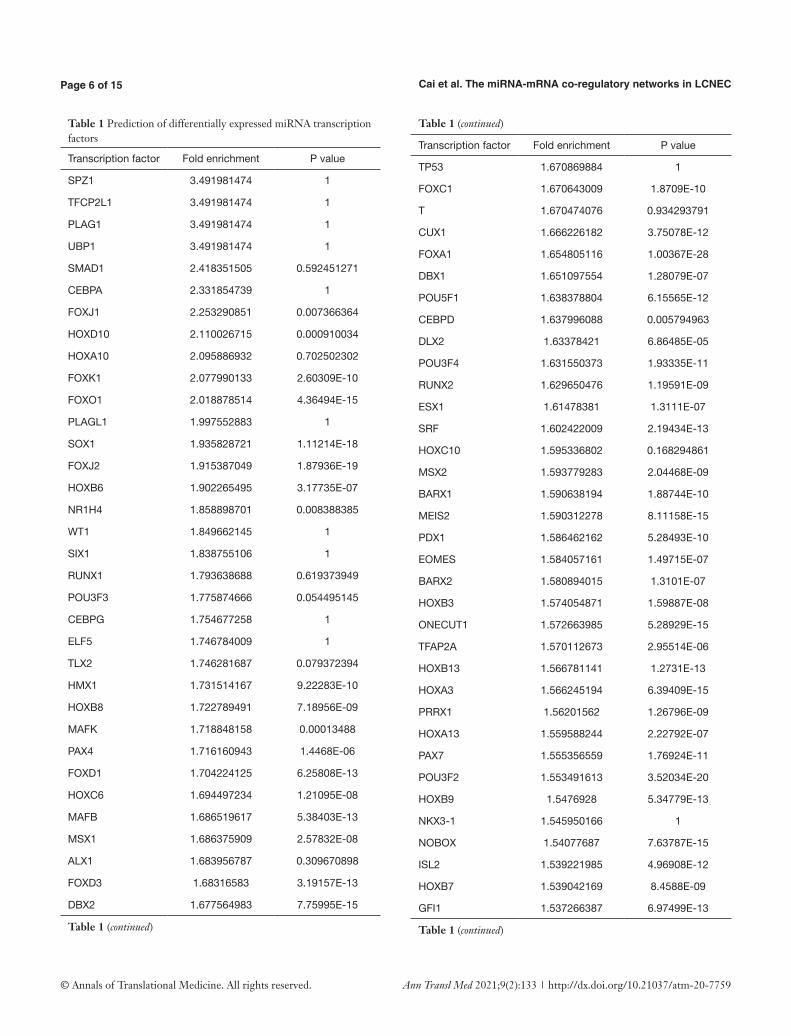
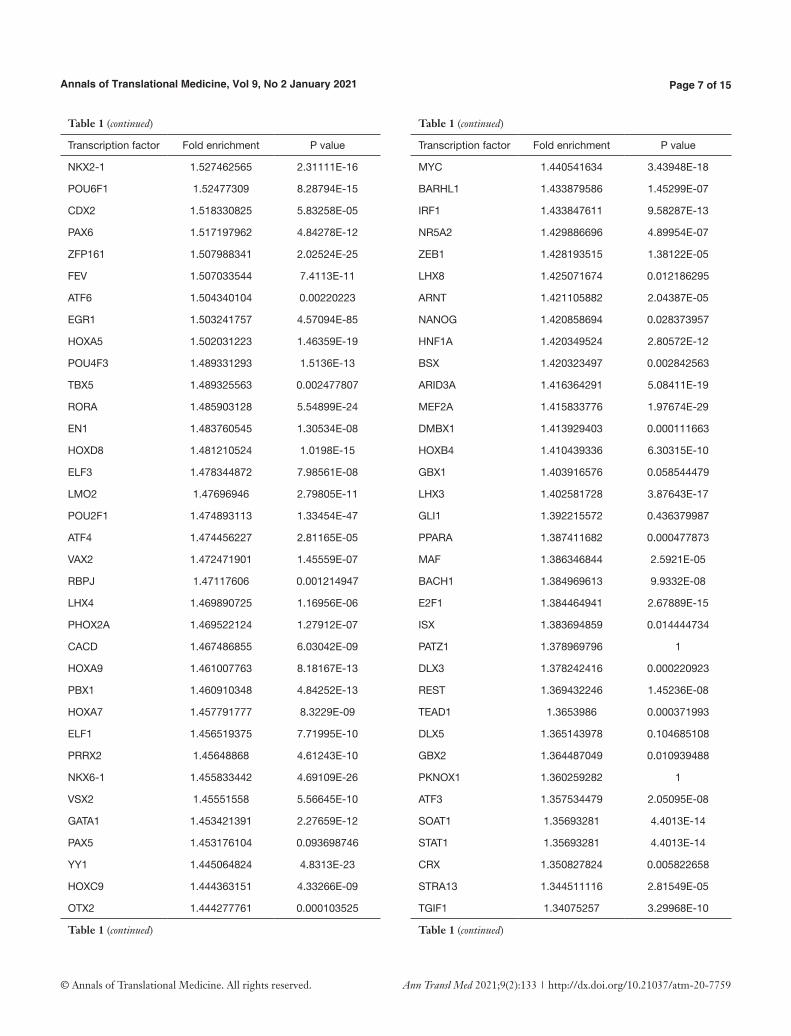
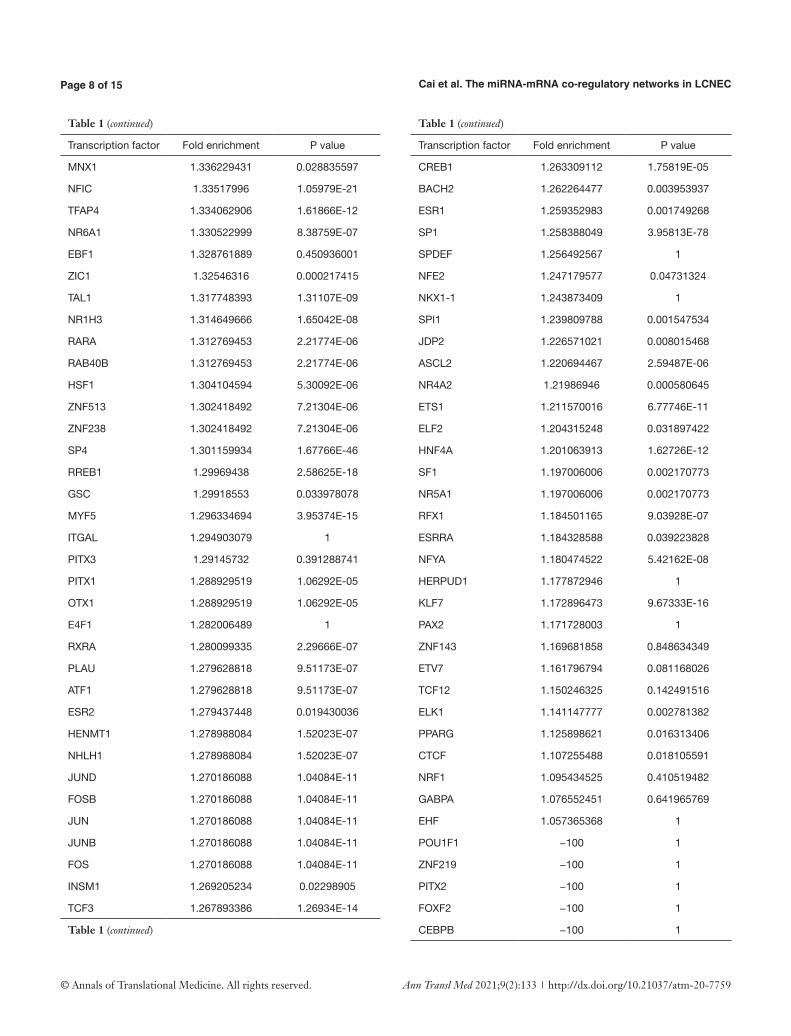
Table 1 Prediction of differentially expressed miRNA transcription factors
Transcription factor Fold enrichment P value
SPZ1 3.491981474 1
TFCP2L1 3.491981474 1
PLAG1 3.491981474 1
UBP1 3.491981474 1
SMAD1 2.418351505 0.592451271
CEBPA 2.331854739 1
FOXJ1 2.253290851 0.007366364
HOXD10 2.110026715 0.000910034
HOXA10 2.095886932 0.702502302
FOXK1 2.077990133 2.60309E-10
FOXO1 2.018878514 4.36494E-15
PLAGL1 1.997552883 1
SOX1 1.935828721 1.11214E-18
FOXJ2 1.915387049 1.87936E-19
HOXB6 1.902265495 3.17735E-07
NR1H4 1.858898701 0.008388385
WT1 1.849662145 1
SIX1 1.838755106 1
RUNX1 1.793638688 0.619373949
POU3F3 1.775874666 0.054495145
CEBPG 1.754677258 1
ELF5 1.746784009 1
TLX2 1.746281687 0.079372394
HMX1 1.731514167 9.22283E-10
HOXB8 1.722789491 7.18956E-09
MAFK 1.718848158 0.00013488
PAX4 1.716160943 1.4468E-06
FOXD1 1.704224125 6.25808E-13
HOXC6 1.694497234 1.21095E-08
MAFB 1.686519617 5.38403E-13
MSX1 1.686375909 2.57832E-08
ALX1 1.683956787 0.309670898
FOXD3 1.68316583 3.19157E-13
DBX2 1.677564983 7.75995E-15
Table 1 (continued)
Table 1 (continued)
Transcription factor Fold enrichment P value
TP53 1.670869884 1
FOXC1 1.670643009 1.8709E-10
T 1.670474076 0.934293791
CUX1 1.666226182 3.75078E-12
FOXA1 1.654805116 1.00367E-28
DBX1 1.651097554 1.28079E-07
POU5F1 1.638378804 6.15565E-12
CEBPD 1.637996088 0.005794963
DLX2 1.63378421 6.86485E-05
POU3F4 1.631550373 1.93335E-11
RUNX2 1.629650476 1.19591E-09
ESX1 1.61478381 1.3111E-07
SRF 1.602422009 2.19434E-13
HOXC10 1.595336802 0.168294861
MSX2 1.593779283 2.04468E-09
BARX1 1.590638194 1.88744E-10
MEIS2 1.590312278 8.11158E-15
PDX1 1.586462162 5.28493E-10
EOMES 1.584057161 1.49715E-07
BARX2 1.580894015 1.3101E-07
HOXB3 1.574054871 1.59887E-08
ONECUT1 1.572663985 5.28929E-15
TFAP2A 1.570112673 2.95514E-06
HOXB13 1.566781141 1.2731E-13
HOXA3 1.566245194 6.39409E-15
PRRX1 1.56201562 1.26796E-09
HOXA13 1.559588244 2.22792E-07
PAX7 1.555356559 1.76924E-11
POU3F2 1.553491613 3.52034E-20
HOXB9 1.5476928 5.34779E-13
NKX3-1 1.545950166 1
NOBOX 1.54077687 7.63787E-15
ISL2 1.539221985 4.96908E-12
HOXB7 1.539042169 8.4588E-09
GFI1 1.537266387 6.97499E-13
Table 1 (continued)
Annals of Translational Medicine, Vol 9, No 2 January 2021 Page 7 of 15
© Annals of Translational Medicine. All rights reserved. Ann Transl Med 2021;9(2):133 | http://dx.doi.org/10.21037/atm-20-7759
Table 1 (continued)
Transcription factor Fold enrichment P value
NKX2-1 1.527462565 2.31111E-16
POU6F1 1.52477309 8.28794E-15
CDX2 1.518330825 5.83258E-05
PAX6 1.517197962 4.84278E-12
ZFP161 1.507988341 2.02524E-25
FEV 1.507033544 7.4113E-11
ATF6 1.504340104 0.00220223
EGR1 1.503241757 4.57094E-85
HOXA5 1.502031223 1.46359E-19
POU4F3 1.489331293 1.5136E-13
TBX5 1.489325563 0.002477807
RORA 1.485903128 5.54899E-24
EN1 1.483760545 1.30534E-08
HOXD8 1.481210524 1.0198E-15
ELF3 1.478344872 7.98561E-08
LMO2 1.47696946 2.79805E-11
POU2F1 1.474893113 1.33454E-47
ATF4 1.474456227 2.81165E-05
VAX2 1.472471901 1.45559E-07
RBPJ 1.47117606 0.001214947
LHX4 1.469890725 1.16956E-06
PHOX2A 1.469522124 1.27912E-07
CACD 1.467486855 6.03042E-09
HOXA9 1.461007763 8.18167E-13
PBX1 1.460910348 4.84252E-13
HOXA7 1.457791777 8.3229E-09
ELF1 1.456519375 7.71995E-10
PRRX2 1.45648868 4.61243E-10
NKX6-1 1.455833442 4.69109E-26
VSX2 1.45551558 5.56645E-10
GATA1 1.453421391 2.27659E-12
PAX5 1.453176104 0.093698746
YY1 1.445064824 4.8313E-23
HOXC9 1.444363151 4.33266E-09
OTX2 1.444277761 0.000103525
Table 1 (continued)
Table 1 (continued)
Transcription factor Fold enrichment P value
MYC 1.440541634 3.43948E-18
BARHL1 1.433879586 1.45299E-07
IRF1 1.433847611 9.58287E-13
NR5A2 1.429886696 4.89954E-07
ZEB1 1.428193515 1.38122E-05
LHX8 1.425071674 0.012186295
ARNT 1.421105882 2.04387E-05
NANOG 1.420858694 0.028373957
HNF1A 1.420349524 2.80572E-12
BSX 1.420323497 0.002842563
ARID3A 1.416364291 5.08411E-19
MEF2A 1.415833776 1.97674E-29
DMBX1 1.413929403 0.000111663
HOXB4 1.410439336 6.30315E-10
GBX1 1.403916576 0.058544479
LHX3 1.402581728 3.87643E-17
GLI1 1.392215572 0.436379987
PPARA 1.387411682 0.000477873
MAF 1.386346844 2.5921E-05
BACH1 1.384969613 9.9332E-08
E2F1 1.384464941 2.67889E-15
ISX 1.383694859 0.014444734
PATZ1 1.378969796 1
DLX3 1.378242416 0.000220923
REST 1.369432246 1.45236E-08
TEAD1 1.3653986 0.000371993
DLX5 1.365143978 0.104685108
GBX2 1.364487049 0.010939488
PKNOX1 1.360259282 1
ATF3 1.357534479 2.05095E-08
SOAT1 1.35693281 4.4013E-14
STAT1 1.35693281 4.4013E-14
CRX 1.350827824 0.005822658
STRA13 1.344511116 2.81549E-05
TGIF1 1.34075257 3.29968E-10
Table 1 (continued)
Cai et al. The miRNA-mRNA co-regulatory networks in LCNEC
© Annals of Translational Medicine. All rights reserved. Ann Transl Med 2021;9(2):133 | http://dx.doi.org/10.21037/atm-20-7759
Page 8 of 15
Table 1 (continued)
Transcription factor Fold enrichment P value
MNX1 1.336229431 0.028835597
NFIC 1.33517996 1.05979E-21
TFAP4 1.334062906 1.61866E-12
NR6A1 1.330522999 8.38759E-07
EBF1 1.328761889 0.450936001
ZIC1 1.32546316 0.000217415
TAL1 1.317748393 1.31107E-09
NR1H3 1.314649666 1.65042E-08
RARA 1.312769453 2.21774E-06
RAB40B 1.312769453 2.21774E-06
HSF1 1.304104594 5.30092E-06
ZNF513 1.302418492 7.21304E-06
ZNF238 1.302418492 7.21304E-06
SP4 1.301159934 1.67766E-46
RREB1 1.29969438 2.58625E-18
GSC 1.29918553 0.033978078
MYF5 1.296334694 3.95374E-15
ITGAL 1.294903079 1
PITX3 1.29145732 0.391288741
PITX1 1.288929519 1.06292E-05
OTX1 1.288929519 1.06292E-05
E4F1 1.282006489 1
RXRA 1.280099335 2.29666E-07
PLAU 1.279628818 9.51173E-07
ATF1 1.279628818 9.51173E-07
ESR2 1.279437448 0.019430036
HENMT1 1.278988084 1.52023E-07
NHLH1 1.278988084 1.52023E-07
JUND 1.270186088 1.04084E-11
FOSB 1.270186088 1.04084E-11
JUN 1.270186088 1.04084E-11
JUNB 1.270186088 1.04084E-11
FOS 1.270186088 1.04084E-11
INSM1 1.269205234 0.02298905
TCF3 1.267893386 1.26934E-14
Table 1 (continued)
Table 1 (continued)
Transcription factor Fold enrichment P value
CREB1 1.263309112 1.75819E-05
BACH2 1.262264477 0.003953937
ESR1 1.259352983 0.001749268
SP1 1.258388049 3.95813E-78
SPDEF 1.256492567 1
NFE2 1.247179577 0.04731324
NKX1-1 1.243873409 1
SPI1 1.239809788 0.001547534
JDP2 1.226571021 0.008015468
ASCL2 1.220694467 2.59487E-06
NR4A2 1.21986946 0.000580645
ETS1 1.211570016 6.77746E-11
ELF2 1.204315248 0.031897422
HNF4A 1.201063913 1.62726E-12
SF1 1.197006006 0.002170773
NR5A1 1.197006006 0.002170773
RFX1 1.184501165 9.03928E-07
ESRRA 1.184328588 0.039223828
NFYA 1.180474522 5.42162E-08
HERPUD1 1.177872946 1
KLF7 1.172896473 9.67333E-16
PAX2 1.171728003 1
ZNF143 1.169681858 0.848634349
ETV7 1.161796794 0.081168026
TCF12 1.150246325 0.142491516
ELK1 1.141147777 0.002781382
PPARG 1.125898621 0.016313406
CTCF 1.107255488 0.018105591
NRF1 1.095434525 0.410519482
GABPA 1.076552451 0.641965769
EHF 1.057365368 1
POU1F1 −100 1
ZNF219 −100 1
PITX2 −100 1
FOXF2 −100 1
CEBPB −100 1

Annals of Translational Medicine, Vol 9, No 2 January 2021 Page 9 of 15
© Annals of Translational Medicine. All rights reserved. Ann Transl Med 2021;9(2):133 | http://dx.doi.org/10.21037/atm-20-7759
Figure 3 GO enrichment annotations and KEGG pathway analysis of the pathological progression of LCNEC. The top terms were synapse (GO: 0045202), cytoskeleton (GO: 0005856), postsynaptic density (GO: 0014069), cell-cell adherens junction (GO: 0005913), dendrite (GO: 0030425), axon (GO: 0030424), and neuron projection (GO: 0043005). (A,B) GO terms. (C,D) KEGG terms. Significantly enriched pathways featured P<0.05. The analysis was conducted using the DAVID (https://david.ncifcrf.gov/summary.jsp) database. GO, Gene Ontology; KEGG, the Kyoto Encyclopedia of Genes and Genomes; LCNEC, large cell neuroendocrine carcinoma.
A
B
D
C

Cai et al. The miRNA-mRNA co-regulatory networks in LCNEC
© Annals of Translational Medicine. All rights reserved. Ann Transl Med 2021;9(2):133 | http://dx.doi.org/10.21037/atm-20-7759
Page 10 of 15
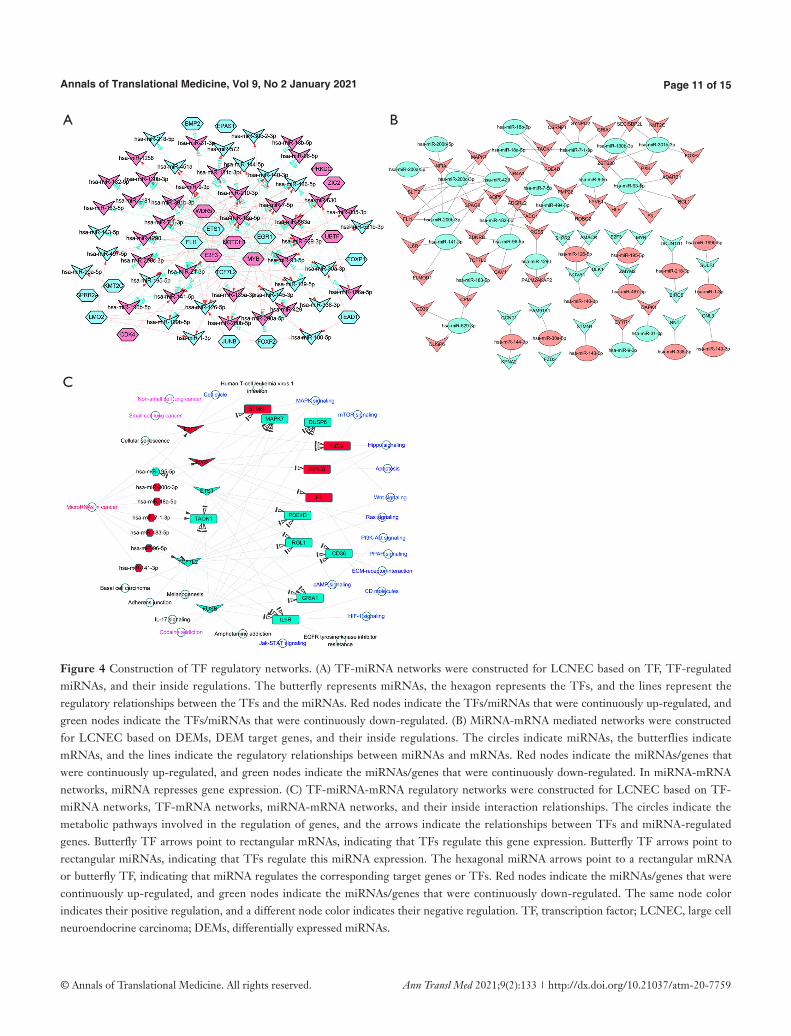
MYB, ETS1, TCF7L2, FOSB), 7 miRNAs (has-miR-195-5p, has-miR-200c-3p, has-miR-18a-5p, has-miR-7-1-3p, has-miR-183-5p, has-miR-96-5p, has-miR-141-3p), and 12 hub genes (TAOK1, STMN1, MAPK7, DUSP6, FZD3, BIRC5, F3, PDE4D, RGL1, CD36, GRIA1, IL6R). The key regulatory network modules included ETS1-miR195-CD36, TAOK1-miR7-1-3P-GRIA1, E2F3-miR195-CD36, and TEAD1-miR30A-CTHRC1.
Discussion
LCNEC of the lung is a rare but highly aggressive tumor. LCNEC presents with a high gene mutation rate, and genetic alterations have predictive value for chemotherapy outcome (24). However, the pattern and function of these dysregulated mRNAs and miRNAs have not been fully recognized. In this study, we identified 343 DEGs (including 133 up-regulated and 210 down-regulated genes) and 60 DEMs (including 31 up-regulated and 29 down-regulated miRNAs) in LCNEC tissues compared with normal tissues.
We also found several critical genes and pathways in the transcriptome with biological significance in this study. First, stathmin 1 (STMN1), a member of the stathmin family, acts as a microtubule destabilizer to regulate the cell cycle. The activation of the STMN1 pathway promotes lung cancer cell invasion, migration, and resistance to tyrosine kinase inhibitors (25,26). STMN1 overexpression predicts poor survival in multiple solid tumors, including lung cancer (27). High STMN1 expression is also associated with cancer progression and chemoresistance in lung squamous cell carcinoma (28). Similar to our results, Shimizu et al. reported that all 17 LCNEC samples expressed a high level of STMN1 in their study, indicating that STMN1 might be a potential diagnostic marker for high-grade lung neuroendocrine tumors (29). Second, we identified the Wnt signaling pathway, which plays a role in the development of lung cancer (30). Wnt inhibitory factor 1 (WIF1) directly binds to Wnt proteins to inhibit the Wnt signaling pathway, functioning as a tumor suppressor. WIF1 is down-regulated in both lung squamous cell carcinomas and adenocarcinomas, and negative WIF1 expression is significantly associated with high malignancy and metastasis of lung cancer (31). However, WIF1 expression is not associated with survival (31).
Third, we identified tissue inhibitor of metalloproteinases (TIMPs). TIMPs are the most important inhibitors of metalloproteinase function, and TIMP3 is commonly down-regulated in most cancer types (32). TIMP3 expression
is also low in lung cancer, and has a negative correlation with cancer stage and prognosis (33). Yun et al. found that interleukin-32 gamma suppressed lung tumor development by up-regulating TIMP3 (34).
Fourth, caveolins (CAVs), including CAV1, CAV2, and CAV3, are a family of proteins known to regulate cholesterol distribution, signal transduction, cell migration, and endocytic vesicular trafficking (35). Cav-1 functions as a tumor suppressor in SCLC and is inversely required for tumor cell survival and growth in NSCLC (36). For female lung cancer patients who never smoked, low expression of CAV1 was associated with a worse overall survival (37). Furthermore, the overexpression of CAV1 inhibited lung adenocarcinoma cell proliferation (38). Cav-1 expression in pleomorphic carcinoma of the lung is correlated with a poor prognosis (39). And CAV1 can enhance brain metastasis of non-small cell lung cancer (40). Therefore, it may serve as a predictor of LCNECs.
Finally, NUF2 was found in most of the GO terms. Many studies have clarified the relationship between NUF2 and cancer initiation or development. In an association study, Xu et al. found that NUF2 was a prognostic marker in breast cancer (41). The relationship between NUF2 and cancer was also demonstrated by Wang et al. NUF2 is a valuable prognostic biomarker that can predict early recurrence of hepatocellular carcinoma after surgical resection (42). However, the association between NUF2 and LCNEC metastasis remains unclear, and further studies are still needed.
Of the up-regulated miRNAs, several have been demonstrated to be onco-miRNAs in lung cancer. MiR-1290 promote cell stemness and invasiveness of NSCLC (43). MiR-301b-3p contributes to cell proliferation, invasion, and drug resistance of NSCLC through repressing transforming growth factor-beta receptor II (TGFBR2) (44). MiR-183-5p and miR-18a-5p induce NSCLC progression by targeting phosphatase and tensin homolog (PTEN) and interferon regulatory factor 2 (IRF2), respectively (45,46). The suppression of miR-96-5p inhibited EMT and metastasis of NSCLC (47). The down-regulated miRNAs identified in this study also function as tumor suppressors in lung cancer. MiR-144-5p increased the radiosensitivity of NSCLC cells by repressing activating transcription factor 2 (ATF2) (48), and miR-451a decreased doxorubicin resistance in lung cancer via suppressing c-Myc (49). MiR-144-3p and miR-30a-3p inhibited the progression of lung cancer via targeting enhancer of zeste homolog 2 (EZH2) and DNA methyltransferase 3a (50,51). The long non-coding
Annals of Translational Medicine, Vol 9, No 2 January 2021 Page 11 of 15
© Annals of Translational Medicine. All rights reserved. Ann Transl Med 2021;9(2):133 | http://dx.doi.org/10.21037/atm-20-7759
Figure 4 Construction of TF regulatory networks. (A) TF-miRNA networks were constructed for LCNEC based on TF, TF-regulated miRNAs, and their inside regulations. The butterfly represents miRNAs, the hexagon represents the TFs, and the lines represent the regulatory relationships between the TFs and the miRNAs. Red nodes indicate the TFs/miRNAs that were continuously up-regulated, and green nodes indicate the TFs/miRNAs that were continuously down-regulated. (B) MiRNA-mRNA mediated networks were constructed for LCNEC based on DEMs, DEM target genes, and their inside regulations. The circles indicate miRNAs, the butterflies indicate mRNAs, and the lines indicate the regulatory relationships between miRNAs and mRNAs. Red nodes indicate the miRNAs/genes that were continuously up-regulated, and green nodes indicate the miRNAs/genes that were continuously down-regulated. In miRNA-mRNA networks, miRNA represses gene expression. (C) TF-miRNA-mRNA regulatory networks were constructed for LCNEC based on TF-miRNA networks, TF-mRNA networks, miRNA-mRNA networks, and their inside interaction relationships. The circles indicate the metabolic pathways involved in the regulation of genes, and the arrows indicate the relationships between TFs and miRNA-regulated genes. Butterfly TF arrows point to rectangular mRNAs, indicating that TFs regulate this gene expression. Butterfly TF arrows point to rectangular miRNAs, indicating that TFs regulate this miRNA expression. The hexagonal miRNA arrows point to a rectangular mRNA or butterfly TF, indicating that miRNA regulates the corresponding target genes or TFs. Red nodes indicate the miRNAs/genes that were continuously up-regulated, and green nodes indicate the miRNAs/genes that were continuously down-regulated. The same node color indicates their positive regulation, and a different node color indicates their negative regulation. TF, transcription factor; LCNEC, large cell neuroendocrine carcinoma; DEMs, differentially expressed miRNAs.
A B
C

Cai et al. The miRNA-mRNA co-regulatory networks in LCNEC
© Annals of Translational Medicine. All rights reserved. Ann Transl Med 2021;9(2):133 | http://dx.doi.org/10.21037/atm-20-7759
Page 12 of 15
RNA RMRP sponged miR-1-3p to promote NSCLC cell proliferation and invasion (52). Moreover, miR-126-5p, miR-486-5p, miR-338-3p, miR-126-3p, and miR-145-5p have all be shown to block the progression of lung cancer (53-56).
The pathway enrichment analysis revealed that the altered signaling pathways in LCNEC mainly focused on focal adhesion, cytokine-receptor interaction, hematopoietic cell lineage, and the TGF-β signaling pathway, while the biological processes mainly included response to wounding, inflammatory response, cell adhesion, biological adhesion, and vasculature development. Focal adhesion is a process of cellular attachment by linking the actin cytoskeleton to components of the extracellular matrix via integrins, and focal adhesion kinase (FAK) plays a pivotal role in focal adhesion regulation (57). FAK promotes lung cancer progression and drug resistance (58,59), and is essential for the formation of an aggressive phenotype of NSCLC with mutant KRAS (60). TGF-β signaling pathway regulates cell apoptosis, motility, invasion, extracellular matrix production, angiogenesis, and immune function. In lung adenocarcinoma cells, the TGF-β signaling pathway mediates EMT processes mostly via the Smad pathways (61). However, the activation of the TGF-β signaling pathway is suppressed in SCLC cells (62). Recently, Li et al. analyzed 8 studies involving 579 patients with lung cancer and concluded that high TGF-β expression was an indicator of poor survival (63).
We identified TF-miRNA-mRNA regulation loops, such as module ETS1-miR195-CD36, TAOK1-miR7-1-3P-GRIA1, E2F3-miR195-CD36, and TEAD1-miR30A-CTHRC1, which might play important roles in LCNEC. Twelve hub mRNAs were selected out, including TAOK1, STMN1, MAPK7, DUSP6, FZD3, BIRC5, F3, PDE4D, RGL1, CD36, GRIA1, and IL6R. ETS1 overexpression in breast cancers is associated with invasiveness, and predicts poor prognosis (64). ETS1 also promotes NSCLC cell migration and invasion (65). Jiang et al. showed that ERK5, also known as MAPK7, was activated during lung cancer development, and ectopic expression of ERK5 promoted cell proliferation and G2/M cell cycle transition. Furthermore, they found that ERK5 is a potential regulator of radiosensitivity (66). Moncho-Amor et al. showed that DUSP6 plays a major role in the regulation of cell migration, motility, and tumor growth in NSCLC cells (67).
Our study has some limitations. First, the number of samples was relatively small, which may have introduced some bias. Second, verification experiments are lacking, and
wet laboratory experiments are warranted to confirm these novel targets.
Conclusions
Overall, bioinformatics analysis of mRNA and miRNA expression profi les identif ied TF-miRNA-mRNA regulation loops that might play important roles in LCNEC metastasis. These results also contribute towards a deeper understanding of the genetic mechanisms of LCNEC, and unveil potential targets for clinical treatment.
Acknowledgments
Funding: None.
Footnote
Reporting Checklist: The authors have completed the MDAR checklist. Available at http://dx.doi.org/10.21037/atm-20-7759
Conflicts of Interest: All authors have completed the ICMJE uniform disclosure form (available at http://dx.doi.org/10.21037/atm-20-7759). The authors have no conflicts of interest to declare.
Ethical Statement: The authors are accountable for all aspects of the work in ensuring that questions related to the accuracy or integrity of any part of the work are appropriately investigated and resolved. The study was conducted in accordance with the Declaration of Helsinki (as revised in 2013). All the data in the manuscript is from the published database.
Open Access Statement: This is an Open Access article distributed in accordance with the Creative Commons Attribution-NonCommercial-NoDerivs 4.0 International License (CC BY-NC-ND 4.0), which permits the non-commercial replication and distribution of the article with the strict proviso that no changes or edits are made and the original work is properly cited (including links to both the formal publication through the relevant DOI and the license). See: https://creativecommons.org/licenses/by-nc-nd/4.0/.
References
1. Travis WD, Linnoila RI, Tsokos MG, et al. Neuroendocrine Tumors of the Lung With Proposed

Annals of Translational Medicine, Vol 9, No 2 January 2021 Page 13 of 15
© Annals of Translational Medicine. All rights reserved. Ann Transl Med 2021;9(2):133 | http://dx.doi.org/10.21037/atm-20-7759
Criteria for Large-Cell Neuroendocrine Carcinoma: An Ultrastructural, Immunohistochemical, and Flow Cytometric Study of 35 Cases. Am J Surg Pathol 1991;15:529-53.
2. Travis WD, Brambilla E, Nicholson AG, et al. The 2015 World Health Organization Classification of Lung Tumors: Impact of Genetic, Clinical and Radiologic Advances Since the 2004 Classification. J Thorac Oncol 2015;10:1243-60.
3. Benfield JR. Neuroendocrine neoplasms of the lung. J Thorac Cardiovasc Surg 1990;100:628-9.
4. Marchevsky AM, Gal AA, Swati S, et al. Morphometry Confirms the Presence of Considerable Nuclear Size Overlap Between “Small Cells” and “Large Cells” in High-Grade Pulmonary Neuroendocrine Neoplasms. Am J Clin Pathol 2001;116:466-72.
5. Gerber DE, Paik PK, Dowlati A. Beyond Adenocarcinoma: Current Treatments and Future Directions for Squamous, Small Cell, and Rare Lung Cancer Histologies. Am Soc Clin Oncol Educ Book 2015;147-62.
6. Iyoda A, Hiroshima K, Nakatani Y, et al. Pulmonary Large Cell Neuroendocrine Carcinoma: Its Place in the Spectrum of Pulmonary Carcinoma. Ann Thorac Surg 2007;84:702-7.
7. Derks JL, van Suylen RJ, Thunnissen E, et al. Chemotherapy for pulmonary large cell neuroendocrine carcinomas: does the regimen matter? Eur Respir J 2017;49:1601838.
8. Hughes TR. Introduction to "a handbook of transcription factors". Subcell Biochem 2011;52:1-6.
9. Redell MS, Tweardy DJ. Targeting transcription factors in cancer: Challenges and evolving strategies. Drug Discov Today Technol 2006;3:261-7.
10. Folpe AL, Gown AM, Lamps LW, et al. Thyroid transcription factor-1: Immunohistochemical evaluation in pulmonary neuroendocrine tumors. Mod Pathol 1999;12:5-8.
11. Huang YH, Klingbeil O, He XY, et al. POU2F3 is a master regulator of a tuft cell-like variant of small cell lung cancer. Genes Dev 2018;32:915-28.
12. Hung JJ, Yang MH, Hsu HS, et al. Prognostic significance of hypoxia-inducible factor-1alpha, TWIST1 and Snail expression in resectable non-small cell lung cancer. Thorax 2009;64:1082-9.
13. Jin D, Guo J, Wu Y, et al. Metformin-repressed miR-381-YAP-snail axis activity disrupts NSCLC growth and metastasis. J Exp Clin Cancer Res 2020;39:6.
14. Schneider T, Kimpfler S, Warth A, et al. Foxp3(+)
regulatory T cells and natural killer cells distinctly infiltrate primary tumors and draining lymph nodes in pulmonary adenocarcinoma. J Thorac Oncol 2011;6:432-8.
15. Shih DJH, Nayyar N, Bihun I, et al. Genomic characterization of human brain metastases identifies drivers of metastatic lung adenocarcinoma. Nat Genet 2020;52:371-7.
16. Doench JG, Sharp PA. Specificity of microRNA target selection in translational repression. Genes Dev 2004;18:504-11.
17. Ebert MS, Sharp PA. Roles for MicroRNAs in Conferring Robustness to Biological Processes. Cell 2012;149:515-24.
18. Yanaihara N, Caplen N, Bowman E, et al. Unique microRNA molecular profiles in lung cancer diagnosis and prognosis. Cancer Cell 2006;9:189-98.
19. Yu SL, Chen HY, Chang GC, et al. MicroRNA signature predicts survival and relapse in lung cancer. Cancer Cell 2008;13:48-57.
20. Lee HW, Lee EH, Ha SY, et al. Altered expression of microRNA miR-21, miR-155, and let-7a and their roles in pulmonary neuroendocrine tumors. Pathol Int 2012;62:583-91.
21. Takamizawa J. Reduced Expression of the let-7 MicroRNAs in Human Lung Cancers in Association with Shortened Postoperative Survival. Cancer Res 2004;64:3753-6.
22. He L, Thomson JM, Hemann MT, et al. A microRNA polycistron as a potential human oncogene. Nature 2005;435:828-33.
23. Chandra Mangalhara K, Manvati S, Saini SK, et al. ERK2-ZEB1-miR-101-1 axis contributes to epithelial–mesenchymal transition and cell migration in cancer. Cancer Lett 2017;391:59-73.
24. Derks JL, Leblay N, Thunnissen E, et al. Molecular Subtypes of Pulmonary Large-cell Neuroendocrine Carcinoma Predict Chemotherapy Treatment Outcome. Clin Cancer Res 2018;24:33-42.
25. Li M, Yang J, Zhou W, et al. Activation of an AKT/FOXM1/STMN1 pathway drives resistance to tyrosine kinase inhibitors in lung cancer. Br J Cancer 2017;117:974-83.
26. Zhang J, Fu J, Pan Y, et al. Silencing of miR-1247 by DNA methylation promoted non-small-cell lung cancer cell invasion and migration by effects of STMN1. Onco Targets Ther 2016;9:7297-307.
27. Zhang D, Dai L, Yang Z, et al. Association of STMN1 with survival in solid tumors: A systematic review and meta-analysis. Int J Biol Markers 2019;34:108-16.

Cai et al. The miRNA-mRNA co-regulatory networks in LCNEC
© Annals of Translational Medicine. All rights reserved. Ann Transl Med 2021;9(2):133 | http://dx.doi.org/10.21037/atm-20-7759
Page 14 of 15
28. Bao P, Yokobori T, Altan B, et al. High STMN1 Expression is Associated with Cancer Progression and Chemo-Resistance in Lung Squamous Cell Carcinoma. Ann Surg Oncol 2017;24:4017-24.
29. Shimizu K, Goto Y, Kawabata-Iwakawa R, et al. Stathmin-1 Is a Useful Diagnostic Marker for High-Grade Lung Neuroendocrine Tumors. Ann Thorac Surg 2019;108:235-43.
30. Tennis M, Van Scoyk M, Winn RA. Role of the wnt signaling pathway and lung cancer. J Thorac Oncol 2007;2:889-92.
31. Zhang Y, Hu C. WIF-1 and Ihh Expression and Clinical Significance in Patients With Lung Squamous Cell Carcinoma and Adenocarcinoma. Appl Immunohistochem Mol Morphol 2018;26:454-61.
32. Jackson HW, Defamie V, Waterhouse P, et al. TIMPs: versatile extracellular regulators in cancer. Nat Rev Cancer 2017;17:38-53.
33. Lei Y, Liu Z, Yang W. Negative correlation of cytoplasm TIMP3 with miR-222 indicates a good prognosis for NSCLC. Onco Targets Ther 2018;11:5551-7.
34. Yun J, Park MH, Son DJ, et al. IL-32 gamma reduces lung tumor development through upregulation of TIMP-3 overexpression and hypomethylation. Cell Death Dis 2018;9:306.
35. Nwosu ZC, Ebert MP, Dooley S, et al. Caveolin-1 in the regulation of cell metabolism: a cancer perspective. Mol Cancer 2016;15:71.
36. Sunaga, N. Different Roles for Caveolin-1 in the Development of Non-Small Cell Lung Cancer versus Small Cell Lung Cancer. Cancer Res 2004;64:4277-85.
37. Shi K, Li N, Yang M, et al. Identification of Key Genes and Pathways in Female Lung Cancer Patients Who Never Smoked by a Bioinformatics Analysis. J Cancer 2019;10:51-60.
38. Yan Y, Xu Z, Qian L, et al. Identification of CAV1 and DCN as potential predictive biomarkers for lung adenocarcinoma. Am J Physiol Lung Cell Mol Physiol 2019;316:L630-43.
39. Moon KC, Lee GK, Yoo S, et al. Expression of Caveolin-1 in Pleomorphic Carcinoma of the Lung is Correlated with a Poor Prognosis. Anticancer Res 2005;25:4631-7.
40. Kim YJ, Kim J, Kim O. et al. Caveolin-1 enhances brain metastasis of non-small cell lung cancer, potentially in association with the epithelial-mesenchymal transition marker SNAIL. Cancer Cell Int 2019;19:171.
41. Xu W, Wang Y, Wang Y, et al. Screening of differentially expressed genes and identification of NUF2 as a prognostic
marker in breast cancer. Int J Mol Med 2019;44:390-404. 42. Wang Y, Tan P, Handoko Y, et al. NUF2 is a valuable
prognostic biomarker to predict early recurrence of hepatocellular carcinoma after surgical resection. Int J cancer 2019;145:662-70.
43. Kim G, An HJ, Lee MJ, et al. Hsa-miR-1246 and hsa-miR-1290 are associated with stemness and invasiveness of non-small cell lung cancer. Lung Cancer 2016;91:15-22.
44. Li P, Xing W, Xu J, et al. microRNA-301b-3p downregulation underlies a novel inhibitory role of long non-coding RNA MBNL1-AS1 in non-small cell lung cancer. Stem Cell Res Ther 2019;10:144.
45. Wang H, Ma Z, Liu X, et al. MiR-183-5p is required for non-small cell lung cancer progression by repressing PTEN. Biomed Pharmacother 2019;111:1103-11.
46. Liang C, Zhang X, Wang HM, et al. MicroRNA-18a-5p functions as an oncogene by directly targeting IRF2 in lung cancer. Cell Death Dis 2017;8:e2764.
47. Wei S, Zheng Y, Jiang Y, et al. The circRNA circPTPRA suppresses epithelial-mesenchymal transitioning and metastasis of NSCLC cells by sponging miR-96-5p. EBioMedicine 2019;44:182-93.
48. Song L, Peng L, Hua S, et al. miR-144-5p Enhances the Radiosensitivity of Non-Small-Cell Lung Cancer Cells via Targeting ATF2. Biomed Res Int 2018;2018:5109497.
49. Tao L, Wang S, Hao J, et al. MiR-451a attenuates doxorubicin resistance in lung cancer via suppressing epithelialmesenchymal transition (EMT) through targeting c-Myc. Biomed Pharmacother 2020;125:109962.
50. Liu C, Yang Z, Deng Z, et al. Downregulated miR-144-3p contributes to progression of lung adenocarcinoma through elevating the expression of EZH2. Cancer Med 2018;7:5554-66.
51. Wei D, Yu G, Zhao Y. MicroRNA-30a-3p inhibits the progression of lung cancer via the PI3K/AKT by targeting DNA methyltransferase 3a. Onco Targets Ther 2019;12:7015-24.
52. Wang Y, Luo X, Liu Y, et al. Long noncoding RNA RMRP promotes proliferation and invasion via targeting miR-1-3p in non-small-cell lung cancer. J Cell Biochem 2019;120:15170-81.
53. Guo R, Hu T, Liu Y, et al. Long non-coding RNA PRNCR1 modulates non-small cell lung cancer cells proliferation, apoptosis, migration, invasion and EMT through PRNCR1/miR-126-5p/MTDH axis. Biosci Rep 2020;40:BSR20193153.
54. Chen T, Zhu J, Cai T, et al. Suppression of non-small cell lung cancer migration and invasion by hsa-miR-486-5p

Annals of Translational Medicine, Vol 9, No 2 January 2021 Page 15 of 15
© Annals of Translational Medicine. All rights reserved. Ann Transl Med 2021;9(2):133 | http://dx.doi.org/10.21037/atm-20-7759
via the TGF-beta/SMAD2 signaling pathway. J Cancer 2019;10:6014-24.
55. Xu Y, Yu J, Huang Z, et al. Circular RNA hsa_circ_0000326 acts as a miR-338-3p sponge to facilitate lung adenocarcinoma progression. J Exp Clin Cancer Res 2020;39:57.
56. Liu R, Zhang YS, Zhang S, et al. MiR-126-3p suppresses the growth, migration and invasion of NSCLC via targeting CCR1. Eur Rev Med Pharmacol Sci 2019;23:679-89.
57. Sulzmaier FJ, Jean C, Schlaepfer DD. FAK in cancer: mechanistic findings and clinical applications. Nat Rev Cancer 2014;14:598-610.
58. Wang B, Qi X, Li D, et al. Expression of pY397 FAK promotes the development of non-small cell lung cancer. Oncol Lett 2016;11:979-83.
59. Lu H, Wang L, Gao W, et al. IGFBP2/FAK pathway is causally associated with dasatinib resistance in non-small cell lung cancer cells. Mol Cancer Ther 2013;12:2864-73.
60. Konstantinidou G, Ramadori G, Torti F, et al. RHOA-FAK is a required signaling axis for the maintenance of KRAS-driven lung adenocarcinomas. Cancer Discov 2013;3:444-57.
61. Lai XN, Li J, Tang LB, et al. MiRNAs and LncRNAs:
Dual Roles in TGF-beta Signaling-Regulated Metastasis in Lung Cancer. Int J Mol Sci 2020;21:1193.
62. Miyazono K, Katsuno Y, Koinuma D, et al. Intracellular and extracellular TGF-beta signaling in cancer: some recent topics. Front Med 2018;12:387-411.
63. Li J, Shen C, Wang X, et al. Prognostic value of TGF-beta in lung cancer: systematic review and meta-analysis. BMC Cancer 2019;19:691.
64. Furlan A, Vercamer C, Heliot L, et al. Ets-1 drives breast cancer cell angiogenic potential and interactions between breast cancer and endothelial cells. Int J Oncol 2019;54:29-40.
65. Zhou X, Zhou R, Zhou H, et al. ETS-1 Induces Endothelial-Like Differentiation and Promotes Metastasis in Non-Small Cell Lung Cancer. Cell Physiol Biochem 2018;45:1827-39.
66. Jiang W, Jin G, Cai F, et al. Extracellular signal-regulated kinase 5 increases radioresistance of lung cancer cells by enhancing the DNA damage response. Exp Mol Med 2019;51:1-20.
67. Moncho-Amor V, Pintado-Berninches L, Ibañez de Cáceres I, et al. Role of Dusp6 Phosphatase as a Tumor Suppressor in Non-Small Cell Lung Cancer. Int J Mol Sci 2019;20:2036.
Cite this article as: Cai C, Zeng Q, Zhou G, Mu X. Identification of novel transcription factor-microRNA-mRNA co-regulatory networks in pulmonary large-cell neuroendocrine carcinoma. Ann Transl Med 2021;9(2):133. doi: 10.21037/atm-20-7759