angiogenic mrna and microrna gene expression...
TRANSCRIPT

Angiogenic mRNA and microRNA Gene ExpressionSignature Predicts a Novel Subtype of Serous OvarianCancerStefan Bentink1,6., Benjamin Haibe-Kains1,6., Thomas Risch1, Jian-Bing Fan3, Michelle S. Hirsch4,7,
Kristina Holton1, Renee Rubio1, Craig April3, Jing Chen3, Eliza Wickham-Garcia3, Joyce Liu2,7, Aedin
Culhane1,6, Ronny Drapkin4,5,7, John Quackenbush1,2,6*", Ursula A. Matulonis5,7"
1 Department of Biostatistics and Computational Biology, Dana-Farber Cancer Institute, Boston, Massachusetts, United States of America, 2 Department of Cancer Biology,
Dana-Farber Cancer Institute, Boston, Massachusetts, United States of America, 3 Illumina, Inc., San Diego, California, United States of America, 4 Department of Pathology,
Division of Woman’s and Perinatal Pathology, Brigham and Women’s Hospital, Boston, Massachusetts, United States of America, 5 Department of Medical Oncology, Dana-
Farber Cancer Institute, Boston, Massachusetts, United States of America, 6 Harvard School of Public Health, Boston, Massachusetts, United States of America, 7 Harvard
Medical School, Boston, Massachusetts, United States of America
Abstract
Ovarian cancer is the fifth leading cause of cancer death for women in the U.S. and the seventh most fatal worldwide.Although ovarian cancer is notable for its initial sensitivity to platinum-based therapies, the vast majority of patientseventually develop recurrent cancer and succumb to increasingly platinum-resistant disease. Modern, targeted cancer drugsintervene in cell signaling, and identifying key disease mechanisms and pathways would greatly advance our treatmentabilities. In order to shed light on the molecular diversity of ovarian cancer, we performed comprehensive transcriptionalprofiling on 129 advanced stage, high grade serous ovarian cancers. We implemented a, re-sampling based version of theISIS class discovery algorithm (rISIS: robust ISIS) and applied it to the entire set of ovarian cancer transcriptional profiles. rISISidentified a previously undescribed patient stratification, further supported by micro-RNA expression profiles, and gene setenrichment analysis found strong biological support for the stratification by extracellular matrix, cell adhesion, andangiogenesis genes. The corresponding ‘‘angiogenesis signature’’ was validated in ten published independent ovariancancer gene expression datasets and is significantly associated with overall survival. The subtypes we have defined are ofpotential translational interest as they may be relevant for identifying patients who may benefit from the addition of anti-angiogenic therapies that are now being tested in clinical trials.
Citation: Bentink S, Haibe-Kains B, Risch T, Fan J-B, Hirsch MS, et al. (2012) Angiogenic mRNA and microRNA Gene Expression Signature Predicts a Novel Subtypeof Serous Ovarian Cancer. PLoS ONE 7(2): e30269. doi:10.1371/journal.pone.0030269
Editor: Chad Creighton, Baylor College of Medicine, United States of America
Received October 19, 2011; Accepted December 12, 2011; Published February 13, 2012
Copyright: � 2012 Bentink et al. This is an open-access article distributed under the terms of the Creative Commons Attribution License, which permitsunrestricted use, distribution, and reproduction in any medium, provided the original author and source are credited.
Funding: This work was supported by grants from the Dana-Farber/Harvard Cancer Center Women’s Cancer Program, the Claudia Adams Barr Foundation, theKittredge Foundation, and the Dana-Farber Cancer Institute High Tech Fund. Additional support was provided by a grant from the National Cancer Institute (3P50CA105009-05S1). The DASL assays were provided by Illumina, Inc. The funders had no role in study design, data collection and analysis, decision to publish, orpreparation of the manuscript.
Competing Interests: The assays used in deriving the angiogenic signature from patients at the Dana-Farber Cancer Institute and Brigham and Women’sHospital were performed by scientists at Illumina, who market the DASL. Authors Jian-Bing Fan, Craig April, Jing Chen and Eliza Wickham-Garcia are employed byIllumina, Inc., a commercial company. This does not alter the authors’ adherence to all the PLoS ONE policies on sharing data and materials and all data have beendeposited in ArrayExpress.
* E-mail: [email protected]
. These authors contributed equally to this work.
" These authors also contributed equally to this work.
Introduction
Advanced epithelial ovarian cancer is notable for initial
sensitivity to platinum- and taxane-based chemotherapy [1,2],
but the vast majority of women will develop recurrent ovarian
cancer within 12 to 24 months and will eventually die from
increasingly platinum- and chemotherapy-resistant disease. One
possible reason that ovarian cancer remains refractory to therapy
is that there are distinct molecular subtypes, which different
cellular properties, each of which may require different therapeutic
approaches to effectively treat the disease.
Gene expression profiling data represents the largest source of
genomic data that might be of use in identifying clinically-relevant
subtypes in ovarian cancer, and multiple studies have explored its
use for finding predictive biomarkers and clinically-relevant
subtypes in ovarian cancer [3,4,5,6,7,8,9,10,11]. Tothill et al.
[10] used an unsupervised clustering of gene expression profiles
and proposed the existence of six subtypes in epithelial ovarian
cancer (denoted C1–C6) and a seventh group of unclassifiable
tumors (NC); the C1 subtype, which had the poorest prognosis,
was found to be characterized by expression of a responsive
stromal signature. Dressman and colleagues [5] used a supervised
statistical approach to predict response to platinum-based
treatment from gene expression data; they found evidence linking
chemoresistance to Src and Rb/E2F pathway activity. Recently
the ‘‘The Cancer Genome Atlas’’ (TCGA, http://cancergenome.
PLoS ONE | www.plosone.org 1 February 2012 | Volume 7 | Issue 2 | e30269
nih.gov) consortium released a set of 500 gene expression profiles
from 500 serous ovarian cancer tumor samples that they used to
infer the existence of multiple subtypes [12]. However, none of the
subtypes identified to date have seen widespread clinical
application and often fail to validate in independent datasets.
Our goal was to identify robust molecular subtypes of high-
grade serous ovarian cancer and sets of functionally defined
classification genes that might give insight into potential therapies.
We began with a collection of 129 clinically-annotated formalin-
fixed, paraffin-embedded (FFPE) FIGO stage III and stage IV
high grade serous ovarian samples previously used to construct a
tissue microarray [13,14] and used the Illumina DASLTM
BeadArrayTM platform to profile mRNA expression in these
patients; in parallel, we profiled the expression level of 743 non-
coding micro-RNAs.
Having collected and normalized the gene expression data, we
ran the rISIS class discovery algorithm [15] and subjected the
resulting candidate subtypes to a rigorous validation and
evaluation scheme including bootstrap based stability evaluation
and integration of microRNA profiles, and then validated the
resulting subtypes and associated gene signature on ten indepen-
dent gene expression data sets representing data from 1,606
ovarian cancer patients.
Methods
Patient identificationApproval was obtained from the Dana-Farber/Harvard Cancer
Center Institutional Review Board (IRB) to review all pathology
reports between January 1999 and December 2005 in the Brigham
and Women’s Hospital Department of Pathology database that
included the diagnosis of ‘‘ovarian cancer’’ and collect clinical data
associated with those patients. Eligible patients had a diagnosis of
late stage (all FIGO stage III–IV except 1 case of IIc) high grade
papillary serous ovarian carcinoma, pathology blocks available for
generation of a high-density tissue microarray (HTMA) [13].
Patient clinical and demographic characteristics were extracted
including: age at diagnosis, stage of disease, surgical procedures,
chemotherapy treatment given, response to chemotherapy, date of
diagnosis, date of first disease recurrence, and date of death or last
documented visit to a medical provider.
RNA extraction and microarray hybridizationRNA was extracted from FFPE blocks originally used for TMA
construction. H&E slides were reviewed by a dedicated gyneco-
logic pathologist (MSH), and three 0.8 mm tissue cores were taken
from the corresponding FFPE samples at locations adjacent to the
original TMA cores; selected areas for sampling were based on
having low levels of infiltrating, necrotic, or other contaminating
non-tumor tissue. Messenger RNA was extracted using the Qiagen
RNeasy FFPE kit with; RNA quality and integrity was assessed
using profiles on the Agilent BioAnalyzer and 129 samples passing
this basic QC analysis were analyzed using a prototype Illumina
DASL BeadArray containing approximately 12,000 selected
mRNAs (ArrayExpress Array Design Accession A-MEXP-931)
[16]; twelve samples were run in duplicate to allow estimation of
the reproducibility of the assay. In addition, we used a prototype
DASL-based microRNA expression profiling BeadArray contain-
ing probes to 743 microRNAs (ArrayExpress Array Design
Accession A-MEXP-1678) [17] to survey patterns of microRNA
activity in the samples. The resulting data were normalized using a
variance stabilizing transformation combined with quantile
normalization as implemented in the Bioconductor lumi package
[18,19]. Both data sets were submitted to the ArrayExpress data
repository (ArrayExpress Experiment Accession E-MTAB-386).
Data analysisTo identify ovarian cancer subtypes, the 129 tumor samples
were divided into a training set (n = 82) and a model selection set
(n = 47). Genes on the microarray were filtered to select the 1000
most highly variable in their expression levels across samples but
which also had low variability among the twelve sets of duplicates.
We used the rISIS class discovery algorithm with these 1000 genes
to identify distinct partitions of the 82 training samples and to
select the 100 genes that provided the most significant statistical
support for the partition. We then tested our initial candidate set of
partitions against the 47 model selection test set of samples and
retained four that retained statistical significance (classification
stability .95% during bootstrap) in the model selection set.
MicroRNA expression data from 743 known human miRNAs
profiled in the same 129 tumor samples were tested using PAM
(predictive analysis of microarrays) [20] in combination with a
nested cross validation approach [21] for their ability to
independently predict the rISIS class assignment labels.
Gene set enrichment analysis (GSEA) of GO biological
processes was applied to identify biological themes associated
with the candidate subtypes (FDR,10%).
The validity of the rISIS subtypes was further validated in ten
independent datasets (Table 1). Data from each study were
normalized, probes mapped to EnsEMBL identifiers, gene
expression levels robustly scaled to the range [21, +1], and samples
classified using a score based on weights determined from our linear
discriminant analysis on the original dataset. Additional details of
the computational methods used are provided in Text S1.
Results
Patient stratification based on 4 independent geneexpression signatures
Gene expression-based stratification of cancer into transcription-
ally distinct subtypes has proven to be extremely powerful in
separating patients with unique clinical characteristics, and in
shedding light on the genes and mechanisms responsible for driving
subtype distinctions. However no robust molecular classification in
ovarian has been found, despite a large number of available
expression datasets. This may be due to the fact that many studies
include multiple histological subtypes, reducing their power to
effectively identify new molecular phenotypes [22,23,24,25,26].
To overcome the limitations of these previous studies, we
generated a large gene expression data set from tumors consisting
only of high grade, late stage serous carcinomas and used these for
subtype discovery. We focused on high grade serous tumors as
they represent, by far, the most common histologic subtype of
ovarian cancer and the one most responsive to chemotherapy. We
deviated from the widely-used strategy of clustering the patients
based on the global similarity of their gene expression profiles as
described in Tothill et al. [10] because such approaches can be
cofounded by background gene expression and instead focused on
finding compact modular features within the tumor expression
profiles. Our approach is consistent with mechanistic models of
cancer subtypes in which the expression of distinct functionally-
related groups of genes and distinct pathways can define
phenotypically and clinically distinct groups [27].
We used the unsupervised class discovery algorithm ISIS [15],
which splits the sample set into subsets and tests the significance of
the partitions using linear discriminant analysis with the 100 most
significant genes. In contrast to more widely used clustering
An Angiogenic Subtype of Serous Ovarian Cancer
PLoS ONE | www.plosone.org 2 February 2012 | Volume 7 | Issue 2 | e30269

algorithms, which always return a partition of a dataset, ISIS does
not report a result if the data do not support the presence of
subtypes within a specified cohort.
In the analysis presented here we implemented a robust version
of the ISIS algorithm, rISIS, that includes an additional bootstrap
step to identify only those partitions of the samples in the test set
that are not dependent on the composition of the initial training
sample set. To do this rISIS chooses random subsets of the training
samples, searches for subtype partitions and trains classifiers for
each of these, and monitors the consistency of the predictions on
the independent test samples. Only predicted partitions were
consistent on the independent test samples are kept and used for
further analysis.
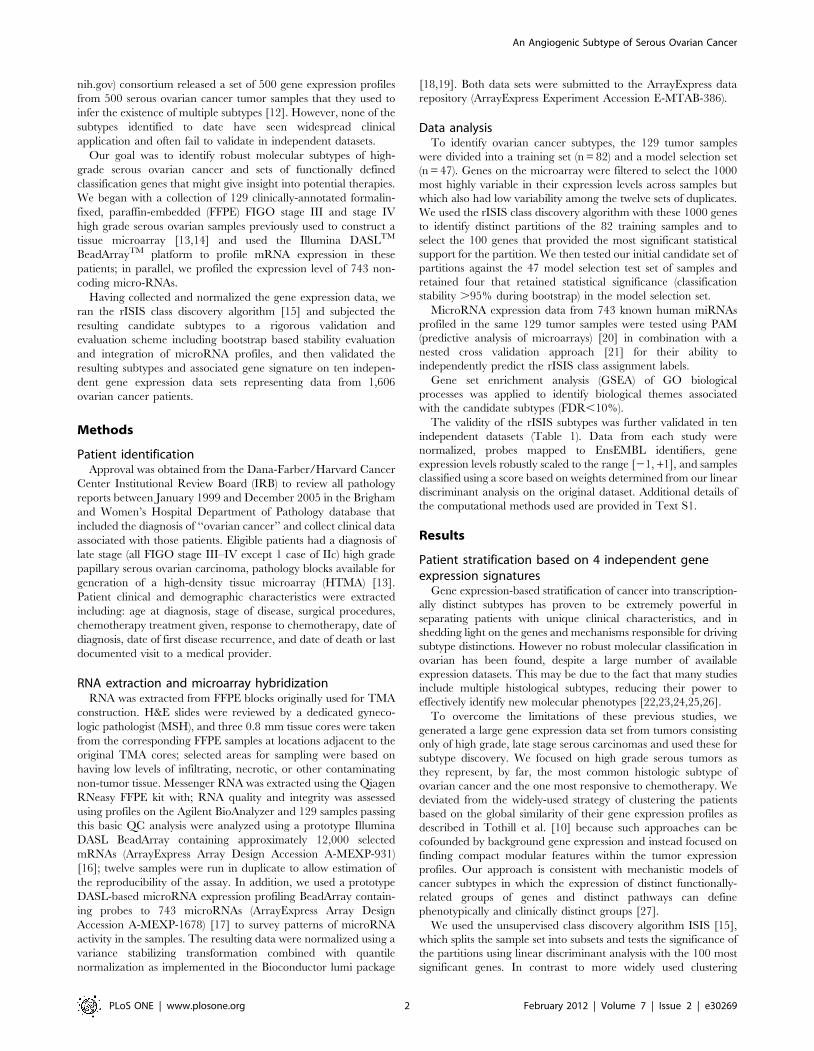
Using rISIS we found four independent, robust binary
partitions, or ‘‘Splits,’’ in our ovarian cancer gene expression
profiling data (S1–S4), each supported by expression of a defined
set of 100 genes (modules) as shown in Figure 1. For each of these
binary partitions, the two patient subtypes were labeled g0 and g1,
for the larger and smaller subsets, respectively, so that S1 consists
of S1g0 and S1g1, S2 is divided into S2g0 and S2g1 for Split2, etc.
The list of genes in the modules that define each of the binary
partitions is included in the File S1.
MicroRNA expression profiles provides support for Split 1The expression profiles for the 743 known microRNAs
represented on the Illumina DASL platform [17] provided an
independent source of data to test the robustness of our subtype
assignments. We used Prediction Analysis of Microarrays (PAM)
[20], which uses a nearest-centroid method, to test whether the
nicroRNA expression was able to predict the subtype membership
for each of our four binary partitions. Nested cross-validation was
used to build a PAM classifier for each Split and compute an
unbiased estimate of its performance [21]. As can be seen in
Table 2, the microRNA expression profiles provide strongest
support for the subtypes defined by Split 1; only three samples of
S1g1 are misclassified within the cross-validation. The cross-
validated misclassification error of S1g0 was larger, but still below
20%. Much larger misclassification error rates were observed for
Splits 2–4, suggesting that these may represent either artifacts in
the original mRNA expression data or subtypes of patients
characterized by more complex substructure than cannot be
discovered with the binary splitting approach used by rISIS.
Because the microRNA data provides the greatest independent
support for Split 1, we chose to focus the remainder of our analysis
on this subtype assignment. The consensus set microRNAs
significant in classifying the samples as S1g0 or S1g1 in all cross-
validation classifiers are included in File S2.
Gene set enrichment analysis of Split 1We then performed Gene Set Enrichment Analysis using Gene
Ontology (GO) Biological Process terms to functionally charac-
terize the gene module responsible for the Split 1 classification.
Table 1. Microarray datasets used as training and validation sets.
Contributors Year SetMicroarrayplatform
# Patientswith ovariantumor
# Patient with high grade,late stage, serous ovariantumor PMID Source
Bentink et al.[This study]
2011 Training Illumina DASLBeadArray 12k
129 129 E-MTAB-386
Dressmanet al. [5]
2007 Validation AffymetrixGeneChip HG-U133A
118 114 17290060 http://data.cgt.duke.edu/platinum.php
Yoshiharaet al. [36]
2010 Validation Agilent G4112A 110 43 20300634 GSE17260
Tothillet al. [10]
2008 Validation AffymetrixGeneChip HG-U133A
285 139 18698038 GSE9899
Birrer et al.Bonomeet al. [37]
2008 Validation AffymetrixGeneChip HG-U133A
185 185 18593951 GSE26712
TCGATCGA[12]
2011 Validation AffymetrixGeneChip HG-U133A
510 402 21720365 http://tcga-data.nci.nih.gov/tcga/tcgaHome2.jsp
Spentzoset al. [9]
2004 Validation AffymetrixGeneChip HG-U95v2
53 41 15505275 GSE19161
Zhang et al. [38]2008 Validation AffymetrixGeneChip HG-U133PLUS2
55 46 18458333 GSE19161
Denkertet al. [26]
2009 Validation AffymetrixGeneChip HG-U133A
80 41 19294737 GSE14764
Crijnset al. [39]
2009 Validation Operon human v335K
157 85 19192944 GSE13876
Moket al. [40]
2009 Validation AffymetrixGeneChip HG-U133PLUS2
53 53 19962670 GSE18520
doi:10.1371/journal.pone.0030269.t001
An Angiogenic Subtype of Serous Ovarian Cancer
PLoS ONE | www.plosone.org 3 February 2012 | Volume 7 | Issue 2 | e30269
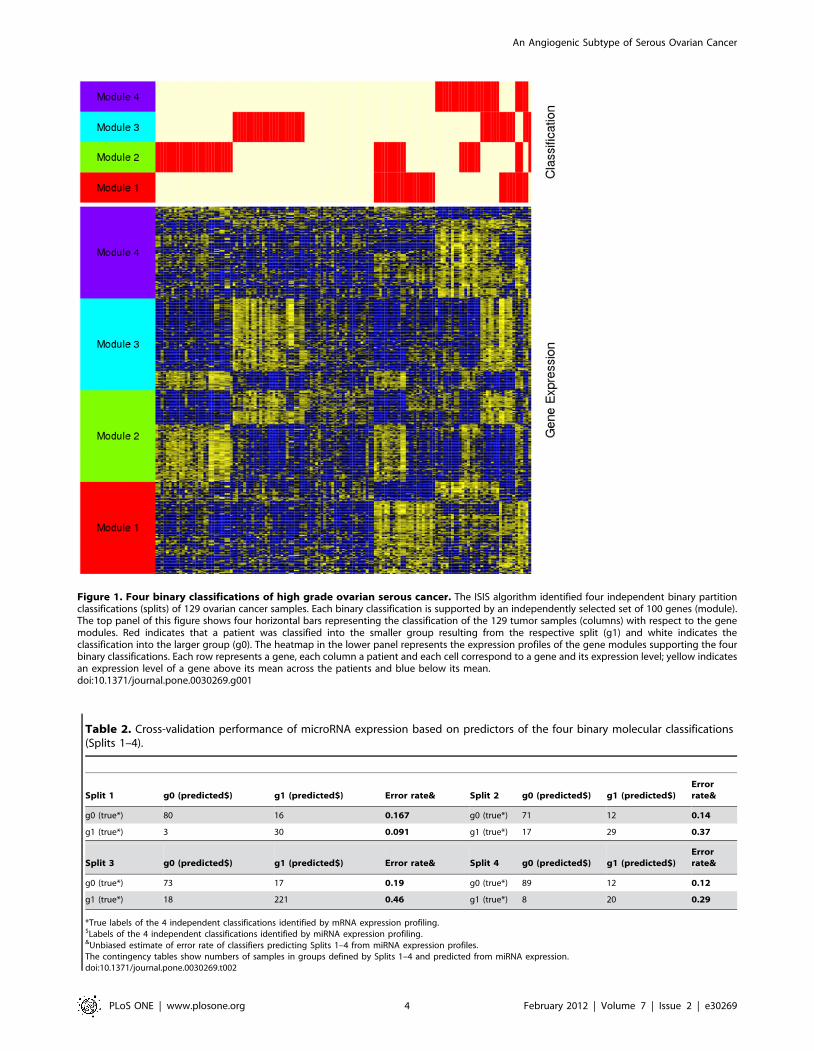
Figure 1. Four binary classifications of high grade ovarian serous cancer. The ISIS algorithm identified four independent binary partitionclassifications (splits) of 129 ovarian cancer samples. Each binary classification is supported by an independently selected set of 100 genes (module).The top panel of this figure shows four horizontal bars representing the classification of the 129 tumor samples (columns) with respect to the genemodules. Red indicates that a patient was classified into the smaller group resulting from the respective split (g1) and white indicates theclassification into the larger group (g0). The heatmap in the lower panel represents the expression profiles of the gene modules supporting the fourbinary classifications. Each row represents a gene, each column a patient and each cell correspond to a gene and its expression level; yellow indicatesan expression level of a gene above its mean across the patients and blue below its mean.doi:10.1371/journal.pone.0030269.g001
Table 2. Cross-validation performance of microRNA expression based on predictors of the four binary molecular classifications(Splits 1–4).
Split 1 g0 (predicted$) g1 (predicted$) Error rate& Split 2 g0 (predicted$) g1 (predicted$)Errorrate&
g0 (true*) 80 16 0.167 g0 (true*) 71 12 0.14
g1 (true*) 3 30 0.091 g1 (true*) 17 29 0.37
Split 3 g0 (predicted$) g1 (predicted$) Error rate& Split 4 g0 (predicted$) g1 (predicted$)Errorrate&
g0 (true*) 73 17 0.19 g0 (true*) 89 12 0.12
g1 (true*) 18 221 0.46 g1 (true*) 8 20 0.29
*True labels of the 4 independent classifications identified by mRNA expression profiling.$Labels of the 4 independent classifications identified by miRNA expression profiling.&Unbiased estimate of error rate of classifiers predicting Splits 1–4 from miRNA expression profiles.The contingency tables show numbers of samples in groups defined by Splits 1–4 and predicted from miRNA expression.doi:10.1371/journal.pone.0030269.t002
An Angiogenic Subtype of Serous Ovarian Cancer
PLoS ONE | www.plosone.org 4 February 2012 | Volume 7 | Issue 2 | e30269

GSEA significant processes included angiogenesis and extracellu-
lar matrix proteins, inducing the GO categories ‘‘vascular
development’’ (GO:0001944; FDR = 2.5%) and ‘‘regulation of
cell adhesion’’ (GO:0030155; FDR = 2.4%), both of which had
relatively higher expression levels in S1g1, the smaller of the two
classes comprising Split 1. The larger sample group, S1g0, showed
relatively higher expression for genes involved in ‘‘single stranded
DNA binding’’ (GO:0003697; FDR = 9.5%) and ‘‘structure
specific DNA binding’’ (GO:0043566; FDR = 5.0%). Because of
the significance of angiogenesis in defining the groups, we refer to
S1g1 as the ‘‘angiogenic’’ and S1g0 as the ‘‘non-angiongenic’’
subtypes.
Robustness and prognostic value of the angiogenicsubtype classification
We tested our angiogenic subtype classification for reproduc-
ibility and association with clinical variables in our original dataset
and ten previously published gene expression datasets collected on
a number of diverse microarray platforms (Table 1). We
normalized and scaled data from each study and assigned an,
angiogenic subtype score to each of the 1,606 samples in the
published gene expression datasets (see Text S1 for detailed
description of the methods). The results of these assignments are
shown in Figure 2 for our initial set of 129 samples (Figures 2A,
2D, 2G), for the 1,090 patients from the ten published studies
having high grade ($3), late stage ($3), serous ovarian tumors
(Figures 2B, 2E, 2H), and for all 1,606 patients in the published
datasets (Figures 2C, 2F, and 2I). The top figures show heatmaps
for the 100 classification genes, the middle row show the bimodal
distribution of classification scores in each dataset, and the bottom
row of figures shows the significantly poorer survival for the
angiogenic subtype relative to the non-angiogenic subtype. An
independent validation that the most robust number of subtypes in
the data, estimated using the Bayesian Information Criteria (BIC),
is shown in Figure S1.
Within our patient set, those with angiogenic subtype tumors
had a hazard ratio (HR) = 1.3 (95%CI [0.8,2.2], logrank p-
value = 0.28) relative to the non-angiogenic subtype. We saw
similar, and highly significant differences for the published high-
grade, late stage, serous tumors (HR = 1.3, 95%CI [1.1,1.6],
Figure 2. Validation of angiogenic ovarian cancer classification in our dataset and ten independent validation datasets. Panels A, Dand G display the gene expression of the 100 genes used to classify ovarian tumors into angiogenic and non-angiogenic subtypes in our dataset (129patients), the high grade, late stage, serous tumors (1,090 patients) and all tumors (1,606 patients) in the validation set, respectively. Panels D, E and Freport the corresponding distribution of the scaled subtype scores. Panels B, D and F reports the (overall) survival curves of patients having tumors ofangiogenic or non-angiogenic subtype in the corresponding datasets.doi:10.1371/journal.pone.0030269.g002
An Angiogenic Subtype of Serous Ovarian Cancer
PLoS ONE | www.plosone.org 5 February 2012 | Volume 7 | Issue 2 | e30269

logrank p-value,0.001) and the entire published ovarian dataset
(HR = 1.4; 95%CI [1.2,1.6], logrank p-value,0.001). Additional
plots, including classification of the ten individual published
datasets can be found in Figure S2 and Figure S3.
Association with clinical parametersWe then tested the association of the angiogenic subtype
classification with the clinical information, including stage, grade,
optimal debulking during surgery, and age, available for the
compendium of datasets (Table 1). In our set of 129 high grade,
late stage, serous ovarian cancer patients we observed no
significant association with any of these clinical parameters
(Fisher’s exact test p-value.0.05). Similarly, in the validation set
of 1,090 high-grade, late stage serous ovarian cancer patients, we
found no significant association with subtype and these parameters
(Fisher’s exact test p-value.0.05).
However, in the validation set of 1,606 ovarian cancer patients
we found significant association with grade (only 19% of grade 1
tumors are of the angiogenic subtype, Fisher’s exact test p-
value = 0.0025; Table 3A), stage (only 10% of stage I and II
tumors are of the angiogenic subtype, Fisher’s exact test p-
value,0.001; Table 3B) and debulking (debulking is suboptimal
for 60% versus 44% for the angiogenic and the non-angiogenic
subtype tumors respectively, exact test p-value = 0.001, Table 3C).
No significant association between the angiogenic subtype
classification and age at diagnosis has been found.
Comparison with published ovarian cancer subtypesWe then compared our angiogenic subtype classification to the
expression-based molecular subtypes assigned by Tothill and
colleagues [24] using k-means clustering. These subtypes, which
they called C1 (n = 83), C2 (n = 50), C3 (n = 28), C4 (n = 46), C5
(n = 36), C6 (n = 8), and NC for a set of ‘‘unassigned’’ cases
(n = 34), were reported to correspond to different clinical and
pathological features. The most significant of these was C1 which
Tothill found to have significantly poor prognosis and which they
described as characterized by a ‘‘reactive stroma signature.’’
When we classified the Tothill samples using our angiogenic
subtype classification, we observed a highly significant association
with Tothill’s clusters (Fisher’s exact test p-value,0.001; Table
S1A). Of the 115 samples classified as having the angiogenic
subtype, 82 (71%) were from the C1 subtype, 18 were C2, 11 were
NC, and the remaining four were from C5; none of the C3 and C4
samples were classified as angiogenic. This suggests that Tothill’s
C1 class is largely concordant with our angiogenic subtype.
We also compared our angiogenic subtype classification with
the four subtypes (‘‘differentiated’’, ‘‘immunoreactive’’, ‘‘mesen-
chymal’’, and ‘‘proliferative’’) recently defined from the gene
expression dataset generated by the TCGA consortium (Table 1;
[12]). These four subtypes were validated only in two datasets
(TCGA and Tothill; Table 1) and did not exhibit any differences
in overall survival [12]. However, we observed a significant
association between our angiogenic subtype classification and
TCGA’s subtyping (Fisher’s exact test p-value,0.001; Table S1B),
where the majority of the tumors identified as angiogenic are from
the TCGA mesenchymal (58%) and immunoreactive (20%)
subtypes, although using our angiogenic/non-angiogenic classifi-
cation they have significantly worse survival as described
previously.
Discussion
There have been many published studies that have attempted to
find robust, clinically-relevant molecular subtypes in ovarian
cancer, but there has been no clear consensus as to what subtypes
exist. One reason for this may be that most analyses have used
methods that are sensitive to subtle variations in the data, resulting
in putative subtypes that cannot be generalized to independent
validation datasets [28,29]. Many studies have also used mixed
histological types in their analyses, reducing the power to discover
new classes and potentially confounding the results.
In the analysis presented here, we focused on a single
histological type—high-grade serous ovarian cancer. We chose
this because it is by far the most common histologic subtype of
ovarian cancer and the one that is most responsive to
Table 3. Association with clinical parameters.
A. Grade
1 2 3 4
Subtype Angiogenic 14 140 433 21
Non-angiogenic 59 200 668 37
B. Stage
1 2 3 4
Subtype Angiogenic 4 5 520 92
Non-angiogenic 43 39 779 115
C. Debulking
Suboptimal Optimal
Subtype Angiogenic 121 81
Non-angiogenic 143 176
Non-angiogenic 143 176
Contingency tables for the significant association between the angiogenic subtype classification and (A) histological grade, (B) Stage, and (C) debulking in our validationset of 1,606 ovarian cancer patients. It is worth noting that different datasets are annotated using different histological grading and tumor staging systems, with scalesranging from 1 to 3 and 1 to 4. In this study, we simply merged these clinical annotations because we do not have access to the original tumor tissues to perform astandardized histological grading and tumor staging.doi:10.1371/journal.pone.0030269.t003
An Angiogenic Subtype of Serous Ovarian Cancer
PLoS ONE | www.plosone.org 6 February 2012 | Volume 7 | Issue 2 | e30269

chemotherapy. Moreover the vast majority of published gene
expression data, including that from the TCGA, is from patients
with high-grade serious cancer. Although there are other
recognized ovarian histological subtypes, including mucinous,
clear cell and endometrioid cancers, we did not have sufficient
numbers of these to search for subtypes or to robustly validate
their existence in independent datasets.
For subtype discovery, we used rISIS, a robust clustering
method that combines class discovery and feature selection by
searching for binary groupings of the samples that are strongly
supported by statistically significant differences in gene expression
[15]. Rather than relying on global patterns of expression, which
can be affected by noise in the data and by the initial choice of
samples, rISIS searches for separations of the initial sample set
together with the genes that are significantly different between
subgroups and support the separation. By design, rISIS reports
multiple, overlapping partitions of the original sample set and
associated classification genes, reflecting the complexity of
biological systems in which there are often common pathways or
functional gene groups that are activated in multiple phenotypic
groups. While we found four putative subtypes partitions, each of
which could be plausibly described by the genes that supported it,
we were only able to confirm the existence of the first bi-partition
of the samples using independently obtained microRNA expres-
sion data.
The corresponding two subtypes, defined by expression of genes
associated with angiogenesis has been shown to be robust and
reproducible in independently published gene expression datasets
including 1,090 high grade, late stage, serious (and 1,606 total)
ovarian tumors, with statistically significant differences in overall
survival. The angiogenic subtype was found to be fairly
concordant with Tothill’s C1 ‘‘reactive stroma’’ cluster [24] and
to overlap with mesenchymal and immunoreactive subtypes
identified by the TCGA consortium [12], but with better statistical
support and a well-defined, functionally-associated set of classifi-
cation gene modules. When we extended our analysis to all 1,606
patients, which include low grade and early stage patients, the
bimodality of the subtype score was preserved and the association
with survival was even stronger. Overall, this suggests that the
angiogenic subtype represents a true biological subset of serous
ovarian tumors that can be robustly identified across independent
datasets.
This identification of an angiogenesis-driven subtype is of
potential clinical and translational importance since several anti-
angiogenic agents (bevacizumab, cediranib) are being added to
chemotherapy both in newly diagnosed patients and those with
recurrent cancer. and inhibitors of DNA repair (Olaparib)
[30,31,32].
Bevacizumab is a humanized monoclonal antibody that
recognizes circulating vascular endothelial growth factor (VEGF)
and which has documented anti-cancer activity patients with
recurrent ovarian cancer [30,31,32,33,34,35]. Single agent bev-
acizumab demonstrates response rates of 18–20% suggesting
activity of this anti-angiogenic in ovarian cancer [30,31]. In these
studies, bevacizumab has been identified as an active drug in both
platinum-resistant and platinum-sensitive recurrent ovarian cancer.
In Gynecologic Oncology Group study 218, bevacizumab was
added to upfront chemotherapy for newly diagnosed patients with
advanced ovarian cancer, and the study design was comprised of 3
groups: carboplatin and paclitaxel given IV with placebo during
chemotherapy and maintenance, carboplatin/paclitaxel/bevaci-
zumab with placebo maintenance, and carboplatin/paclitaxel/
bevacizumab followed by 12 months of bevacizumab mainte-
nance. A statistically significant improvement of 4 months was
observed in the carboplatin/paclitaxel/bevacizumab plus bevaci-
zumab maintence arm compared to carboplatin/paclitaxel alone
[33].
ICON7 also demonstrated a statistically significant improve-
ment in PFS with the addition of bevacizumab to upfront
chemotherapy [35]. In patients with platinum sensitive recurrent
ovarian cancer, the addition of bevacizumab to carboplatin and
gemcitabine chemotherapy statistically improved PFS compared
to carboplatin and gemcitabine chemotherapy alone [34]. Thus,
increasing clinical data in both newly diagnosed and recurrent
ovarian cancer suggests some benefit in PFS with the addition of
bevacizumab [34,35].
Given the important toxicities of these agents such as
gastrointestinal bowel perforations, thromboembolic events such
as strokes and pulmonary emboli, and hypertension, as well as
their financial cost, a classification signature that could identify
and pre-select patients whose tumors would most likely benefit
from receipt of anti-angiogenic agents would be of tremendous
clinical importance. A retrospective assessment of gene expression
profiles of patients in the treatment arm of one of these clinical
trials would help establish the validity of this signature for
predicting relevant response.
There may be additional translational applications of our
angiogenic/non-angiogenic subtype assignments. The classifica-
tion gene set also was enriched for genes associated with the
extracellular matrix and a number of agents that interfere with the
ECM, including notch inhibitors and integrin modulators, are
currently being tested in ovarian cancer. Again, a retrospective
analysis of gene expression data from patients in the treatment
arms of these trials could help to establish a clinical application for
the subtypes we identified.
Although much remains to be done, we have developed a new
approach to robust subtype discovery, demonstrated its applica-
tion in disease in which subtype identification has proven
challenging, and validated that our subtype assignments are
robust in a large independent dataset—and more strongly
predictive of outcome than any previously reported signature in
ovarian cancer. Given the overlap between the genes that drive the
subtype classification, and the clinical trials underway in ovarian
cancer, we believe our classification has great potential to help
influence treatment and improve outcomes for patients.
Supporting Information
Figure S1 Identification of the most likely number ofGaussians to model the subtype scores in the trainingset (Figure 1A–B) and in the validation set for the 1,090patients having high grade ($3), late stage ($3), serousovarian tumors (Figure 1C–B) and for all the 1,606patients (Figure 1E–F). Panel A displays the distribution of the
subtype scores and the mixture of two Gaussians, what is the most
likely model given the data as estimated by the Bayesian
Information Criterion (BIC) in panel B. As can be seen in panels
C and E, the distribution of the subtype scores still exhibits a
bimodal pattern despite the heterogeneity of the validation
datasets (different microarray technologies and normalization
methods); this is confirmed by the estimation of the BIC in the
validation (panels D and F) where a mixture of two or three
Gaussians are the most likely models given the data.
(DOCX)
Figure S2 Subtype identification for high grade, latestage, serous ovarian tumors in each of the tenindependent validation sets separately: from left toright, a short description of the dataset is given along
An Angiogenic Subtype of Serous Ovarian Cancer
PLoS ONE | www.plosone.org 7 February 2012 | Volume 7 | Issue 2 | e30269

with the number of tumors in the angiogenic and non-angiogenic subtypes, the bimodal distribution of therescaled subtype scores, and the survival curves ofpatients having an angiogenic of non-angiogenic sub-type.(DOCX)
Figure S3 Subtype identification for all tumors (allgrades, all stages, all histological types) in the trainingset and in each of the ten independent validation setsseparately: from left to right, a short description of thedataset is given along with the number of tumors in theangiogenic and non-angiogenic subtypes, the bimodaldistribution of the rescaled subtype scores, and thesurvival curves of patients having an angiogenic of non-angiogenic subtype.(DOCX)
Table S1 Association between the angiogenic subtypeclassifications and (A) the putative subtype clusters inTothill’s dataset, and (B) the proposed subtypes in theovarian TCGA dataset.(DOCX)
Text S1 Angiogenic mRNA and microRNA gene expres-sion signatures predict a novel subgroup of serousovarian cancer.
(DOCX)
File S1 An Excel workbook containing the list of genesin the modules that define each of the four binarypartitions found using rISIS, with each represented inseparate tab.
(XLSX)
File S2 An Excel spreadsheet containing the consensusset microRNAs significant for classifying the samples asS1g0 or S1g1 in all cross-validation classifiers.
(XLSX)
Author Contributions
Conceived and designed the experiments: JQ UAM. Performed the
experiments: KH RR J-BF CA JC EW-G. Analyzed the data: SB BH-K
TR JQ. Contributed reagents/materials/analysis tools: MSH JL JB-F SB
BH-K AC RD. Wrote the paper: BH-K SB UAM JQ.
References
1. McGuire WP, Hoskins WJ, Brady MF, Kucera PR, Partridge EE, et al. (1996)
Cyclophosphamide and cisplatin compared with paclitaxel and cisplatin in
patients with stage III and stage IV ovarian cancer. N Engl J Med 334: 1–6.
2. Ozols RF, Bundy BN, Greer BE, Fowler JM, Clarke-Pearson D, et al. (2003)
Phase III trial of carboplatin and paclitaxel compared with cisplatin andpaclitaxel in patients with optimally resected stage III ovarian cancer: a
Gynecologic Oncology Group study. J Clin Oncol 21: 3194–3200.
3. Berchuck A, Iversen ES, Lancaster JM, Pittman J, Luo J, et al. (2005) Patterns of
gene expression that characterize long-term survival in advanced stage serousovarian cancers. Clin Cancer Res 11: 3686–3696.
4. De Smet F, Pochet NL, Engelen K, Van Gorp T, Van Hummelen P, et al.(2006) Predicting the clinical behavior of ovarian cancer from gene expression
profiles. Int J Gynecol Cancer 16 Suppl 1: 147–151.
5. Dressman HK, Berchuck A, Chan G, Zhai J, Bild A, et al. (2007) An integrated
genomic-based approach to individualized treatment of patients with advanced-stage ovarian cancer. J Clin Oncol 25: 517–525.
6. Hartmann LC, Lu KH, Linette GP, Cliby WA, Kalli KR, et al. (2005) Geneexpression profiles predict early relapse in ovarian cancer after platinum-
paclitaxel chemotherapy. Clin Cancer Res 11: 2149–2155.
7. Jazaeri AA, Awtrey CS, Chandramouli GV, Chuang YE, Khan J, et al. (2005)
Gene expression profiles associated with response to chemotherapy in epithelialovarian cancers. Clin Cancer Res 11: 6300–6310.
8. Spentzos D, Levine DA, Kolia S, Otu H, Boyd J, et al. (2005) Unique geneexpression profile based on pathologic response in epithelial ovarian cancer.
J Clin Oncol 23: 7911–7918.
9. Spentzos D, Levine DA, Ramoni MF, Joseph M, Gu X, et al. (2004) Gene
expression signature with independent prognostic significance in epithelialovarian cancer. J Clin Oncol 22: 4700–4710.
10. Tothill RW, Tinker AV, George J, Brown R, Fox SB, et al. (2008) Novelmolecular subtypes of serous and endometrioid ovarian cancer linked to clinical
outcome. Clin Cancer Res 14: 5198–5208.
11. Wong KK, Cheng RS, Mok SC (2001) Identification of differentially expressed
genes from ovarian cancer cells by MICROMAX cDNA microarray system.Biotechniques 30: 670–675.
12. Bell D, Berchuck A, Birrer M, Chien J, Cramer DW, et al. (2011) Integratedgenomic analyses of ovarian carcinoma. Nature 474: 609–615.
13. Liu JF, Hirsch MS, Lee H, Matulonis UA (2009) Prognosis and hormonereceptor status in older and younger patients with advanced-stage papillary
serous ovarian carcinoma. Gynecol Oncol 115: 401–406.
14. Clauss A, Ng V, Liu J, Piao H, Russo M, et al. (2010) Overexpression of elafin in
ovarian carcinoma is driven by genomic gains and activation of the nuclearfactor kappaB pathway and is associated with poor overall survival. Neoplasia
12: 161–172.
15. von Heydebreck A, Huber W, Poustka A, Vingron M (2001) Identifying splits
with clear separation: a new class discovery method for gene expression data.Bioinformatics 17 Suppl 1: S107–114.
16. April C, Klotzle B, Royce T, Wickham-Garcia E, Boyaniwsky T, et al. (2009)Whole-genome gene expression profiling of formalin-fixed, paraffin-embedded
tissue samples. PLoS ONE 4: e8162.
17. Chen J, Lozach J, Garcia EW, Barnes B, Luo S, et al. (2008) Highly sensitive and
specific microRNA expression profiling using BeadArray technology. NucleicAcids Res 36: e87.
18. Du P, Kibbe WA, Lin SM (2008) lumi: a pipeline for processing Illumina
microarray. Bioinformatics 24: 1547–1548.
19. Lin SM, Du P, Huber W, Kibbe WA (2008) Model-based variance-stabilizing
transformation for Illumina microarray data. Nucleic Acids Res 36: e11.
20. Tibshirani R, Hastie T, Narasimhan B, Chu G (2002) Diagnosis of multiple
cancer types by shrunken centroids of gene expression. Proc Natl Acad Sci U S A99: 6567–6572.
21. Ruschhaupt M, Huber W, Poustka A, Mansmann U (2004) A compendium toensure computational reproducibility in high-dimensional classification tasks.
Stat Appl Genet Mol Biol 3: Article37.
22. Dressman HK, Berchuck A, Chan G, Zhai J, Bild A, et al. (2007) An integrated
genomic-based approach to individualized treatment of patients with advanced-
stage ovarian cancer. Journal of Clinical Oncology 25: 517–525.
23. Crijns APG, Fehrmann RSN, de Jong S, Gerbens F, Meersma GJ, et al. (2009)Survival-Related Profile, Pathways, and Transcription Factors in Ovarian
Cancer. PLoS Medicine 6: e1000024.
24. Tothill RW, Tinker AV, George J, Brown R, Fox SB, et al. (2008) Novel
Molecular Subtypes of Serous and Endometrioid Ovarian Cancer Linked to
Clinical Outcome. Clinical Cancer Research 14: 5198–5208.
25. Yoshihara K, Tajima A, Yahata T, Kodama S, Fujiwara H, et al. (2010) Geneexpression profile for predicting survival in advanced-stage serous ovarian
cancer across two independent datasets. PloS one 5: e9615.
26. Denkert C, Budczies J, Darb-Esfahani S, Gyorffy B, Sehouli J, et al. (2009) A
prognostic gene expression index in ovarian cancer - validation across different
independent data sets. J Pathol 218: 273–280.
27. Culhane AC, Schwarzl T, Sultana R, Picard KC, Picard SC, et al. (2010)
GeneSigDB–a curated database of gene expression signatures. Nucleic Acids Res38: D716–725.
28. Haibe-Kains B, Culhane AC, Desmedt C, Bontempi G, Quackenbush J, et al.
(2011) A three-gene model to robustly identify breast cancer molecular subtypes.
submitted.
29. Kapp A, Jeffrey S, Langerod A, Borresen-Dale A-L, Han W, et al. (2006)
Discovery and validation of breast cancer subtypes. BMC genomics 7: 231.
30. Burger RA, Sill MW, Monk BJ, Greer BE, Sorosky JI (2007) Phase II trial ofbevacizumab in persistent or recurrent epithelial ovarian cancer or primary
peritoneal cancer: a Gynecologic Oncology Group Study. J Clin Oncol 25:
5165–5171.
31. Cannistra SA, Matulonis UA, Penson RT, Hambleton J, Dupont J, et al. (2007)
Phase II study of bevacizumab in patients with platinum-resistant ovarian canceror peritoneal serous cancer. J Clin Oncol 25: 5180–5186.
32. Matulonis UA, Berlin S, Ivy P, Tyburski K, Krasner C, et al. (2009) Cediranib,an oral inhibitor of vascular endothelial growth factor receptor kinases, is an
active drug in recurrent epithelial ovarian, fallopian tube, and peritoneal cancer.J Clin Oncol 27: 5601–5606.
33. Burger RA, Brady MF, Bookman MA, Walker JL, Homesley HD, et al. (2010)Phase III trial of bevacizumab (BEV) in the primary treatment of advanced
epithelial ovarian cancer (EOC), primary peritoneal cancer (PPC), or fallopiantube cancer (FTC): A Gynecologic Oncology Group study. J Clin Oncol 28:
suppl; abstr LBA1.
34. Aghajanian C, Finkler NJ, Rutherford T, Smith DA, Yi JY, et al. (2011)
OCEANS: A randomized, double-blinded, placebo-controlled phase III trial ofchemotherapy with or without bevacizumab (BEV) in patients with platinum-
An Angiogenic Subtype of Serous Ovarian Cancer
PLoS ONE | www.plosone.org 8 February 2012 | Volume 7 | Issue 2 | e30269

sensitive recurrent epithelial ovarian (EOC), primary peritoneal (PPC), or
fallopian tube cancer (FTC). J Clin Oncol 29.
35. Perren T, Ledermann JA, Gourley C, Essapen S, Rustin G, et al. (2010) Results
of ICON7: A phase III randomised Gynaecologic Cancer InterGroup trial of
concurrent bevacizumab and chemotherapy followed by maintenance bevaci-
zumab, versus chemotherapy alone in women with newly diagnosed epithelial
ovarian (EOC), primary peritoneal (PPC) or fallopian tube cancer (FTC). Ann
Oncol 21.
36. Yoshihara K, Tajima A, Yahata T, Kodama S, Fujiwara H, et al. (2010) Gene
expression profile for predicting survival in advanced-stage serous ovarian
cancer across two independent datasets. PLoS ONE 5: e9615.
37. Bonome T, Levine DA, Shih J, Randonovich M, Pise-Masison CA, et al. (2008)
A gene signature predicting for survival in suboptimally debulked patients withovarian cancer. Cancer Res 68: 5478–5486.
38. Zhang L, Volinia S, Bonome T, Calin GA, Greshock J, et al. (2008) Genomic
and epigenetic alterations deregulate microRNA expression in human epithelialovarian cancer. Proc Natl Acad Sci U S A 105: 7004–7009.
39. Crijns AP, Fehrmann RS, de Jong S, Gerbens F, Meersma GJ, et al. (2009)Survival-related profile, pathways, and transcription factors in ovarian cancer.
PLoS Med 6: e24.
40. Mok SC, Bonome T, Vathipadiekal V, Bell A, Johnson ME, et al. (2009) A genesignature predictive for outcome in advanced ovarian cancer identifies a survival
factor: microfibril-associated glycoprotein 2. Cancer Cell 16: 521–532.
An Angiogenic Subtype of Serous Ovarian Cancer
PLoS ONE | www.plosone.org 9 February 2012 | Volume 7 | Issue 2 | e30269