micro market report
TRANSCRIPT

Micro MarketReport
Los Angeles County Orange County Santa Barbara County Monterey County Riverside County San Diego County
Luxury Real Estate Market Research
July 2021

Reading the Report
Each Micro Market area contains an analysis of current conditions and past trends. In order to take the most away from this report, it is important to understand how to read each micro market.
The Data presents statistical information about past and current conditions, comparing the previous year’s month to the current month. Each statistic is compiled from sales data during the month of the respective year. It is then analyzed by Percent Change, which is calculated by taking Current Value minus Past Value and then divided by Past Value.
The Numbers is a compilation of important take-away statistics for each area to gain a quick understanding of market conditions. Median Sales Price and Days on market are 12 month averages for the period ending in the current month. The values for Properties for Sale and Shadow Inventory are presented in both text and graphical form to show the relationship of Shadow to Active Inventory.
The Yearly Trend presents the Median Sales Prices for each month during the past year in graphical format to easily visualize the changes and help identify any trends in sales for that micro market.
Median Price:A value that separates the upper half of prices from the lower half of prices. It can be interpreted like an average, however the extreme prices (high and low) don’t hold undue influence.
Average Price per Square Foot:The price of each property divided by their respective square footage then averaged across all properties sold in the area for a given time period.
Properties Sold:The number of property transactions that closed and transferred ownership.
Properties Pending Sale:The number of properties that entered escrow in preparation for sale.
Properties For Sale:The number of properties on the market and seeking buyers.
Days of market (Pending Sale):he number of days that properties currently in escrow were on the market.
Month’s Supply of Inventory:The number of months it would take to sell all the properties listed for sale at the current pace of sales and if no new listings entered the market.
Percent Under Contract:The ratio of properties for sale to properties pending sale.
Average Median Price for Last 12:The Average Median Price for the Last 12 Months is sales data from 12 months ending in the identified month.

Los Angeles County
Micro Market Report : July 2021
Los Angeles County Macro
Bel Air - Holmby Hills
Beverly Center - Miracle Mile
Beverly Hills
Beverly Hills P.O.
Beverlywood
Brentwood
Cheviot Hills - Rancho Park
Culver City
Downtown Los Angeles
Hancock Park - Wilshire
Hollywood
Hollywood Hills East
Inglewood
Ladera Heights
Laurel Canyon
Los Feliz
Malibu
Malibu Beach
Marina Del Rey
Mid Los Angeles
Mid Wilshire
Pacific Palisades
Palms - Mar Vista
Park Hills Heights
Playa Del Rey
Playa Vista
Santa Monica
Sunset Strip - Hollywood Hills West
Venice
West Hollywood
West Los Angeles
Westchester
Westwood - Century City
South Bay Macro
El Segundo
Hermosa Beach
Manhattan Beach
Palos Verdes Estates
Rancho Palos Verdes
Redondo Beach - North
Redondo Beach - South
Rolling Hills
Rolling Hills Estates
San Pedro
Torrance - County Strip
Torrance - North
Torrance - South
Torrance - Southeast
Torrance - West
San Fernando Macro
Agoura Hills
Burbank
Calabasas
Encino
Glendale
La Crescenta
North Hollywood
Shadow Hills
Sherman Oaks
Studio City
Sun Valley
Sunland - Tujunga
Tarzana
Toluca Lake
Valley Village
Westlake Village
Woodland Hills
San Gabriel Valley Macro
Altadena
Arcadia
Duarte
Eagle Rock
La Canada Flintridge
Monrovia
Pasadena
San Gabriel
San Marino
Sierra Madre
South Pasadena

Micro Market Report : July 2021
County Los Angeles
Area 4,752 SqMiles
Founded 1850

Median Price ..........................................
Average Price per Square Foot ...............
Properties Sold .......................................
Properties Pending Sale .........................
Properties For Sale .................................
Days on Market (Pending Sale) ................
Percent Under Contract .........................
Average Median Price for Last 12 Months
Jul 2020 Jul 20216 Month 3 Month % ChangeData*
Current Market Snapshot
Micro Market Report : July 2021
Median sales price.
Average price per square foot.
Properties for sale.
Median Sales Price ($100,000’S)
Jul
Aug
Sep
Oct
Nov
Dec
Jan
Feb
Mar
Apr
May
Jun
Jul
$900,000
$643
14,328
*Information obtained from Broker Metrics, The MLS and Foreclosure Radar for all areas in Los Angeles County Micro Market Report. Statistics are subject to change due to individual real estate company reporting disciplines.
18.4%
19.3%
11.4%
2.3%
-32.2%
-27.1%
51.0%
16.1%
$881,500
$639
4882
4860
14,183
21
34.3%
$903,333
$785,000
$562
3489
3552
13,891
34
25.6%
$881,417
$900,000
$643
4885
5026
14,328
21
35.1%
$834,192
$760,000
$539
4386
4911
21,145
29
23.2%
$699,916
Los Angeles County
$760
$900

Median Price ..........................................
Average Price per Square Foot ...............
Properties Sold .......................................
Properties Pending Sale .........................
Properties For Sale .................................
Days on Market (Pending Sale) ................
Percent Under Contract .........................
Average Median Price for Last 12 Months
Jul 2020 Jul 20216 Month 3 Month % ChangeData*
Current Market Snapshot
Micro Market Report : July 2021
Median sales price.
Average price per square foot.
Properties for sale.
Median Sales Price ($100,000’S)
Jul
Aug
Sep
Oct
Nov
Dec
Jan
Feb
Mar
Apr
May
Jun
Jul
$2,796,500
$1,145
138
*Information obtained from Broker Metrics, The MLS and Foreclosure Radar for all areas in Bel-Air Holmby Hills Micro Market Report. Statistics are subject to change due to individual real estate company reporting disciplines.
60.9%
31.2%
-10.0%
-46.7%
-42.7%
29.2%
-6.9%
1.8%
$3,449,000
$1,214
25
18
151
55
11.9%
$2,905,500
$1,943,000
$902
10
21
186
67
11.3%
$2,814,000
$2,796,500
$1,145
18
16
138
41
11.6%
$2,552,462
$1,737,500
$873
20
30
241
32
12.4%
$2,505,843
Bel-Air Holmby Hills
$1.737
$2.796

Median Price ..........................................
Average Price per Square Foot ...............
Properties Sold .......................................
Properties Pending Sale .........................
Properties For Sale .................................
Days on Market (Pending Sale) ................
Percent Under Contract .........................
Average Median Price for Last 12 Months
Jul 2020 Jul 20216 Month 3 Month % ChangeData*
Current Market Snapshot
Micro Market Report : July 2021
Median sales price.
Average price per square foot.
Properties for sale.
Median Sales Price ($100,000’S)
Jul
Aug
Sep
Oct
Nov
Dec
Jan
Feb
Mar
Apr
May
Jun
Jul
$2,206,500
$903
93
*Information obtained from Broker Metrics, The MLS and Foreclosure Radar for all areas in Beverly Center - Miracle Mile Micro Market Report. Statistics are subject to change due to individual real estate company reporting disciplines.
30.9%
3.8%
46.7%
107.1%
-35.9%
-6.1%
223.0%
11.4%
$2,292,500
$815
18
27
106
20
25.5%
$2,249,000
$1,767,500
$858
18
21
132
43
15.9%
$2,199,316
$2,206,500
$903
22
29
93
31
31.2%
$1,992,415
$1,685,000
$870
15
14
145
33
9.7%
$1,765,917
Beverly Center - Miracle Mile
$1.685
$2.206

Median Price ..........................................
Average Price per Square Foot ...............
Properties Sold .......................................
Properties Pending Sale .........................
Properties For Sale .................................
Days on Market (Pending Sale) ................
Percent Under Contract .........................
Average Median Price for Last 12 Months
Jul 2020 Jul 20216 Month 3 Month % ChangeData*
Current Market Snapshot
Micro Market Report : July 2021
Median sales price.
Average price per square foot.
Properties for sale.
Median Sales Price ($100,000’S)
Jul
Aug
Sep
Oct
Nov
Dec
Jan
Feb
Mar
Apr
May
Jun
Jul
$6,500,000
$1,424
140
*Information obtained from Broker Metrics, The MLS and Foreclosure Radar for all areas in Beverly Hills Micro Market Report. Statistics are subject to change due to individual real estate company reporting disciplines.
40.5%
-19.3%
58.3%
233.3%
-50.2%
19.6%
569.0%
9.0%
$7,550,000
$1,759
22
26
167
81
15.6%
$6,385,000
$6,675,000
$1,464
11
11
172
121
6.4%
$7,022,333
$6,500,000
$1,424
19
20
140
49
14.3%
$6,555,500
$4,625,000
$1,764
12
6
281
41
2.1%
$5,965,417
Beverly Hills
$4.625
$6.500

Median Price ..........................................
Average Price per Square Foot ...............
Properties Sold .......................................
Properties Pending Sale .........................
Properties For Sale .................................
Days on Market (Pending Sale) ................
Percent Under Contract .........................
Average Median Price for Last 12 Months
Jul 2020 Jul 20216 Month 3 Month % ChangeData*
Current Market Snapshot
Micro Market Report : July 2021
Median sales price.
Average price per square foot.
Properties for sale.
Median Sales Price ($100,000’S)
Jul
Aug
Sep
Oct
Nov
Dec
Jan
Feb
Mar
Apr
May
Jun
Jul
$4,010,000
$1,108
149
*Information obtained from Broker Metrics, The MLS and Foreclosure Radar for all areas in Beverly Hills- Post Office Micro Market Report. Statistics are subject to change due to individual real estate company reporting disciplines.
26.3%
9.1%
21.4%
61.5%
-21.2%
28.5%
104.9%
-17.8%
$3,250,000
$1,314
19
20
175
35
11.4%
$3,534,525
$3,000,000
$1,102
7
11
176
92
6.2%
$3,311,013
$4,010,000
$1,108
17
21
149
45
14.1%
$3,196,770
$3,175,000
$1,016
14
13
189
35
6.9%
$3,764,624
Beverly Hills- Post Office
$3.175
$4.010

Median Price ..........................................
Average Price per Square Foot ...............
Properties Sold .......................................
Properties Pending Sale .........................
Properties For Sale .................................
Days on Market (Pending Sale) ................
Percent Under Contract .........................
Average Median Price for Last 12 Months
Jul 2020 Jul 20216 Month 3 Month % ChangeData*
Current Market Snapshot
Micro Market Report : July 2021
Median sales price.
Average price per square foot.
Properties for sale.
Median Sales Price ($100,000’S)
Jul
Aug
Sep
Oct
Nov
Dec
Jan
Feb
Mar
Apr
May
Jun
Jul
$1,848,000
$870
43
*Information obtained from Broker Metrics, The MLS and Foreclosure Radar for all areas in Beverlywood Micro Market Report. Statistics are subject to change due to individual real estate company reporting disciplines.
2.7%
3.7%
25.0%
-43.8%
-45.6%
13.3%
3.3%
-12.1%
$1,782,500
$929
24
18
53
29
34.0%
$1,936,000
$1,662,500
$823
14
6
58
16
10.3%
$1,831,600
$1,848,000
$870
20
9
43
26
20.9%
$1,714,768
$1,800,000
$839
16
16
79
23
20.3%
$1,922,222
Beverlywood
$1.800
$1.848

Median Price ..........................................
Average Price per Square Foot ...............
Properties Sold .......................................
Properties Pending Sale .........................
Properties For Sale .................................
Days on Market (Pending Sale) ................
Percent Under Contract .........................
Average Median Price for Last 12 Months
Jul 2020 Jul 20216 Month 3 Month % ChangeData*
Current Market Snapshot
Micro Market Report : July 2021
Median sales price.
Average price per square foot.
Properties for sale.
Median Sales Price ($100,000’S)
Jul
Aug
Sep
Oct
Nov
Dec
Jan
Feb
Mar
Apr
May
Jun
Jul
$3,647,500
$1,180
150
*Information obtained from Broker Metrics, The MLS and Foreclosure Radar for all areas in Brentwood Micro Market Report. Statistics are subject to change due to individual real estate company reporting disciplines.
2.0%
5.0%
20.0%
-22.5%
-53.6%
24.2%
66.9%
9.5%
$3,887,000
$1,248
50
27
147
46
18.4%
$4,353,667
$4,167,500
$1,105
16
25
181
84
13.8%
$4,026,750
$3,647,500
$1,180
24
31
150
49
20.7%
$3,684,258
$3,575,000
$1,124
20
40
323
40
12.4%
$3,335,125
Brentwood
$3.575
$3.647

Median Price ..........................................
Average Price per Square Foot ...............
Properties Sold .......................................
Properties Pending Sale .........................
Properties For Sale .................................
Days on Market (Pending Sale) ................
Percent Under Contract .........................
Average Median Price for Last 12 Months
Jul 2020 Jul 20216 Month 3 Month % ChangeData*
Current Market Snapshot
Micro Market Report : July 2021
Median sales price.
Average price per square foot.
Properties for sale.
Median Sales Price ($100,000’S)
Jul
Aug
Sep
Oct
Nov
Dec
Jan
Feb
Mar
Apr
May
Jun
Jul
$2,142,000
$845
19
*Information obtained from Broker Metrics, The MLS and Foreclosure Radar for all areas in Cheviot Hills - Rancho Park Micro Market Report. Statistics are subject to change due to individual real estate company reporting disciplines.
-43.6%
-5.3%
0.0%
40.0%
-40.6%
-14.5%
135.8%
14.3%
$2,198,000
$1,001
9
4
20
17
20.0%
$2,464,000
$2,400,000
$1,005
7
8
33
54
24.2%
$2,413,250
$2,142,000
$845
7
7
19
30
36.8%
$2,578,192
$3,800,000
$892
7
5
32
36
15.6%
$2,208,857
Cheviot Hills - Rancho Park
$3.800
$2.142

Median Price ..........................................
Average Price per Square Foot ...............
Properties Sold .......................................
Properties Pending Sale .........................
Properties For Sale .................................
Days on Market (Pending Sale) ................
Percent Under Contract .........................
Average Median Price for Last 12 Months
Jul 2020 Jul 20216 Month 3 Month % ChangeData*
Current Market Snapshot
Micro Market Report : July 2021
Median sales price.
Average price per square foot.
Properties for sale.
Median Sales Price ($100,000’S)
Jul
Aug
Sep
Oct
Nov
Dec
Jan
Feb
Mar
Apr
May
Jun
Jul
$1,645,000
$950
75
*Information obtained from Broker Metrics, The MLS and Foreclosure Radar for all areas in Culver City Micro Market Report. Statistics are subject to change due to individual real estate company reporting disciplines.
8.2%
26.2%
128.6%
-4.0%
-21.1%
-6.9%
21.6%
5.8%
$1,628,000
$934
23
26
94
34
27.7%
$1,588,333
$1,482,500
$874
16
24
80
38
30.0%
$1,603,833
$1,645,000
$950
32
24
75
19
32.0%
$1,494,231
$1,520,000
$753
14
25
95
20
26.3%
$1,407,063
Culver City
$1.520
$1.645

Median Price ..........................................
Average Price per Square Foot ...............
Properties Sold .......................................
Properties Pending Sale .........................
Properties For Sale .................................
Days on Market (Pending Sale) ................
Percent Under Contract .........................
Average Median Price for Last 12 Months
Jul 2020 Jul 20216 Month 3 Month % ChangeData*
Current Market Snapshot
Micro Market Report : July 2021
Median sales price.
Average price per square foot.
Properties for sale.
Median Sales Price ($100,000’S)
Jul
Aug
Sep
Oct
Nov
Dec
Jan
Feb
Mar
Apr
May
Jun
Jul
$475,000
$491
50
*Information obtained from Broker Metrics, The MLS and Foreclosure Radar for all areas in Downtown Micro Market Report. Statistics are subject to change due to individual real estate company reporting disciplines.
-25.2%
9.8%
83.3%
0.0%
-70.2%
116.4%
236.0%
4.2%
$516,500
$450
16
13
50
36
26.0%
$494,500
$540,000
$409
10
11
62
73
17.7%
$518,333
$475,000
$491
11
10
50
30
20.0%
$522,612
$634,950
$447
6
10
168
14
6.0%
$500,829
Downtown
$634
$475

Median Price ..........................................
Average Price per Square Foot ...............
Properties Sold .......................................
Properties Pending Sale .........................
Properties For Sale .................................
Days on Market (Pending Sale) ................
Percent Under Contract .........................
Average Median Price for Last 12 Months
Jul 2020 Jul 20216 Month 3 Month % ChangeData*
Current Market Snapshot
Micro Market Report : July 2021
Median sales price.
Average price per square foot.
Properties for sale.
Median Sales Price ($100,000’S)
Jul
Aug
Sep
Oct
Nov
Dec
Jan
Feb
Mar
Apr
May
Jun
Jul
$2,355,000
$973
119
*Information obtained from Broker Metrics, The MLS and Foreclosure Radar for all areas in Hancock Park - Wilshire Micro Market Report. Statistics are subject to change due to individual real estate company reporting disciplines.
30.8%
26.4%
13.0%
-7.1%
-29.2%
90.5%
31.1%
12.8%
$2,412,500
$827
24
36
125
34
28.8%
$2,051,667
$2,100,000
$808
29
21
133
33
15.8%
$2,063,958
$2,355,000
$973
26
26
119
45
21.8%
$1,978,026
$1,800,000
$770
23
28
168
24
16.7%
$1,724,479
Hancock Park - Wilshire
$1.800
$2.355

Median Price ..........................................
Average Price per Square Foot ...............
Properties Sold .......................................
Properties Pending Sale .........................
Properties For Sale .................................
Days on Market (Pending Sale) ................
Percent Under Contract .........................
Average Median Price for Last 12 Months
Jul 2020 Jul 20216 Month 3 Month % ChangeData*
Current Market Snapshot
Micro Market Report : July 2021
Median sales price.
Average price per square foot.
Properties for sale.
Median Sales Price ($100,000’S)
Jul
Aug
Sep
Oct
Nov
Dec
Jan
Feb
Mar
Apr
May
Jun
Jul
$1,450,000
$705
61
*Information obtained from Broker Metrics, The MLS and Foreclosure Radar for all areas in Hollywood Micro Market Report. Statistics are subject to change due to individual real estate company reporting disciplines.
32.5%
-7.1%
-25.0%
-26.7%
-52.3%
31.7%
53.9%
8.3%
$1,300,000
$718
25
15
77
49
19.5%
$1,363,667
$1,212,500
$702
14
17
90
56
18.9%
$1,313,333
$1,450,000
$705
9
11
61
38
18.0%
$1,287,404
$1,094,500
$759
12
15
128
29
11.7%
$1,180,375
Hollywood
$1.094
$1.450

Median Price ..........................................
Average Price per Square Foot ...............
Properties Sold .......................................
Properties Pending Sale .........................
Properties For Sale .................................
Days on Market (Pending Sale) ................
Percent Under Contract .........................
Average Median Price for Last 12 Months
Jul 2020 Jul 20216 Month 3 Month % ChangeData*
Current Market Snapshot
Micro Market Report : July 2021
Median sales price.
Average price per square foot.
Properties for sale.
Median Sales Price ($100,000’S)
Jul
Aug
Sep
Oct
Nov
Dec
Jan
Feb
Mar
Apr
May
Jun
Jul
$2,081,280
$779
61
*Information obtained from Broker Metrics, The MLS and Foreclosure Radar for all areas in Hollywood Hills East Micro Market Report. Statistics are subject to change due to individual real estate company reporting disciplines.
27.3%
9.3%
118.2%
-6.2%
-54.8%
-62.5%
107.5%
12.9%
$1,595,000
$786
17
29
74
32
39.2%
$1,826,260
$1,599,000
$765
17
16
88
68
18.2%
$1,756,047
$2,081,280
$779
24
15
61
15
24.6%
$1,663,858
$1,635,000
$713
11
16
135
41
11.9%
$1,449,833
Hollywood Hills East
$1.635
$2.081

Median Price ..........................................
Average Price per Square Foot ...............
Properties Sold .......................................
Properties Pending Sale .........................
Properties For Sale .................................
Days on Market (Pending Sale) ................
Percent Under Contract .........................
Average Median Price for Last 12 Months
Jul 2020 Jul 20216 Month 3 Month % ChangeData*
Current Market Snapshot
Micro Market Report : July 2021
Median sales price.
Average price per square foot.
Properties for sale.
Median Sales Price ($100,000’S)
Jul
Aug
Sep
Oct
Nov
Dec
Jan
Feb
Mar
Apr
May
Jun
Jul
$832,450
$612
71
*Information obtained from Broker Metrics, The MLS and Foreclosure Radar for all areas in Inglewood Micro Market Report. Statistics are subject to change due to individual real estate company reporting disciplines.
25.3%
25.2%
-61.5%
29.4%
-24.5%
-51.0%
71.3%
12.2%
$781,288
$586
15
21
56
35
37.5%
$825,561
$702,000
$489
15
14
63
45
22.2%
$798,795
$832,450
$612
10
22
71
20
31.0%
$758,820
$664,500
$489
26
17
94
40
18.1%
$666,583
Inglewood
$664
$832

Median Price ..........................................
Average Price per Square Foot ...............
Properties Sold .......................................
Properties Pending Sale .........................
Properties For Sale .................................
Days on Market (Pending Sale) ................
Percent Under Contract .........................
Average Median Price for Last 12 Months
Jul 2020 Jul 20216 Month 3 Month % ChangeData*
Current Market Snapshot
Micro Market Report : July 2021
Median sales price.
Average price per square foot.
Properties for sale.
Median Sales Price ($100,000’S)
Jul
Aug
Sep
Oct
Nov
Dec
Jan
Feb
Mar
Apr
May
Jun
Jul
$1,635,000
$639
24
*Information obtained from Broker Metrics, The MLS and Foreclosure Radar for all areas in Ladera Heights Micro Market Report. Statistics are subject to change due to individual real estate company reporting disciplines.
14.5%
11.3%
-50.0%
20.0%
-17.2%
-47.6%
45.0%
14.5%
$1,915,250
$547
2
7
16
22
43.8%
$1,674,167
$1,585,000
$651
3
9
23
40
39.1%
$1,641,292
$1,635,000
$639
4
6
24
25
25.0%
$1,633,519
$1,427,500
$574
8
5
29
47
17.2%
$1,396,125
Ladera Heights
$1.427
$1.635

Median Price ..........................................
Average Price per Square Foot ...............
Properties Sold .......................................
Properties Pending Sale .........................
Properties For Sale .................................
Days on Market (Pending Sale) ................
Percent Under Contract .........................
Average Median Price for Last 12 Months
Jul 2020 Jul 20216 Month 3 Month % ChangeData*
Current Market Snapshot
Micro Market Report : July 2021
Median sales price.
Average price per square foot.
Properties for sale.
Median Sales Price ($100,000’S)
Jul
Aug
Sep
Oct
Nov
Dec
Jan
Feb
Mar
Apr
May
Jun
Jul
$2,100,000
$939
168
*Information obtained from Broker Metrics, The MLS and Foreclosure Radar for all areas in Laurel Canyon Micro Market Report. Statistics are subject to change due to individual real estate company reporting disciplines.
11.8%
14.1%
16.7%
-23.7%
-38.0%
-42.2%
23.1%
8.5%
$1,898,585
$865
35
30
218
47
13.8%
$2,132,333
$1,825,000
$830
37
37
209
81
17.7%
$2,108,014
$2,100,000
$939
35
29
168
28
17.3%
$1,966,391
$1,879,000
$823
30
38
271
48
14.0%
$1,812,770
Laurel Canyon
$1.879
$2.100

Median Price ..........................................
Average Price per Square Foot ...............
Properties Sold .......................................
Properties Pending Sale .........................
Properties For Sale .................................
Days on Market (Pending Sale) ................
Percent Under Contract .........................
Average Median Price for Last 12 Months
Jul 2020 Jul 20216 Month 3 Month % ChangeData*
Current Market Snapshot
Micro Market Report : July 2021
Median sales price.
Average price per square foot.
Properties for sale.
Median Sales Price ($100,000’S)
Jul
Aug
Sep
Oct
Nov
Dec
Jan
Feb
Mar
Apr
May
Jun
Jul
$2,225,000
$937
82
*Information obtained from Broker Metrics, The MLS and Foreclosure Radar for all areas in Los Feliz Micro Market Report. Statistics are subject to change due to individual real estate company reporting disciplines.
0.2%
2.1%
75.0%
9.1%
-31.7%
91.1%
59.6%
14.0%
$2,017,500
$911
22
30
90
32
33.3%
$2,334,925
$1,848,500
$831
12
21
101
48
20.8%
$2,233,713
$2,225,000
$937
28
24
82
50
29.3%
$2,103,783
$2,220,000
$918
16
22
120
26
18.3%
$1,809,875
Los Feliz
$2.220
$2.225

Median Price ..........................................
Average Price per Square Foot ...............
Properties Sold .......................................
Properties Pending Sale .........................
Properties For Sale .................................
Days on Market (Pending Sale) ................
Percent Under Contract .........................
Average Median Price for Last 12 Months
Jul 2020 Jul 20216 Month 3 Month % ChangeData*
Current Market Snapshot
Micro Market Report : July 2021
Median sales price.
Average price per square foot.
Properties for sale.
Median Sales Price ($100,000’S)
Jul
Aug
Sep
Oct
Nov
Dec
Jan
Feb
Mar
Apr
May
Jun
Jul
$4,162,051
$1,532
169
*Information obtained from Broker Metrics, The MLS and Foreclosure Radar for all areas in Malibu Micro Market Report. Statistics are subject to change due to individual real estate company reporting disciplines.
-6.0%
51.2%
41.2%
-25.0%
-40.9%
63.2%
26.9%
22.8%
$4,065,000
$1,028
18
31
165
89
18.8%
$4,185,600
$2,100,000
$1,043
17
16
164
108
9.8%
$3,879,467
$4,162,051
$1,532
24
21
169
76
12.4%
$3,499,523
$4,430,000
$1,013
17
28
286
46
9.8%
$2,700,823
Malibu
$4.430
$4.162

Median Price ..........................................
Average Price per Square Foot ...............
Properties Sold .......................................
Properties Pending Sale .........................
Properties For Sale .................................
Days on Market (Pending Sale) ................
Percent Under Contract .........................
Average Median Price for Last 12 Months
Jul 2020 Jul 20216 Month 3 Month % ChangeData*
Current Market Snapshot
Micro Market Report : July 2021
Median sales price.
Average price per square foot.
Properties for sale.
Median Sales Price ($100,000’S)
Jul
Aug
Sep
Oct
Nov
Dec
Jan
Feb
Mar
Apr
May
Jun
Jul
$12,175,000
$2,551
54
*Information obtained from Broker Metrics, The MLS and Foreclosure Radar for all areas in Malibu Beach Micro Market Report. Statistics are subject to change due to individual real estate company reporting disciplines.
60.2%
-19.2%
-30.0%
-54.5%
-40.7%
128.9%
-23.4%
10.3%
$8,880,000
$3,140
7
11
64
73
17.2%
$10,525,000
$8,882,500
$2,624
10
11
63
92
17.5%
$9,385,000
$12,175,000
$2,551
7
5
54
160
9.3%
$8,686,045
$7,600,000
$3,159
10
11
91
70
12.1%
$7,795,152
Malibu Beach
$7.600
$12.175

Median Price ..........................................
Average Price per Square Foot ...............
Properties Sold .......................................
Properties Pending Sale .........................
Properties For Sale .................................
Days on Market (Pending Sale) ................
Percent Under Contract .........................
Average Median Price for Last 12 Months
Jul 2020 Jul 20216 Month 3 Month % ChangeData*
Current Market Snapshot
Micro Market Report : July 2021
Median sales price.
Average price per square foot.
Properties for sale.
Median Sales Price ($100,000’S)
Jul
Aug
Sep
Oct
Nov
Dec
Jan
Feb
Mar
Apr
May
Jun
Jul
$1,391,500
$1,007
50
*Information obtained from Broker Metrics, The MLS and Foreclosure Radar for all areas in Marina Del Rey Micro Market Report. Statistics are subject to change due to individual real estate company reporting disciplines.
-1.3%
5.3%
14.3%
44.4%
-44.4%
-60.4%
160.0%
14.6%
$1,850,000
$915
13
13
56
16
23.2%
$1,807,083
$1,660,000
$917
9
10
38
82
26.3%
$1,828,708
$1,391,500
$1,007
8
13
50
25
26.0%
$1,788,058
$1,410,000
$956
7
9
90
63
10.0%
$1,526,458
Marina Del Rey
$1.410
$1.391

Median Price ..........................................
Average Price per Square Foot ...............
Properties Sold .......................................
Properties Pending Sale .........................
Properties For Sale .................................
Days on Market (Pending Sale) ................
Percent Under Contract .........................
Average Median Price for Last 12 Months
Jul 2020 Jul 20216 Month 3 Month % ChangeData*
Current Market Snapshot
Micro Market Report : July 2021
Median sales price.
Average price per square foot.
Properties for sale.
Median Sales Price ($100,000’S)
Jul
Aug
Sep
Oct
Nov
Dec
Jan
Feb
Mar
Apr
May
Jun
Jul
$1,100,000
$678
129
*Information obtained from Broker Metrics, The MLS and Foreclosure Radar for all areas in Mid Los Angeles Micro Market Report. Statistics are subject to change due to individual real estate company reporting disciplines.
26.8%
29.1%
41.7%
5.4%
-29.9%
1.4%
50.3%
14.6%
$929,500
$601
38
45
141
23
31.9%
$1,065,833
$915,000
$613
27
27
144
46
18.8%
$1,018,750
$1,100,000
$678
34
39
129
36
30.2%
$965,192
$867,500
$525
24
37
184
35
20.1%
$824,125
Mid Los Angeles
$867
$1.100

Median Price ..........................................
Average Price per Square Foot ...............
Properties Sold .......................................
Properties Pending Sale .........................
Properties For Sale .................................
Days on Market (Pending Sale) ................
Percent Under Contract .........................
Average Median Price for Last 12 Months
Jul 2020 Jul 20216 Month 3 Month % ChangeData*
Current Market Snapshot
Micro Market Report : July 2021
Median sales price.
Average price per square foot.
Properties for sale.
Median Sales Price ($100,000’S)
Jul
Aug
Sep
Oct
Nov
Dec
Jan
Feb
Mar
Apr
May
Jun
Jul
$1,275,000
$639
29
*Information obtained from Broker Metrics, The MLS and Foreclosure Radar for all areas in Mid Wilshire Micro Market Report. Statistics are subject to change due to individual real estate company reporting disciplines.
10.9%
-14.3%
25.0%
300.0%
-37.0%
75.4%
534.5%
6.1%
$1,035,000
$676
5
4
39
47
10.3%
$1,158,333
$1,075,000
$616
6
4
40
45
10.0%
$1,130,000
$1,275,000
$639
5
4
29
98
13.8%
$1,128,831
$1,150,000
$746
4
1
46
56
2.2%
$1,059,800
Mid Wilshire
$1.150
$1.275

Median Price ..........................................
Average Price per Square Foot ...............
Properties Sold .......................................
Properties Pending Sale .........................
Properties For Sale .................................
Days on Market (Pending Sale) ................
Percent Under Contract .........................
Average Median Price for Last 12 Months
Jul 2020 Jul 20216 Month 3 Month % ChangeData*
Current Market Snapshot
Micro Market Report : July 2021
Median sales price.
Average price per square foot.
Properties for sale.
Median Sales Price ($100,000’S)
Jul
Aug
Sep
Oct
Nov
Dec
Jan
Feb
Mar
Apr
May
Jun
Jul
$4,350,000
$1,435
149
*Information obtained from Broker Metrics, The MLS and Foreclosure Radar for all areas in Pacific Palisades Micro Market Report. Statistics are subject to change due to individual real estate company reporting disciplines.
22.9%
23.4%
52.2%
3.3%
-33.5%
65.8%
55.3%
5.9%
$3,788,500
$1,207
38
36
144
44
25.0%
$4,067,042
$2,950,000
$1,071
17
34
143
82
23.8%
$3,913,604
$4,350,000
$1,435
35
31
149
46
20.8%
$3,584,856
$3,540,000
$1,163
23
30
224
28
13.4%
$3,374,791
Pacific Palisades
$3.540
$4.350

Median Price ..........................................
Average Price per Square Foot ...............
Properties Sold .......................................
Properties Pending Sale .........................
Properties For Sale .................................
Days on Market (Pending Sale) ................
Percent Under Contract .........................
Average Median Price for Last 12 Months
Jul 2020 Jul 20216 Month 3 Month % ChangeData*
Current Market Snapshot
Micro Market Report : July 2021
Median sales price.
Average price per square foot.
Properties for sale.
Median Sales Price ($100,000’S)
Jul
Aug
Sep
Oct
Nov
Dec
Jan
Feb
Mar
Apr
May
Jun
Jul
$1,880,000
$932
89
*Information obtained from Broker Metrics, The MLS and Foreclosure Radar for all areas in Palms - Mar Vista Micro Market Report. Statistics are subject to change due to individual real estate company reporting disciplines.
7.4%
2.8%
3.2%
-27.3%
-38.2%
2.0%
17.7%
4.5%
$2,235,000
$928
34
33
92
21
35.9%
$1,845,833
$2,000,000
$927
22
30
108
40
27.8%
$1,905,083
$1,880,000
$932
32
24
89
26
27.0%
$1,859,663
$1,750,000
$907
31
33
144
26
22.9%
$1,775,459
Palms - Mar Vista
$1.750
$1.880

Median Price ..........................................
Average Price per Square Foot ...............
Properties Sold .......................................
Properties Pending Sale .........................
Properties For Sale .................................
Days on Market (Pending Sale) ................
Percent Under Contract .........................
Average Median Price for Last 12 Months
Jul 2020 Jul 20216 Month 3 Month % ChangeData*
Current Market Snapshot
Micro Market Report : July 2021
Median sales price.
Average price per square foot.
Properties for sale.
Median Sales Price ($100,000’S)
Jul
Aug
Sep
Oct
Nov
Dec
Jan
Feb
Mar
Apr
May
Jun
Jul
$940,000
$624
121
*Information obtained from Broker Metrics, The MLS and Foreclosure Radar for all areas in Park Hills Heights Micro Market Report. Statistics are subject to change due to individual real estate company reporting disciplines.
9.0%
12.6%
10.0%
-32.0%
-23.9%
-40.9%
-10.6%
13.7%
$976,000
$595
49
48
138
16
34.8%
$933,333
$880,000
$549
34
38
113
26
33.6%
$913,083
$940,000
$624
44
34
121
19
28.1%
$880,596
$862,000
$554
40
50
159
31
31.4%
$759,938
Park Hills Heights
$862
$940

Median Price ..........................................
Average Price per Square Foot ...............
Properties Sold .......................................
Properties Pending Sale .........................
Properties For Sale .................................
Days on Market (Pending Sale) ................
Percent Under Contract .........................
Average Median Price for Last 12 Months
Jul 2020 Jul 20216 Month 3 Month % ChangeData*
Current Market Snapshot
Micro Market Report : July 2021
Median sales price.
Average price per square foot.
Properties for sale.
Median Sales Price ($100,000’S)
Jul
Aug
Sep
Oct
Nov
Dec
Jan
Feb
Mar
Apr
May
Jun
Jul
$2,285,000
$818
31
*Information obtained from Broker Metrics, The MLS and Foreclosure Radar for all areas in Playa Del Rey Micro Market Report. Statistics are subject to change due to individual real estate company reporting disciplines.
25.2%
6.0%
-44.4%
14.3%
-8.8%
-13.6%
25.3%
20.3%
$1,750,000
$614
3
8
32
16
25.0%
$2,217,833
$1,445,000
$801
3
5
19
56
26.3%
$2,070,167
$2,285,000
$818
5
8
31
40
25.8%
$2,001,231
$1,825,000
$772
9
7
34
46
20.6%
$1,595,917
Playa Del Rey
$1.825
$2.285

Median Price ..........................................
Average Price per Square Foot ...............
Properties Sold .......................................
Properties Pending Sale .........................
Properties For Sale .................................
Days on Market (Pending Sale) ................
Percent Under Contract .........................
Average Median Price for Last 12 Months
Jul 2020 Jul 20216 Month 3 Month % ChangeData*
Current Market Snapshot
Micro Market Report : July 2021
Median sales price.
Average price per square foot.
Properties for sale.
Median Sales Price ($100,000’S)
Jul
Aug
Sep
Oct
Nov
Dec
Jan
Feb
Mar
Apr
May
Jun
Jul
$2,505,000
$777
19
*Information obtained from Broker Metrics, The MLS and Foreclosure Radar for all areas in Playa Vista Micro Market Report. Statistics are subject to change due to individual real estate company reporting disciplines.
28.5%
2.9%
133.3%
166.7%
-50.0%
-59.8%
433.3%
-10.5%
$2,732,500
$764
2
4
19
34
21.1%
$2,390,000
$2,220,000
$805
5
2
18
26
11.1%
$2,286,448
$2,505,000
$777
7
8
19
15
42.1%
$2,208,361
$1,950,000
$755
3
3
38
37
7.9%
$2,466,580
Playa Vista
$1.950
$2.505

Median Price ..........................................
Average Price per Square Foot ...............
Properties Sold .......................................
Properties Pending Sale .........................
Properties For Sale .................................
Days on Market (Pending Sale) ................
Percent Under Contract .........................
Average Median Price for Last 12 Months
Jul 2020 Jul 20216 Month 3 Month % ChangeData*
Current Market Snapshot
Micro Market Report : July 2021
Median sales price.
Average price per square foot.
Properties for sale.
Median Sales Price ($100,000’S)
Jul
Aug
Sep
Oct
Nov
Dec
Jan
Feb
Mar
Apr
May
Jun
Jul
$3,281,250
$1,314
152
*Information obtained from Broker Metrics, The MLS and Foreclosure Radar for all areas in Santa Monica Micro Market Report. Statistics are subject to change due to individual real estate company reporting disciplines.
13.3%
14.4%
21.7%
-2.7%
-29.6%
29.4%
38.3%
6.3%
$3,350,000
$1,528
31
33
144
37
22.9%
$3,230,317
$3,475,000
$1,090
15
14
132
50
10.6%
$3,281,825
$3,281,250
$1,314
28
36
152
28
23.7%
$3,068,765
$2,895,000
$1,149
23
37
216
21
17.1%
$2,874,938
Santa Monica
$2.895
$3.281

Median Price ..........................................
Average Price per Square Foot ...............
Properties Sold .......................................
Properties Pending Sale .........................
Properties For Sale .................................
Days on Market (Pending Sale) ................
Percent Under Contract .........................
Average Median Price for Last 12 Months
Jul 2020 Jul 20216 Month 3 Month % ChangeData*
Current Market Snapshot
Micro Market Report : July 2021
Median sales price.
Average price per square foot.
Properties for sale.
Median Sales Price ($100,000’S)
Jul
Aug
Sep
Oct
Nov
Dec
Jan
Feb
Mar
Apr
May
Jun
Jul
$2,696,944
$1,124
322
*Information obtained from Broker Metrics, The MLS and Foreclosure Radar for all areas in Sunset Strip - Hollywood Hills West Micro Market Report. Statistics are subject to change due to individual real estate company reporting disciplines.
34.0%
30.4%
9.5%
4.2%
-28.8%
4.7%
46.2%
11.6%
$2,125,000
$1,111
52
48
359
53
13.4%
$2,494,148
$1,995,000
$854
47
42
376
72
11.2%
$2,509,574
$2,696,944
$1,124
46
50
322
45
15.5%
$2,264,733
$2,012,500
$862
42
48
452
43
10.6%
$2,001,729
Sunset Strip - Hollywood Hills West
$2.012
$2.696

Median Price ..........................................
Average Price per Square Foot ...............
Properties Sold .......................................
Properties Pending Sale .........................
Properties For Sale .................................
Days on Market (Pending Sale) ................
Percent Under Contract .........................
Average Median Price for Last 12 Months
Jul 2020 Jul 20216 Month 3 Month % ChangeData*
Current Market Snapshot
Micro Market Report : July 2021
Median sales price.
Average price per square foot.
Properties for sale.
Median Sales Price ($100,000’S)
Jul
Aug
Sep
Oct
Nov
Dec
Jan
Feb
Mar
Apr
May
Jun
Jul
$2,215,000
$1,181
167
*Information obtained from Broker Metrics, The MLS and Foreclosure Radar for all areas in Venice Micro Market Report. Statistics are subject to change due to individual real estate company reporting disciplines.
2.4%
9.0%
55.0%
38.1%
-26.4%
-32.2%
87.7%
-4.5%
$1,797,500
$1,122
18
31
181
26
17.1%
$2,213,333
$1,602,500
$942
10
24
184
73
13.0%
$2,073,750
$2,215,000
$1,181
31
29
167
31
17.4%
$2,012,415
$2,163,900
$1,083
20
21
227
45
9.3%
$2,107,194
Venice
$2.163
$2.215

Median Price ..........................................
Average Price per Square Foot ...............
Properties Sold .......................................
Properties Pending Sale .........................
Properties For Sale .................................
Days on Market (Pending Sale) ................
Percent Under Contract .........................
Average Median Price for Last 12 Months
Jul 2020 Jul 20216 Month 3 Month % ChangeData*
Current Market Snapshot
Micro Market Report : July 2021
Median sales price.
Average price per square foot.
Properties for sale.
Median Sales Price ($100,000’S)
Jul
Aug
Sep
Oct
Nov
Dec
Jan
Feb
Mar
Apr
May
Jun
Jul
$1,967,500
$948
84
*Information obtained from Broker Metrics, The MLS and Foreclosure Radar for all areas in West Hollywood Micro Market Report. Statistics are subject to change due to individual real estate company reporting disciplines.
-4.3%
-1.5%
57.1%
100.0%
-58.4%
192.5%
381.0%
3.2%
$1,898,585
$1,026
13
17
133
41
12.8%
$2,394,167
$2,050,000
$1,197
14
16
118
85
13.6%
$2,225,839
$1,967,500
$948
22
18
84
46
21.4%
$2,157,726
$2,055,000
$962
14
9
202
16
4.5%
$2,089,396
West Hollywood
$2.055
$1.967

Median Price ..........................................
Average Price per Square Foot ...............
Properties Sold .......................................
Properties Pending Sale .........................
Properties For Sale .................................
Days on Market (Pending Sale) ................
Percent Under Contract .........................
Average Median Price for Last 12 Months
Jul 2020 Jul 20216 Month 3 Month % ChangeData*
Current Market Snapshot
Micro Market Report : July 2021
Median sales price.
Average price per square foot.
Properties for sale.
Median Sales Price ($100,000’S)
Jul
Aug
Sep
Oct
Nov
Dec
Jan
Feb
Mar
Apr
May
Jun
Jul
$1,486,500
$880
69
*Information obtained from Broker Metrics, The MLS and Foreclosure Radar for all areas in West Los Angeles Micro Market Report. Statistics are subject to change due to individual real estate company reporting disciplines.
-1.9%
15.6%
160.0%
7.1%
-1.4%
1.7%
8.7%
0.9%
$1,437,250
$738
6
19
58
19
32.8%
$1,517,917
$975,000
$616
7
14
49
41
28.6%
$1,467,333
$1,486,500
$880
13
15
69
24
21.7%
$1,412,115
$1,515,000
$761
5
14
70
23
20.0%
$1,400,167
West Los Angeles
$1.515
$1.486

Median Price ..........................................
Average Price per Square Foot ...............
Properties Sold .......................................
Properties Pending Sale .........................
Properties For Sale .................................
Days on Market (Pending Sale) ................
Percent Under Contract .........................
Average Median Price for Last 12 Months
Jul 2020 Jul 20216 Month 3 Month % ChangeData*
Current Market Snapshot
Micro Market Report : July 2021
Median sales price.
Average price per square foot.
Properties for sale.
Median Sales Price ($100,000’S)
Jul
Aug
Sep
Oct
Nov
Dec
Jan
Feb
Mar
Apr
May
Jun
Jul
$1,450,000
$798
105
*Information obtained from Broker Metrics, The MLS and Foreclosure Radar for all areas in Westchester Micro Market Report. Statistics are subject to change due to individual real estate company reporting disciplines.
6.9%
9.8%
9.5%
-23.8%
1.0%
-20.0%
-24.5%
7.7%
$1,446,020
$803
45
31
74
14
41.9%
$1,451,983
$1,405,000
$764
14
25
59
50
42.4%
$1,405,495
$1,450,000
$798
46
32
105
21
30.5%
$1,380,363
$1,356,500
$727
42
42
104
26
40.4%
$1,281,983
Westchester
$1.356
$1.450

Median Price ..........................................
Average Price per Square Foot ...............
Properties Sold .......................................
Properties Pending Sale .........................
Properties For Sale .................................
Days on Market (Pending Sale) ................
Percent Under Contract .........................
Average Median Price for Last 12 Months
Jul 2020 Jul 20216 Month 3 Month % ChangeData*
Current Market Snapshot
Micro Market Report : July 2021
Median sales price.
Average price per square foot.
Properties for sale.
Median Sales Price ($100,000’S)
Jul
Aug
Sep
Oct
Nov
Dec
Jan
Feb
Mar
Apr
May
Jun
Jul
$2,847,500
$1,111
73
*Information obtained from Broker Metrics, The MLS and Foreclosure Radar for all areas in Westwood - Century City Micro Market Report. Statistics are subject to change due to individual real estate company reporting disciplines.
9.6%
24.0%
40.0%
40.0%
-59.2%
29.0%
243.3%
-0.8%
$2,445,026
$1,013
23
15
74
11
20.3%
$2,691,893
$2,520,000
$895
11
12
60
80
20.0%
$2,526,118
$2,847,500
$1,111
14
21
73
35
28.8%
$2,436,035
$2,598,000
$896
10
15
179
27
8.4%
$2,455,803
Westwood - Century City
$2.598
$2.847

Median Price ..........................................
Average Price per Square Foot ...............
Properties Sold .......................................
Properties Pending Sale .........................
Properties For Sale .................................
Days on Market (Pending Sale) ................
Percent Under Contract .........................
Average Median Price for Last 12 Months
Jul 2020 Jul 20216 Month 3 Month % ChangeData*
Current Market Snapshot
Micro Market Report : July 2021
Median sales price.
Average price per square foot.
Properties for sale.
Median Sales Price ($100,000’S)
Jul
Aug
Sep
Oct
Nov
Dec
Jan
Feb
Mar
Apr
May
Jun
Jul
$1,530,000
$873
764
*Information obtained from Broker Metrics, The MLS and Foreclosure Radar for all areas in South Bay Macro Market Micro Market Report. Statistics are subject to change due to individual real estate company reporting disciplines.
18.1%
20.1%
-6.5%
10.0%
-23.9%
-42.2%
44.5%
19.0%
$1,500,000
$842
305
306
774
23
39.5%
$1,546,667
$1,310,000
$771
189
224
653
32
34.3%
$1,469,167
$1,530,000
$873
287
320
764
21
41.9%
$1,401,538
$1,295,000
$727
307
291
1,004
36
29.0%
$1,177,725
South Bay Macro Market
$1.295
$1.530

Median Price ..........................................
Average Price per Square Foot ...............
Properties Sold .......................................
Properties Pending Sale .........................
Properties For Sale .................................
Days on Market (Pending Sale) ................
Percent Under Contract .........................
Average Median Price for Last 12 Months
Jul 2020 Jul 20216 Month 3 Month % ChangeData*
Current Market Snapshot
Micro Market Report : July 2021
Median sales price.
Average price per square foot.
Properties for sale.
Median Sales Price ($100,000’S)
Jul
Aug
Sep
Oct
Nov
Dec
Jan
Feb
Mar
Apr
May
Jun
Jul
$1,748,750
$835
18
*Information obtained from Broker Metrics, The MLS and Foreclosure Radar for all areas in El Segundo Micro Market Report. Statistics are subject to change due to individual real estate company reporting disciplines.
12.8%
11.6%
33.3%
-33.3%
-28.0%
-20.0%
-7.4%
18.4%
$1,602,500
$1,103
8
8
24
72
33.3%
$1,924,583
$1,650,000
$774
9
9
21
29
42.9%
$1,733,958
$1,748,750
$835
12
4
18
8
22.2%
$1,748,519
$1,550,000
$748
9
6
25
10
24.0%
$1,476,458
El Segundo
$1.550
$1.748

Median Price ..........................................
Average Price per Square Foot ...............
Properties Sold .......................................
Properties Pending Sale .........................
Properties For Sale .................................
Days on Market (Pending Sale) ................
Percent Under Contract .........................
Average Median Price for Last 12 Months
Jul 2020 Jul 20216 Month 3 Month % ChangeData*
Current Market Snapshot
Micro Market Report : July 2021
Median sales price.
Average price per square foot.
Properties for sale.
Median Sales Price ($100,000’S)
Jul
Aug
Sep
Oct
Nov
Dec
Jan
Feb
Mar
Apr
May
Jun
Jul
$2,310,000
$1,171
49
*Information obtained from Broker Metrics, The MLS and Foreclosure Radar for all areas in Hermosa Beach Micro Market Report. Statistics are subject to change due to individual real estate company reporting disciplines.
-9.4%
4.5%
-28.6%
30.0%
-7.5%
-61.0%
40.6%
13.7%
$3,537,500
$1,430
14
15
54
56
27.8%
$2,338,333
$1,651,000
$1,092
8
11
46
68
23.9%
$2,555,833
$2,310,000
$1,171
10
13
49
20
26.5%
$2,242,731
$2,550,000
$1,121
14
10
53
51
18.9%
$1,972,969
Hermosa Beach
$2.550
$2.310

Median Price ..........................................
Average Price per Square Foot ...............
Properties Sold .......................................
Properties Pending Sale .........................
Properties For Sale .................................
Days on Market (Pending Sale) ................
Percent Under Contract .........................
Average Median Price for Last 12 Months
Jul 2020 Jul 20216 Month 3 Month % ChangeData*
Current Market Snapshot
Micro Market Report : July 2021
Median sales price.
Average price per square foot.
Properties for sale.
Median Sales Price ($100,000’S)
Jul
Aug
Sep
Oct
Nov
Dec
Jan
Feb
Mar
Apr
May
Jun
Jul
$3,432,500
$1,294
106
*Information obtained from Broker Metrics, The MLS and Foreclosure Radar for all areas in Manhattan Beach Micro Market Report. Statistics are subject to change due to individual real estate company reporting disciplines.
35.3%
33.3%
0.0%
-9.5%
-47.5%
-26.5%
72.4%
21.0%
$3,450,000
$1,155
38
41
136
28
30.1%
$3,101,492
$3,417,500
$1,691
14
21
103
48
20.4%
$3,200,663
$3,432,500
$1,294
40
38
106
35
35.8%
$3,023,960
$2,537,500
$971
40
42
202
47
20.8%
$2,499,235
Manhattan Beach
$2.537
$3.432

Median Price ..........................................
Average Price per Square Foot ...............
Properties Sold .......................................
Properties Pending Sale .........................
Properties For Sale .................................
Days on Market (Pending Sale) ................
Percent Under Contract .........................
Average Median Price for Last 12 Months
Jul 2020 Jul 20216 Month 3 Month % ChangeData*
Current Market Snapshot
Micro Market Report : July 2021
Median sales price.
Average price per square foot.
Properties for sale.
Median Sales Price ($100,000’S)
Jul
Aug
Sep
Oct
Nov
Dec
Jan
Feb
Mar
Apr
May
Jun
Jul
$3,025,000
$846
12
*Information obtained from Broker Metrics, The MLS and Foreclosure Radar for all areas in Manhattan Beach Mira Costa Micro Market Report. Statistics are subject to change due to individual real estate company reporting disciplines.
31.1%
15.7%
-43.8%
-30.0%
-58.6%
35.8%
69.2%
32.2%
$3,510,000
$785
4
9
23
14
39.1%
$2,944,722
$0
$0
0
4
13
30
30.8%
$3,104,861
$3,025,000
$846
9
7
12
33
58.3%
$2,932,639
$2,307,500
$731
16
10
29
24
34.5%
$2,218,875
Manhattan Beach Mira Costa
$2.307
$3.025

Median Price ..........................................
Average Price per Square Foot ...............
Properties Sold .......................................
Properties Pending Sale .........................
Properties For Sale .................................
Days on Market (Pending Sale) ................
Percent Under Contract .........................
Average Median Price for Last 12 Months
Jul 2020 Jul 20216 Month 3 Month % ChangeData*
Current Market Snapshot
Micro Market Report : July 2021
Median sales price.
Average price per square foot.
Properties for sale.
Median Sales Price ($100,000’S)
Jul
Aug
Sep
Oct
Nov
Dec
Jan
Feb
Mar
Apr
May
Jun
Jul
$3,787,500
$1,765
36
*Information obtained from Broker Metrics, The MLS and Foreclosure Radar for all areas in Manhattan Beach Sand Micro Market Report. Statistics are subject to change due to individual real estate company reporting disciplines.
36.2%
37.6%
0.0%
-30.0%
-51.4%
176.0%
43.9%
11.8%
$4,330,000
$1,398
14
10
43
32
23.3%
$3,628,333
$6,990,000
$2,140
5
5
46
86
10.9%
$3,951,667
$3,787,500
$1,765
10
7
36
89
19.4%
$3,807,107
$2,780,000
$1,283
10
10
74
32
13.5%
$3,405,626
Manhattan Beach Sand
$2.780
$3.787

Median Price ..........................................
Average Price per Square Foot ...............
Properties Sold .......................................
Properties Pending Sale .........................
Properties For Sale .................................
Days on Market (Pending Sale) ................
Percent Under Contract .........................
Average Median Price for Last 12 Months
Jul 2020 Jul 20216 Month 3 Month % ChangeData*
Current Market Snapshot
Micro Market Report : July 2021
Median sales price.
Average price per square foot.
Properties for sale.
Median Sales Price ($100,000’S)
Jul
Aug
Sep
Oct
Nov
Dec
Jan
Feb
Mar
Apr
May
Jun
Jul
$3,700,000
$1,254
36
*Information obtained from Broker Metrics, The MLS and Foreclosure Radar for all areas in Manhattan Beach Tree Micro Market Report. Statistics are subject to change due to individual real estate company reporting disciplines.
37.2%
10.8%
-33.3%
16.7%
-32.1%
-62.0%
71.8%
2.4%
$3,400,000
$1,063
13
15
45
26
33.3%
$3,040,937
$3,077,000
$1,071
6
5
26
54
19.2%
$2,923,385
$3,700,000
$1,254
8
14
36
15
38.9%
$2,826,678
$2,697,000
$1,132
12
12
53
40
22.6%
$2,760,523
Manhattan Beach Tree
$2.697
$3.700

Median Price ..........................................
Average Price per Square Foot ...............
Properties Sold .......................................
Properties Pending Sale .........................
Properties For Sale .................................
Days on Market (Pending Sale) ................
Percent Under Contract .........................
Average Median Price for Last 12 Months
Jul 2020 Jul 20216 Month 3 Month % ChangeData*
Current Market Snapshot
Micro Market Report : July 2021
Median sales price.
Average price per square foot.
Properties for sale.
Median Sales Price ($100,000’S)
Jul
Aug
Sep
Oct
Nov
Dec
Jan
Feb
Mar
Apr
May
Jun
Jul
$2,662,500
$864
66
*Information obtained from Broker Metrics, The MLS and Foreclosure Radar for all areas in Palos Verdes Estates Micro Market Report. Statistics are subject to change due to individual real estate company reporting disciplines.
26.3%
14.3%
73.3%
-25.0%
-38.3%
-52.1%
21.6%
16.3%
$2,442,187
$898
20
20
63
20
31.7%
$2,462,483
$2,075,000
$716
11
11
58
75
19.0%
$2,366,606
$2,662,500
$864
26
24
66
24
36.4%
$2,259,376
$2,108,000
$756
15
32
107
50
29.9%
$1,942,021
Palos Verdes Estates
$2.108
$2.662

Median Price ..........................................
Average Price per Square Foot ...............
Properties Sold .......................................
Properties Pending Sale .........................
Properties For Sale .................................
Days on Market (Pending Sale) ................
Percent Under Contract .........................
Average Median Price for Last 12 Months
Jul 2020 Jul 20216 Month 3 Month % ChangeData*
Current Market Snapshot
Micro Market Report : July 2021
Median sales price.
Average price per square foot.
Properties for sale.
Median Sales Price ($100,000’S)
Jul
Aug
Sep
Oct
Nov
Dec
Jan
Feb
Mar
Apr
May
Jun
Jul
$1,699,500
$766
125
*Information obtained from Broker Metrics, The MLS and Foreclosure Radar for all areas in Rancho Palos Verdes Micro Market Report. Statistics are subject to change due to individual real estate company reporting disciplines.
9.6%
9.0%
7.3%
50.0%
-4.6%
-45.5%
57.2%
18.2%
$1,851,000
$730
50
38
120
21
31.7%
$1,791,500
$1,451,000
$673
29
37
109
27
33.9%
$1,732,583
$1,699,500
$766
44
51
125
18
40.8%
$1,608,981
$1,550,000
$703
41
34
131
34
26.0%
$1,360,917
Rancho Palos Verdes
$1.550
$1.699

Median Price ..........................................
Average Price per Square Foot ...............
Properties Sold .......................................
Properties Pending Sale .........................
Properties For Sale .................................
Days on Market (Pending Sale) ................
Percent Under Contract .........................
Average Median Price for Last 12 Months
Jul 2020 Jul 20216 Month 3 Month % ChangeData*
Current Market Snapshot
Micro Market Report : July 2021
Median sales price.
Average price per square foot.
Properties for sale.
Median Sales Price ($100,000’S)
Jul
Aug
Sep
Oct
Nov
Dec
Jan
Feb
Mar
Apr
May
Jun
Jul
$1,350,000
$845
42
*Information obtained from Broker Metrics, The MLS and Foreclosure Radar for all areas in Redondo Beach- North Micro Market Report. Statistics are subject to change due to individual real estate company reporting disciplines.
5.5%
26.9%
-32.0%
-14.3%
-22.2%
-47.9%
10.2%
3.8%
$1,365,000
$792
22
26
47
10
55.3%
$1,363,333
$1,202,500
$737
18
23
41
40
56.1%
$1,324,167
$1,350,000
$845
17
18
42
15
42.9%
$1,231,038
$1,280,000
$666
25
21
54
28
38.9%
$1,186,447
Redondo Beach- North
$1.280
$1.350

Median Price ..........................................
Average Price per Square Foot ...............
Properties Sold .......................................
Properties Pending Sale .........................
Properties For Sale .................................
Days on Market (Pending Sale) ................
Percent Under Contract .........................
Average Median Price for Last 12 Months
Jul 2020 Jul 20216 Month 3 Month % ChangeData*
Current Market Snapshot
Micro Market Report : July 2021
Median sales price.
Average price per square foot.
Properties for sale.
Median Sales Price ($100,000’S)
Jul
Aug
Sep
Oct
Nov
Dec
Jan
Feb
Mar
Apr
May
Jun
Jul
$1,780,000
$870
34
*Information obtained from Broker Metrics, The MLS and Foreclosure Radar for all areas in Redondo Beach- South Micro Market Report. Statistics are subject to change due to individual real estate company reporting disciplines.
9.3%
23.2%
-35.0%
-36.8%
-47.7%
-21.3%
20.7%
17.0%
$1,525,000
$800
19
14
43
12
32.6%
$1,886,333
$1,610,000
$796
7
10
33
21
30.3%
$1,816,917
$1,780,000
$870
13
12
34
35
35.3%
$1,791,537
$1,628,983
$706
20
19
65
45
29.2%
$1,530,583
Redondo Beach- South
$1.628
$1.780

Median Price ..........................................
Average Price per Square Foot ...............
Properties Sold .......................................
Properties Pending Sale .........................
Properties For Sale .................................
Days on Market (Pending Sale) ................
Percent Under Contract .........................
Average Median Price for Last 12 Months
Jul 2020 Jul 20216 Month 3 Month % ChangeData*
Current Market Snapshot
Micro Market Report : July 2021
Median sales price.
Average price per square foot.
Properties for sale.
Median Sales Price ($100,000’S)
Jul
Aug
Sep
Oct
Nov
Dec
Jan
Feb
Mar
Apr
May
Jun
Jul
$3,795,900
$1,054
19
*Information obtained from Broker Metrics, The MLS and Foreclosure Radar for all areas in Rolling Hills Micro Market Report. Statistics are subject to change due to individual real estate company reporting disciplines.
-11.7%
42.4%
-33.3%
0.0%
-17.4%
-4.9%
21.1%
25.3%
$3,082,500
$859
4
5
20
134
25.0%
$4,257,543
$4,050,000
$788
5
3
20
61
15.0%
$3,873,355
$3,795,900
$1,054
2
5
19
62
26.3%
$3,947,895
$4,300,000
$740
3
5
23
65
21.7%
$3,149,688
Rolling Hills
$4.300
$3.795

Median Price ..........................................
Average Price per Square Foot ...............
Properties Sold .......................................
Properties Pending Sale .........................
Properties For Sale .................................
Days on Market (Pending Sale) ................
Percent Under Contract .........................
Average Median Price for Last 12 Months
Jul 2020 Jul 20216 Month 3 Month % ChangeData*
Current Market Snapshot
Micro Market Report : July 2021
Median sales price.
Average price per square foot.
Properties for sale.
Median Sales Price ($100,000’S)
Jul
Aug
Sep
Oct
Nov
Dec
Jan
Feb
Mar
Apr
May
Jun
Jul
$2,025,000
$940
19
*Information obtained from Broker Metrics, The MLS and Foreclosure Radar for all areas in Rolling Hills Estates Micro Market Report. Statistics are subject to change due to individual real estate company reporting disciplines.
10.2%
23.0%
-35.7%
0.0%
-58.7%
7.1%
142.1%
21.2%
$2,600,000
$755
11
3
17
3
17.6%
$2,284,000
$1,930,750
$614
6
7
14
39
50.0%
$2,563,833
$2,025,000
$940
9
9
19
23
47.4%
$2,180,019
$1,837,500
$764
14
9
46
22
19.6%
$1,798,167
Rolling Hills Estates
$1.837
$2.025

Median Price ..........................................
Average Price per Square Foot ...............
Properties Sold .......................................
Properties Pending Sale .........................
Properties For Sale .................................
Days on Market (Pending Sale) ................
Percent Under Contract .........................
Average Median Price for Last 12 Months
Jul 2020 Jul 20216 Month 3 Month % ChangeData*
Current Market Snapshot
Micro Market Report : July 2021
Median sales price.
Average price per square foot.
Properties for sale.
Median Sales Price ($100,000’S)
Jul
Aug
Sep
Oct
Nov
Dec
Jan
Feb
Mar
Apr
May
Jun
Jul
$849,000
$581
90
*Information obtained from Broker Metrics, The MLS and Foreclosure Radar for all areas in San Pedro Micro Market Report. Statistics are subject to change due to individual real estate company reporting disciplines.
12.0%
24.1%
-18.2%
43.3%
-14.3%
-47.9%
67.2%
10.7%
$850,000
$558
22
42
83
15
50.6%
$839,000
$908,500
$526
26
33
78
19
42.3%
$851,074
$849,000
$581
36
43
90
20
47.8%
$813,611
$758,000
$468
44
30
105
38
28.6%
$734,646
San Pedro
$758
$849

Median Price ..........................................
Average Price per Square Foot ...............
Properties Sold .......................................
Properties Pending Sale .........................
Properties For Sale .................................
Days on Market (Pending Sale) ................
Percent Under Contract .........................
Average Median Price for Last 12 Months
Jul 2020 Jul 20216 Month 3 Month % ChangeData*
Current Market Snapshot
Micro Market Report : July 2021
Median sales price.
Average price per square foot.
Properties for sale.
Median Sales Price ($100,000’S)
Jul
Aug
Sep
Oct
Nov
Dec
Jan
Feb
Mar
Apr
May
Jun
Jul
$650,000
$669
20
*Information obtained from Broker Metrics, The MLS and Foreclosure Radar for all areas in Torrance- County Strip Micro Market Report. Statistics are subject to change due to individual real estate company reporting disciplines.
3.2%
55.6%
-12.5%
350.0%
100.0%
140.3%
125.0%
10.0%
$596,000
$556
6
7
14
13
50.0%
$705,334
$707,500
$498
8
6
9
22
66.7%
$683,250
$650,000
$669
7
9
20
19
45.0%
$679,577
$630,000
$430
8
2
10
8
20.0%
$617,921
Torrance- County Strip
$630
$650

Median Price ..........................................
Average Price per Square Foot ...............
Properties Sold .......................................
Properties Pending Sale .........................
Properties For Sale .................................
Days on Market (Pending Sale) ................
Percent Under Contract .........................
Average Median Price for Last 12 Months
Jul 2020 Jul 20216 Month 3 Month % ChangeData*
Current Market Snapshot
Micro Market Report : July 2021
Median sales price.
Average price per square foot.
Properties for sale.
Median Sales Price ($100,000’S)
Jul
Aug
Sep
Oct
Nov
Dec
Jan
Feb
Mar
Apr
May
Jun
Jul
$900,000
$615
42
*Information obtained from Broker Metrics, The MLS and Foreclosure Radar for all areas in Torrance- North Micro Market Report. Statistics are subject to change due to individual real estate company reporting disciplines.
13.9%
7.7%
100.0%
38.9%
16.7%
-65.0%
19.0%
9.1%
$873,301
$574
16
23
35
10
65.7%
$895,667
$846,000
$599
9
9
21
12
42.9%
$878,800
$900,000
$615
22
25
42
14
59.5%
$839,023
$790,000
$571
11
18
36
41
50.0%
$768,750
Torrance- North
$790
$900

Median Price ..........................................
Average Price per Square Foot ...............
Properties Sold .......................................
Properties Pending Sale .........................
Properties For Sale .................................
Days on Market (Pending Sale) ................
Percent Under Contract .........................
Average Median Price for Last 12 Months
Jul 2020 Jul 20216 Month 3 Month % ChangeData*
Current Market Snapshot
Micro Market Report : July 2021
Median sales price.
Average price per square foot.
Properties for sale.
Median Sales Price ($100,000’S)
Jul
Aug
Sep
Oct
Nov
Dec
Jan
Feb
Mar
Apr
May
Jun
Jul
$1,334,500
$704
51
*Information obtained from Broker Metrics, The MLS and Foreclosure Radar for all areas in Torrance- South Micro Market Report. Statistics are subject to change due to individual real estate company reporting disciplines.
38.5%
12.3%
-35.7%
8.0%
-25.0%
-30.1%
44.0%
18.6%
$1,275,000
$684
29
23
41
11
56.1%
$1,320,217
$1,195,000
$609
16
14
36
15
38.9%
$1,261,608
$1,334,500
$704
18
27
51
13
52.9%
$1,187,165
$963,500
$627
28
25
68
19
36.8%
$1,001,167
Torrance- South
$963
$1.334

Median Price ..........................................
Average Price per Square Foot ...............
Properties Sold .......................................
Properties Pending Sale .........................
Properties For Sale .................................
Days on Market (Pending Sale) ................
Percent Under Contract .........................
Average Median Price for Last 12 Months
Jul 2020 Jul 20216 Month 3 Month % ChangeData*
Current Market Snapshot
Micro Market Report : July 2021
Median sales price.
Average price per square foot.
Properties for sale.
Median Sales Price ($100,000’S)
Jul
Aug
Sep
Oct
Nov
Dec
Jan
Feb
Mar
Apr
May
Jun
Jul
$815,000
$579
41
*Information obtained from Broker Metrics, The MLS and Foreclosure Radar for all areas in Torrance- Southeast Micro Market Report. Statistics are subject to change due to individual real estate company reporting disciplines.
-3.9%
7.8%
-18.8%
-21.1%
-12.8%
1.8%
-9.5%
7.3%
$885,000
$522
27
24
49
34
49.0%
$878,333
$785,000
$578
15
14
36
31
38.9%
$892,333
$815,000
$579
13
15
41
19
36.6%
$853,923
$848,000
$537
16
19
47
18
40.4%
$795,760
Torrance- Southeast
$848
$815

Median Price ..........................................
Average Price per Square Foot ...............
Properties Sold .......................................
Properties Pending Sale .........................
Properties For Sale .................................
Days on Market (Pending Sale) ................
Percent Under Contract .........................
Average Median Price for Last 12 Months
Jul 2020 Jul 20216 Month 3 Month % ChangeData*
Current Market Snapshot
Micro Market Report : July 2021
Median sales price.
Average price per square foot.
Properties for sale.
Median Sales Price ($100,000’S)
Jul
Aug
Sep
Oct
Nov
Dec
Jan
Feb
Mar
Apr
May
Jun
Jul
$1,202,500
$692
47
*Information obtained from Broker Metrics, The MLS and Foreclosure Radar for all areas in Torrance- West Micro Market Report. Statistics are subject to change due to individual real estate company reporting disciplines.
22.7%
21.2%
-5.3%
42.1%
30.6%
-56.3%
8.8%
14.2%
$1,185,000
$691
19
17
30
7
56.7%
$1,162,500
$1,030,000
$630
8
16
29
19
55.2%
$1,155,667
$1,202,500
$692
18
27
47
9
57.4%
$1,073,923
$980,000
$571
19
19
36
21
52.8%
$940,375
Torrance- West
$980
$1.202

Median Price ..........................................
Average Price per Square Foot ...............
Properties Sold .......................................
Properties Pending Sale .........................
Properties For Sale .................................
Days on Market (Pending Sale) ................
Percent Under Contract .........................
Average Median Price for Last 12 Months
Jul 2020 Jul 20216 Month 3 Month % ChangeData*
Current Market Snapshot
Micro Market Report : July 2021
Median sales price.
Average price per square foot.
Properties for sale.
Median Sales Price ($100,000’S)
Jul
Aug
Sep
Oct
Nov
Dec
Jan
Feb
Mar
Apr
May
Jun
Jul
$1,337,000
$649
1,733
*Information obtained from Broker Metrics, The MLS and Foreclosure Radar for all areas in San Fernando Valley Macro Market Micro Market Report. Statistics are subject to change due to individual real estate company reporting disciplines.
11.9%
17.6%
-0.5%
-7.6%
-43.4%
-31.2%
63.2%
17.4%
$1,322,500
$630
646
632
1,750
24
36.1%
$1,371,167
$1,210,000
$585
451
460
1,705
38
27.0%
$1,318,500
$1,337,000
$649
600
633
1,733
22
36.5%
$1,245,377
$1,194,500
$552
603
685
3,060
31
22.4%
$1,060,954
San Fernando Valley Macro Market
$1.194
$1.337

Median Price ..........................................
Average Price per Square Foot ...............
Properties Sold .......................................
Properties Pending Sale .........................
Properties For Sale .................................
Days on Market (Pending Sale) ................
Percent Under Contract .........................
Average Median Price for Last 12 Months
Jul 2020 Jul 20216 Month 3 Month % ChangeData*
Current Market Snapshot
Micro Market Report : July 2021
Median sales price.
Average price per square foot.
Properties for sale.
Median Sales Price ($100,000’S)
Jul
Aug
Sep
Oct
Nov
Dec
Jan
Feb
Mar
Apr
May
Jun
Jul
$1,265,000
$506
86
*Information obtained from Broker Metrics, The MLS and Foreclosure Radar for all areas in Agoura Hills Micro Market Report. Statistics are subject to change due to individual real estate company reporting disciplines.
3.3%
16.1%
9.7%
48.1%
-51.4%
-30.5%
204.9%
18.6%
$1,357,500
$508
22
27
91
37
29.7%
$1,271,500
$1,022,500
$475
20
20
82
61
24.4%
$1,322,133
$1,265,000
$506
34
40
86
34
46.5%
$1,194,869
$1,225,000
$436
31
27
177
49
15.3%
$1,007,604
Agoura Hills
$1.225
$1.265

Median Price ..........................................
Average Price per Square Foot ...............
Properties Sold .......................................
Properties Pending Sale .........................
Properties For Sale .................................
Days on Market (Pending Sale) ................
Percent Under Contract .........................
Average Median Price for Last 12 Months
Jul 2020 Jul 20216 Month 3 Month % ChangeData*
Current Market Snapshot
Micro Market Report : July 2021
Median sales price.
Average price per square foot.
Properties for sale.
Median Sales Price ($100,000’S)
Jul
Aug
Sep
Oct
Nov
Dec
Jan
Feb
Mar
Apr
May
Jun
Jul
$1,150,000
$752
159
*Information obtained from Broker Metrics, The MLS and Foreclosure Radar for all areas in Burbank Micro Market Report. Statistics are subject to change due to individual real estate company reporting disciplines.
16.2%
21.5%
31.4%
4.8%
-7.6%
-41.2%
13.4%
15.7%
$1,150,000
$686
64
62
141
16
44.0%
$1,120,167
$949,500
$679
30
29
85
21
34.1%
$1,111,333
$1,150,000
$752
67
65
159
16
40.9%
$1,042,077
$990,000
$619
51
62
172
28
36.0%
$900,729
Burbank
$990
$1.150

Median Price ..........................................
Average Price per Square Foot ...............
Properties Sold .......................................
Properties Pending Sale .........................
Properties For Sale .................................
Days on Market (Pending Sale) ................
Percent Under Contract .........................
Average Median Price for Last 12 Months
Jul 2020 Jul 20216 Month 3 Month % ChangeData*
Current Market Snapshot
Micro Market Report : July 2021
Median sales price.
Average price per square foot.
Properties for sale.
Median Sales Price ($100,000’S)
Jul
Aug
Sep
Oct
Nov
Dec
Jan
Feb
Mar
Apr
May
Jun
Jul
$1,845,375
$606
105
*Information obtained from Broker Metrics, The MLS and Foreclosure Radar for all areas in Calabasas Micro Market Report. Statistics are subject to change due to individual real estate company reporting disciplines.
12.1%
22.9%
-12.5%
-17.9%
-46.7%
-22.8%
53.9%
18.2%
$2,130,000
$572
41
34
99
22
34.3%
$1,960,958
$1,810,000
$568
21
16
88
47
18.2%
$1,996,729
$1,845,375
$606
28
32
105
26
30.5%
$1,825,135
$1,645,884
$493
32
39
197
34
19.8%
$1,543,615
Calabasas
$1.645
$1.845

Median Price ..........................................
Average Price per Square Foot ...............
Properties Sold .......................................
Properties Pending Sale .........................
Properties For Sale .................................
Days on Market (Pending Sale) ................
Percent Under Contract .........................
Average Median Price for Last 12 Months
Jul 2020 Jul 20216 Month 3 Month % ChangeData*
Current Market Snapshot
Micro Market Report : July 2021
Median sales price.
Average price per square foot.
Properties for sale.
Median Sales Price ($100,000’S)
Jul
Aug
Sep
Oct
Nov
Dec
Jan
Feb
Mar
Apr
May
Jun
Jul
$1,781,300
$727
163
*Information obtained from Broker Metrics, The MLS and Foreclosure Radar for all areas in Encino Micro Market Report. Statistics are subject to change due to individual real estate company reporting disciplines.
5.6%
17.1%
-3.7%
-11.3%
-41.6%
-23.9%
51.8%
21.6%
$2,000,000
$727
57
57
165
25
34.5%
$1,747,100
$2,010,000
$644
36
36
136
38
26.5%
$1,836,550
$1,781,300
$727
52
55
163
24
33.7%
$1,779,321
$1,687,000
$621
54
62
279
32
22.2%
$1,462,708
Encino
$1.687
$1.781

Median Price ..........................................
Average Price per Square Foot ...............
Properties Sold .......................................
Properties Pending Sale .........................
Properties For Sale .................................
Days on Market (Pending Sale) ................
Percent Under Contract .........................
Average Median Price for Last 12 Months
Jul 2020 Jul 20216 Month 3 Month % ChangeData*
Current Market Snapshot
Micro Market Report : July 2021
Median sales price.
Average price per square foot.
Properties for sale.
Median Sales Price ($100,000’S)
Jul
Aug
Sep
Oct
Nov
Dec
Jan
Feb
Mar
Apr
May
Jun
Jul
$1,400,000
$666
176
*Information obtained from Broker Metrics, The MLS and Foreclosure Radar for all areas in Glendale Micro Market Report. Statistics are subject to change due to individual real estate company reporting disciplines.
12.0%
-3.9%
16.4%
-13.5%
2.9%
10.9%
122.8%
17.5%
$1,289,625
$647
66
64
162
24
34.3%
$1,345,833
$1,116,250
$595
70
55
277
43
23.1%
$1,248,688
$1,400,000
$666
71
64
176
22
43.3%
$1,170,332
$1,250,000
$693
61
74
171
20
19.4%
$996,208
Glendale
$1.075
$1.250

Median Price ..........................................
Average Price per Square Foot ...............
Properties Sold .......................................
Properties Pending Sale .........................
Properties For Sale .................................
Days on Market (Pending Sale) ................
Percent Under Contract .........................
Average Median Price for Last 12 Months
Jul 2020 Jul 20216 Month 3 Month % ChangeData*
Current Market Snapshot
Micro Market Report : July 2021
Median sales price.
Average price per square foot.
Properties for sale.
Median Sales Price ($100,000’S)
Jul
Aug
Sep
Oct
Nov
Dec
Jan
Feb
Mar
Apr
May
Jun
Jul
$1,142,889
$709
60
*Information obtained from Broker Metrics, The MLS and Foreclosure Radar for all areas in La Crescenta Micro Market Report. Statistics are subject to change due to individual real estate company reporting disciplines.
3.9%
31.1%
-11.1%
4.0%
-28.6%
-53.8%
45.6%
13.1%
$1,216,000
$612
25
30
69
19
43.5%
$1,250,963
$1,125,750
$604
10
9
47
30
19.1%
$1,218,565
$1,142,889
$709
24
26
60
19
43.3%
$1,115,934
$1,100,000
$541
27
25
84
41
29.8%
$986,979
La Crescenta
$1.100
$1.142

Median Price ..........................................
Average Price per Square Foot ...............
Properties Sold .......................................
Properties Pending Sale .........................
Properties For Sale .................................
Days on Market (Pending Sale) ................
Percent Under Contract .........................
Average Median Price for Last 12 Months
Jul 2020 Jul 20216 Month 3 Month % ChangeData*
Current Market Snapshot
Micro Market Report : July 2021
Median sales price.
Average price per square foot.
Properties for sale.
Median Sales Price ($100,000’S)
Jul
Aug
Sep
Oct
Nov
Dec
Jan
Feb
Mar
Apr
May
Jun
Jul
$860,000
$587
107
*Information obtained from Broker Metrics, The MLS and Foreclosure Radar for all areas in North Hollywood Micro Market Report. Statistics are subject to change due to individual real estate company reporting disciplines.
14.3%
14.9%
21.9%
-13.3%
-32.3%
-63.3%
28.0%
11.9%
$837,500
$586
48
36
108
21
33.3%
$845,000
$770,000
$509
29
34
124
24
27.4%
$846,750
$860,000
$587
39
26
107
13
24.3%
$804,706
$752,500
$511
32
30
158
36
19.0%
$718,996
North Hollywood
$752
$860

Median Price ..........................................
Average Price per Square Foot ...............
Properties Sold .......................................
Properties Pending Sale .........................
Properties For Sale .................................
Days on Market (Pending Sale) ................
Percent Under Contract .........................
Average Median Price for Last 12 Months
Jul 2020 Jul 20216 Month 3 Month % ChangeData*
Current Market Snapshot
Micro Market Report : July 2021
Median sales price.
Average price per square foot.
Properties for sale.
Median Sales Price ($100,000’S)
Jul
Aug
Sep
Oct
Nov
Dec
Jan
Feb
Mar
Apr
May
Jun
Jul
$1,415,000
$509
13
*Information obtained from Broker Metrics, The MLS and Foreclosure Radar for all areas in Shadow Hills Micro Market Report. Statistics are subject to change due to individual real estate company reporting disciplines.
54.6%
20.9%
-37.5%
-57.1%
-50.0%
117.3%
-14.3%
10.0%
$1,307,500
$518
6
6
12
19
50.0%
$1,310,000
$1,084,500
$508
2
3
9
45
33.3%
$1,252,333
$1,415,000
$509
5
3
13
41
23.1%
$1,168,346
$915,000
$421
8
7
26
19
26.9%
$1,062,260
Shadow Hills
$915
$1.415

Median Price ..........................................
Average Price per Square Foot ...............
Properties Sold .......................................
Properties Pending Sale .........................
Properties For Sale .................................
Days on Market (Pending Sale) ................
Percent Under Contract .........................
Average Median Price for Last 12 Months
Jul 2020 Jul 20216 Month 3 Month % ChangeData*
Current Market Snapshot
Micro Market Report : July 2021
Median sales price.
Average price per square foot.
Properties for sale.
Median Sales Price ($100,000’S)
Jul
Aug
Sep
Oct
Nov
Dec
Jan
Feb
Mar
Apr
May
Jun
Jul
$1,457,500
$716
179
*Information obtained from Broker Metrics, The MLS and Foreclosure Radar for all areas in Sherman Oaks Micro Market Report. Statistics are subject to change due to individual real estate company reporting disciplines.
-3.8%
13.1%
-8.3%
-29.1%
-44.4%
-32.2%
27.6%
15.0%
$1,600,000
$738
56
66
180
26
36.7%
$1,655,833
$1,476,500
$672
52
51
169
36
30.2%
$1,559,583
$1,457,500
$716
66
61
179
18
34.1%
$1,503,800
$1,514,895
$633
72
86
322
27
26.7%
$1,307,920
Sherman Oaks
$1.514
$1.457

Median Price ..........................................
Average Price per Square Foot ...............
Properties Sold .......................................
Properties Pending Sale .........................
Properties For Sale .................................
Days on Market (Pending Sale) ................
Percent Under Contract .........................
Average Median Price for Last 12 Months
Jul 2020 Jul 20216 Month 3 Month % ChangeData*
Current Market Snapshot
Micro Market Report : July 2021
Median sales price.
Average price per square foot.
Properties for sale.
Median Sales Price ($100,000’S)
Jul
Aug
Sep
Oct
Nov
Dec
Jan
Feb
Mar
Apr
May
Jun
Jul
$2,350,000
$772
116
*Information obtained from Broker Metrics, The MLS and Foreclosure Radar for all areas in Studio City Micro Market Report. Statistics are subject to change due to individual real estate company reporting disciplines.
20.5%
7.5%
-25.6%
-25.7%
-47.5%
-24.9%
41.5%
12.4%
$2,105,000
$740
40
40
132
32
30.3%
$2,226,667
$1,685,000
$721
37
27
141
45
19.1%
$2,116,000
$2,350,000
$772
32
26
116
19
22.4%
$1,979,692
$1,950,000
$718
43
35
221
25
15.8%
$1,760,758
Studio City
$1.950
$2.350

Median Price ..........................................
Average Price per Square Foot ...............
Properties Sold .......................................
Properties Pending Sale .........................
Properties For Sale .................................
Days on Market (Pending Sale) ................
Percent Under Contract .........................
Average Median Price for Last 12 Months
Jul 2020 Jul 20216 Month 3 Month % ChangeData*
Current Market Snapshot
Micro Market Report : July 2021
Median sales price.
Average price per square foot.
Properties for sale.
Median Sales Price ($100,000’S)
Jul
Aug
Sep
Oct
Nov
Dec
Jan
Feb
Mar
Apr
May
Jun
Jul
$820,000
$520
61
*Information obtained from Broker Metrics, The MLS and Foreclosure Radar for all areas in Sun Valley Micro Market Report. Statistics are subject to change due to individual real estate company reporting disciplines.
27.8%
21.2%
50.0%
25.0%
3.4%
-39.5%
20.9%
20.2%
$730,000
$596
19
26
63
33
41.3%
$799,583
$687,000
$484
15
10
49
32
20.4%
$764,792
$820,000
$520
24
25
61
23
41.0%
$752,977
$641,450
$429
16
20
59
37
33.9%
$626,590
Sun Valley
$641
$820

Median Price ..........................................
Average Price per Square Foot ...............
Properties Sold .......................................
Properties Pending Sale .........................
Properties For Sale .................................
Days on Market (Pending Sale) ................
Percent Under Contract .........................
Average Median Price for Last 12 Months
Jul 2020 Jul 20216 Month 3 Month % ChangeData*
Current Market Snapshot
Micro Market Report : July 2021
Median sales price.
Average price per square foot.
Properties for sale.
Median Sales Price ($100,000’S)
Jul
Aug
Sep
Oct
Nov
Dec
Jan
Feb
Mar
Apr
May
Jun
Jul
$820,000
$545
116
*Information obtained from Broker Metrics, The MLS and Foreclosure Radar for all areas in Sunland/Tujunga Micro Market Report. Statistics are subject to change due to individual real estate company reporting disciplines.
9.1%
27.0%
-3.1%
37.8%
-52.3%
-30.2%
188.7%
14.2%
$831,250
$510
48
40
97
26
41.2%
$866,250
$731,000
$489
34
30
96
27
31.2%
$816,500
$820,000
$545
31
51
116
15
44.0%
$778,038
$751,500
$429
32
37
243
22
15.2%
$681,500
Sunland/Tujunga
$751
$820

Median Price ..........................................
Average Price per Square Foot ...............
Properties Sold .......................................
Properties Pending Sale .........................
Properties For Sale .................................
Days on Market (Pending Sale) ................
Percent Under Contract .........................
Average Median Price for Last 12 Months
Jul 2020 Jul 20216 Month 3 Month % ChangeData*
Current Market Snapshot
Micro Market Report : July 2021
Median sales price.
Average price per square foot.
Properties for sale.
Median Sales Price ($100,000’S)
Jul
Aug
Sep
Oct
Nov
Dec
Jan
Feb
Mar
Apr
May
Jun
Jul
$1,500,000
$608
97
*Information obtained from Broker Metrics, The MLS and Foreclosure Radar for all areas in Tarzana Micro Market Report. Statistics are subject to change due to individual real estate company reporting disciplines.
8.9%
29.9%
10.7%
-16.1%
-29.7%
-1.7%
19.3%
19.6%
$1,570,000
$538
35
37
110
13
33.6%
$1,568,333
$1,400,000
$537
15
27
89
59
30.3%
$1,544,167
$1,500,000
$608
31
26
97
24
26.8%
$1,425,346
$1,377,500
$468
28
31
138
24
22.5%
$1,191,688
Tarzana
$1.377
$1.500

Median Price ..........................................
Average Price per Square Foot ...............
Properties Sold .......................................
Properties Pending Sale .........................
Properties For Sale .................................
Days on Market (Pending Sale) ................
Percent Under Contract .........................
Average Median Price for Last 12 Months
Jul 2020 Jul 20216 Month 3 Month % ChangeData*
Current Market Snapshot
Micro Market Report : July 2021
Median sales price.
Average price per square foot.
Properties for sale.
Median Sales Price ($100,000’S)
Jul
Aug
Sep
Oct
Nov
Dec
Jan
Feb
Mar
Apr
May
Jun
Jul
$2,259,000
$756
20
*Information obtained from Broker Metrics, The MLS and Foreclosure Radar for all areas in Toluca Lake Micro Market Report. Statistics are subject to change due to individual real estate company reporting disciplines.
88.2%
11.0%
80.0%
-50.0%
-37.5%
6.6%
-20.0%
-14.4%
$2,436,000
$731
10
11
27
31
40.7%
$2,208,417
$1,065,000
$750
5
6
25
41
24.0%
$2,073,375
$2,259,000
$756
9
6
20
41
30.0%
$1,674,262
$1,200,000
$681
5
12
32
38
37.5%
$1,956,170
Toluca Lake
$1.200
$2.259

Median Price ..........................................
Average Price per Square Foot ...............
Properties Sold .......................................
Properties Pending Sale .........................
Properties For Sale .................................
Days on Market (Pending Sale) ................
Percent Under Contract .........................
Average Median Price for Last 12 Months
Jul 2020 Jul 20216 Month 3 Month % ChangeData*
Current Market Snapshot
Micro Market Report : July 2021
Median sales price.
Average price per square foot.
Properties for sale.
Median Sales Price ($100,000’S)
Jul
Aug
Sep
Oct
Nov
Dec
Jan
Feb
Mar
Apr
May
Jun
Jul
$1,349,000
$643
51
*Information obtained from Broker Metrics, The MLS and Foreclosure Radar for all areas in Valley Village Micro Market Report. Statistics are subject to change due to individual real estate company reporting disciplines.
22.9%
6.6%
93.8%
18.2%
-32.9%
-29.1%
76.1%
10.9%
$1,610,000
$637
20
16
51
7
31.4%
$1,386,333
$1,363,750
$655
20
18
64
44
28.1%
$1,395,042
$1,349,000
$643
31
26
51
13
51.0%
$1,287,485
$1,097,500
$603
16
22
76
18
28.9%
$1,161,083
Valley Village
$1.097
$1.349

Median Price ..........................................
Average Price per Square Foot ...............
Properties Sold .......................................
Properties Pending Sale .........................
Properties For Sale .................................
Days on Market (Pending Sale) ................
Percent Under Contract .........................
Average Median Price for Last 12 Months
Jul 2020 Jul 20216 Month 3 Month % ChangeData*
Current Market Snapshot
Micro Market Report : July 2021
Median sales price.
Average price per square foot.
Properties for sale.
Median Sales Price ($100,000’S)
Jul
Aug
Sep
Oct
Nov
Dec
Jan
Feb
Mar
Apr
May
Jun
Jul
$1,815,000
$600
127
*Information obtained from Broker Metrics, The MLS and Foreclosure Radar for all areas in Westlake Village Micro Market Report. Statistics are subject to change due to individual real estate company reporting disciplines.
15.2%
22.4%
-27.9%
-4.3%
-58.9%
-39.9%
133.0%
14.9%
$1,600,000
$636
59
49
142
56
34.5%
$1,739,167
$1,650,000
$536
28
28
131
64
21.4%
$1,619,792
$1,815,000
$600
31
45
127
28
35.4%
$1,586,032
$1,575,000
$490
43
47
309
47
15.2%
$1,380,304
Westlake Village
$1.575
$1.815

Median Price ..........................................
Average Price per Square Foot ...............
Properties Sold .......................................
Properties Pending Sale .........................
Properties For Sale .................................
Days on Market (Pending Sale) ................
Percent Under Contract .........................
Average Median Price for Last 12 Months
Jul 2020 Jul 20216 Month 3 Month % ChangeData*
Current Market Snapshot
Micro Market Report : July 2021
Median sales price.
Average price per square foot.
Properties for sale.
Median Sales Price ($100,000’S)
Jul
Aug
Sep
Oct
Nov
Dec
Jan
Feb
Mar
Apr
May
Jun
Jul
$1,250,000
$551
230
*Information obtained from Broker Metrics, The MLS and Foreclosure Radar for all areas in Woodland Hills Micro Market Report. Statistics are subject to change due to individual real estate company reporting disciplines.
34.7%
25.2%
2.6%
-13.0%
-36.6%
-32.3%
37.4%
18.8%
$1,175,000
$520
78
78
199
16
39.2%
$1,200,000
$1,078,500
$470
68
78
217
26
35.9%
$1,175,417
$1,250,000
$551
79
94
230
22
40.9%
$1,092,692
$928,000
$440
77
108
363
32
29.8%
$919,510
Woodland Hills
$928
$1.250

Median Price ..........................................
Average Price per Square Foot ...............
Properties Sold .......................................
Properties Pending Sale .........................
Properties For Sale .................................
Days on Market (Pending Sale) ................
Percent Under Contract .........................
Average Median Price for Last 12 Months
Jul 2020 Jul 20216 Month 3 Month % ChangeData*
Current Market Snapshot
Micro Market Report : July 2021
Median sales price.
Average price per square foot.
Properties for sale.
Median Sales Price ($100,000’S)
Jul
Aug
Sep
Oct
Nov
Dec
Jan
Feb
Mar
Apr
May
Jun
Jul
$1,258,500
$723
1,054
*Information obtained from Broker Metrics, The MLS and Foreclosure Radar for all areas in San Gabriel Valley Macro Market Micro Market Report. Statistics are subject to change due to individual real estate company reporting disciplines.
26.1%
22.3%
28.9%
20.1%
-54.8%
-26.5%
165.9%
15.8%
$1,185,000
$661
287
291
1,035
28
28.1%
$1,269,833
$1,096,180
$629
204
209
1,358
45
15.4%
$1,194,083
$1,258,500
$723
308
341
1,054
26
32.4%
$1,108,129
$998,000
$591
239
284
2,334
35
12.2%
$957,316
San Gabriel Valley Macro Market
$998
$1.258

Median Price ..........................................
Average Price per Square Foot ...............
Properties Sold .......................................
Properties Pending Sale .........................
Properties For Sale .................................
Days on Market (Pending Sale) ................
Percent Under Contract .........................
Average Median Price for Last 12 Months
Jul 2020 Jul 20216 Month 3 Month % ChangeData*
Current Market Snapshot
Micro Market Report : July 2021
Median sales price.
Average price per square foot.
Properties for sale.
Median Sales Price ($100,000’S)
Jul
Aug
Sep
Oct
Nov
Dec
Jan
Feb
Mar
Apr
May
Jun
Jul
$918,944
$614
60
*Information obtained from Broker Metrics, The MLS and Foreclosure Radar for all areas in Alhambra Micro Market Report. Statistics are subject to change due to individual real estate company reporting disciplines.
22.0%
16.1%
150.0%
22.2%
-28.6%
-15.4%
71.1%
14.3%
$873,657
$560
16
15
51
17
29.4%
$870,981
$844,000
$554
14
18
53
26
34.0%
$863,100
$918,944
$614
20
22
60
15
36.7%
$830,200
$753,000
$529
8
18
84
18
21.4%
$726,375
Alhambra
$753
$918

Median Price ..........................................
Average Price per Square Foot ...............
Properties Sold .......................................
Properties Pending Sale .........................
Properties For Sale .................................
Days on Market (Pending Sale) ................
Percent Under Contract .........................
Average Median Price for Last 12 Months
Jul 2020 Jul 20216 Month 3 Month % ChangeData*
Current Market Snapshot
Micro Market Report : July 2021
Median sales price.
Average price per square foot.
Properties for sale.
Median Sales Price ($100,000’S)
Jul
Aug
Sep
Oct
Nov
Dec
Jan
Feb
Mar
Apr
May
Jun
Jul
$1,213,000
$721
89
*Information obtained from Broker Metrics, The MLS and Foreclosure Radar for all areas in Altadena Micro Market Report. Statistics are subject to change due to individual real estate company reporting disciplines.
22.5%
29.7%
2.8%
-14.6%
-65.5%
-6.4%
147.5%
18.6%
$1,259,000
$670
32
41
96
22
42.7%
$1,237,667
$1,142,500
$625
26
19
161
35
11.8%
$1,166,250
$1,213,000
$721
37
35
89
25
39.3%
$1,097,154
$990,000
$556
36
41
258
26
15.9%
$925,433
Altadena
$990
$1.213

Median Price ..........................................
Average Price per Square Foot ...............
Properties Sold .......................................
Properties Pending Sale .........................
Properties For Sale .................................
Days on Market (Pending Sale) ................
Percent Under Contract .........................
Average Median Price for Last 12 Months
Jul 2020 Jul 20216 Month 3 Month % ChangeData*
Current Market Snapshot
Micro Market Report : July 2021
Median sales price.
Average price per square foot.
Properties for sale.
Median Sales Price ($100,000’S)
Jul
Aug
Sep
Oct
Nov
Dec
Jan
Feb
Mar
Apr
May
Jun
Jul
$1,678,000
$599
218
*Information obtained from Broker Metrics, The MLS and Foreclosure Radar for all areas in Arcadia Micro Market Report. Statistics are subject to change due to individual real estate company reporting disciplines.
28.3%
10.7%
103.0%
77.8%
-31.0%
-53.8%
157.7%
10.1%
$1,480,000
$581
43
46
220
36
20.9%
$1,628,833
$1,511,700
$560
27
41
265
49
15.5%
$1,542,750
$1,678,000
$599
67
64
218
27
29.4%
$1,415,742
$1,308,000
$541
33
36
316
58
11.4%
$1,286,152
Arcadia
$1.308
$1.678

Median Price ..........................................
Average Price per Square Foot ...............
Properties Sold .......................................
Properties Pending Sale .........................
Properties For Sale .................................
Days on Market (Pending Sale) ................
Percent Under Contract .........................
Average Median Price for Last 12 Months
Jul 2020 Jul 20216 Month 3 Month % ChangeData*
Current Market Snapshot
Micro Market Report : July 2021
Median sales price.
Average price per square foot.
Properties for sale.
Median Sales Price ($100,000’S)
Jul
Aug
Sep
Oct
Nov
Dec
Jan
Feb
Mar
Apr
May
Jun
Jul
$698,650
$529
42
*Information obtained from Broker Metrics, The MLS and Foreclosure Radar for all areas in Duarte Micro Market Report. Statistics are subject to change due to individual real estate company reporting disciplines.
5.1%
23.3%
77.8%
100.0%
-14.3%
26.1%
133.3%
11.7%
$676,000
$467
15
12
29
10
41.4%
$676,550
$682,000
$490
7
13
32
33
40.6%
$698,108
$698,650
$529
16
18
42
19
42.9%
$666,588
$665,000
$429
9
9
49
15
18.4%
$596,688
Duarte
$665
$698

Median Price ..........................................
Average Price per Square Foot ...............
Properties Sold .......................................
Properties Pending Sale .........................
Properties For Sale .................................
Days on Market (Pending Sale) ................
Percent Under Contract .........................
Average Median Price for Last 12 Months
Jul 2020 Jul 20216 Month 3 Month % ChangeData*
Current Market Snapshot
Micro Market Report : July 2021
Median sales price.
Average price per square foot.
Properties for sale.
Median Sales Price ($100,000’S)
Jul
Aug
Sep
Oct
Nov
Dec
Jan
Feb
Mar
Apr
May
Jun
Jul
$1,170,000
$783
54
*Information obtained from Broker Metrics, The MLS and Foreclosure Radar for all areas in Eagle Rock Micro Market Report. Statistics are subject to change due to individual real estate company reporting disciplines.
12.1%
22.9%
30.0%
22.2%
-40.7%
-28.5%
106.0%
18.7%
$1,075,000
$673
24
19
45
20
42.2%
$1,107,778
$1,305,000
$685
6
16
45
37
35.6%
$1,158,056
$1,170,000
$783
13
22
54
19
40.7%
$1,102,180
$1,043,500
$637
10
18
91
26
19.8%
$928,788
Eagle Rock
$1.043
$1.170

Median Price ..........................................
Average Price per Square Foot ...............
Properties Sold .......................................
Properties Pending Sale .........................
Properties For Sale .................................
Days on Market (Pending Sale) ................
Percent Under Contract .........................
Average Median Price for Last 12 Months
Jul 2020 Jul 20216 Month 3 Month % ChangeData*
Current Market Snapshot
Micro Market Report : July 2021
Median sales price.
Average price per square foot.
Properties for sale.
Median Sales Price ($100,000’S)
Jul
Aug
Sep
Oct
Nov
Dec
Jan
Feb
Mar
Apr
May
Jun
Jul
$2,040,000
$808
120
*Information obtained from Broker Metrics, The MLS and Foreclosure Radar for all areas in La Canada Flintridge Micro Market Report. Statistics are subject to change due to individual real estate company reporting disciplines.
12.2%
16.4%
-3.6%
0.0%
-53.3%
-45.6%
114.2%
9.4%
$2,000,000
$746
31
32
116
20
27.6%
$2,180,833
$1,875,000
$700
18
11
150
52
7.3%
$2,143,750
$2,040,000
$808
27
35
120
24
29.2%
$2,000,990
$1,817,500
$694
28
35
257
44
13.6%
$1,828,792
La Canada Flintridge
$1.817
$2.040

Median Price ..........................................
Average Price per Square Foot ...............
Properties Sold .......................................
Properties Pending Sale .........................
Properties For Sale .................................
Days on Market (Pending Sale) ................
Percent Under Contract .........................
Average Median Price for Last 12 Months
Jul 2020 Jul 20216 Month 3 Month % ChangeData*
Current Market Snapshot
Micro Market Report : July 2021
Median sales price.
Average price per square foot.
Properties for sale.
Median Sales Price ($100,000’S)
Jul
Aug
Sep
Oct
Nov
Dec
Jan
Feb
Mar
Apr
May
Jun
Jul
$895,000
$618
77
*Information obtained from Broker Metrics, The MLS and Foreclosure Radar for all areas in Monrovia Micro Market Report. Statistics are subject to change due to individual real estate company reporting disciplines.
11.9%
12.8%
-29.6%
50.0%
-28.0%
24.7%
108.4%
10.1%
$891,500
$546
26
26
67
18
38.8%
$912,300
$900,000
$545
15
14
55
31
25.5%
$891,817
$895,000
$618
19
36
77
22
46.8%
$857,435
$800,000
$548
27
24
107
18
22.4%
$778,535
Monrovia
$800
$895

Median Price ..........................................
Average Price per Square Foot ...............
Properties Sold .......................................
Properties Pending Sale .........................
Properties For Sale .................................
Days on Market (Pending Sale) ................
Percent Under Contract .........................
Average Median Price for Last 12 Months
Jul 2020 Jul 20216 Month 3 Month % ChangeData*
Current Market Snapshot
Micro Market Report : July 2021
Median sales price.
Average price per square foot.
Properties for sale.
Median Sales Price ($100,000’S)
Jul
Aug
Sep
Oct
Nov
Dec
Jan
Feb
Mar
Apr
May
Jun
Jul
$1,370,000
$787
326
*Information obtained from Broker Metrics, The MLS and Foreclosure Radar for all areas in Pasadena Micro Market Report. Statistics are subject to change due to individual real estate company reporting disciplines.
17.1%
22.8%
11.4%
12.8%
-63.1%
-25.2%
205.8%
11.7%
$1,231,500
$708
86
86
303
33
28.4%
$1,378,833
$1,101,180
$674
60
64
457
35
14.0%
$1,286,750
$1,370,000
$787
88
97
326
28
29.8%
$1,227,629
$1,170,000
$641
79
86
884
37
9.7%
$1,098,917
Pasadena
$1.170
$1.370

Median Price ..........................................
Average Price per Square Foot ...............
Properties Sold .......................................
Properties Pending Sale .........................
Properties For Sale .................................
Days on Market (Pending Sale) ................
Percent Under Contract .........................
Average Median Price for Last 12 Months
Jul 2020 Jul 20216 Month 3 Month % ChangeData*
Current Market Snapshot
Micro Market Report : July 2021
Median sales price.
Average price per square foot.
Properties for sale.
Median Sales Price ($100,000’S)
Jul
Aug
Sep
Oct
Nov
Dec
Jan
Feb
Mar
Apr
May
Jun
Jul
$963,000
$566
64
*Information obtained from Broker Metrics, The MLS and Foreclosure Radar for all areas in San Gabriel Micro Market Report. Statistics are subject to change due to individual real estate company reporting disciplines.
3.0%
7.2%
4.5%
8.0%
-59.2%
29.5%
164.9%
9.5%
$975,000
$574
26
22
65
20
33.8%
$1,013,333
$940,000
$595
21
18
53
40
34.0%
$965,000
$963,000
$566
23
27
64
36
42.2%
$932,400
$935,000
$528
22
25
157
28
15.9%
$851,417
San Gabriel
$935
$963

Median Price ..........................................
Average Price per Square Foot ...............
Properties Sold .......................................
Properties Pending Sale .........................
Properties For Sale .................................
Days on Market (Pending Sale) ................
Percent Under Contract .........................
Average Median Price for Last 12 Months
Jul 2020 Jul 20216 Month 3 Month % ChangeData*
Current Market Snapshot
Micro Market Report : July 2021
Median sales price.
Average price per square foot.
Properties for sale.
Median Sales Price ($100,000’S)
Jul
Aug
Sep
Oct
Nov
Dec
Jan
Feb
Mar
Apr
May
Jun
Jul
$3,001,500
$1,061
78
*Information obtained from Broker Metrics, The MLS and Foreclosure Radar for all areas in San Marino Micro Market Report. Statistics are subject to change due to individual real estate company reporting disciplines.
34.0%
30.2%
166.7%
-15.4%
-67.1%
-69.5%
157.1%
9.3%
$2,395,000
$888
13
15
95
39
15.8%
$2,701,000
$1,740,000
$828
7
6
145
80
4.1%
$2,533,000
$3,001,500
$1,061
16
11
78
16
14.1%
$2,479,077
$2,240,000
$815
6
13
237
51
5.5%
$2,267,705
San Marino
$2.240
$3.001

Median Price ..........................................
Average Price per Square Foot ...............
Properties Sold .......................................
Properties Pending Sale .........................
Properties For Sale .................................
Days on Market (Pending Sale) ................
Percent Under Contract .........................
Average Median Price for Last 12 Months
Jul 2020 Jul 20216 Month 3 Month % ChangeData*
Current Market Snapshot
Micro Market Report : July 2021
Median sales price.
Average price per square foot.
Properties for sale.
Median Sales Price ($100,000’S)
Jul
Aug
Sep
Oct
Nov
Dec
Jan
Feb
Mar
Apr
May
Jun
Jul
$1,465,000
$732
34
*Information obtained from Broker Metrics, The MLS and Foreclosure Radar for all areas in Sierra Madre Micro Market Report. Statistics are subject to change due to individual real estate company reporting disciplines.
-3.0%
30.9%
120.0%
-12.5%
-63.8%
-32.0%
141.9%
19.1%
$1,185,000
$677
15
13
39
28
33.3%
$1,308,333
$1,280,000
$619
10
7
71
199
9.9%
$1,211,667
$1,465,000
$732
11
14
34
33
41.2%
$1,213,415
$1,510,000
$559
5
16
94
48
17.0%
$1,018,917
Sierra Madre
$1.510
$1.465

Median Price ..........................................
Average Price per Square Foot ...............
Properties Sold .......................................
Properties Pending Sale .........................
Properties For Sale .................................
Days on Market (Pending Sale) ................
Percent Under Contract .........................
Average Median Price for Last 12 Months
Jul 2020 Jul 20216 Month 3 Month % ChangeData*
Current Market Snapshot
Micro Market Report : July 2021
Median sales price.
Average price per square foot.
Properties for sale.
Median Sales Price ($100,000’S)
Jul
Aug
Sep
Oct
Nov
Dec
Jan
Feb
Mar
Apr
May
Jun
Jul
$1,785,000
$904
44
*Information obtained from Broker Metrics, The MLS and Foreclosure Radar for all areas in South Pasadena Micro Market Report. Statistics are subject to change due to individual real estate company reporting disciplines.
4.7%
22.7%
-27.3%
71.4%
-60.0%
-62.1%
328.6%
17.0%
$1,470,000
$979
10
11
50
28
22.0%
$1,767,667
$1,285,000
$742
13
5
49
56
10.2%
$1,804,854
$1,785,000
$904
8
12
44
15
27.3%
$1,656,409
$1,705,000
$737
11
7
110
39
6.4%
$1,416,313
South Pasadena
$1.705
$1.785

Micro Market Report : July 2021
Orange County Macro
Aliso Viejo
Balboa Peninsula
Capistrano Beach
Corona Del Mar - Spyglass
Coto De Caza
Crystal Cove
Dana Point
East Bluff - Harbor View
East Costa Mesa
Costa Mesa
Fountain Valley
Huntington Beach
Irvine
Ladera Ranch
Laguna Beach
Laguna Hills
Laguna Niguel
Laguna Woods
Lake Forest
Lantern Village In Dana Point
Lower Newport Bay - Balboa Island
Mission Viejo
Monarch Beach
Nelle Gail
Newport Beach
Newport Coast
Newport Heights
Rancho Santa Margarita
San Clemente
San Juan Capistrano
Seal Beach
Shady Canyon
Turtle Ridge
Turtle Rock
Westminster
West Bay - Santa Ana Heights
West Newport - Lido
Yorba Linda
Orange County

Micro Market Report : July 2021
County Orange
Area 948 SqMiles
Founded 1889

Median Price ..........................................
Average Price per Square Foot ...............
Properties Sold .......................................
Properties Pending Sale .........................
Properties For Sale .................................
Days on Market (Pending Sale) ................
Percent Under Contract .........................
Average Median Price for Last 12 Months
Jul 2020 Jul 20216 Month 3 Month % ChangeData*
Current Market Snapshot
Micro Market Report : July 2021
Median sales price.
Average price per square foot.
Properties for sale.
Median Sales Price ($100,000’S)
Jul
Aug
Sep
Oct
Nov
Dec
Jan
Feb
Mar
Apr
May
Jun
Jul
$1,075,000
$616
4,237
*Information obtained from Broker Metrics, The MLS and Foreclosure Radar for all areas in Orange County Micro Market Report. Statistics are subject to change due to individual real estate company reporting disciplines.
22.9%
21.3%
4.2%
-6.1%
-29.6%
-49.1%
33.3%
16.4%
$1,075,000
$608
2209
2067
4,535
19
45.6%
$1,088,648
$950,000
$543
1320
1513
3,917
32
38.6%
$1,055,157
$1,075,000
$616
2002
2004
4,237
19
47.3%
$981,380
$875,000
$508
1922
2134
6,015
37
35.5%
$843,047
Orange County
$875
$1.075

Median Price ..........................................
Average Price per Square Foot ...............
Properties Sold .......................................
Properties Pending Sale .........................
Properties For Sale .................................
Days on Market (Pending Sale) ................
Percent Under Contract .........................
Average Median Price for Last 12 Months
Jul 2020 Jul 20216 Month 3 Month % ChangeData*
Current Market Snapshot
Micro Market Report : July 2021
Median sales price.
Average price per square foot.
Properties for sale.
Median Sales Price ($100,000’S)
Jul
Aug
Sep
Oct
Nov
Dec
Jan
Feb
Mar
Apr
May
Jun
Jul
$1,208,167
$512
40
*Information obtained from Broker Metrics, The MLS and Foreclosure Radar for all areas in Aliso Viejo Micro Market Report. Statistics are subject to change due to individual real estate company reporting disciplines.
34.2%
18.2%
4.3%
27.8%
-21.6%
-60.1%
62.9%
16.1%
$1,010,000
$473
25
25
48
14
52.1%
$1,106,056
$939,000
$448
13
14
28
33
50.0%
$1,050,935
$1,208,167
$512
24
23
40
9
57.5%
$976,566
$900,000
$433
23
18
51
22
35.3%
$841,375
Aliso Viejo
$900
$1.208

Median Price ..........................................
Average Price per Square Foot ...............
Properties Sold .......................................
Properties Pending Sale .........................
Properties For Sale .................................
Days on Market (Pending Sale) ................
Percent Under Contract .........................
Average Median Price for Last 12 Months
Jul 2020 Jul 20216 Month 3 Month % ChangeData*
Current Market Snapshot
Micro Market Report : July 2021
Median sales price.
Average price per square foot.
Properties for sale.
Median Sales Price ($100,000’S)
Jul
Aug
Sep
Oct
Nov
Dec
Jan
Feb
Mar
Apr
May
Jun
Jul
$3,850,000
$1,493
21
*Information obtained from Broker Metrics, The MLS and Foreclosure Radar for all areas in Balboa Peninsula Micro Market Report. Statistics are subject to change due to individual real estate company reporting disciplines.
37.5%
4.0%
-55.6%
-11.1%
-63.8%
-51.7%
145.5%
-0.5%
$3,800,000
$1,768
15
14
33
80
42.4%
$3,715,000
$3,725,000
$1,300
8
12
35
78
34.3%
$3,657,250
$3,850,000
$1,493
4
8
21
36
38.1%
$3,816,962
$2,800,000
$1,436
9
9
58
73
15.5%
$3,835,227
Balboa Peninsula
$2.800
$3.850

Median Price ..........................................
Average Price per Square Foot ...............
Properties Sold .......................................
Properties Pending Sale .........................
Properties For Sale .................................
Days on Market (Pending Sale) ................
Percent Under Contract .........................
Average Median Price for Last 12 Months
Jul 2020 Jul 20216 Month 3 Month % ChangeData*
Current Market Snapshot
Micro Market Report : July 2021
Median sales price.
Average price per square foot.
Properties for sale.
Median Sales Price ($100,000’S)
Jul
Aug
Sep
Oct
Nov
Dec
Jan
Feb
Mar
Apr
May
Jun
Jul
$1,735,000
$923
23
*Information obtained from Broker Metrics, The MLS and Foreclosure Radar for all areas in Capistrano Beach Micro Market Report. Statistics are subject to change due to individual real estate company reporting disciplines.
7.9%
38.4%
-40.0%
-20.0%
-50.0%
-81.2%
60.0%
10.9%
$2,562,500
$929
12
8
19
55
42.1%
$1,874,167
$1,675,000
$638
7
6
23
81
26.1%
$1,822,083
$1,735,000
$923
6
8
23
18
34.8%
$1,605,231
$1,607,500
$667
10
10
46
97
21.7%
$1,447,156
Capistrano Beach
$1.607
$1.735

Median Price ..........................................
Average Price per Square Foot ...............
Properties Sold .......................................
Properties Pending Sale .........................
Properties For Sale .................................
Days on Market (Pending Sale) ................
Percent Under Contract .........................
Average Median Price for Last 12 Months
Jul 2020 Jul 20216 Month 3 Month % ChangeData*
Current Market Snapshot
Micro Market Report : July 2021
Median sales price.
Average price per square foot.
Properties for sale.
Median Sales Price ($100,000’S)
Jul
Aug
Sep
Oct
Nov
Dec
Jan
Feb
Mar
Apr
May
Jun
Jul
$4,200,000
$1,556
72
*Information obtained from Broker Metrics, The MLS and Foreclosure Radar for all areas in Corona del Mar - Spyglass Micro Market Report. Statistics are subject to change due to individual real estate company reporting disciplines.
20.6%
2.0%
10.5%
-40.0%
-43.8%
-32.7%
6.7%
16.8%
$4,225,000
$1,407
26
23
91
33
25.3%
$4,085,500
$4,043,000
$1,433
12
16
86
117
18.6%
$4,254,338
$4,200,000
$1,556
21
15
72
62
20.8%
$4,080,483
$3,481,250
$1,525
19
25
128
92
19.5%
$3,494,519
Corona del Mar - Spyglass
$3.481
$4.200

Median Price ..........................................
Average Price per Square Foot ...............
Properties Sold .......................................
Properties Pending Sale .........................
Properties For Sale .................................
Days on Market (Pending Sale) ................
Percent Under Contract .........................
Average Median Price for Last 12 Months
Jul 2020 Jul 20216 Month 3 Month % ChangeData*
Current Market Snapshot
Micro Market Report : July 2021
Median sales price.
Average price per square foot.
Properties for sale.
Median Sales Price ($100,000’S)
Jul
Aug
Sep
Oct
Nov
Dec
Jan
Feb
Mar
Apr
May
Jun
Jul
$1,167,500
$671
123
*Information obtained from Broker Metrics, The MLS and Foreclosure Radar for all areas in Cosa Mesa Micro Market Report. Statistics are subject to change due to individual real estate company reporting disciplines.
27.5%
22.2%
-15.2%
-19.4%
-33.5%
-54.4%
21.2%
12.8%
$1,045,000
$637
83
79
132
14
59.8%
$1,160,833
$1,092,500
$612
44
60
138
29
43.5%
$1,107,500
$1,167,500
$671
56
58
123
16
47.2%
$1,043,269
$916,000
$549
66
72
185
35
38.9%
$924,835
Cosa Mesa
$916
$1.167

Median Price ..........................................
Average Price per Square Foot ...............
Properties Sold .......................................
Properties Pending Sale .........................
Properties For Sale .................................
Days on Market (Pending Sale) ................
Percent Under Contract .........................
Average Median Price for Last 12 Months
Jul 2020 Jul 20216 Month 3 Month % ChangeData*
Current Market Snapshot
Micro Market Report : July 2021
Median sales price.
Average price per square foot.
Properties for sale.
Median Sales Price ($100,000’S)
Jul
Aug
Sep
Oct
Nov
Dec
Jan
Feb
Mar
Apr
May
Jun
Jul
$1,655,500
$470
57
*Information obtained from Broker Metrics, The MLS and Foreclosure Radar for all areas in Coto de Caza Micro Market Report. Statistics are subject to change due to individual real estate company reporting disciplines.
27.8%
27.0%
42.9%
-20.0%
-36.7%
-54.1%
26.3%
19.0%
$1,532,500
$440
28
45
98
19
45.9%
$1,623,750
$1,450,000
$459
25
25
66
20
37.9%
$1,539,958
$1,655,500
$470
30
24
57
25
42.1%
$1,491,598
$1,295,000
$370
21
30
90
54
33.3%
$1,253,630
Coto de Caza
$1.295
$1.655

Median Price ..........................................
Average Price per Square Foot ...............
Properties Sold .......................................
Properties Pending Sale .........................
Properties For Sale .................................
Days on Market (Pending Sale) ................
Percent Under Contract .........................
Average Median Price for Last 12 Months
Jul 2020 Jul 20216 Month 3 Month % ChangeData*
Current Market Snapshot
Micro Market Report : July 2021
Median sales price.
Average price per square foot.
Properties for sale.
Median Sales Price ($100,000’S)
Jul
Aug
Sep
Oct
Nov
Dec
Jan
Feb
Mar
Apr
May
Jun
Jul
$6,000,000
$1,492
26
*Information obtained from Broker Metrics, The MLS and Foreclosure Radar for all areas in Crystal Cove Micro Market Report. Statistics are subject to change due to individual real estate company reporting disciplines.
-10.8%
5.6%
600.0%
100.0%
4.0%
-42.2%
92.3%
-17.5%
$6,180,000
$1,354
5
5
23
35
21.7%
$8,700,000
$9,025,000
$1,589
2
3
21
108
14.3%
$7,880,000
$6,000,000
$1,492
7
8
26
52
30.8%
$7,926,038
$6,725,000
$1,413
1
4
25
90
16.0%
$9,605,904
Crystal Cove
$6.725
$6.000

Median Price ..........................................
Average Price per Square Foot ...............
Properties Sold .......................................
Properties Pending Sale .........................
Properties For Sale .................................
Days on Market (Pending Sale) ................
Percent Under Contract .........................
Average Median Price for Last 12 Months
Jul 2020 Jul 20216 Month 3 Month % ChangeData*
Current Market Snapshot
Micro Market Report : July 2021
Median sales price.
Average price per square foot.
Properties for sale.
Median Sales Price ($100,000’S)
Jul
Aug
Sep
Oct
Nov
Dec
Jan
Feb
Mar
Apr
May
Jun
Jul
$1,755,000
$950
84
*Information obtained from Broker Metrics, The MLS and Foreclosure Radar for all areas in Dana Point Micro Market Report. Statistics are subject to change due to individual real estate company reporting disciplines.
9.0%
12.0%
-26.7%
-30.9%
-57.4%
-72.3%
62.0%
24.6%
$2,344,000
$1,044
42
44
111
37
39.6%
$1,825,000
$1,398,750
$841
32
32
123
70
26.0%
$1,764,833
$1,755,000
$950
33
38
84
22
45.2%
$1,550,788
$1,610,000
$848
45
55
197
79
27.9%
$1,244,331
Dana Point
$1.610
$1.755

Median Price ..........................................
Average Price per Square Foot ...............
Properties Sold .......................................
Properties Pending Sale .........................
Properties For Sale .................................
Days on Market (Pending Sale) ................
Percent Under Contract .........................
Average Median Price for Last 12 Months
Jul 2020 Jul 20216 Month 3 Month % ChangeData*
Current Market Snapshot
Micro Market Report : July 2021
Median sales price.
Average price per square foot.
Properties for sale.
Median Sales Price ($100,000’S)
Jul
Aug
Sep
Oct
Nov
Dec
Jan
Feb
Mar
Apr
May
Jun
Jul
$2,537,500
$999
53
*Information obtained from Broker Metrics, The MLS and Foreclosure Radar for all areas in East Bluff - Harbor View Micro Market Report. Statistics are subject to change due to individual real estate company reporting disciplines.
8.6%
26.1%
-18.2%
-36.0%
-55.5%
-60.4%
43.7%
16.8%
$2,799,000
$820
27
19
50
32
38.0%
$2,809,833
$2,287,500
$743
14
24
73
37
32.9%
$2,645,250
$2,537,500
$999
18
16
53
27
30.2%
$2,461,269
$2,337,500
$792
22
25
119
69
21.0%
$2,106,833
East Bluff - Harbor View
$2.337
$2.537

Median Price ..........................................
Average Price per Square Foot ...............
Properties Sold .......................................
Properties Pending Sale .........................
Properties For Sale .................................
Days on Market (Pending Sale) ................
Percent Under Contract .........................
Average Median Price for Last 12 Months
Jul 2020 Jul 20216 Month 3 Month % ChangeData*
Current Market Snapshot
Micro Market Report : July 2021
Median sales price.
Average price per square foot.
Properties for sale.
Median Sales Price ($100,000’S)
Jul
Aug
Sep
Oct
Nov
Dec
Jan
Feb
Mar
Apr
May
Jun
Jul
$1,601,250
$805
45
*Information obtained from Broker Metrics, The MLS and Foreclosure Radar for all areas in East Costa Mesa Micro Market Report. Statistics are subject to change due to individual real estate company reporting disciplines.
20.6%
23.3%
-30.0%
-27.3%
-41.6%
-60.2%
24.4%
10.1%
$1,435,000
$774
25
30
55
21
54.5%
$1,505,417
$1,386,000
$730
21
22
61
41
36.1%
$1,433,458
$1,601,250
$805
14
16
45
19
35.6%
$1,366,192
$1,327,500
$653
20
22
77
47
28.6%
$1,240,563
East Costa Mesa
$1.327
$1.601

Median Price ..........................................
Average Price per Square Foot ...............
Properties Sold .......................................
Properties Pending Sale .........................
Properties For Sale .................................
Days on Market (Pending Sale) ................
Percent Under Contract .........................
Average Median Price for Last 12 Months
Jul 2020 Jul 20216 Month 3 Month % ChangeData*
Current Market Snapshot
Micro Market Report : July 2021
Median sales price.
Average price per square foot.
Properties for sale.
Median Sales Price ($100,000’S)
Jul
Aug
Sep
Oct
Nov
Dec
Jan
Feb
Mar
Apr
May
Jun
Jul
$1,167,500
$671
123
*Information obtained from Broker Metrics, The MLS and Foreclosure Radar for all areas in Costa Mesa Micro Market Report. Statistics are subject to change due to individual real estate company reporting disciplines.
27.5%
22.2%
-15.2%
-19.4%
-33.5%
-54.4%
21.2%
12.8%
$1,045,000
$637
83
79
132
14
59.8%
$1,160,833
$1,092,500
$612
44
60
138
29
43.5%
$1,107,500
$1,167,500
$671
56
58
123
16
47.2%
$1,043,269
$916,000
$549
66
72
185
35
38.9%
$924,835
Costa Mesa
$916
$1.167

Median Price ..........................................
Average Price per Square Foot ...............
Properties Sold .......................................
Properties Pending Sale .........................
Properties For Sale .................................
Days on Market (Pending Sale) ................
Percent Under Contract .........................
Average Median Price for Last 12 Months
Jul 2020 Jul 20216 Month 3 Month % ChangeData*
Current Market Snapshot
Micro Market Report : July 2021
Median sales price.
Average price per square foot.
Properties for sale.
Median Sales Price ($100,000’S)
Jul
Aug
Sep
Oct
Nov
Dec
Jan
Feb
Mar
Apr
May
Jun
Jul
$1,000,011
$572
75
*Information obtained from Broker Metrics, The MLS and Foreclosure Radar for all areas in Fountain Valley Micro Market Report. Statistics are subject to change due to individual real estate company reporting disciplines.
13.1%
30.9%
31.8%
-7.1%
-10.7%
-31.5%
4.0%
10.3%
$1,017,500
$498
32
35
65
11
53.8%
$1,060,337
$913,194
$479
18
24
41
16
58.5%
$1,029,752
$1,000,011
$572
29
39
75
14
52.0%
$967,708
$884,500
$437
22
42
84
21
50.0%
$877,375
Fountain Valley
$884
$1.000

Median Price ..........................................
Average Price per Square Foot ...............
Properties Sold .......................................
Properties Pending Sale .........................
Properties For Sale .................................
Days on Market (Pending Sale) ................
Percent Under Contract .........................
Average Median Price for Last 12 Months
Jul 2020 Jul 20216 Month 3 Month % ChangeData*
Current Market Snapshot
Micro Market Report : July 2021
Median sales price.
Average price per square foot.
Properties for sale.
Median Sales Price ($100,000’S)
Jul
Aug
Sep
Oct
Nov
Dec
Jan
Feb
Mar
Apr
May
Jun
Jul
$1,250,000
$663
275
*Information obtained from Broker Metrics, The MLS and Foreclosure Radar for all areas in Huntington Beach Micro Market Report. Statistics are subject to change due to individual real estate company reporting disciplines.
28.2%
23.7%
25.2%
0.8%
-27.1%
-59.6%
38.2%
10.6%
$1,210,000
$626
147
126
286
23
44.1%
$1,201,833
$1,100,000
$595
101
108
254
31
42.5%
$1,165,250
$1,250,000
$663
144
130
275
16
47.3%
$1,078,923
$975,000
$536
115
129
377
39
34.2%
$975,938
Huntington Beach
$975
$1.250

Median Price ..........................................
Average Price per Square Foot ...............
Properties Sold .......................................
Properties Pending Sale .........................
Properties For Sale .................................
Days on Market (Pending Sale) ................
Percent Under Contract .........................
Average Median Price for Last 12 Months
Jul 2020 Jul 20216 Month 3 Month % ChangeData*
Current Market Snapshot
Micro Market Report : July 2021
Median sales price.
Average price per square foot.
Properties for sale.
Median Sales Price ($100,000’S)
Jul
Aug
Sep
Oct
Nov
Dec
Jan
Feb
Mar
Apr
May
Jun
Jul
$1,500,000
$613
350
*Information obtained from Broker Metrics, The MLS and Foreclosure Radar for all areas in Irvine Micro Market Report. Statistics are subject to change due to individual real estate company reporting disciplines.
24.0%
13.7%
43.3%
26.0%
-32.8%
-46.5%
87.5%
8.3%
$1,375,000
$576
184
156
347
22
45.0%
$1,475,500
$1,310,000
$518
87
115
336
41
34.2%
$1,437,417
$1,500,000
$613
139
160
350
27
45.7%
$1,319,731
$1,210,000
$539
97
127
521
50
24.4%
$1,218,490
Irvine
$1.210
$1.500

Median Price ..........................................
Average Price per Square Foot ...............
Properties Sold .......................................
Properties Pending Sale .........................
Properties For Sale .................................
Days on Market (Pending Sale) ................
Percent Under Contract .........................
Average Median Price for Last 12 Months
Jul 2020 Jul 20216 Month 3 Month % ChangeData*
Current Market Snapshot
Micro Market Report : July 2021
Median sales price.
Average price per square foot.
Properties for sale.
Median Sales Price ($100,000’S)
Jul
Aug
Sep
Oct
Nov
Dec
Jan
Feb
Mar
Apr
May
Jun
Jul
$1,596,225
$524
43
*Information obtained from Broker Metrics, The MLS and Foreclosure Radar for all areas in Ladera Ranch Micro Market Report. Statistics are subject to change due to individual real estate company reporting disciplines.
55.4%
40.5%
-50.0%
-53.3%
-59.8%
-37.8%
16.1%
14.8%
$1,285,000
$457
45
36
67
10
53.7%
$1,477,075
$1,125,000
$432
17
33
65
33
50.8%
$1,303,538
$1,596,225
$524
21
21
43
21
48.8%
$1,190,441
$1,027,000
$373
42
45
107
34
42.1%
$1,036,604
Ladera Ranch
$1.027
$1.596

Median Price ..........................................
Average Price per Square Foot ...............
Properties Sold .......................................
Properties Pending Sale .........................
Properties For Sale .................................
Days on Market (Pending Sale) ................
Percent Under Contract .........................
Average Median Price for Last 12 Months
Jul 2020 Jul 20216 Month 3 Month % ChangeData*
Current Market Snapshot
Micro Market Report : July 2021
Median sales price.
Average price per square foot.
Properties for sale.
Median Sales Price ($100,000’S)
Jul
Aug
Sep
Oct
Nov
Dec
Jan
Feb
Mar
Apr
May
Jun
Jul
$2,762,500
$1,322
158
*Information obtained from Broker Metrics, The MLS and Foreclosure Radar for all areas in Laguna Beach Micro Market Report. Statistics are subject to change due to individual real estate company reporting disciplines.
20.1%
12.9%
10.0%
-8.5%
-39.2%
-38.5%
50.6%
21.3%
$2,510,798
$1,390
50
51
203
37
25.1%
$2,862,500
$2,035,000
$1,051
24
30
187
78
16.0%
$2,727,979
$2,762,500
$1,322
44
43
158
51
27.2%
$2,453,713
$2,300,000
$1,171
40
47
260
84
18.1%
$2,022,604
Laguna Beach
$2.300
$2.762

Median Price ..........................................
Average Price per Square Foot ...............
Properties Sold .......................................
Properties Pending Sale .........................
Properties For Sale .................................
Days on Market (Pending Sale) ................
Percent Under Contract .........................
Average Median Price for Last 12 Months
Jul 2020 Jul 20216 Month 3 Month % ChangeData*
Current Market Snapshot
Micro Market Report : July 2021
Median sales price.
Average price per square foot.
Properties for sale.
Median Sales Price ($100,000’S)
Jul
Aug
Sep
Oct
Nov
Dec
Jan
Feb
Mar
Apr
May
Jun
Jul
$1,313,000
$568
142
*Information obtained from Broker Metrics, The MLS and Foreclosure Radar for all areas in Laguna Niguel Micro Market Report. Statistics are subject to change due to individual real estate company reporting disciplines.
32.3%
23.5%
-18.9%
-4.3%
-32.1%
-37.5%
40.9%
17.4%
$1,339,000
$552
81
50
129
12
38.8%
$1,293,500
$1,120,750
$501
52
45
119
25
37.8%
$1,276,167
$1,313,000
$568
60
67
142
22
47.2%
$1,176,269
$992,500
$460
74
70
209
35
33.5%
$1,001,875
Laguna Niguel
$992
$1.313

Median Price ..........................................
Average Price per Square Foot ...............
Properties Sold .......................................
Properties Pending Sale .........................
Properties For Sale .................................
Days on Market (Pending Sale) ................
Percent Under Contract .........................
Average Median Price for Last 12 Months
Jul 2020 Jul 20216 Month 3 Month % ChangeData*
Current Market Snapshot
Micro Market Report : July 2021
Median sales price.
Average price per square foot.
Properties for sale.
Median Sales Price ($100,000’S)
Jul
Aug
Sep
Oct
Nov
Dec
Jan
Feb
Mar
Apr
May
Jun
Jul
$1,220,000
$495
59
*Information obtained from Broker Metrics, The MLS and Foreclosure Radar for all areas in Laguna Hills Micro Market Report. Statistics are subject to change due to individual real estate company reporting disciplines.
-10.9%
20.1%
43.5%
-24.2%
-31.4%
-50.0%
10.4%
31.5%
$1,192,600
$474
30
20
58
20
34.5%
$1,399,333
$1,205,000
$460
20
18
45
38
40.0%
$1,333,017
$1,220,000
$495
33
25
59
17
42.4%
$1,218,700
$1,370,000
$412
23
33
86
34
38.4%
$926,579
Laguna Hills
$1.370
$1.220

Median Price ..........................................
Average Price per Square Foot ...............
Properties Sold .......................................
Properties Pending Sale .........................
Properties For Sale .................................
Days on Market (Pending Sale) ................
Percent Under Contract .........................
Average Median Price for Last 12 Months
Jul 2020 Jul 20216 Month 3 Month % ChangeData*
Current Market Snapshot
Micro Market Report : July 2021
Median sales price.
Average price per square foot.
Properties for sale.
Median Sales Price ($100,000’S)
Jul
Aug
Sep
Oct
Nov
Dec
Jan
Feb
Mar
Apr
May
Jun
Jul
$1,005,000
$485
163
*Information obtained from Broker Metrics, The MLS and Foreclosure Radar for all areas in Lake Forest Micro Market Report. Statistics are subject to change due to individual real estate company reporting disciplines.
22.2%
20.9%
0.0%
26.4%
-15.1%
-39.8%
48.9%
12.1%
$970,000
$460
81
80
170
16
47.1%
$1,004,167
$897,500
$411
46
51
117
22
43.6%
$970,000
$1,005,000
$485
96
91
163
18
55.8%
$913,000
$822,500
$401
96
72
192
31
37.5%
$814,596
Lake Forest
$822
$1.005

Median Price ..........................................
Average Price per Square Foot ...............
Properties Sold .......................................
Properties Pending Sale .........................
Properties For Sale .................................
Days on Market (Pending Sale) ................
Percent Under Contract .........................
Average Median Price for Last 12 Months
Jul 2020 Jul 20216 Month 3 Month % ChangeData*
Current Market Snapshot
Micro Market Report : July 2021
Median sales price.
Average price per square foot.
Properties for sale.
Median Sales Price ($100,000’S)
Jul
Aug
Sep
Oct
Nov
Dec
Jan
Feb
Mar
Apr
May
Jun
Jul
$1,460,500
$757
16
*Information obtained from Broker Metrics, The MLS and Foreclosure Radar for all areas in Lantern Village in Dana Point Micro Market Report. Statistics are subject to change due to individual real estate company reporting disciplines.
12.8%
15.6%
-50.0%
-36.4%
-46.7%
-45.6%
19.3%
19.7%
$1,425,000
$651
5
4
17
8
23.5%
$1,716,211
$1,005,000
$710
3
4
16
63
25.0%
$1,549,772
$1,460,500
$757
4
7
16
23
43.8%
$1,379,049
$1,295,000
$655
8
11
30
41
36.7%
$1,151,783
Lantern Village in Dana Point
$1.295
$1.460

Median Price ..........................................
Average Price per Square Foot ...............
Properties Sold .......................................
Properties Pending Sale .........................
Properties For Sale .................................
Days on Market (Pending Sale) ................
Percent Under Contract .........................
Average Median Price for Last 12 Months
Jul 2020 Jul 20216 Month 3 Month % ChangeData*
Current Market Snapshot
Micro Market Report : July 2021
Median sales price.
Average price per square foot.
Properties for sale.
Median Sales Price ($100,000’S)
Jul
Aug
Sep
Oct
Nov
Dec
Jan
Feb
Mar
Apr
May
Jun
Jul
$3,850,000
$2,078
23
*Information obtained from Broker Metrics, The MLS and Foreclosure Radar for all areas in Lower Newport Bay - Balboa Island Micro Market Report. Statistics are subject to change due to individual real estate company reporting disciplines.
29.4%
84.5%
40.0%
200.0%
15.0%
-60.8%
160.9%
38.8%
$4,671,171
$1,952
4
8
31
36
25.8%
$3,579,167
$4,325,000
$1,668
5
5
22
12
22.7%
$3,772,695
$3,850,000
$2,078
7
12
23
50
52.2%
$4,514,379
$2,975,000
$1,126
5
4
20
129
20.0%
$3,252,708
Lower Newport Bay - Balboa Island
$2.975
$3.850

Median Price ..........................................
Average Price per Square Foot ...............
Properties Sold .......................................
Properties Pending Sale .........................
Properties For Sale .................................
Days on Market (Pending Sale) ................
Percent Under Contract .........................
Average Median Price for Last 12 Months
Jul 2020 Jul 20216 Month 3 Month % ChangeData*
Current Market Snapshot
Micro Market Report : July 2021
Median sales price.
Average price per square foot.
Properties for sale.
Median Sales Price ($100,000’S)
Jul
Aug
Sep
Oct
Nov
Dec
Jan
Feb
Mar
Apr
May
Jun
Jul
$515,000
$243
400
*Information obtained from Broker Metrics, The MLS and Foreclosure Radar for all areas in Menifee Micro Market Report. Statistics are subject to change due to individual real estate company reporting disciplines.
22.9%
28.6%
-8.0%
-20.4%
-9.3%
-45.3%
-12.3%
17.2%
$495,000
$226
203
196
391
15
50.1%
$500,667
$435,000
$213
161
156
308
18
50.6%
$480,333
$515,000
$243
207
179
400
16
44.8%
$453,692
$419,000
$189
225
225
441
29
51.0%
$387,105
Menifee
$419
$515

Median Price ..........................................
Average Price per Square Foot ...............
Properties Sold .......................................
Properties Pending Sale .........................
Properties For Sale .................................
Days on Market (Pending Sale) ................
Percent Under Contract .........................
Average Median Price for Last 12 Months
Jul 2020 Jul 20216 Month 3 Month % ChangeData*
Current Market Snapshot
Micro Market Report : July 2021
Median sales price.
Average price per square foot.
Properties for sale.
Median Sales Price ($100,000’S)
Jul
Aug
Sep
Oct
Nov
Dec
Jan
Feb
Mar
Apr
May
Jun
Jul
$2,550,000
$1,109
28
*Information obtained from Broker Metrics, The MLS and Foreclosure Radar for all areas in Monarch Beach Micro Market Report. Statistics are subject to change due to individual real estate company reporting disciplines.
8.3%
-4.5%
-16.7%
-41.7%
-70.2%
-70.7%
95.8%
6.0%
$2,850,000
$1,257
19
22
58
45
37.9%
$2,358,333
$2,250,000
$1,056
15
18
68
81
26.5%
$2,343,333
$2,550,000
$1,109
15
14
28
26
50.0%
$2,132,096
$2,353,500
$1,161
18
24
94
90
25.5%
$2,010,981
Monarch Beach
$2.353
$2.550

Median Price ..........................................
Average Price per Square Foot ...............
Properties Sold .......................................
Properties Pending Sale .........................
Properties For Sale .................................
Days on Market (Pending Sale) ................
Percent Under Contract .........................
Average Median Price for Last 12 Months
Jul 2020 Jul 20216 Month 3 Month % ChangeData*
Current Market Snapshot
Micro Market Report : July 2021
Median sales price.
Average price per square foot.
Properties for sale.
Median Sales Price ($100,000’S)
Jul
Aug
Sep
Oct
Nov
Dec
Jan
Feb
Mar
Apr
May
Jun
Jul
$625,000
$270
422
*Information obtained from Broker Metrics, The MLS and Foreclosure Radar for all areas in Murrieta Micro Market Report. Statistics are subject to change due to individual real estate company reporting disciplines.
30.2%
31.7%
-10.5%
-28.5%
-22.3%
-28.2%
-7.9%
19.4%
$601,500
$242
182
238
464
13
51.3%
$611,667
$524,250
$223
162
164
349
51
47.0%
$590,250
$625,000
$270
221
181
422
15
42.9%
$546,038
$480,000
$205
247
253
543
21
46.6%
$457,312
Murrieta
$480
$625

Median Price ..........................................
Average Price per Square Foot ...............
Properties Sold .......................................
Properties Pending Sale .........................
Properties For Sale .................................
Days on Market (Pending Sale) ................
Percent Under Contract .........................
Average Median Price for Last 12 Months
Jul 2020 Jul 20216 Month 3 Month % ChangeData*
Current Market Snapshot
Micro Market Report : July 2021
Median sales price.
Average price per square foot.
Properties for sale.
Median Sales Price ($100,000’S)
Jul
Aug
Sep
Oct
Nov
Dec
Jan
Feb
Mar
Apr
May
Jun
Jul
$2,650,000
$1,185
173
*Information obtained from Broker Metrics, The MLS and Foreclosure Radar for all areas in Newport Beach Micro Market Report. Statistics are subject to change due to individual real estate company reporting disciplines.
17.8%
23.1%
12.3%
-15.0%
-49.0%
-64.2%
66.6%
13.1%
$3,050,000
$1,125
87
73
208
44
35.1%
$2,987,333
$2,560,000
$1,101
43
72
244
47
29.5%
$2,843,250
$2,650,000
$1,185
64
68
173
31
39.3%
$2,663,942
$2,250,000
$963
57
80
339
85
23.6%
$2,356,222
Newport Beach
$2.250
$2.650

Median Price ..........................................
Average Price per Square Foot ...............
Properties Sold .......................................
Properties Pending Sale .........................
Properties For Sale .................................
Days on Market (Pending Sale) ................
Percent Under Contract .........................
Average Median Price for Last 12 Months
Jul 2020 Jul 20216 Month 3 Month % ChangeData*
Current Market Snapshot
Micro Market Report : July 2021
Median sales price.
Average price per square foot.
Properties for sale.
Median Sales Price ($100,000’S)
Jul
Aug
Sep
Oct
Nov
Dec
Jan
Feb
Mar
Apr
May
Jun
Jul
$6,220,000
$1,192
73
*Information obtained from Broker Metrics, The MLS and Foreclosure Radar for all areas in Newport Coast Micro Market Report. Statistics are subject to change due to individual real estate company reporting disciplines.
88.5%
34.8%
0.0%
31.2%
-30.5%
-33.4%
88.8%
11.6%
$5,200,000
$1,105
21
21
77
48
27.3%
$4,878,833
$3,150,000
$1,081
8
11
76
74
14.5%
$4,473,375
$6,220,000
$1,192
15
21
73
46
28.8%
$4,288,712
$3,300,000
$884
15
16
105
69
15.2%
$3,842,042
Newport Coast
$3.300
$6.220

Median Price ..........................................
Average Price per Square Foot ...............
Properties Sold .......................................
Properties Pending Sale .........................
Properties For Sale .................................
Days on Market (Pending Sale) ................
Percent Under Contract .........................
Average Median Price for Last 12 Months
Jul 2020 Jul 20216 Month 3 Month % ChangeData*
Current Market Snapshot
Micro Market Report : July 2021
Median sales price.
Average price per square foot.
Properties for sale.
Median Sales Price ($100,000’S)
Jul
Aug
Sep
Oct
Nov
Dec
Jan
Feb
Mar
Apr
May
Jun
Jul
$2,112,500
$851
28
*Information obtained from Broker Metrics, The MLS and Foreclosure Radar for all areas in Newport Heights Micro Market Report. Statistics are subject to change due to individual real estate company reporting disciplines.
72.4%
46.2%
166.7%
-50.0%
-28.2%
-78.7%
-30.4%
21.0%
$2,965,050
$815
9
7
30
49
23.3%
$2,800,000
$3,600,000
$1,031
4
5
33
27
15.2%
$2,664,175
$2,112,500
$851
8
5
28
24
17.9%
$2,530,388
$1,225,000
$582
3
10
39
112
25.6%
$2,091,125
Newport Heights
$1.225
$2.112

Median Price ..........................................
Average Price per Square Foot ...............
Properties Sold .......................................
Properties Pending Sale .........................
Properties For Sale .................................
Days on Market (Pending Sale) ................
Percent Under Contract .........................
Average Median Price for Last 12 Months
Jul 2020 Jul 20216 Month 3 Month % ChangeData*
Current Market Snapshot
Micro Market Report : July 2021
Median sales price.
Average price per square foot.
Properties for sale.
Median Sales Price ($100,000’S)
Jul
Aug
Sep
Oct
Nov
Dec
Jan
Feb
Mar
Apr
May
Jun
Jul
$1,475,000
$537
60
*Information obtained from Broker Metrics, The MLS and Foreclosure Radar for all areas in North Tustin Micro Market Report. Statistics are subject to change due to individual real estate company reporting disciplines.
15.2%
23.7%
-8.7%
-7.4%
-43.4%
-39.0%
63.6%
16.5%
$1,275,000
$510
35
31
90
19
34.4%
$1,533,000
$1,300,000
$456
21
18
71
38
25.4%
$1,484,000
$1,475,000
$537
21
25
60
18
41.7%
$1,366,231
$1,280,000
$434
23
27
106
29
25.5%
$1,172,846
North Tustin
$1.280
$1.475

Median Price ..........................................
Average Price per Square Foot ...............
Properties Sold .......................................
Properties Pending Sale .........................
Properties For Sale .................................
Days on Market (Pending Sale) ................
Percent Under Contract .........................
Average Median Price for Last 12 Months
Jul 2020 Jul 20216 Month 3 Month % ChangeData*
Current Market Snapshot
Micro Market Report : July 2021
Median sales price.
Average price per square foot.
Properties for sale.
Median Sales Price ($100,000’S)
Jul
Aug
Sep
Oct
Nov
Dec
Jan
Feb
Mar
Apr
May
Jun
Jul
$910,000
$478
172
*Information obtained from Broker Metrics, The MLS and Foreclosure Radar for all areas in Orange Micro Market Report. Statistics are subject to change due to individual real estate company reporting disciplines.
15.4%
12.5%
-4.6%
-23.2%
-27.1%
-29.6%
5.3%
13.9%
$970,000
$497
89
99
201
12
49.3%
$924,000
$794,500
$447
56
68
156
30
43.6%
$900,458
$910,000
$478
103
76
172
18
44.2%
$857,442
$788,500
$425
108
99
236
26
41.9%
$752,896
Orange
$788
$910

Median Price ..........................................
Average Price per Square Foot ...............
Properties Sold .......................................
Properties Pending Sale .........................
Properties For Sale .................................
Days on Market (Pending Sale) ................
Percent Under Contract .........................
Average Median Price for Last 12 Months
Jul 2020 Jul 20216 Month 3 Month % ChangeData*
Current Market Snapshot
Micro Market Report : July 2021
Median sales price.
Average price per square foot.
Properties for sale.
Median Sales Price ($100,000’S)
Jul
Aug
Sep
Oct
Nov
Dec
Jan
Feb
Mar
Apr
May
Jun
Jul
$957,500
$500
72
*Information obtained from Broker Metrics, The MLS and Foreclosure Radar for all areas in Rancho Santa Margarita Micro Market Report. Statistics are subject to change due to individual real estate company reporting disciplines.
16.1%
28.5%
-22.6%
6.5%
-25.0%
-41.5%
42.0%
17.9%
$980,000
$449
59
53
88
13
60.2%
$1,031,000
$905,000
$398
32
37
68
13
54.4%
$993,167
$957,500
$500
48
49
72
12
68.1%
$930,377
$825,000
$389
62
46
96
21
47.9%
$789,346
Rancho Santa Margarita
$825
$957

Median Price ..........................................
Average Price per Square Foot ...............
Properties Sold .......................................
Properties Pending Sale .........................
Properties For Sale .................................
Days on Market (Pending Sale) ................
Percent Under Contract .........................
Average Median Price for Last 12 Months
Jul 2020 Jul 20216 Month 3 Month % ChangeData*
Current Market Snapshot
Micro Market Report : July 2021
Median sales price.
Average price per square foot.
Properties for sale.
Median Sales Price ($100,000’S)
Jul
Aug
Sep
Oct
Nov
Dec
Jan
Feb
Mar
Apr
May
Jun
Jul
$1,411,250
$674
151
*Information obtained from Broker Metrics, The MLS and Foreclosure Radar for all areas in San Clemente Micro Market Report. Statistics are subject to change due to individual real estate company reporting disciplines.
28.6%
47.8%
2.6%
-23.1%
-34.1%
-37.7%
16.7%
17.9%
$1,315,000
$594
93
71
169
14
42.0%
$1,395,083
$1,202,500
$571
56
70
148
32
47.3%
$1,377,125
$1,411,250
$674
80
70
151
24
46.4%
$1,262,692
$1,097,500
$456
78
91
229
38
39.7%
$1,071,208
San Clemente
$1.097
$1.411

Median Price ..........................................
Average Price per Square Foot ...............
Properties Sold .......................................
Properties Pending Sale .........................
Properties For Sale .................................
Days on Market (Pending Sale) ................
Percent Under Contract .........................
Average Median Price for Last 12 Months
Jul 2020 Jul 20216 Month 3 Month % ChangeData*
Current Market Snapshot
Micro Market Report : July 2021
Median sales price.
Average price per square foot.
Properties for sale.
Median Sales Price ($100,000’S)
Jul
Aug
Sep
Oct
Nov
Dec
Jan
Feb
Mar
Apr
May
Jun
Jul
$1,185,000
$553
84
*Information obtained from Broker Metrics, The MLS and Foreclosure Radar for all areas in San Juan Capistrano Micro Market Report. Statistics are subject to change due to individual real estate company reporting disciplines.
23.4%
37.6%
-8.7%
-38.6%
-38.2%
-34.9%
-0.6%
46.3%
$1,625,000
$504
41
34
88
38
38.6%
$1,506,895
$1,610,000
$507
13
26
85
29
30.6%
$1,490,031
$1,185,000
$553
42
27
84
34
32.1%
$1,382,356
$960,000
$402
46
44
136
52
32.4%
$944,683
San Juan Capistrano
$960
$1.185

Median Price ..........................................
Average Price per Square Foot ...............
Properties Sold .......................................
Properties Pending Sale .........................
Properties For Sale .................................
Days on Market (Pending Sale) ................
Percent Under Contract .........................
Average Median Price for Last 12 Months
Jul 2020 Jul 20216 Month 3 Month % ChangeData*
Current Market Snapshot
Micro Market Report : July 2021
Median sales price.
Average price per square foot.
Properties for sale.
Median Sales Price ($100,000’S)
Jul
Aug
Sep
Oct
Nov
Dec
Jan
Feb
Mar
Apr
May
Jun
Jul
$1,325,000
$762
31
*Information obtained from Broker Metrics, The MLS and Foreclosure Radar for all areas in Seal Beach Micro Market Report. Statistics are subject to change due to individual real estate company reporting disciplines.
10.9%
21.1%
41.7%
50.0%
-16.2%
-76.8%
79.0%
21.4%
$1,425,000
$657
22
18
33
23
54.5%
$1,317,667
$1,175,000
$598
9
7
24
74
29.2%
$1,350,500
$1,325,000
$762
17
21
31
13
67.7%
$1,277,135
$1,195,000
$629
12
14
37
58
37.8%
$1,052,300
Seal Beach
$1.195
$1.325

Median Price ..........................................
Average Price per Square Foot ...............
Properties Sold .......................................
Properties Pending Sale .........................
Properties For Sale .................................
Days on Market (Pending Sale) ................
Percent Under Contract .........................
Average Median Price for Last 12 Months
Jul 2020 Jul 20216 Month 3 Month % ChangeData*
Current Market Snapshot
Micro Market Report : July 2021
Median sales price.
Average price per square foot.
Properties for sale.
Median Sales Price ($100,000’S)
Jul
Aug
Sep
Oct
Nov
Dec
Jan
Feb
Mar
Apr
May
Jun
Jul
$7,700,000
$951
23
*Information obtained from Broker Metrics, The MLS and Foreclosure Radar for all areas in Shady Canyon Micro Market Report. Statistics are subject to change due to individual real estate company reporting disciplines.
-28.1%
-0.9%
0.0%
500.0%
9.5%
14966.7%
447.8%
10.7%
$7,430,000
$741
4
1
15
16
6.7%
$6,733,333
$5,800,000
$829
1
4
22
64
18.2%
$6,170,833
$7,700,000
$951
2
6
23
151
26.1%
$6,823,833
$10,711,000
$960
2
1
21
1
4.8%
$6,164,734
Shady Canyon
$10.711
$7.700

Median Price ..........................................
Average Price per Square Foot ...............
Properties Sold .......................................
Properties Pending Sale .........................
Properties For Sale .................................
Days on Market (Pending Sale) ................
Percent Under Contract .........................
Average Median Price for Last 12 Months
Jul 2020 Jul 20216 Month 3 Month % ChangeData*
Current Market Snapshot
Micro Market Report : July 2021
Median sales price.
Average price per square foot.
Properties for sale.
Median Sales Price ($100,000’S)
Jul
Aug
Sep
Oct
Nov
Dec
Jan
Feb
Mar
Apr
May
Jun
Jul
$668,000
$305
430
*Information obtained from Broker Metrics, The MLS and Foreclosure Radar for all areas in Temecula Micro Market Report. Statistics are subject to change due to individual real estate company reporting disciplines.
27.2%
33.2%
-15.5%
-8.7%
-7.3%
-22.9%
-1.4%
19.7%
$643,000
$281
201
202
398
13
50.8%
$675,167
$583,250
$262
122
156
338
16
46.2%
$655,583
$668,000
$305
201
190
430
18
44.2%
$601,165
$525,000
$229
238
208
464
23
44.8%
$502,135
Temecula
$525
$668

Median Price ..........................................
Average Price per Square Foot ...............
Properties Sold .......................................
Properties Pending Sale .........................
Properties For Sale .................................
Days on Market (Pending Sale) ................
Percent Under Contract .........................
Average Median Price for Last 12 Months
Jul 2020 Jul 20216 Month 3 Month % ChangeData*
Current Market Snapshot
Micro Market Report : July 2021
Median sales price.
Average price per square foot.
Properties for sale.
Median Sales Price ($100,000’S)
Jul
Aug
Sep
Oct
Nov
Dec
Jan
Feb
Mar
Apr
May
Jun
Jul
$1,750,000
$725
23
*Information obtained from Broker Metrics, The MLS and Foreclosure Radar for all areas in Turtle Rock Micro Market Report. Statistics are subject to change due to individual real estate company reporting disciplines.
13.1%
-1.5%
12.5%
25.0%
-25.8%
-1.9%
68.5%
16.1%
$2,730,000
$677
9
6
17
34
35.3%
$1,791,000
$1,845,000
$602
4
5
15
57
33.3%
$2,023,250
$1,750,000
$725
9
10
23
27
43.5%
$1,813,115
$1,547,500
$736
8
8
31
27
25.8%
$1,561,339
Turtle Rock
$1.547
$1.750

Median Price ..........................................
Average Price per Square Foot ...............
Properties Sold .......................................
Properties Pending Sale .........................
Properties For Sale .................................
Days on Market (Pending Sale) ................
Percent Under Contract .........................
Average Median Price for Last 12 Months
Jul 2020 Jul 20216 Month 3 Month % ChangeData*
Current Market Snapshot
Micro Market Report : July 2021
Median sales price.
Average price per square foot.
Properties for sale.
Median Sales Price ($100,000’S)
Jul
Aug
Sep
Oct
Nov
Dec
Jan
Feb
Mar
Apr
May
Jun
Jul
$1,065,000
$507
64
*Information obtained from Broker Metrics, The MLS and Foreclosure Radar for all areas in Tustin Micro Market Report. Statistics are subject to change due to individual real estate company reporting disciplines.
13.3%
18.2%
-32.6%
-10.9%
-40.7%
-58.7%
50.4%
8.7%
$957,500
$479
50
33
63
12
52.4%
$1,020,667
$885,000
$452
27
22
59
47
37.3%
$980,917
$1,065,000
$507
29
41
64
10
64.1%
$937,111
$940,000
$429
43
46
108
24
42.6%
$862,371
Tustin
$940
$1.065

Median Price ..........................................
Average Price per Square Foot ...............
Properties Sold .......................................
Properties Pending Sale .........................
Properties For Sale .................................
Days on Market (Pending Sale) ................
Percent Under Contract .........................
Average Median Price for Last 12 Months
Jul 2020 Jul 20216 Month 3 Month % ChangeData*
Current Market Snapshot
Micro Market Report : July 2021
Median sales price.
Average price per square foot.
Properties for sale.
Median Sales Price ($100,000’S)
Jul
Aug
Sep
Oct
Nov
Dec
Jan
Feb
Mar
Apr
May
Jun
Jul
$2,500,000
$883
28
*Information obtained from Broker Metrics, The MLS and Foreclosure Radar for all areas in West Bay - Santa Ana Heights Micro Market Report. Statistics are subject to change due to individual real estate company reporting disciplines.
16.3%
10.7%
88.9%
0.0%
-50.0%
-38.2%
100.0%
18.9%
$2,500,000
$856
17
12
33
16
36.4%
$2,566,667
$1,775,000
$889
8
17
47
59
36.2%
$2,465,833
$2,500,000
$883
17
17
28
25
60.7%
$2,344,000
$2,150,000
$798
9
17
56
41
30.4%
$1,971,542
West Bay - Santa Ana Heights
$2.150
$2.500

Median Price ..........................................
Average Price per Square Foot ...............
Properties Sold .......................................
Properties Pending Sale .........................
Properties For Sale .................................
Days on Market (Pending Sale) ................
Percent Under Contract .........................
Average Median Price for Last 12 Months
Jul 2020 Jul 20216 Month 3 Month % ChangeData*
Current Market Snapshot
Micro Market Report : July 2021
Median sales price.
Average price per square foot.
Properties for sale.
Median Sales Price ($100,000’S)
Jul
Aug
Sep
Oct
Nov
Dec
Jan
Feb
Mar
Apr
May
Jun
Jul
$3,425,000
$2,064
20
*Information obtained from Broker Metrics, The MLS and Foreclosure Radar for all areas in West Newport - Lido Micro Market Report. Statistics are subject to change due to individual real estate company reporting disciplines.
67.1%
49.9%
11.1%
-33.3%
-54.5%
-85.3%
46.7%
27.1%
$3,395,000
$1,551
13
11
29
56
37.9%
$3,563,167
$4,362,500
$1,901
4
9
32
39
28.1%
$3,428,667
$3,425,000
$2,064
10
10
20
21
50.0%
$3,458,808
$2,050,000
$1,377
9
15
44
142
34.1%
$2,721,875
West Newport - Lido
$2.050
$3.425

Median Price ..........................................
Average Price per Square Foot ...............
Properties Sold .......................................
Properties Pending Sale .........................
Properties For Sale .................................
Days on Market (Pending Sale) ................
Percent Under Contract .........................
Average Median Price for Last 12 Months
Jul 2020 Jul 20216 Month 3 Month % ChangeData*
Current Market Snapshot
Micro Market Report : July 2021
Median sales price.
Average price per square foot.
Properties for sale.
Median Sales Price ($100,000’S)
Jul
Aug
Sep
Oct
Nov
Dec
Jan
Feb
Mar
Apr
May
Jun
Jul
$1,257,500
$505
133
*Information obtained from Broker Metrics, The MLS and Foreclosure Radar for all areas in Yorba Linda Micro Market Report. Statistics are subject to change due to individual real estate company reporting disciplines.
26.1%
18.0%
33.3%
-9.5%
-34.2%
-51.1%
37.5%
17.6%
$1,190,000
$483
87
85
160
19
53.1%
$1,227,500
$1,077,500
$415
54
61
146
40
41.8%
$1,195,417
$1,257,500
$505
80
67
133
17
50.4%
$1,103,596
$997,000
$428
60
74
202
34
36.6%
$938,246
Yorba Linda
$997
$1.257


Micro Market Report : July 2021
Carpinteria
Goleta
Hope Ranch
Montecito
Santa Barbara East of State
Santa Barbara West of State
Santa Ynez
Santa Barbara County

Micro Market Report : July 2021
County Santa Barbara
Area 3,789 SqMiles
Founded 1850

Median Price ..........................................
Average Price per Square Foot ...............
Properties Sold .......................................
Properties Pending Sale .........................
Properties For Sale .................................
Days on Market (Pending Sale) ................
Percent Under Contract .........................
Average Median Price for Last 12 Months
Jul 2020 Jul 20216 Month 3 Month % ChangeData*
Current Market Snapshot
Micro Market Report : July 2021
Median sales price.
Average price per square foot.
Properties for sale.
Median Sales Price ($100,000’S)
Jul
Aug
Sep
Oct
Nov
Dec
Jan
Feb
Mar
Apr
May
Jun
Jul
$1,085,625
$823
27
*Information obtained from Broker Metrics, The MLS and Foreclosure Radar for all areas in Carpinteria Micro Market Report. Statistics are subject to change due to individual real estate company reporting disciplines.
20.6%
10.2%
166.7%
128.6%
-15.6%
-89.9%
170.9%
53.0%
$1,327,000
$721
3
4
13
34
30.8%
$1,411,042
$2,235,500
$941
3
5
16
21
31.2%
$1,814,188
$1,085,625
$823
8
16
27
14
59.3%
$1,665,940
$900,000
$747
3
7
32
135
21.9%
$1,088,965
Carpinteria
$900
$1.085

Median Price ..........................................
Average Price per Square Foot ...............
Properties Sold .......................................
Properties Pending Sale .........................
Properties For Sale .................................
Days on Market (Pending Sale) ................
Percent Under Contract .........................
Average Median Price for Last 12 Months
Jul 2020 Jul 20216 Month 3 Month % ChangeData*
Current Market Snapshot
Micro Market Report : July 2021
Median sales price.
Average price per square foot.
Properties for sale.
Median Sales Price ($100,000’S)
Jul
Aug
Sep
Oct
Nov
Dec
Jan
Feb
Mar
Apr
May
Jun
Jul
$1,356,750
$839
38
*Information obtained from Broker Metrics, The MLS and Foreclosure Radar for all areas in Goleta Micro Market Report. Statistics are subject to change due to individual real estate company reporting disciplines.
46.7%
61.7%
-7.7%
20.0%
15.2%
-19.7%
4.2%
11.1%
$1,100,000
$714
11
15
30
28
50.0%
$1,245,917
$985,316
$613
5
7
21
9
33.3%
$1,152,792
$1,356,750
$839
12
18
38
10
47.4%
$1,059,991
$925,000
$519
13
15
33
13
45.5%
$953,761
Goleta
$925
$1.356

Median Price ..........................................
Average Price per Square Foot ...............
Properties Sold .......................................
Properties Pending Sale .........................
Properties For Sale .................................
Days on Market (Pending Sale) ................
Percent Under Contract .........................
Average Median Price for Last 12 Months
Jul 2020 Jul 20216 Month 3 Month % ChangeData*
Current Market Snapshot
Micro Market Report : July 2021
Median sales price.
Average price per square foot.
Properties for sale.
Median Sales Price ($100,000’S)
Jul
Aug
Sep
Oct
Nov
Dec
Jan
Feb
Mar
Apr
May
Jun
Jul
$7,000,000
$1,432
13
*Information obtained from Broker Metrics, The MLS and Foreclosure Radar for all areas in Hope Ranch Micro Market Report. Statistics are subject to change due to individual real estate company reporting disciplines.
169.2%
66.5%
-40.0%
-50.0%
-58.1%
-90.9%
19.2%
8.4%
$5,200,000
$1,003
4
4
14
15
28.6%
$5,927,833
$3,040,000
$1,515
7
5
16
135
31.2%
$5,351,417
$7,000,000
$1,432
3
5
13
12
38.5%
$4,324,058
$2,600,000
$860
5
10
31
136
32.3%
$3,990,266
Hope Ranch
$2.600
$7.000

Median Price ..........................................
Average Price per Square Foot ...............
Properties Sold .......................................
Properties Pending Sale .........................
Properties For Sale .................................
Days on Market (Pending Sale) ................
Percent Under Contract .........................
Average Median Price for Last 12 Months
Jul 2020 Jul 20216 Month 3 Month % ChangeData*
Current Market Snapshot
Micro Market Report : July 2021
Median sales price.
Average price per square foot.
Properties for sale.
Median Sales Price ($100,000’S)
Jul
Aug
Sep
Oct
Nov
Dec
Jan
Feb
Mar
Apr
May
Jun
Jul
$6,748,000
$1,607
98
*Information obtained from Broker Metrics, The MLS and Foreclosure Radar for all areas in Montecito Micro Market Report. Statistics are subject to change due to individual real estate company reporting disciplines.
64.2%
52.5%
-45.7%
-31.4%
-53.3%
-31.4%
46.9%
26.9%
$4,600,000
$1,319
30
30
108
56
27.8%
$5,581,000
$4,994,380
$1,111
18
24
136
114
17.6%
$5,094,667
$6,748,000
$1,607
19
24
98
48
24.5%
$4,425,260
$4,110,000
$1,054
35
35
210
70
16.7%
$3,487,246
Montecito
$4.110
$6.748

Median Price ..........................................
Average Price per Square Foot ...............
Properties Sold .......................................
Properties Pending Sale .........................
Properties For Sale .................................
Days on Market (Pending Sale) ................
Percent Under Contract .........................
Average Median Price for Last 12 Months
Jul 2020 Jul 20216 Month 3 Month % ChangeData*
Current Market Snapshot
Micro Market Report : July 2021
Median sales price.
Average price per square foot.
Properties for sale.
Median Sales Price ($100,000’S)
Jul
Aug
Sep
Oct
Nov
Dec
Jan
Feb
Mar
Apr
May
Jun
Jul
$2,250,000
$1,099
94
*Information obtained from Broker Metrics, The MLS and Foreclosure Radar for all areas in Santa Barbara East of State Micro Market Report. Statistics are subject to change due to individual real estate company reporting disciplines.
38.4%
52.2%
11.5%
2.3%
-30.9%
-55.2%
48.0%
34.7%
$2,000,000
$1,000
39
45
89
18
50.6%
$2,117,333
$1,500,000
$775
20
32
77
44
41.6%
$2,075,787
$2,250,000
$1,099
29
45
94
20
47.9%
$1,848,318
$1,626,178
$722
26
44
136
44
32.4%
$1,372,063
Santa Barbara East of State
$1.626
$2.250

Median Price ..........................................
Average Price per Square Foot ...............
Properties Sold .......................................
Properties Pending Sale .........................
Properties For Sale .................................
Days on Market (Pending Sale) ................
Percent Under Contract .........................
Average Median Price for Last 12 Months
Jul 2020 Jul 20216 Month 3 Month % ChangeData*
Current Market Snapshot
Micro Market Report : July 2021
Median sales price.
Average price per square foot.
Properties for sale.
Median Sales Price ($100,000’S)
Jul
Aug
Sep
Oct
Nov
Dec
Jan
Feb
Mar
Apr
May
Jun
Jul
$1,600,000
$1,081
49
*Information obtained from Broker Metrics, The MLS and Foreclosure Radar for all areas in Santa Barbara West of State Micro Market Report. Statistics are subject to change due to individual real estate company reporting disciplines.
4.9%
15.2%
61.1%
-58.6%
-31.0%
-63.1%
-40.0%
21.8%
$1,398,500
$1,002
26
21
51
61
41.2%
$1,718,750
$1,553,000
$777
17
17
53
18
32.1%
$1,593,125
$1,600,000
$1,081
29
12
49
17
24.5%
$1,484,385
$1,525,000
$938
18
29
71
46
40.8%
$1,218,650
Santa Barbara West of State
$1.525
$1.600

Median Price ..........................................
Average Price per Square Foot ...............
Properties Sold .......................................
Properties Pending Sale .........................
Properties For Sale .................................
Days on Market (Pending Sale) ................
Percent Under Contract .........................
Average Median Price for Last 12 Months
Jul 2020 Jul 20216 Month 3 Month % ChangeData*
Current Market Snapshot
Micro Market Report : July 2021
Median sales price.
Average price per square foot.
Properties for sale.
Median Sales Price ($100,000’S)
Jul
Aug
Sep
Oct
Nov
Dec
Jan
Feb
Mar
Apr
May
Jun
Jul
$1,385,000
$617
49
*Information obtained from Broker Metrics, The MLS and Foreclosure Radar for all areas in Santa Ynez Micro Market Report. Statistics are subject to change due to individual real estate company reporting disciplines.
53.9%
11.4%
-45.7%
-36.7%
-51.5%
-61.4%
30.5%
22.7%
$1,105,000
$608
22
25
60
28
41.7%
$1,235,000
$1,245,000
$577
15
21
67
43
31.3%
$1,265,000
$1,385,000
$617
19
19
49
45
38.8%
$1,151,154
$900,000
$554
35
30
101
117
29.7%
$937,883
Santa Ynez
$900
$1.385


Micro Market Report : July 2021
Carmel
Carmel Valley
Marina
Monterey
Pacific Grove
Pebble Beach
Salinas
Seaside
Monterey County

Micro Market Report : July 2021
County Monterey
Area 3,771 SqMiles
Founded 1850

Median Price ..........................................
Average Price per Square Foot ...............
Properties Sold .......................................
Properties Pending Sale .........................
Properties For Sale .................................
Days on Market (Pending Sale) ................
Percent Under Contract .........................
Average Median Price for Last 12 Months
Jul 2020 Jul 20216 Month 3 Month % ChangeData*
Current Market Snapshot
Micro Market Report : July 2021
Median sales price.
Average price per square foot.
Properties for sale.
Median Sales Price ($100,000’S)
Jul
Aug
Sep
Oct
Nov
Dec
Jan
Feb
Mar
Apr
May
Jun
Jul
$2,587,500
$1,157
81
*Information obtained from Broker Metrics, The MLS and Foreclosure Radar for all areas in Carmel Micro Market Report. Statistics are subject to change due to individual real estate company reporting disciplines.
34.6%
1.3%
-30.0%
-41.7%
-51.5%
-47.4%
20.3%
29.5%
$2,400,000
$1,323
35
35
97
52
36.1%
$2,721,500
$1,900,000
$1,056
23
30
98
59
30.6%
$2,486,583
$2,587,500
$1,157
28
28
81
50
34.6%
$2,285,952
$1,922,500
$1,142
40
48
167
94
28.7%
$1,765,082
Carmel
$1.922
$2.587

Median Price ..........................................
Average Price per Square Foot ...............
Properties Sold .......................................
Properties Pending Sale .........................
Properties For Sale .................................
Days on Market (Pending Sale) ................
Percent Under Contract .........................
Average Median Price for Last 12 Months
Jul 2020 Jul 20216 Month 3 Month % ChangeData*
Current Market Snapshot
Micro Market Report : July 2021
Median sales price.
Average price per square foot.
Properties for sale.
Median Sales Price ($100,000’S)
Jul
Aug
Sep
Oct
Nov
Dec
Jan
Feb
Mar
Apr
May
Jun
Jul
$1,550,775
$560
34
*Information obtained from Broker Metrics, The MLS and Foreclosure Radar for all areas in Carmel Valley Micro Market Report. Statistics are subject to change due to individual real estate company reporting disciplines.
47.7%
4.7%
-57.9%
-40.0%
-47.7%
-57.5%
14.7%
20.2%
$1,265,000
$592
10
19
36
75
52.8%
$1,546,925
$1,185,000
$714
8
9
58
53
15.5%
$1,481,504
$1,550,775
$560
8
12
34
40
35.3%
$1,458,579
$1,050,000
$535
19
20
65
94
30.8%
$1,213,208
Carmel Valley
$1.050
$1.550

Median Price ..........................................
Average Price per Square Foot ...............
Properties Sold .......................................
Properties Pending Sale .........................
Properties For Sale .................................
Days on Market (Pending Sale) ................
Percent Under Contract .........................
Average Median Price for Last 12 Months
Jul 2020 Jul 20216 Month 3 Month % ChangeData*
Current Market Snapshot
Micro Market Report : July 2021
Median sales price.
Average price per square foot.
Properties for sale.
Median Sales Price ($100,000’S)
Jul
Aug
Sep
Oct
Nov
Dec
Jan
Feb
Mar
Apr
May
Jun
Jul
$813,500
$479
29
*Information obtained from Broker Metrics, The MLS and Foreclosure Radar for all areas in Marina Micro Market Report. Statistics are subject to change due to individual real estate company reporting disciplines.
18.8%
28.4%
-51.5%
-29.6%
-49.1%
-64.1%
38.3%
14.0%
$760,000
$436
12
16
27
8
59.3%
$860,167
$724,000
$410
15
19
29
22
65.5%
$799,917
$813,500
$479
16
19
29
17
65.5%
$752,494
$685,000
$373
33
27
57
47
47.4%
$660,158
Marina
$685
$813

Median Price ..........................................
Average Price per Square Foot ...............
Properties Sold .......................................
Properties Pending Sale .........................
Properties For Sale .................................
Days on Market (Pending Sale) ................
Percent Under Contract .........................
Average Median Price for Last 12 Months
Jul 2020 Jul 20216 Month 3 Month % ChangeData*
Current Market Snapshot
Micro Market Report : July 2021
Median sales price.
Average price per square foot.
Properties for sale.
Median Sales Price ($100,000’S)
Jul
Aug
Sep
Oct
Nov
Dec
Jan
Feb
Mar
Apr
May
Jun
Jul
$1,027,500
$607
65
*Information obtained from Broker Metrics, The MLS and Foreclosure Radar for all areas in Monterey Micro Market Report. Statistics are subject to change due to individual real estate company reporting disciplines.
12.9%
15.4%
-10.3%
-32.3%
-12.2%
-64.5%
-22.9%
23.3%
$1,450,000
$571
19
18
59
18
30.5%
$1,224,167
$1,099,012
$539
11
19
62
42
30.6%
$1,172,917
$1,027,500
$607
26
21
65
25
32.3%
$1,094,693
$910,000
$526
29
31
74
71
41.9%
$887,904
Monterey
$910
$1.027

Median Price ..........................................
Average Price per Square Foot ...............
Properties Sold .......................................
Properties Pending Sale .........................
Properties For Sale .................................
Days on Market (Pending Sale) ................
Percent Under Contract .........................
Average Median Price for Last 12 Months
Jul 2020 Jul 20216 Month 3 Month % ChangeData*
Current Market Snapshot
Micro Market Report : July 2021
Median sales price.
Average price per square foot.
Properties for sale.
Median Sales Price ($100,000’S)
Jul
Aug
Sep
Oct
Nov
Dec
Jan
Feb
Mar
Apr
May
Jun
Jul
$1,315,000
$1,019
41
*Information obtained from Broker Metrics, The MLS and Foreclosure Radar for all areas in Pacific Grove Micro Market Report. Statistics are subject to change due to individual real estate company reporting disciplines.
32.5%
31.5%
5.3%
-21.4%
-33.9%
2.0%
18.8%
31.6%
$1,264,500
$897
16
14
34
27
41.2%
$1,367,500
$1,375,000
$907
14
16
40
36
40.0%
$1,347,625
$1,315,000
$1,019
20
22
41
50
53.7%
$1,249,212
$992,500
$775
19
28
62
49
45.2%
$949,297
Pacific Grove
$992
$1.315

Median Price ..........................................
Average Price per Square Foot ...............
Properties Sold .......................................
Properties Pending Sale .........................
Properties For Sale .................................
Days on Market (Pending Sale) ................
Percent Under Contract .........................
Average Median Price for Last 12 Months
Jul 2020 Jul 20216 Month 3 Month % ChangeData*
Current Market Snapshot
Micro Market Report : July 2021
Median sales price.
Average price per square foot.
Properties for sale.
Median Sales Price ($100,000’S)
Jul
Aug
Sep
Oct
Nov
Dec
Jan
Feb
Mar
Apr
May
Jun
Jul
$3,628,500
$1,687
40
*Information obtained from Broker Metrics, The MLS and Foreclosure Radar for all areas in Pebble Beach Micro Market Report. Statistics are subject to change due to individual real estate company reporting disciplines.
51.2%
85.2%
-47.1%
-47.6%
-48.7%
-71.6%
2.1%
44.9%
$5,067,500
$1,330
8
7
37
40
18.9%
$4,017,942
$1,650,000
$1,059
11
13
53
42
24.5%
$4,142,721
$3,628,500
$1,687
9
11
40
32
27.5%
$3,074,794
$2,400,000
$911
17
21
78
112
26.9%
$2,121,875
Pebble Beach
$2.400
$3.628

Median Price ..........................................
Average Price per Square Foot ...............
Properties Sold .......................................
Properties Pending Sale .........................
Properties For Sale .................................
Days on Market (Pending Sale) ................
Percent Under Contract .........................
Average Median Price for Last 12 Months
Jul 2020 Jul 20216 Month 3 Month % ChangeData*
Current Market Snapshot
Micro Market Report : July 2021
Median sales price.
Average price per square foot.
Properties for sale.
Median Sales Price ($100,000’S)
Jul
Aug
Sep
Oct
Nov
Dec
Jan
Feb
Mar
Apr
May
Jun
Jul
$729,000
$433
138
*Information obtained from Broker Metrics, The MLS and Foreclosure Radar for all areas in Salinas Micro Market Report. Statistics are subject to change due to individual real estate company reporting disciplines.
21.5%
18.3%
-20.5%
8.6%
-11.0%
-42.9%
21.9%
16.7%
$729,000
$436
57
53
111
21
47.7%
$700,000
$664,000
$416
39
36
103
49
35.0%
$696,500
$729,000
$433
62
76
138
19
55.1%
$667,827
$600,000
$366
78
70
155
34
45.2%
$572,123
Salinas
$600
$729

Median Price ..........................................
Average Price per Square Foot ...............
Properties Sold .......................................
Properties Pending Sale .........................
Properties For Sale .................................
Days on Market (Pending Sale) ................
Percent Under Contract .........................
Average Median Price for Last 12 Months
Jul 2020 Jul 20216 Month 3 Month % ChangeData*
Current Market Snapshot
Micro Market Report : July 2021
Median sales price.
Average price per square foot.
Properties for sale.
Median Sales Price ($100,000’S)
Jul
Aug
Sep
Oct
Nov
Dec
Jan
Feb
Mar
Apr
May
Jun
Jul
$720,000
$540
41
*Information obtained from Broker Metrics, The MLS and Foreclosure Radar for all areas in Seaside Micro Market Report. Statistics are subject to change due to individual real estate company reporting disciplines.
8.7%
17.9%
15.4%
53.3%
7.9%
-13.8%
42.1%
13.5%
$685,000
$508
15
12
26
15
46.2%
$698,333
$609,500
$535
8
11
21
29
52.4%
$692,083
$720,000
$540
15
23
41
18
56.1%
$651,104
$662,500
$458
13
15
38
21
39.5%
$573,903
Seaside
$662
$720

Micro Market Report : July 2021
Bermuda Dunes
Cathedral City
Coachella
Desert Hot Springs
Indian Wells
Indio
La Quinta
Palm Desert
Palm Springs
Rancho Mirage
Thousand Palms
Riverside County

Micro Market Report : July 2021
County Riverside
Area 7,303 SqMiles
Founded 1893

Median Price ..........................................
Average Price per Square Foot ...............
Properties Sold .......................................
Properties Pending Sale .........................
Properties For Sale .................................
Days on Market (Pending Sale) ................
Percent Under Contract .........................
Average Median Price for Last 12 Months
Jul 2020 Jul 20216 Month 3 Month % ChangeData*
Current Market Snapshot
Micro Market Report : July 2021
Median sales price.
Average price per square foot.
Properties for sale.
Median Sales Price ($100,000’S)
Jul
Aug
Sep
Oct
Nov
Dec
Jan
Feb
Mar
Apr
May
Jun
Jul
$570,000
$280
36
*Information obtained from Broker Metrics, The MLS and Foreclosure Radar for all areas in Bermuda Dunes Micro Market Report. Statistics are subject to change due to individual real estate company reporting disciplines.
25.3%
40.7%
-18.8%
-35.3%
-36.8%
-66.6%
2.5%
8.7%
$615,000
$268
15
15
47
58
31.9%
$588,667
$449,750
$227
14
11
50
45
22.0%
$608,667
$570,000
$280
13
11
36
30
30.6%
$537,154
$454,750
$199
16
17
57
90
29.8%
$490,292
Bermuda Dunes
$454
$570

Median Price ..........................................
Average Price per Square Foot ...............
Properties Sold .......................................
Properties Pending Sale .........................
Properties For Sale .................................
Days on Market (Pending Sale) ................
Percent Under Contract .........................
Average Median Price for Last 12 Months
Jul 2020 Jul 20216 Month 3 Month % ChangeData*
Current Market Snapshot
Micro Market Report : July 2021
Median sales price.
Average price per square foot.
Properties for sale.
Median Sales Price ($100,000’S)
Jul
Aug
Sep
Oct
Nov
Dec
Jan
Feb
Mar
Apr
May
Jun
Jul
$470,450
$288
205
*Information obtained from Broker Metrics, The MLS and Foreclosure Radar for all areas in Cathedral City Micro Market Report. Statistics are subject to change due to individual real estate company reporting disciplines.
23.0%
34.6%
6.2%
20.6%
-21.8%
-60.9%
54.2%
16.1%
$421,000
$257
71
57
212
37
26.9%
$470,983
$417,500
$233
52
65
229
61
28.4%
$453,575
$470,450
$288
68
76
205
27
37.1%
$430,804
$382,500
$214
64
63
262
68
24.0%
$361,292
Cathedral City
$382
$470

Median Price ..........................................
Average Price per Square Foot ...............
Properties Sold .......................................
Properties Pending Sale .........................
Properties For Sale .................................
Days on Market (Pending Sale) ................
Percent Under Contract .........................
Average Median Price for Last 12 Months
Jul 2020 Jul 20216 Month 3 Month % ChangeData*
Current Market Snapshot
Micro Market Report : July 2021
Median sales price.
Average price per square foot.
Properties for sale.
Median Sales Price ($100,000’S)
Jul
Aug
Sep
Oct
Nov
Dec
Jan
Feb
Mar
Apr
May
Jun
Jul
$365,000
$214
58
*Information obtained from Broker Metrics, The MLS and Foreclosure Radar for all areas in Coachella Micro Market Report. Statistics are subject to change due to individual real estate company reporting disciplines.
28.7%
18.9%
-26.3%
31.2%
-24.7%
-55.2%
74.2%
8.1%
$317,500
$200
16
17
57
26
29.8%
$338,167
$321,000
$204
16
18
61
52
29.5%
$321,167
$365,000
$214
14
21
58
16
36.2%
$306,584
$283,595
$180
19
16
77
35
20.8%
$281,681
Coachella
$283
$365

Median Price ..........................................
Average Price per Square Foot ...............
Properties Sold .......................................
Properties Pending Sale .........................
Properties For Sale .................................
Days on Market (Pending Sale) ................
Percent Under Contract .........................
Average Median Price for Last 12 Months
Jul 2020 Jul 20216 Month 3 Month % ChangeData*
Current Market Snapshot
Micro Market Report : July 2021
Median sales price.
Average price per square foot.
Properties for sale.
Median Sales Price ($100,000’S)
Jul
Aug
Sep
Oct
Nov
Dec
Jan
Feb
Mar
Apr
May
Jun
Jul
$337,500
$210
283
*Information obtained from Broker Metrics, The MLS and Foreclosure Radar for all areas in Desert Hot Springs Micro Market Report. Statistics are subject to change due to individual real estate company reporting disciplines.
35.0%
32.9%
20.0%
87.3%
1.1%
-64.9%
85.3%
17.9%
$337,500
$184
50
62
259
40
23.9%
$332,667
$265,000
$179
45
53
272
60
19.5%
$323,542
$337,500
$210
66
103
283
29
36.4%
$293,942
$250,000
$158
55
55
280
83
19.6%
$241,404
Desert Hot Springs
$250
$337

Median Price ..........................................
Average Price per Square Foot ...............
Properties Sold .......................................
Properties Pending Sale .........................
Properties For Sale .................................
Days on Market (Pending Sale) ................
Percent Under Contract .........................
Average Median Price for Last 12 Months
Jul 2020 Jul 20216 Month 3 Month % ChangeData*
Current Market Snapshot
Micro Market Report : July 2021
Median sales price.
Average price per square foot.
Properties for sale.
Median Sales Price ($100,000’S)
Jul
Aug
Sep
Oct
Nov
Dec
Jan
Feb
Mar
Apr
May
Jun
Jul
$1,625,000
$450
89
*Information obtained from Broker Metrics, The MLS and Foreclosure Radar for all areas in Indian Wells Micro Market Report. Statistics are subject to change due to individual real estate company reporting disciplines.
97.2%
47.5%
-51.6%
-32.4%
-64.0%
-14.8%
87.7%
22.9%
$1,325,000
$446
47
33
130
52
25.4%
$1,400,667
$1,225,000
$390
30
34
188
84
18.1%
$1,312,833
$1,625,000
$450
15
23
89
94
25.8%
$1,164,346
$824,000
$305
31
34
247
110
13.8%
$897,719
Indian Wells
$824
$1.625

Median Price ..........................................
Average Price per Square Foot ...............
Properties Sold .......................................
Properties Pending Sale .........................
Properties For Sale .................................
Days on Market (Pending Sale) ................
Percent Under Contract .........................
Average Median Price for Last 12 Months
Jul 2020 Jul 20216 Month 3 Month % ChangeData*
Current Market Snapshot
Micro Market Report : July 2021
Median sales price.
Average price per square foot.
Properties for sale.
Median Sales Price ($100,000’S)
Jul
Aug
Sep
Oct
Nov
Dec
Jan
Feb
Mar
Apr
May
Jun
Jul
$466,000
$248
300
*Information obtained from Broker Metrics, The MLS and Foreclosure Radar for all areas in Indio Micro Market Report. Statistics are subject to change due to individual real estate company reporting disciplines.
35.1%
32.6%
-17.6%
-0.7%
-50.5%
-62.7%
100.6%
16.0%
$433,500
$224
150
159
410
39
38.8%
$454,667
$382,500
$204
92
115
473
57
24.3%
$437,500
$466,000
$248
108
145
300
27
48.3%
$404,800
$345,000
$187
131
146
606
71
24.1%
$340,013
Indio
$345
$466

Median Price ..........................................
Average Price per Square Foot ...............
Properties Sold .......................................
Properties Pending Sale .........................
Properties For Sale .................................
Days on Market (Pending Sale) ................
Percent Under Contract .........................
Average Median Price for Last 12 Months
Jul 2020 Jul 20216 Month 3 Month % ChangeData*
Current Market Snapshot
Micro Market Report : July 2021
Median sales price.
Average price per square foot.
Properties for sale.
Median Sales Price ($100,000’S)
Jul
Aug
Sep
Oct
Nov
Dec
Jan
Feb
Mar
Apr
May
Jun
Jul
$607,500
$346
411
*Information obtained from Broker Metrics, The MLS and Foreclosure Radar for all areas in La Quinta Micro Market Report. Statistics are subject to change due to individual real estate company reporting disciplines.
13.6%
18.9%
-10.8%
12.6%
-48.8%
-63.0%
120.0%
21.6%
$659,900
$363
185
175
537
38
32.6%
$705,317
$663,000
$322
144
159
617
64
25.8%
$714,142
$607,500
$346
124
179
411
29
43.6%
$670,835
$535,000
$291
139
159
803
78
19.8%
$526,179
La Quinta
$535
$607

Median Price ..........................................
Average Price per Square Foot ...............
Properties Sold .......................................
Properties Pending Sale .........................
Properties For Sale .................................
Days on Market (Pending Sale) ................
Percent Under Contract .........................
Average Median Price for Last 12 Months
Jul 2020 Jul 20216 Month 3 Month % ChangeData*
Current Market Snapshot
Micro Market Report : July 2021
Median sales price.
Average price per square foot.
Properties for sale.
Median Sales Price ($100,000’S)
Jul
Aug
Sep
Oct
Nov
Dec
Jan
Feb
Mar
Apr
May
Jun
Jul
$592,500
$341
338
*Information obtained from Broker Metrics, The MLS and Foreclosure Radar for all areas in Palm Desert Micro Market Report. Statistics are subject to change due to individual real estate company reporting disciplines.
28.8%
30.2%
-2.6%
0.0%
-48.5%
-65.7%
94.1%
16.1%
$575,000
$339
139
139
420
43
33.1%
$583,333
$500,000
$316
109
135
527
52
25.6%
$561,858
$592,500
$341
114
144
338
30
42.6%
$525,069
$460,000
$262
117
144
656
87
22.0%
$440,398
Palm Desert
$460
$592

Median Price ..........................................
Average Price per Square Foot ...............
Properties Sold .......................................
Properties Pending Sale .........................
Properties For Sale .................................
Days on Market (Pending Sale) ................
Percent Under Contract .........................
Average Median Price for Last 12 Months
Jul 2020 Jul 20216 Month 3 Month % ChangeData*
Current Market Snapshot
Micro Market Report : July 2021
Median sales price.
Average price per square foot.
Properties for sale.
Median Sales Price ($100,000’S)
Jul
Aug
Sep
Oct
Nov
Dec
Jan
Feb
Mar
Apr
May
Jun
Jul
$902,667
$577
436
*Information obtained from Broker Metrics, The MLS and Foreclosure Radar for all areas in Palm Springs Micro Market Report. Statistics are subject to change due to individual real estate company reporting disciplines.
24.7%
49.5%
-29.5%
-21.7%
-33.4%
-62.5%
17.6%
19.9%
$929,000
$492
111
113
451
32
25.1%
$936,389
$875,000
$485
83
77
466
51
16.5%
$927,611
$902,667
$577
98
119
436
25
27.3%
$856,340
$724,000
$386
139
152
655
68
23.2%
$685,546
Palm Springs
$724
$902

Median Price ..........................................
Average Price per Square Foot ...............
Properties Sold .......................................
Properties Pending Sale .........................
Properties For Sale .................................
Days on Market (Pending Sale) ................
Percent Under Contract .........................
Average Median Price for Last 12 Months
Jul 2020 Jul 20216 Month 3 Month % ChangeData*
Current Market Snapshot
Micro Market Report : July 2021
Median sales price.
Average price per square foot.
Properties for sale.
Median Sales Price ($100,000’S)
Jul
Aug
Sep
Oct
Nov
Dec
Jan
Feb
Mar
Apr
May
Jun
Jul
$910,000
$379
229
*Information obtained from Broker Metrics, The MLS and Foreclosure Radar for all areas in Rancho Mirage Micro Market Report. Statistics are subject to change due to individual real estate company reporting disciplines.
16.9%
33.5%
-12.5%
-13.3%
-55.0%
-55.3%
92.6%
17.9%
$910,000
$341
79
79
290
59
27.2%
$906,333
$739,900
$305
65
61
334
83
18.3%
$890,458
$910,000
$379
63
65
229
42
28.4%
$803,242
$778,500
$284
72
75
509
93
14.7%
$659,124
Rancho Mirage
$778
$910

Median Price ..........................................
Average Price per Square Foot ...............
Properties Sold .......................................
Properties Pending Sale .........................
Properties For Sale .................................
Days on Market (Pending Sale) ................
Percent Under Contract .........................
Average Median Price for Last 12 Months
Jul 2020 Jul 20216 Month 3 Month % ChangeData*
Current Market Snapshot
Micro Market Report : July 2021
Median sales price.
Average price per square foot.
Properties for sale.
Median Sales Price ($100,000’S)
Jul
Aug
Sep
Oct
Nov
Dec
Jan
Feb
Mar
Apr
May
Jun
Jul
$377,500
$229
24
*Information obtained from Broker Metrics, The MLS and Foreclosure Radar for all areas in Thousand Palms Micro Market Report. Statistics are subject to change due to individual real estate company reporting disciplines.
56.0%
25.1%
75.0%
133.3%
-27.3%
-9.7%
220.8%
4.5%
$365,000
$266
5
7
25
27
28.0%
$305,000
$302,750
$177
6
8
38
67
21.1%
$328,417
$377,500
$229
7
7
24
42
29.2%
$308,958
$241,950
$183
4
3
33
47
9.1%
$295,120
Thousand Palms
$241
$377


Micro Market Report : July 2021
San Diego Macro
Bay Park / Old Town / Midway District
Carlsbad
Carmel Valley
Chula Vista
Clairemont / Bay Ho / Bay Park
Coronado
Del Mar
El Cajon
Encinitas
Escondido
Imperial Beach
La Jolla
La Mesa
Linda Vista / Clairemont Mesa East
Lemon Grove
National City
Oceanside
Poway
Rancho Bernardo
San Marcos
San Diego
Santee
Solana Beach
Spring Valley
Vista
San Diego County

Micro Market Report : July 2021
County San Diego
Area 4,526 SqMiles
Founded 1850

Median Price ..........................................
Average Price per Square Foot ...............
Properties Sold .......................................
Properties Pending Sale .........................
Properties For Sale .................................
Days on Market (Pending Sale) ................
Percent Under Contract .........................
Average Median Price for Last 12 Months
Jul 2020 Jul 20216 Month 3 Month % ChangeData*
Current Market Snapshot
Micro Market Report : July 2021
Median sales price.
Average price per square foot.
Properties for sale.
Median Sales Price ($100,000’S)
Jul
Aug
Sep
Oct
Nov
Dec
Jan
Feb
Mar
Apr
May
Jun
Jul
$885,000
$531
4,572
*Information obtained from Broker Metrics, The MLS and Foreclosure Radar for all areas in San Diego County Micro Market Report. Statistics are subject to change due to individual real estate company reporting disciplines.
21.4%
26.1%
-8.7%
-9.3%
-30.1%
-33.0%
29.8%
15.2%
$848,000
$522
2171
2168
4,462
21
48.6%
$880,000
$745,000
$471
1424
1627
3,791
30
42.9%
$846,708
$885,000
$531
2121
2204
4,572
23
48.2%
$792,773
$729,000
$421
2324
2429
6,542
34
37.1%
$672,140
San Diego County
$729
$885

Median Price ..........................................
Average Price per Square Foot ...............
Properties Sold .......................................
Properties Pending Sale .........................
Properties For Sale .................................
Days on Market (Pending Sale) ................
Percent Under Contract .........................
Average Median Price for Last 12 Months
Jul 2020 Jul 20216 Month 3 Month % ChangeData*
Current Market Snapshot
Micro Market Report : July 2021
Median sales price.
Average price per square foot.
Properties for sale.
Median Sales Price ($100,000’S)
Jul
Aug
Sep
Oct
Nov
Dec
Jan
Feb
Mar
Apr
May
Jun
Jul
$1,363,855
$662
28
*Information obtained from Broker Metrics, The MLS and Foreclosure Radar for all areas in Bay Park/Old Town/Midway District Micro Market Report. Statistics are subject to change due to individual real estate company reporting disciplines.
43.2%
29.8%
0.0%
40.0%
-15.2%
-5.8%
65.0%
16.3%
$1,211,650
$693
14
13
27
18
48.1%
$1,277,118
$1,140,625
$640
4
15
27
34
55.6%
$1,228,584
$1,363,855
$662
10
14
28
21
50.0%
$1,113,548
$952,500
$510
10
10
33
23
30.3%
$932,496
Bay Park/Old Town/Midway District
$952
$1.363

Median Price ..........................................
Average Price per Square Foot ...............
Properties Sold .......................................
Properties Pending Sale .........................
Properties For Sale .................................
Days on Market (Pending Sale) ................
Percent Under Contract .........................
Average Median Price for Last 12 Months
Jul 2020 Jul 20216 Month 3 Month % ChangeData*
Current Market Snapshot
Micro Market Report : July 2021
Median sales price.
Average price per square foot.
Properties for sale.
Median Sales Price ($100,000’S)
Jul
Aug
Sep
Oct
Nov
Dec
Jan
Feb
Mar
Apr
May
Jun
Jul
$1,355,000
$602
178
*Information obtained from Broker Metrics, The MLS and Foreclosure Radar for all areas in Carlsbad Micro Market Report. Statistics are subject to change due to individual real estate company reporting disciplines.
23.2%
37.8%
-15.0%
-40.6%
-47.3%
-6.5%
12.8%
15.5%
$1,475,000
$513
109
93
196
18
47.4%
$1,420,833
$1,305,000
$506
52
58
125
32
46.4%
$1,399,583
$1,355,000
$602
102
79
178
27
44.4%
$1,288,385
$1,099,500
$437
120
133
338
28
39.3%
$1,088,870
Carlsbad
$1.099
$1.355

Median Price ..........................................
Average Price per Square Foot ...............
Properties Sold .......................................
Properties Pending Sale .........................
Properties For Sale .................................
Days on Market (Pending Sale) ................
Percent Under Contract .........................
Average Median Price for Last 12 Months
Jul 2020 Jul 20216 Month 3 Month % ChangeData*
Current Market Snapshot
Micro Market Report : July 2021
Median sales price.
Average price per square foot.
Properties for sale.
Median Sales Price ($100,000’S)
Jul
Aug
Sep
Oct
Nov
Dec
Jan
Feb
Mar
Apr
May
Jun
Jul
$1,899,000
$661
89
*Information obtained from Broker Metrics, The MLS and Foreclosure Radar for all areas in Carmel Valley Micro Market Report. Statistics are subject to change due to individual real estate company reporting disciplines.
34.7%
33.5%
-4.8%
-9.6%
-49.7%
-42.0%
79.8%
15.3%
$1,800,000
$584
52
57
100
16
57.0%
$1,877,667
$1,651,000
$510
42
34
74
22
45.9%
$1,840,750
$1,899,000
$661
59
47
89
16
52.8%
$1,690,605
$1,410,000
$495
62
52
177
28
29.4%
$1,432,629
Carmel Valley
$1.410
$1.899

Median Price ..........................................
Average Price per Square Foot ...............
Properties Sold .......................................
Properties Pending Sale .........................
Properties For Sale .................................
Days on Market (Pending Sale) ................
Percent Under Contract .........................
Average Median Price for Last 12 Months
Jul 2020 Jul 20216 Month 3 Month % ChangeData*
Current Market Snapshot
Micro Market Report : July 2021
Median sales price.
Average price per square foot.
Properties for sale.
Median Sales Price ($100,000’S)
Jul
Aug
Sep
Oct
Nov
Dec
Jan
Feb
Mar
Apr
May
Jun
Jul
$780,000
$399
285
*Information obtained from Broker Metrics, The MLS and Foreclosure Radar for all areas in Chula Vista Micro Market Report. Statistics are subject to change due to individual real estate company reporting disciplines.
21.9%
29.5%
-17.4%
-12.5%
-21.7%
-22.9%
11.8%
15.1%
$750,000
$377
123
144
253
15
56.9%
$771,087
$695,000
$343
95
113
199
21
56.8%
$751,793
$780,000
$399
133
140
285
18
49.1%
$706,755
$640,000
$308
161
160
364
24
44.0%
$600,132
Chula Vista
$640
$780

Median Price ..........................................
Average Price per Square Foot ...............
Properties Sold .......................................
Properties Pending Sale .........................
Properties For Sale .................................
Days on Market (Pending Sale) ................
Percent Under Contract .........................
Average Median Price for Last 12 Months
Jul 2020 Jul 20216 Month 3 Month % ChangeData*
Current Market Snapshot
Micro Market Report : July 2021
Median sales price.
Average price per square foot.
Properties for sale.
Median Sales Price ($100,000’S)
Jul
Aug
Sep
Oct
Nov
Dec
Jan
Feb
Mar
Apr
May
Jun
Jul
$929,000
$629
80
*Information obtained from Broker Metrics, The MLS and Foreclosure Radar for all areas in Clairemont/Bay Ho/Bay Park Micro Market Report. Statistics are subject to change due to individual real estate company reporting disciplines.
16.7%
16.1%
-3.0%
-4.9%
-1.2%
-18.4%
-3.7%
13.1%
$922,500
$636
42
37
70
14
52.9%
$937,333
$821,000
$567
26
24
53
18
45.3%
$911,583
$929,000
$629
32
39
80
16
48.8%
$847,769
$796,000
$542
33
41
81
19
50.6%
$736,875
Clairemont/Bay Ho/Bay Park
$796
$929

Median Price ..........................................
Average Price per Square Foot ...............
Properties Sold .......................................
Properties Pending Sale .........................
Properties For Sale .................................
Days on Market (Pending Sale) ................
Percent Under Contract .........................
Average Median Price for Last 12 Months
Jul 2020 Jul 20216 Month 3 Month % ChangeData*
Current Market Snapshot
Micro Market Report : July 2021
Median sales price.
Average price per square foot.
Properties for sale.
Median Sales Price ($100,000’S)
Jul
Aug
Sep
Oct
Nov
Dec
Jan
Feb
Mar
Apr
May
Jun
Jul
$2,240,000
$1,053
52
*Information obtained from Broker Metrics, The MLS and Foreclosure Radar for all areas in Coronado Micro Market Report. Statistics are subject to change due to individual real estate company reporting disciplines.
-0.4%
18.4%
-48.0%
-58.1%
-51.9%
-38.5%
-12.9%
7.4%
$2,125,000
$953
10
19
56
61
33.9%
$2,423,333
$3,435,000
$1,109
17
12
56
157
21.4%
$2,276,250
$2,240,000
$1,053
13
13
52
59
25.0%
$2,321,308
$2,250,000
$889
25
31
108
96
28.7%
$2,148,542
Coronado
$2.250
$2.240

Median Price ..........................................
Average Price per Square Foot ...............
Properties Sold .......................................
Properties Pending Sale .........................
Properties For Sale .................................
Days on Market (Pending Sale) ................
Percent Under Contract .........................
Average Median Price for Last 12 Months
Jul 2020 Jul 20216 Month 3 Month % ChangeData*
Current Market Snapshot
Micro Market Report : July 2021
Median sales price.
Average price per square foot.
Properties for sale.
Median Sales Price ($100,000’S)
Jul
Aug
Sep
Oct
Nov
Dec
Jan
Feb
Mar
Apr
May
Jun
Jul
$3,200,000
$1,430
61
*Information obtained from Broker Metrics, The MLS and Foreclosure Radar for all areas in Del Mar Micro Market Report. Statistics are subject to change due to individual real estate company reporting disciplines.
33.3%
59.4%
-19.0%
12.5%
-43.5%
10.5%
99.2%
15.1%
$2,630,000
$1,220
25
20
61
35
32.8%
$2,666,667
$2,150,000
$867
7
7
62
40
11.3%
$2,573,750
$3,200,000
$1,430
17
18
61
57
29.5%
$2,340,019
$2,400,000
$897
21
16
108
52
14.8%
$1,987,601
Del Mar
$2.400
$3.200

Median Price ..........................................
Average Price per Square Foot ...............
Properties Sold .......................................
Properties Pending Sale .........................
Properties For Sale .................................
Days on Market (Pending Sale) ................
Percent Under Contract .........................
Average Median Price for Last 12 Months
Jul 2020 Jul 20216 Month 3 Month % ChangeData*
Current Market Snapshot
Micro Market Report : July 2021
Median sales price.
Average price per square foot.
Properties for sale.
Median Sales Price ($100,000’S)
Jul
Aug
Sep
Oct
Nov
Dec
Jan
Feb
Mar
Apr
May
Jun
Jul
$742,000
$409
234
*Information obtained from Broker Metrics, The MLS and Foreclosure Radar for all areas in El Cajon Micro Market Report. Statistics are subject to change due to individual real estate company reporting disciplines.
20.2%
26.6%
-6.2%
-4.8%
-21.2%
-2.9%
20.9%
13.6%
$710,000
$397
125
110
203
28
54.2%
$739,083
$627,500
$369
78
80
203
18
39.4%
$707,458
$742,000
$409
122
120
234
23
51.3%
$668,462
$617,500
$323
130
126
297
23
42.4%
$577,704
El Cajon
$617
$742

Median Price ..........................................
Average Price per Square Foot ...............
Properties Sold .......................................
Properties Pending Sale .........................
Properties For Sale .................................
Days on Market (Pending Sale) ................
Percent Under Contract .........................
Average Median Price for Last 12 Months
Jul 2020 Jul 20216 Month 3 Month % ChangeData*
Current Market Snapshot
Micro Market Report : July 2021
Median sales price.
Average price per square foot.
Properties for sale.
Median Sales Price ($100,000’S)
Jul
Aug
Sep
Oct
Nov
Dec
Jan
Feb
Mar
Apr
May
Jun
Jul
$2,040,000
$728
90
*Information obtained from Broker Metrics, The MLS and Foreclosure Radar for all areas in Encinitas Micro Market Report. Statistics are subject to change due to individual real estate company reporting disciplines.
51.7%
15.2%
-10.4%
-47.7%
-51.6%
-52.6%
8.1%
15.3%
$1,850,000
$754
53
45
92
28
48.9%
$1,863,333
$1,827,500
$662
24
28
82
36
34.1%
$1,805,833
$2,040,000
$728
43
34
90
24
37.8%
$1,695,981
$1,345,000
$632
48
65
186
50
34.9%
$1,436,344
Encinitas
$1.345
$2.040

Median Price ..........................................
Average Price per Square Foot ...............
Properties Sold .......................................
Properties Pending Sale .........................
Properties For Sale .................................
Days on Market (Pending Sale) ................
Percent Under Contract .........................
Average Median Price for Last 12 Months
Jul 2020 Jul 20216 Month 3 Month % ChangeData*
Current Market Snapshot
Micro Market Report : July 2021
Median sales price.
Average price per square foot.
Properties for sale.
Median Sales Price ($100,000’S)
Jul
Aug
Sep
Oct
Nov
Dec
Jan
Feb
Mar
Apr
May
Jun
Jul
$807,500
$402
301
*Information obtained from Broker Metrics, The MLS and Foreclosure Radar for all areas in Escondido Micro Market Report. Statistics are subject to change due to individual real estate company reporting disciplines.
19.6%
27.6%
5.8%
-7.7%
-19.9%
-23.2%
15.3%
14.4%
$742,000
$379
139
153
308
17
49.7%
$809,167
$658,900
$354
93
97
212
31
45.8%
$767,554
$807,500
$402
164
156
301
23
51.8%
$711,479
$675,000
$315
155
169
376
30
44.9%
$609,250
Escondido
$675
$807

Median Price ..........................................
Average Price per Square Foot ...............
Properties Sold .......................................
Properties Pending Sale .........................
Properties For Sale .................................
Days on Market (Pending Sale) ................
Percent Under Contract .........................
Average Median Price for Last 12 Months
Jul 2020 Jul 20216 Month 3 Month % ChangeData*
Current Market Snapshot
Micro Market Report : July 2021
Median sales price.
Average price per square foot.
Properties for sale.
Median Sales Price ($100,000’S)
Jul
Aug
Sep
Oct
Nov
Dec
Jan
Feb
Mar
Apr
May
Jun
Jul
$775,000
$531
38
*Information obtained from Broker Metrics, The MLS and Foreclosure Radar for all areas in Imperial-Beach Micro Market Report. Statistics are subject to change due to individual real estate company reporting disciplines.
8.1%
16.2%
12.5%
27.3%
-2.6%
-54.9%
30.6%
12.1%
$765,000
$525
15
12
30
16
40.0%
$736,667
$730,000
$478
7
11
27
23
40.7%
$747,750
$775,000
$531
9
14
38
15
36.8%
$728,990
$716,875
$457
8
11
39
33
28.2%
$640,833
Imperial-Beach
$716
$775

Median Price ..........................................
Average Price per Square Foot ...............
Properties Sold .......................................
Properties Pending Sale .........................
Properties For Sale .................................
Days on Market (Pending Sale) ................
Percent Under Contract .........................
Average Median Price for Last 12 Months
Jul 2020 Jul 20216 Month 3 Month % ChangeData*
Current Market Snapshot
Micro Market Report : July 2021
Median sales price.
Average price per square foot.
Properties for sale.
Median Sales Price ($100,000’S)
Jul
Aug
Sep
Oct
Nov
Dec
Jan
Feb
Mar
Apr
May
Jun
Jul
$2,896,000
$1,053
142
*Information obtained from Broker Metrics, The MLS and Foreclosure Radar for all areas in La Jolla Micro Market Report. Statistics are subject to change due to individual real estate company reporting disciplines.
-6.6%
-2.5%
-27.0%
-24.1%
-46.8%
-35.6%
42.8%
16.3%
$2,836,755
$1,034
39
35
155
48
22.6%
$3,167,667
$2,381,000
$1,103
24
37
152
75
24.3%
$2,895,793
$2,896,000
$1,053
27
41
142
35
28.9%
$2,652,558
$3,100,000
$1,080
37
54
267
55
20.2%
$2,219,613
La Jolla
$3.100
$2.896

Median Price ..........................................
Average Price per Square Foot ...............
Properties Sold .......................................
Properties Pending Sale .........................
Properties For Sale .................................
Days on Market (Pending Sale) ................
Percent Under Contract .........................
Average Median Price for Last 12 Months
Jul 2020 Jul 20216 Month 3 Month % ChangeData*
Current Market Snapshot
Micro Market Report : July 2021
Median sales price.
Average price per square foot.
Properties for sale.
Median Sales Price ($100,000’S)
Jul
Aug
Sep
Oct
Nov
Dec
Jan
Feb
Mar
Apr
May
Jun
Jul
$780,000
$452
122
*Information obtained from Broker Metrics, The MLS and Foreclosure Radar for all areas in La Mesa Micro Market Report. Statistics are subject to change due to individual real estate company reporting disciplines.
17.3%
19.9%
-5.1%
-6.7%
-18.1%
7.8%
14.0%
13.4%
$800,000
$457
55
60
119
15
50.4%
$810,833
$670,650
$423
44
53
97
19
54.6%
$787,917
$780,000
$452
56
56
122
21
45.9%
$738,665
$665,000
$377
59
60
149
19
40.3%
$639,596
La Mesa
$665
$780

Median Price ..........................................
Average Price per Square Foot ...............
Properties Sold .......................................
Properties Pending Sale .........................
Properties For Sale .................................
Days on Market (Pending Sale) ................
Percent Under Contract .........................
Average Median Price for Last 12 Months
Jul 2020 Jul 20216 Month 3 Month % ChangeData*
Current Market Snapshot
Micro Market Report : July 2021
Median sales price.
Average price per square foot.
Properties for sale.
Median Sales Price ($100,000’S)
Jul
Aug
Sep
Oct
Nov
Dec
Jan
Feb
Mar
Apr
May
Jun
Jul
$885,000
$629
45
*Information obtained from Broker Metrics, The MLS and Foreclosure Radar for all areas in Linda Vista/Clairemont Mesa East Micro Market Report. Statistics are subject to change due to individual real estate company reporting disciplines.
20.0%
24.8%
-15.0%
42.9%
-2.2%
-24.2%
46.0%
6.3%
$827,778
$597
20
24
36
18
66.7%
$880,500
$733,250
$491
12
21
32
24
65.6%
$847,963
$885,000
$629
17
20
45
17
44.4%
$787,194
$737,500
$504
20
14
46
22
30.4%
$737,500
Linda Vista/Clairemont Mesa East
$737
$885

Median Price ..........................................
Average Price per Square Foot ...............
Properties Sold .......................................
Properties Pending Sale .........................
Properties For Sale .................................
Days on Market (Pending Sale) ................
Percent Under Contract .........................
Average Median Price for Last 12 Months
Jul 2020 Jul 20216 Month 3 Month % ChangeData*
Current Market Snapshot
Micro Market Report : July 2021
Median sales price.
Average price per square foot.
Properties for sale.
Median Sales Price ($100,000’S)
Jul
Aug
Sep
Oct
Nov
Dec
Jan
Feb
Mar
Apr
May
Jun
Jul
$642,000
$431
43
*Information obtained from Broker Metrics, The MLS and Foreclosure Radar for all areas in Lemon Grove Micro Market Report. Statistics are subject to change due to individual real estate company reporting disciplines.
23.2%
13.4%
26.3%
86.7%
26.5%
47.8%
47.6%
15.2%
$600,000
$430
15
21
42
27
50.0%
$637,833
$590,000
$359
27
14
29
12
48.3%
$622,250
$642,000
$431
24
28
43
21
65.1%
$588,750
$521,000
$380
19
15
34
14
44.1%
$499,188
Lemon Grove
$521
$642

Median Price ..........................................
Average Price per Square Foot ...............
Properties Sold .......................................
Properties Pending Sale .........................
Properties For Sale .................................
Days on Market (Pending Sale) ................
Percent Under Contract .........................
Average Median Price for Last 12 Months
Jul 2020 Jul 20216 Month 3 Month % ChangeData*
Current Market Snapshot
Micro Market Report : July 2021
Median sales price.
Average price per square foot.
Properties for sale.
Median Sales Price ($100,000’S)
Jul
Aug
Sep
Oct
Nov
Dec
Jan
Feb
Mar
Apr
May
Jun
Jul
$600,000
$431
32
*Information obtained from Broker Metrics, The MLS and Foreclosure Radar for all areas in National City Micro Market Report. Statistics are subject to change due to individual real estate company reporting disciplines.
23.2%
21%
-8.3%
-6.7%
-5.9%
52.0%
-0.8%
15.7%
$595,000
$463
11
12
35
15
34.3%
$588,833
$550,000
$395
13
9
23
11
39.1%
$581,250
$600,000
$431
11
14
32
36
43.8%
$552,077
$487,000
$356
12
15
34
24
44.1%
$465,454
National City
$487
$600

Median Price ..........................................
Average Price per Square Foot ...............
Properties Sold .......................................
Properties Pending Sale .........................
Properties For Sale .................................
Days on Market (Pending Sale) ................
Percent Under Contract .........................
Average Median Price for Last 12 Months
Jul 2020 Jul 20216 Month 3 Month % ChangeData*
Current Market Snapshot
Micro Market Report : July 2021
Median sales price.
Average price per square foot.
Properties for sale.
Median Sales Price ($100,000’S)
Jul
Aug
Sep
Oct
Nov
Dec
Jan
Feb
Mar
Apr
May
Jun
Jul
$782,000
$458
228
*Information obtained from Broker Metrics, The MLS and Foreclosure Radar for all areas in Oceanside Micro Market Report. Statistics are subject to change due to individual real estate company reporting disciplines.
22.0%
38.3%
-8.4%
-6.3%
-28.7%
-31.5%
31.5%
-74.5%
$742,750
$425
110
106
196
14
54.1%
$785,667
$700,000
$419
52
87
176
21
49.4%
$747,500
$782,000
$458
109
134
228
20
58.8%
$702,765
$641,000
$331
119
143
320
29
44.7%
$1,226,000
Oceanside
$641
$782

Median Price ..........................................
Average Price per Square Foot ...............
Properties Sold .......................................
Properties Pending Sale .........................
Properties For Sale .................................
Days on Market (Pending Sale) ................
Percent Under Contract .........................
Average Median Price for Last 12 Months
Jul 2020 Jul 20216 Month 3 Month % ChangeData*
Current Market Snapshot
Micro Market Report : July 2021
Median sales price.
Average price per square foot.
Properties for sale.
Median Sales Price ($100,000’S)
Jul
Aug
Sep
Oct
Nov
Dec
Jan
Feb
Mar
Apr
May
Jun
Jul
$1,076,000
$498
91
*Information obtained from Broker Metrics, The MLS and Foreclosure Radar for all areas in Poway Micro Market Report. Statistics are subject to change due to individual real estate company reporting disciplines.
29.6%
26.7%
24.5%
6.8%
-14.2%
-53.7%
24.4%
17.3%
$995,500
$450
51
58
95
26
61.1%
$1,159,500
$762,500
$440
24
37
77
25
48.1%
$1,070,500
$1,076,000
$498
61
47
91
14
51.6%
$973,385
$830,000
$393
49
44
106
30
41.5%
$804,742
Poway
$830
$1.076

Median Price ..........................................
Average Price per Square Foot ...............
Properties Sold .......................................
Properties Pending Sale .........................
Properties For Sale .................................
Days on Market (Pending Sale) ................
Percent Under Contract .........................
Average Median Price for Last 12 Months
Jul 2020 Jul 20216 Month 3 Month % ChangeData*
Current Market Snapshot
Micro Market Report : July 2021
Median sales price.
Average price per square foot.
Properties for sale.
Median Sales Price ($100,000’S)
Jul
Aug
Sep
Oct
Nov
Dec
Jan
Feb
Mar
Apr
May
Jun
Jul
$1,210,000
$543
156
*Information obtained from Broker Metrics, The MLS and Foreclosure Radar for all areas in Rancho Bernardo Micro Market Report. Statistics are subject to change due to individual real estate company reporting disciplines.
21.9%
28.3%
-8.5%
-32.8%
-49.8%
-30.5%
33.9%
15.2%
$1,240,000
$511
105
138
218
16
63.3%
$1,220,500
$989,000
$465
65
56
118
24
47.5%
$1,208,583
$1,210,000
$543
119
92
156
17
59.0%
$1,082,923
$992,500
$423
130
137
311
24
44.1%
$917,937
Rancho Bernardo
$992
$1.210

Median Price ..........................................
Average Price per Square Foot ...............
Properties Sold .......................................
Properties Pending Sale .........................
Properties For Sale .................................
Days on Market (Pending Sale) ................
Percent Under Contract .........................
Average Median Price for Last 12 Months
Jul 2020 Jul 20216 Month 3 Month % ChangeData*
Current Market Snapshot
Micro Market Report : July 2021
Median sales price.
Average price per square foot.
Properties for sale.
Median Sales Price ($100,000’S)
Jul
Aug
Sep
Oct
Nov
Dec
Jan
Feb
Mar
Apr
May
Jun
Jul
$947,500
$437
138
*Information obtained from Broker Metrics, The MLS and Foreclosure Radar for all areas in San Marcos Micro Market Report. Statistics are subject to change due to individual real estate company reporting disciplines.
24.8%
32.8%
-14.0%
-14.8%
-30.3%
-1.7%
22.3%
15.0%
$875,000
$415
81
83
135
14
61.5%
$943,833
$777,000
$385
52
42
98
20
42.9%
$912,833
$947,500
$437
80
75
138
24
54.3%
$836,692
$759,000
$329
93
88
198
25
44.4%
$711,288
San Marcos
$759
$947

Median Price ..........................................
Average Price per Square Foot ...............
Properties Sold .......................................
Properties Pending Sale .........................
Properties For Sale .................................
Days on Market (Pending Sale) ................
Percent Under Contract .........................
Average Median Price for Last 12 Months
Jul 2020 Jul 20216 Month 3 Month % ChangeData*
Current Market Snapshot
Micro Market Report : July 2021
Median sales price.
Average price per square foot.
Properties for sale.
Median Sales Price ($100,000’S)
Jul
Aug
Sep
Oct
Nov
Dec
Jan
Feb
Mar
Apr
May
Jun
Jul
$929,000
$637
153
*Information obtained from Broker Metrics, The MLS and Foreclosure Radar for all areas in San Diego Micro Market Report. Statistics are subject to change due to individual real estate company reporting disciplines.
15.4%
21.3%
-4.8%
10.8%
-4.4%
-17.4%
15.8%
12.6%
$910,000
$639
76
74
133
16
55.6%
$937,917
$821,000
$555
42
60
112
24
53.6%
$909,917
$929,000
$637
60
72
153
17
47.1%
$844,442
$805,000
$525
63
65
160
20
40.6%
$738,222
San Diego
$805
$929

Median Price ..........................................
Average Price per Square Foot ...............
Properties Sold .......................................
Properties Pending Sale .........................
Properties For Sale .................................
Days on Market (Pending Sale) ................
Percent Under Contract .........................
Average Median Price for Last 12 Months
Jul 2020 Jul 20216 Month 3 Month % ChangeData*
Current Market Snapshot
Micro Market Report : July 2021
Median sales price.
Average price per square foot.
Properties for sale.
Median Sales Price ($100,000’S)
Jul
Aug
Sep
Oct
Nov
Dec
Jan
Feb
Mar
Apr
May
Jun
Jul
$750,000
$459
83
*Information obtained from Broker Metrics, The MLS and Foreclosure Radar for all areas in Santee Micro Market Report. Statistics are subject to change due to individual real estate company reporting disciplines.
20.2%
24.7%
3.8%
27.5%
-15.3%
16.4%
50.5%
13.0%
$685,000
$437
63
64
105
18
61.0%
$733,333
$640,000
$418
33
27
57
12
47.4%
$696,250
$750,000
$459
55
51
83
19
61.4%
$662,962
$624,000
$368
53
40
98
16
40.8%
$576,463
Santee
$624
$750

Median Price ..........................................
Average Price per Square Foot ...............
Properties Sold .......................................
Properties Pending Sale .........................
Properties For Sale .................................
Days on Market (Pending Sale) ................
Percent Under Contract .........................
Average Median Price for Last 12 Months
Jul 2020 Jul 20216 Month 3 Month % ChangeData*
Current Market Snapshot
Micro Market Report : July 2021
Median sales price.
Average price per square foot.
Properties for sale.
Median Sales Price ($100,000’S)
Jul
Aug
Sep
Oct
Nov
Dec
Jan
Feb
Mar
Apr
May
Jun
Jul
$1,980,200
$913
22
*Information obtained from Broker Metrics, The MLS and Foreclosure Radar for all areas in Solana Beach Micro Market Report. Statistics are subject to change due to individual real estate company reporting disciplines.
17.0%
22.6%
-16.7%
-20.0%
-61.4%
-67.7%
107.3%
22.2%
$1,960,000
$1,076
13
8
21
41
38.1%
$2,335,900
$2,660,000
$1,373
5
5
23
40
21.7%
$2,618,450
$1,980,200
$913
10
8
22
23
36.4%
$2,281,785
$1,692,500
$745
12
10
57
72
17.5%
$1,776,366
Solana Beach
$1.692
$1.980

Median Price ..........................................
Average Price per Square Foot ...............
Properties Sold .......................................
Properties Pending Sale .........................
Properties For Sale .................................
Days on Market (Pending Sale) ................
Percent Under Contract .........................
Average Median Price for Last 12 Months
Jul 2020 Jul 20216 Month 3 Month % ChangeData*
Current Market Snapshot
Micro Market Report : July 2021
Median sales price.
Average price per square foot.
Properties for sale.
Median Sales Price ($100,000’S)
Jul
Aug
Sep
Oct
Nov
Dec
Jan
Feb
Mar
Apr
May
Jun
Jul
$720,000
$394
108
*Information obtained from Broker Metrics, The MLS and Foreclosure Radar for all areas in Spring Valley Micro Market Report. Statistics are subject to change due to individual real estate company reporting disciplines.
30.9%
18%
-7.0%
32.6%
2.9%
-28.1%
28.9%
14.4%
$630,000
$396
52
43
104
17
41.3%
$676,667
$576,000
$372
32
44
80
20
55.0%
$657,842
$720,000
$394
40
57
108
16
52.8%
$614,654
$550,000
$334
43
43
105
22
41.0%
$525,963
Spring Valley
$550
$720

Median Price ..........................................
Average Price per Square Foot ...............
Properties Sold .......................................
Properties Pending Sale .........................
Properties For Sale .................................
Days on Market (Pending Sale) ................
Percent Under Contract .........................
Average Median Price for Last 12 Months
Jul 2020 Jul 20216 Month 3 Month % ChangeData*
Current Market Snapshot
Micro Market Report : July 2021
Median sales price.
Average price per square foot.
Properties for sale.
Median Sales Price ($100,000’S)
Jul
Aug
Sep
Oct
Nov
Dec
Jan
Feb
Mar
Apr
May
Jun
Jul
$790,000
$427
146
*Information obtained from Broker Metrics, The MLS and Foreclosure Radar for all areas in Vista Micro Market Report. Statistics are subject to change due to individual real estate company reporting disciplines.
23.8%
34.3%
-4.9%
-20.4%
-38.9%
-31.4%
30.3%
16.1%
$740,000
$376
67
64
126
13
50.8%
$773,500
$725,000
$353
45
58
118
41
49.2%
$745,083
$790,000
$427
78
74
146
24
50.7%
$701,787
$638,000
$318
82
93
239
35
38.9%
$588,643
Vista
$638
$790
Micro Market Report : July 2021
Beverly Center - Miracle Mile
Beverly Hills
Brentwood
Culver City
Downtown Los Angeles
Encino
Malibu
Malibu Beach
Marina Del Rey
Santa Monica
Sherman Oaks
Studio City
Venice
West Hollywood
West La
Westwood - Century City
Condominiums

Micro Market Report : July 2021
Counties Los Angeles Orange Santa Barbara Monterey

Median Price ..........................................
Average Price per Square Foot ...............
Properties Sold .......................................
Properties Pending Sale .........................
Properties For Sale .................................
Days on Market (Pending Sale) ................
Percent Under Contract .........................
Average Median Price for Last 12 Months
Jul 2020 Jul 20216 Month 3 Month % ChangeData*
Current Market Snapshot
Micro Market Report : July 2021
Median sales price.
Average price per square foot.
Properties for sale.
Median Sales Price ($100,000’S)
Jul
Aug
Sep
Oct
Nov
Dec
Jan
Feb
Mar
Apr
May
Jun
Jul
$710,000
$705
66
*Information obtained from Broker Metrics, The MLS and Foreclosure Radar for all areas in Beverly Center - Miracle Mile Micro Market Report. Statistics are subject to change due to individual real estate company reporting disciplines.
-15.0%
7.8%
42.9%
200.0%
50.0%
47.0%
100.0%
-5.9%
$715,000
$670
19
15
70
48
21.4%
$763,333
$807,500
$620
9
12
78
82
15.4%
$794,689
$710,000
$705
10
21
66
45
31.8%
$816,138
$835,668
$654
7
7
44
30
15.9%
$867,634
Beverly Center - Miracle Mile
$835
$710

Median Price ..........................................
Average Price per Square Foot ...............
Properties Sold .......................................
Properties Pending Sale .........................
Properties For Sale .................................
Days on Market (Pending Sale) ................
Percent Under Contract .........................
Average Median Price for Last 12 Months
Jul 2020 Jul 20216 Month 3 Month % ChangeData*
Current Market Snapshot
Micro Market Report : July 2021
Median sales price.
Average price per square foot.
Properties for sale.
Median Sales Price ($100,000’S)
Jul
Aug
Sep
Oct
Nov
Dec
Jan
Feb
Mar
Apr
May
Jun
Jul
$1,350,000
$801
70
*Information obtained from Broker Metrics, The MLS and Foreclosure Radar for all areas in Beverly Hills Micro Market Report. Statistics are subject to change due to individual real estate company reporting disciplines.
28.2%
25.9%
250.0%
50.0%
-16.7%
129.4%
80.0%
-7.3%
$1,100,000
$794
19
10
88
47
11.4%
$1,316,333
$1,575,000
$749
11
9
85
57
10.6%
$1,225,250
$1,350,000
$801
14
12
70
79
17.1%
$1,218,673
$1,053,000
$636
4
8
84
35
9.5%
$1,314,200
Beverly Hills
$1.053
$1.350

Median Price ..........................................
Average Price per Square Foot ...............
Properties Sold .......................................
Properties Pending Sale .........................
Properties For Sale .................................
Days on Market (Pending Sale) ................
Percent Under Contract .........................
Average Median Price for Last 12 Months
Jul 2020 Jul 20216 Month 3 Month % ChangeData*
Current Market Snapshot
Micro Market Report : July 2021
Median sales price.
Average price per square foot.
Properties for sale.
Median Sales Price ($100,000’S)
Jul
Aug
Sep
Oct
Nov
Dec
Jan
Feb
Mar
Apr
May
Jun
Jul
$937,500
$728
93
*Information obtained from Broker Metrics, The MLS and Foreclosure Radar for all areas in Brentwood Micro Market Report. Statistics are subject to change due to individual real estate company reporting disciplines.
9.0%
7.4%
26.3%
-21.4%
1.1%
-2.6%
-22.3%
-7.5%
$963,000
$702
34
38
118
30
32.2%
$948,467
$830,000
$707
13
12
102
39
11.8%
$942,900
$937,500
$728
24
22
93
25
23.7%
$919,813
$860,000
$678
19
28
92
26
30.4%
$994,750
Brentwood
$860
$937

Median Price ..........................................
Average Price per Square Foot ...............
Properties Sold .......................................
Properties Pending Sale .........................
Properties For Sale .................................
Days on Market (Pending Sale) ................
Percent Under Contract .........................
Average Median Price for Last 12 Months
Jul 2020 Jul 20216 Month 3 Month % ChangeData*
Current Market Snapshot
Micro Market Report : July 2021
Median sales price.
Average price per square foot.
Properties for sale.
Median Sales Price ($100,000’S)
Jul
Aug
Sep
Oct
Nov
Dec
Jan
Feb
Mar
Apr
May
Jun
Jul
$657,500
$599
58
*Information obtained from Broker Metrics, The MLS and Foreclosure Radar for all areas in Culver City Micro Market Report. Statistics are subject to change due to individual real estate company reporting disciplines.
17.0%
6.0%
44.4%
38.1%
-4.9%
44.7%
25.0%
0.6%
$600,500
$610
22
25
50
17
1900.0%
$612,167
$540,000
$589
15
15
47
48
1100.0%
$612,167
$657,500
$599
26
29
58
30
1000.0%
$603,488
$562,000
$565
18
21
61
20
800.0%
$599,844
Culver City
$562
$657
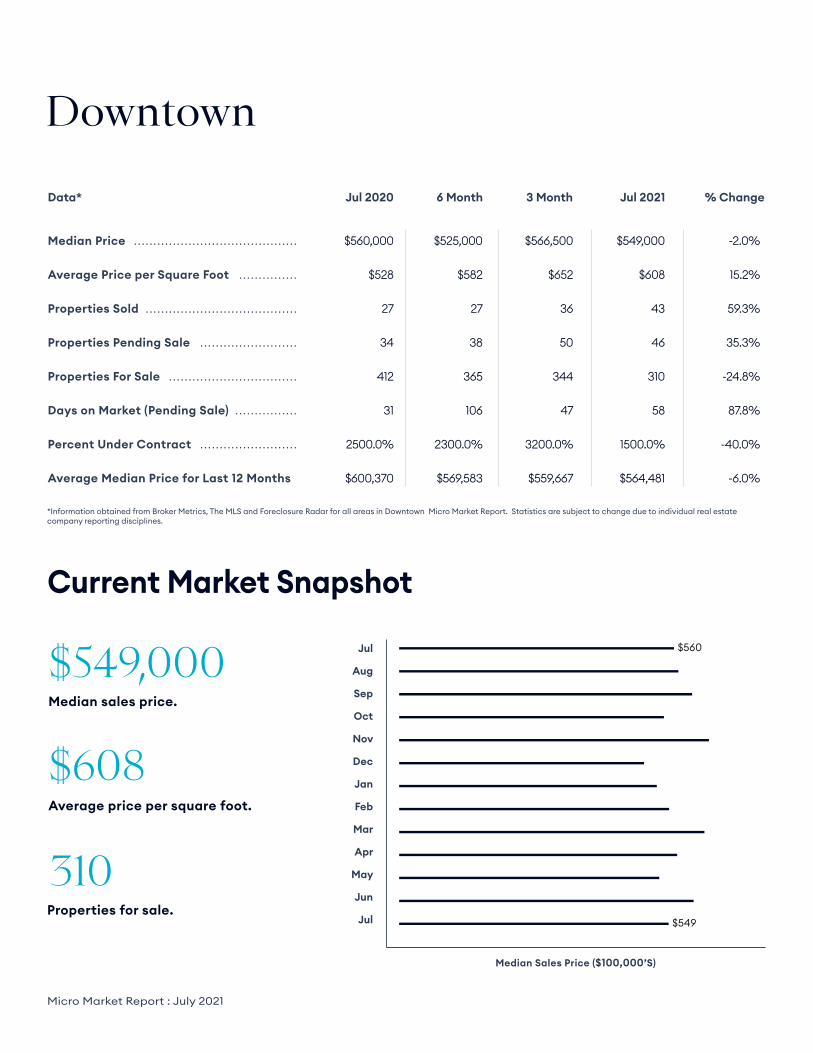
Median Price ..........................................
Average Price per Square Foot ...............
Properties Sold .......................................
Properties Pending Sale .........................
Properties For Sale .................................
Days on Market (Pending Sale) ................
Percent Under Contract .........................
Average Median Price for Last 12 Months
Jul 2020 Jul 20216 Month 3 Month % ChangeData*
Current Market Snapshot
Micro Market Report : July 2021
Median sales price.
Average price per square foot.
Properties for sale.
Median Sales Price ($100,000’S)
Jul
Aug
Sep
Oct
Nov
Dec
Jan
Feb
Mar
Apr
May
Jun
Jul
$549,000
$608
310
*Information obtained from Broker Metrics, The MLS and Foreclosure Radar for all areas in Downtown Micro Market Report. Statistics are subject to change due to individual real estate company reporting disciplines.
-2.0%
15.2%
59.3%
35.3%
-24.8%
87.8%
-40.0%
-6.0%
$566,500
$652
36
50
344
47
3200.0%
$559,667
$525,000
$582
27
38
365
106
2300.0%
$569,583
$549,000
$608
43
46
310
58
1500.0%
$564,481
$560,000
$528
27
34
412
31
2500.0%
$600,370
Downtown
$560
$549

Median Price ..........................................
Average Price per Square Foot ...............
Properties Sold .......................................
Properties Pending Sale .........................
Properties For Sale .................................
Days on Market (Pending Sale) ................
Percent Under Contract .........................
Average Median Price for Last 12 Months
Jul 2020 Jul 20216 Month 3 Month % ChangeData*
Current Market Snapshot
Micro Market Report : July 2021
Median sales price.
Average price per square foot.
Properties for sale.
Median Sales Price ($100,000’S)
Jul
Aug
Sep
Oct
Nov
Dec
Jan
Feb
Mar
Apr
May
Jun
Jul
$495,000
$408
61
*Information obtained from Broker Metrics, The MLS and Foreclosure Radar for all areas in Encino Micro Market Report. Statistics are subject to change due to individual real estate company reporting disciplines.
22.2%
9.4%
0.0%
6.2%
-29.1%
-15.6%
49.8%
-1.1%
$356,750
$427
24
19
60
38
31.7%
$423,333
$397,500
$354
16
17
70
49
24.3%
$426,625
$495,000
$408
23
17
61
25
27.9%
$410,404
$405,000
$373
23
16
86
29
18.6%
$415,146
Encino
$405
$495

Median Price ..........................................
Average Price per Square Foot ...............
Properties Sold .......................................
Properties Pending Sale .........................
Properties For Sale .................................
Days on Market (Pending Sale) ................
Percent Under Contract .........................
Average Median Price for Last 12 Months
Jul 2020 Jul 20216 Month 3 Month % ChangeData*
Current Market Snapshot
Micro Market Report : July 2021
Median sales price.
Average price per square foot.
Properties for sale.
Median Sales Price ($100,000’S)
Jul
Aug
Sep
Oct
Nov
Dec
Jan
Feb
Mar
Apr
May
Jun
Jul
$1,100,000
$1,015
16
*Information obtained from Broker Metrics, The MLS and Foreclosure Radar for all areas in Malibu Micro Market Report. Statistics are subject to change due to individual real estate company reporting disciplines.
38.9%
45.6%
-40.0%
-44.4%
-51.5%
-49.4%
14.6%
19.4%
$1,103,300
$762
4
4
20
25
20.0%
$1,130,000
$1,460,000
$892
3
4
18
147
22.2%
$1,128,660
$1,100,000
$1,015
3
5
16
23
31.2%
$1,149,358
$792,000
$697
5
9
33
45
27.3%
$962,323
Malibu
$792
$1.100

Median Price ..........................................
Average Price per Square Foot ...............
Properties Sold .......................................
Properties Pending Sale .........................
Properties For Sale .................................
Days on Market (Pending Sale) ................
Percent Under Contract .........................
Average Median Price for Last 12 Months
Jul 2020 Jul 20216 Month 3 Month % ChangeData*
Current Market Snapshot
Micro Market Report : July 2021
Median sales price.
Average price per square foot.
Properties for sale.
Median Sales Price ($100,000’S)
Jul
Aug
Sep
Oct
Nov
Dec
Jan
Feb
Mar
Apr
May
Jun
Jul
$1,400,000
$1,781
7
*Information obtained from Broker Metrics, The MLS and Foreclosure Radar for all areas in Malibu Beach Micro Market Report. Statistics are subject to change due to individual real estate company reporting disciplines.
78.1%
122.6%
-33.3%
-50.0%
-58.8%
21.5%
21.4%
64.5%
$0
$0
0
1
8
149
12.5%
$1,180,000
$4,375,000
$2,376
3
2
12
47
16.7%
$1,751,600
$1,400,000
$1,781
2
2
7
156
28.6%
$2,145,817
$786,000
$800
3
4
17
128
23.5%
$1,304,090
Malibu Beach
$786
$1.400

Median Price ..........................................
Average Price per Square Foot ...............
Properties Sold .......................................
Properties Pending Sale .........................
Properties For Sale .................................
Days on Market (Pending Sale) ................
Percent Under Contract .........................
Average Median Price for Last 12 Months
Jul 2020 Jul 20216 Month 3 Month % ChangeData*
Current Market Snapshot
Micro Market Report : July 2021
Median sales price.
Average price per square foot.
Properties for sale.
Median Sales Price ($100,000’S)
Jul
Aug
Sep
Oct
Nov
Dec
Jan
Feb
Mar
Apr
May
Jun
Jul
$1,075,000
$748
130
*Information obtained from Broker Metrics, The MLS and Foreclosure Radar for all areas in Marina Del Rey Micro Market Report. Statistics are subject to change due to individual real estate company reporting disciplines.
7.2%
1.1%
118.8%
13.6%
-17.7%
44.7%
38.1%
6.8%
$1,082,250
$714
34
32
130
46
24.6%
$1,098,333
$1,071,000
$846
17
25
123
48
20.3%
$1,033,708
$1,075,000
$748
35
25
130
44
19.2%
$1,032,481
$1,003,000
$740
16
22
158
30
13.9%
$967,000
Marina Del Rey
$1.003
$1.075

Median Price ..........................................
Average Price per Square Foot ...............
Properties Sold .......................................
Properties Pending Sale .........................
Properties For Sale .................................
Days on Market (Pending Sale) ................
Percent Under Contract .........................
Average Median Price for Last 12 Months
Jul 2020 Jul 20216 Month 3 Month % ChangeData*
Current Market Snapshot
Micro Market Report : July 2021
Median sales price.
Average price per square foot.
Properties for sale.
Median Sales Price ($100,000’S)
Jul
Aug
Sep
Oct
Nov
Dec
Jan
Feb
Mar
Apr
May
Jun
Jul
$1,030,000
$956
138
*Information obtained from Broker Metrics, The MLS and Foreclosure Radar for all areas in Santa Monica Micro Market Report. Statistics are subject to change due to individual real estate company reporting disciplines.
-9.6%
-1.7%
3.1%
-16.7%
-28.1%
19.3%
15.9%
-4.6%
$895,000
$1,020
39
36
180
39
20.0%
$985,000
$775,000
$880
23
23
194
59
11.9%
$948,750
$1,030,000
$956
33
30
138
33
21.7%
$933,962
$1,140,000
$973
32
36
192
28
18.8%
$979,383
Santa Monica
$1.140
$1.030

Median Price ..........................................
Average Price per Square Foot ...............
Properties Sold .......................................
Properties Pending Sale .........................
Properties For Sale .................................
Days on Market (Pending Sale) ................
Percent Under Contract .........................
Average Median Price for Last 12 Months
Jul 2020 Jul 20216 Month 3 Month % ChangeData*
Current Market Snapshot
Micro Market Report : July 2021
Median sales price.
Average price per square foot.
Properties for sale.
Median Sales Price ($100,000’S)
Jul
Aug
Sep
Oct
Nov
Dec
Jan
Feb
Mar
Apr
May
Jun
Jul
$673,500
$505
66
*Information obtained from Broker Metrics, The MLS and Foreclosure Radar for all areas in Sherman Oaks Micro Market Report. Statistics are subject to change due to individual real estate company reporting disciplines.
18.2%
12.5%
13.0%
16.0%
-19.5%
-35.4%
44.1%
8.4%
$660,000
$457
24
26
66
15
39.4%
$622,083
$650,000
$430
15
23
75
35
30.7%
$614,375
$673,500
$505
26
29
66
20
43.9%
$595,096
$570,000
$449
23
25
82
31
30.5%
$548,854
Sherman Oaks
$570
$673

Median Price ..........................................
Average Price per Square Foot ...............
Properties Sold .......................................
Properties Pending Sale .........................
Properties For Sale .................................
Days on Market (Pending Sale) ................
Percent Under Contract .........................
Average Median Price for Last 12 Months
Jul 2020 Jul 20216 Month 3 Month % ChangeData*
Current Market Snapshot
Micro Market Report : July 2021
Median sales price.
Average price per square foot.
Properties for sale.
Median Sales Price ($100,000’S)
Jul
Aug
Sep
Oct
Nov
Dec
Jan
Feb
Mar
Apr
May
Jun
Jul
$767,000
$565
33
*Information obtained from Broker Metrics, The MLS and Foreclosure Radar for all areas in Studio City Micro Market Report. Statistics are subject to change due to individual real estate company reporting disciplines.
2.4%
11.9%
-25.0%
0.0%
-38.9%
22.3%
63.6%
2.2%
$728,000
$541
20
14
45
23
31.1%
$765,333
$636,800
$510
13
17
47
64
36.2%
$733,333
$767,000
$565
9
13
33
30
39.4%
$706,312
$748,750
$505
12
13
54
25
24.1%
$691,188
Studio City
$748
$767

Median Price ..........................................
Average Price per Square Foot ...............
Properties Sold .......................................
Properties Pending Sale .........................
Properties For Sale .................................
Days on Market (Pending Sale) ................
Percent Under Contract .........................
Average Median Price for Last 12 Months
Jul 2020 Jul 20216 Month 3 Month % ChangeData*
Current Market Snapshot
Micro Market Report : July 2021
Median sales price.
Average price per square foot.
Properties for sale.
Median Sales Price ($100,000’S)
Jul
Aug
Sep
Oct
Nov
Dec
Jan
Feb
Mar
Apr
May
Jun
Jul
$1,175,000
$761
23
*Information obtained from Broker Metrics, The MLS and Foreclosure Radar for all areas in Venice Micro Market Report. Statistics are subject to change due to individual real estate company reporting disciplines.
22.3%
-3.7%
100.0%
-33.3%
-17.9%
368.8%
-18.8%
0.4%
$1,055,000
$1,133
2
3
30
33
10.0%
$1,182,500
$867,000
$919
4
4
29
101
13.8%
$1,292,833
$1,175,000
$761
4
2
23
50
8.7%
$1,206,769
$960,500
$790
2
3
28
11
10.7%
$1,201,833
Venice
$960
$1.175

Median Price ..........................................
Average Price per Square Foot ...............
Properties Sold .......................................
Properties Pending Sale .........................
Properties For Sale .................................
Days on Market (Pending Sale) ................
Percent Under Contract .........................
Average Median Price for Last 12 Months
Jul 2020 Jul 20216 Month 3 Month % ChangeData*
Current Market Snapshot
Micro Market Report : July 2021
Median sales price.
Average price per square foot.
Properties for sale.
Median Sales Price ($100,000’S)
Jul
Aug
Sep
Oct
Nov
Dec
Jan
Feb
Mar
Apr
May
Jun
Jul
$785,000
$804
157
*Information obtained from Broker Metrics, The MLS and Foreclosure Radar for all areas in West Hollywood Micro Market Report. Statistics are subject to change due to individual real estate company reporting disciplines.
2.6%
-12.0%
-23.7%
-44.2%
-25.2%
13.5%
-25.3%
0.9%
$820,000
$788
32
38
164
32
23.2%
$820,000
$690,000
$735
23
31
175
61
17.7%
$800,733
$785,000
$804
29
24
157
37
15.3%
$773,512
$765,000
$914
38
43
210
33
20.5%
$766,688
West Hollywood
$765
$785

Median Price ..........................................
Average Price per Square Foot ...............
Properties Sold .......................................
Properties Pending Sale .........................
Properties For Sale .................................
Days on Market (Pending Sale) ................
Percent Under Contract .........................
Average Median Price for Last 12 Months
Jul 2020 Jul 20216 Month 3 Month % ChangeData*
Current Market Snapshot
Micro Market Report : July 2021
Median sales price.
Average price per square foot.
Properties for sale.
Median Sales Price ($100,000’S)
Jul
Aug
Sep
Oct
Nov
Dec
Jan
Feb
Mar
Apr
May
Jun
Jul
$855,000
$694
59
*Information obtained from Broker Metrics, The MLS and Foreclosure Radar for all areas in West LA Micro Market Report. Statistics are subject to change due to individual real estate company reporting disciplines.
-16.2%
2.2%
116.7%
142.9%
20.4%
12.9%
101.7%
-3.2%
$908,000
$682
13
11
65
41
16.9%
$782,500
$825,000
$664
9
13
79
60
16.5%
$828,000
$855,000
$694
13
17
59
37
28.8%
$852,462
$1,020,000
$679
6
7
49
33
14.3%
$880,329
West LA
$1.020
$855

Median Price ..........................................
Average Price per Square Foot ...............
Properties Sold .......................................
Properties Pending Sale .........................
Properties For Sale .................................
Days on Market (Pending Sale) ................
Percent Under Contract .........................
Average Median Price for Last 12 Months
Jul 2020 Jul 20216 Month 3 Month % ChangeData*
Current Market Snapshot
Micro Market Report : July 2021
Median sales price.
Average price per square foot.
Properties for sale.
Median Sales Price ($100,000’S)
Jul
Aug
Sep
Oct
Nov
Dec
Jan
Feb
Mar
Apr
May
Jun
Jul
$910,000
$757
387
*Information obtained from Broker Metrics, The MLS and Foreclosure Radar for all areas in Westwood - Century City Micro Market Report. Statistics are subject to change due to individual real estate company reporting disciplines.
6.4%
9.7%
110.3%
12.0%
9.6%
27.3%
2.2%
-3.4%
$975,000
$768
53
53
386
41
13.7%
$995,667
$1,010,000
$759
37
43
348
52
12.4%
$978,917
$910,000
$757
61
56
387
41
14.5%
$945,462
$855,000
$690
29
50
353
32
14.2%
$978,719
Westwood - Century City
$855
$910

150 EL CAMINO DRIVE, BEVERLY HILLS, CA 90212. 310.595.3888 © 2021 DOUGLAS ELLIMAN REAL ESTATE. ALL MATERIAL PRESENTED HEREIN IS INTENDED FOR INFORMATION PURPOSES ONLY. WHILE, THIS INFORMATION IS BELIEVED TO BE CORRECT, IT IS REPRESENTED SUBJECT TO ERRORS, OMISSIONS, CHANGES OR WITHDRAWAL WITHOUT NOTICE. ALL PROPERTY INFORMATION, INCLUDING, BUT NOT LIMITED TO SQUARE FOOTAGE, ROOM COUNT, NUMBER OF BEDROOMS AND THE SCHOOL DISTRICT IN PROPERTY LISTINGS SHOULD BE VERIFIED BY YOUR OWN ATTORNEY, ARCHITECT OR ZONING EXPERT. EQUAL HOUSING OPPORTUNITY. DATA SOURCED FROM BROKERMETRICS BY TERRADATUM.