mewah international inc. staying the …...mewah international inc. staying the course building our...
TRANSCRIPT

MEWAH INTERNATIONAL INC.
STAYING THE COURSE
BUILDING OUR CORE
Annual Report
2018

We are a global agri-business, focused on edible oils and fats with refineries and processing facilities in Malaysia and Singapore, established brands and sales to customers in over 100 countries.
We are strategically positioning ourselves to become a global consumer products business by expanding range of consumer products, offering specialised applications and customer solutions while consolidating our position in oils and fats business.
MEWAH INTERNATIONAL INC.
Sales volume of
4.2million M.T
OUR BRANDS:

CONTENTS
Corporate Profile 2
Chairman’s Message 4
CEO’s Message 5
Board of Directors 6
Senior Management 9
Operations and Financial Review 11
Forward Looking Strategy 17
Research and Development 19
Risk Management 20
Corporate Social Responsibility 22
Corporate Information 28
Corporate Governance 29
Directors’ Statement 45
Independent Auditor’s Report 49
Financial Statements 53
Statistics of Shareholdings 139
Notice of Annual General Meeting 142
Sales to over
100countries
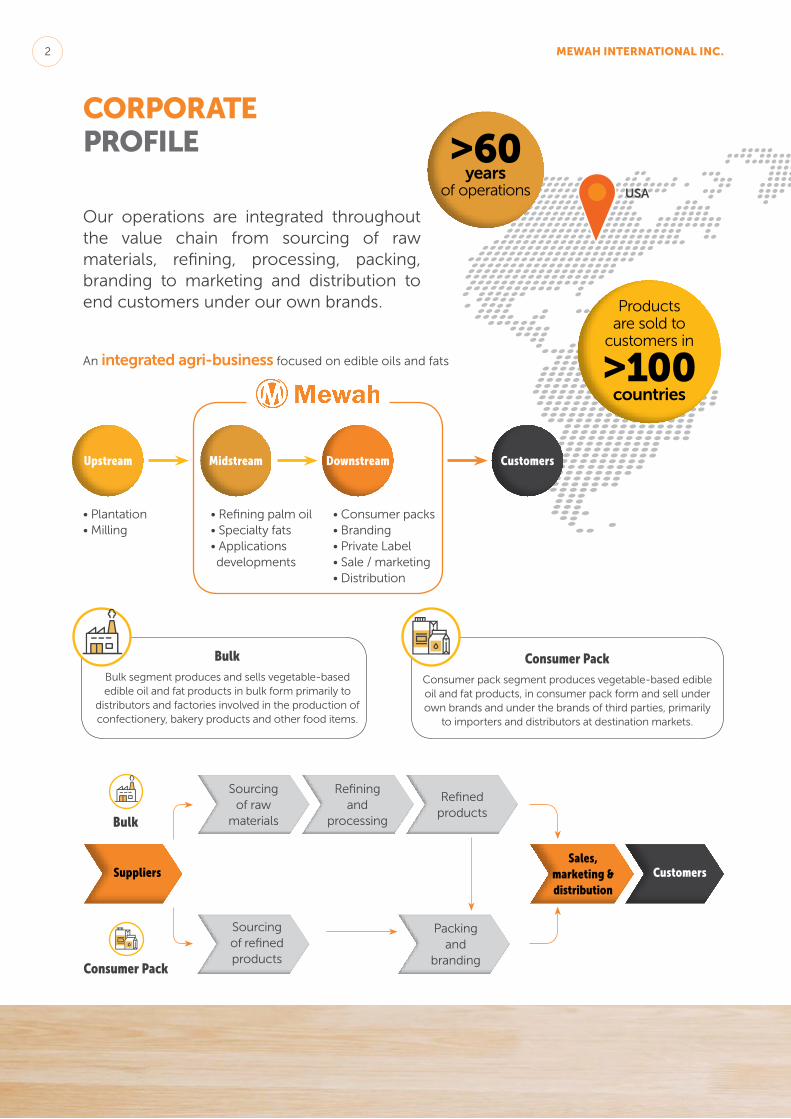
CORPORATE PROFILE
Our operations are integrated throughout the value chain from sourcing of raw materials, refining, processing, packing, branding to marketing and distribution to end customers under our own brands.
An integrated agri-business focused on edible oils and fats
Products are sold to
customers in
>100countries
of operations
>60years
USA
• Consumer packs• Branding• Private Label• Sale / marketing• Distribution
• Refining palm oil• Specialty fats• Applications developments
• Plantation• Milling
Sourcing of raw
materials
Sourcing of refinedproducts
Refining and
processing
Refined products
Packing and
branding
Consumer pack segment produces vegetable-based edible oil and fat products, in consumer pack form and sell under own brands and under the brands of third parties, primarily
to importers and distributors at destination markets.
Bulk segment produces and sells vegetable-based edible oil and fat products in bulk form primarily to
distributors and factories involved in the production of confectionery, bakery products and other food items.
2 MEWAH INTERNATIONAL INC.
Long established and well recognised
brands –
OKI & MOI
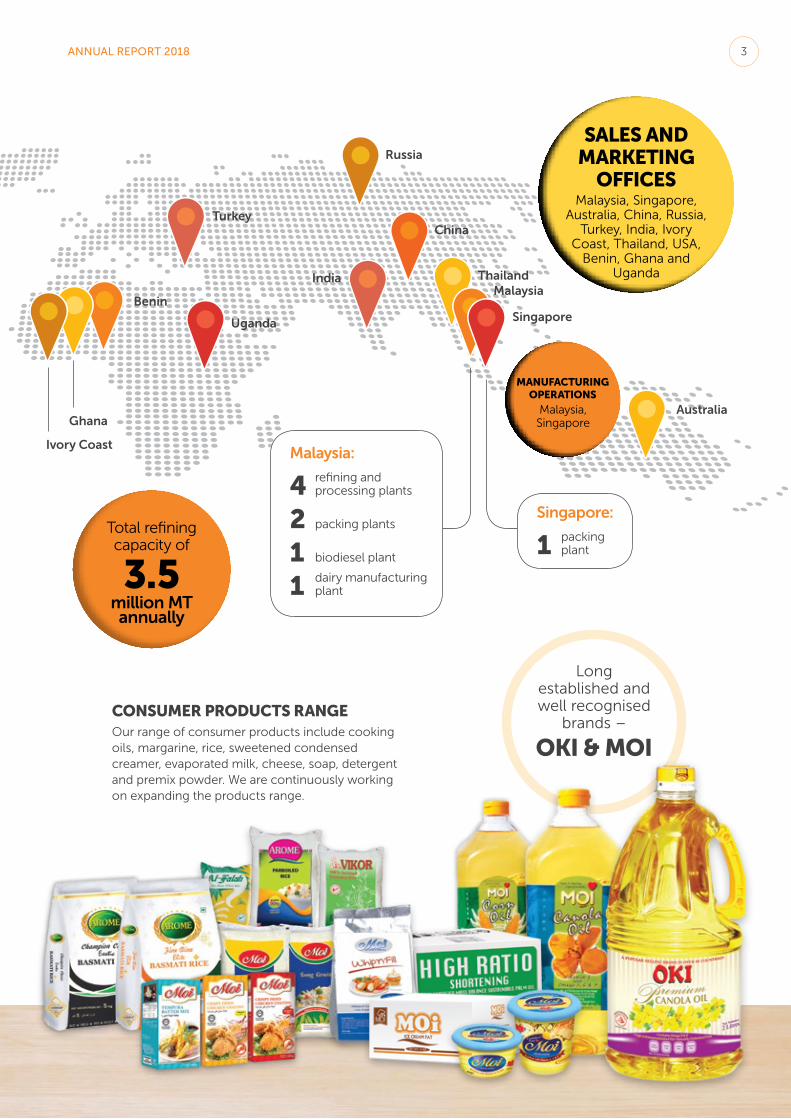
Malaysia, Singapore, Australia, China, Russia,
Turkey, India, Ivory Coast, Thailand, USA,
Benin, Ghana and Uganda
SALES AND MARKETING
OFFICES
Total refining capacity of
3.5million MT annually
Singapore
Australia
MalaysiaThailand
China
Russia
Turkey
Benin
Ghana
Ivory Coast
India
Uganda
Malaysia:
refining and processing plants
packing plants
biodiesel plant
dairy manufacturing plant
4211
Singapore:
packing plant1
CONSUMER PRODUCTS RANGEOur range of consumer products include cooking oils, margarine, rice, sweetened condensed creamer, evaporated milk, cheese, soap, detergent and premix powder. We are continuously working on expanding the products range.
MANUFACTURING OPERATIONS
Malaysia, Singapore
3ANNUAL REPORT 2018
CHAIRMAN’S MESSAGE
Our people are the backbone of Mewah and their development is of paramount importance.
I am pleased to provide this Annual Report of the Group’s performance for the full year 2018.
This year, we have sharpened our focus on efficiency and productivity, and delivered a profit after tax of US$14.8m. This has enabled us to announce a final dividend of 0.45 Singapore cent per ordinary share which along with interim dividend 0.22 Singapore cent per ordinary share, making total dividend of 0.67 Singapore cent per ordinary share for the full year.
Despite some volatility, crude palm oil prices remained broadly supportive during the year, but growth in our end-markets was relatively subdued and inflationary pressures increased in some of our product groups. A continuing focus on refinery-to-market productivity and value over volume was therefore essential to defend the Group’s profitability.
Mewah has been on a deliberate path to maximise cash flow, maintain capital discipline and increase value and returns to our shareholders. Our world-class portfolio of assets and marketing businesses stand us in good stead for the uncertain market conditions in the year ahead.
We have been focused on sustainability for a number of years. Our “Journey Towards Sustainability” program primarily focuses on 5 key areas: (1) Minimising Our Environmental Footprint, (2) Responsible Supply Chain, (3) Product Quality and Safety, (4) Valuing Our People and (5) Community Support. These help the Senior Management to focus on developing policies and practices, setting performance targets and action plans in order to create sustainable value for all shareholders.
While our Group continues to face external market challenges, our Board believes that our people, our industrial assets and marketing businesses are industry-leading and we continue to have confidence in the long-term prospects of the Group for the benefit of all of its stakeholders.
Our people remain the backbone of Mewah and their development is of paramount importance. We are also grateful to our Board of Directors and employees for their continued support and passion. All these put us in a much stronger position for a sustainable future growth.
DR CHEO TONG CHOON @ LEE TONG CHOONChairman and Executive Director
4 MEWAH INTERNATIONAL INC.
CEO’SMESSAGE
Total sales volume for the year rose 13.7% from 3.7 million metric tonne to over 4.2 million metric tonne. Both Bulk and Consumer Pack segments registered steady volume growth of 19.0% and 1.4% respectively. Our Bulk business remained resilient and delivered stable margin of US$22.7 per metric tonne while our consumer pack saw a healthy margin of US$47.4 per metric tonne. While the net profit attributable to shareholders registered a decline at US$14.8 million, we are encouraged by our robust performance in the fourth quarter and finished a difficult year on a stronger footing. The Group’s Balance Sheet position remained strong with high financial liquidity. As at 31 December 2018, the Group had a healthy net debt to equity ratio of 0.77. Our Balance Sheet continues to reflect strong underlying fundamentals. Our policy on debt and liquidity management, has always been to maintain a strong balance sheet throughout the business cycle, strict capital discipline and diversification of funding sources in order to give us stability and flexibility throughout the period.
LOOKING AHEADWhile we face significant geopolitical uncertainties, particularly on trade, continuing weak global macroeconomics, tightening financial markets and challenging market conditions, we remain optimistic for the palm oil industry as the recent Indonesia’s and Malaysia’s biofuel mandates will support demand. Also in this context, our priority continues to be the safe, continuous improvement of our operating and capital efficiency, driving increased productivity from refinery-to-market.
While 2018 presented challenges for the palm oil industry, our continued investments in new products, integrated network and increased capacity helped the Group to sustain the growth in sales volume.
We are also looking to fortify our position as an integrated edible oils and fats business to become an integrated global food business, ready to seize greater opportunities. The Group is adding sourcing, manufacturing and distribution synergies into our consumer pack business. In Malaysia, we are working to strengthen our manufacturing facilities and building critical capabilities, which will complement our current palm oil business by broadening our range of products to meet the market demand. Our people continue to energise the Company – their ideas and their enthusiasm for our business and the commitment they have to making Mewah into a safer, more productive and more responsible company. Our success this year is due to their hard work and dedication, and I thank them for all they do, every day – at every asset, and in every office. In 2018, we focused on building our technical and leadership capabilities to equip our people and our company for continued success. Our aspiration is to continue to pioneer our industry, with a culture that welcomes and nurtures new ideas and higher performance. As we look to the future, we see markets remaining volatile, with some risk of a trade war and a deceleration in economic activity. At Mewah, we will continue to invest in the business so that we will be better-equipped to handle these challenges. With a world-class portfolio, a strong balance sheet and people who I am convinced are some of the best in the business, we are well positioned to withstand these challenges – and to create new opportunities. Lastly, we wish to express our appreciation to the Board members for their counsel and advice; staff for their many years of dedicated service and contributions to Mewah; and all our shareholders, bankers, business partners, and customers for their strong support and commitment. As we enter a new year, I have no doubt that we will bring Mewah to greater heights.
MS MICHELLE CHEO HUI NINGChief Executive Officer and Executive Director
5ANNUAL REPORT 2018
BOARD OF DIRECTORS
EXECUTIVE DIRECTORS
DR CHEO TONG CHOON @ LEE TONG CHOONExecutive Director
Date of first appointment as Director: 29 October 2010Date of last re-election: 26 April 2018
• Chairman of the Board of Directors• Member of Nominating Committee
As the Chairman of the Board, Dr Cheo Tong Choon @ Lee Tong Choon is responsible for leading the Board, facilitating effective contribution from non-executive directors, effective communication with shareholders and promoting high standards of corporate governance. He is responsible for setting the strategic direction of the Group. Dr Cheo has been leading the Group for the past three decades. Under his direction, the Group has expanded into refining, manufacturing and trading of palm oil and related products. Dr Cheo also oversaw the expansion of the Group into new businesses including biodiesel, rice, dairy and soap.
Dr Cheo obtained a Doctor of Medicine (MD) degree from the University of Saskatchewan, Canada and is a member of the Royal Colleges of Physicians of the United Kingdom in internal medicine. He practiced as a registered medical practitioner from 1975 to 1986 with a group of medical specialists, Drs Bain & Partners in Singapore, before he took over the leadership role in our Group.
MS MICHELLE CHEO HUI NINGExecutive Director
Date of first appointment as Director: 29 October 2010Date of last re-election: 27 April 2016
• Chief Executive Officer• Member of Board of Directors
Ms Michelle Cheo Hui Ning joined the Group in 2003 and is responsible for the formulation and execution of overall strategy of the Group, new business development, project execution, corporate risk and factory operations. Since joining the Group, Ms Cheo has been instrumental in expanding the supply chain
of the Group. This has included building an additional refinery, specialty fats facilities, and dairy factory. She has been the leading force to get the Group listed on Singapore Exchange and expand the Group’s presence geographically into Indonesia and China as well as new business divisions of specialty fats, shipping and biodiesel. Prior to joining the Group, she worked with Exxon Mobil from 1997 to 2003 in USA and Singapore.
Ms Cheo graduated in 1997 and holds a Chemical Engineering degree from Imperial College, University of London. She obtained a Master of Business Administration degree from INSEAD in 2004. Ms Cheo currently serves on the 60th council of the Singapore Chinese Chamber of Commerce & Industries and a board member of the Singapore Chinese Orchestra.
MS BIANCA CHEO HUI HSINExecutive Director
Date of first appointment as Director: 29 October 2010Date of last re-election: 27 April 2017
• Chief Operating Officer• Member of Board of Directors
Ms Bianca Cheo Hui Hsin joined the Group in 2004 and heads the Consumer Pack segment of which she has overall responsibility. Since taking over the division, she has been focusing on enhancing brand building & sales and development of premium customised oils and fats products. In addition, Ms Cheo has been instrumental in introducing new products to the consumer pack division, leading the Group’s foray into rice, soap and dairy products. She has also expanded the Group’s distribution strength, developing the Group’s presence in West Africa, Europe and South America. Ms Cheo was responsible for executing the Group’s listing on the Singapore Stock Exchange.
Prior to joining the Group, she practiced law in Singapore with Allen & Gledhill LLP from 2000 to 2003 and with Norton Rose LLP from 2003 to 2004. Ms Cheo graduated from the King’s College University of London, with a Bachelor of Laws in 1998 and was admitted as an advocate and solicitor of the Supreme Court of Singapore in 2000.
6 MEWAH INTERNATIONAL INC.
MS WONG LAI WANExecutive Director
Date of first appointment as Director: 29 October 2010Date of last re-election: 27 April 2016
• Head, Risk Management• Member of Board of Directors
Ms Wong Lai Wan joined the Group in 1987 as a chemist. She has held various portfolios in quality control, production, operations, logistics, marketing, trading, business development and risk management. She is currently responsible for the business development, operational controls and risk management of the Group. Ms Wong started her career with Pan Century Edible Oils Sdn Bhd as a chemist from 1985 to 1987 before joining us.
Ms Wong graduated with a Bachelor of Science degree in Chemistry with First Class Honours from Universiti Kebangsaan Malaysia in 1985.
INDEPENDENT DIRECTORS
MR ROBERT LOKE TAN CHENGIndependent Director
Date of first appointment as Director: 28 April 2015Date of last re-election: 26 April 2018
• Member of Board of Directors• Chairman of Audit Committee• Member of Remuneration Committee• Member of Nominating Committee
Mr Robert Loke Tan Cheng has over 30 years’ banking experience with major global, regional corporate lending, risk management and investment banks in Asia. Mr Loke led Bangkok Bank Berhad, Malaysia for 9 years before retiring as Chief Executive and Executive Director in 2015. In the past, Mr Loke held various positions in risk management and operational banking with Nomura Singapore Limited, Keppel Tatlee Bank, OCBC Group, Allied Irish Bank and Chase Manhattan Bank.
Mr Loke was Executive Director of Bangkok Bank Berhad, Malaysia and Director for Bangkok Bank Nominees, Malaysia from 2007 to 2015. He was also member of the Association of Banks in Singapore’s (ABS) Standing Committee for Risk Management and the Vice-Chairman of the ABS’s Credit Risk task force from 2005 to 2006.
Mr Loke obtained Post Graduate Diploma in Management from McGill University in 1979. He also obtained MBA and Electrical Engineering with cum Laude (Distinction) from Concordia University in 1980 and 1978 respectively.
DR FOO SAY MUI (BILL)Independent Director
Date of first appointment as Director: 28 April 2015Date of last re-election: 26 April 2018
• Member of Board of Directors• Lead Independent Director• Chairman of Nominating Committee • Chairman of Remuneration Committee
Dr Foo Say Mui (Bill) has more than 30 years’ experience in financial services industry. Dr Foo has served as CEO/General Manager of Australia & New Zealand Banking Group Ltd (ANZ) in Singapore for 12 years from 1999 to 2011. Prior to his retirement from ANZ in 2015, Dr Foo was appointed as Vice Chairman, South and South East Asia from 2011 to 2015. Dr Foo also held various positions including as President Director in Indonesia and Regional Head of Investment Banking.
Dr Foo is currently a director and adviser to several listed and private companies including Tung Lok Restaurants (2000) Ltd and Director of Tower Capital Asia Pte. Ltd, Kenon Holdings Ltd, Business Circle Singapore Pte Ltd, M&C REIT Management Ltd and M&C Business Trust Management Ltd.
Dr Foo graduated from Concordia University with a Bachelor of Business Administration. He also holds a Masters of Business Administration from McGill University and an honorary Doctorate of Commerce from James Cook University, Australia.
7ANNUAL REPORT 2018

BOARD OF DIRECTORS
TAN SRI DATUK DR ONG SOON HOCKIndependent Director
Date of first appointment as Director: 29 October 2010Date of last re-election: 28 April 2015
• Member of Board of Directors• Member of Audit Committee • Member of Remuneration Committee • Member of Nominating Committee
Tan Sri Datuk Dr Ong Soon Hock has been a pioneer in contributing to the group of palm oil industry. He was a director of the Malaysian Palm Oil Promotion Council from 1990 to 1996 and was Director General of the Palm Oil Research Institute of Malaysia from 1987 to 1989 where he remained as an advisor until 1990. His contributions to the palm oil industry have led to his receiving several prestigious awards including Merdeka Award, Palm Oil Industry Leadership (PILA) Award and Pioneer in Tocotrienol Research from the Oxygen Club of California. He has 40 years of research and development experience in lipid chemistry and is the registered holder of 20 patents in the field of palm oil related technology.
Tan Sri Datuk Dr Ong is Emeritus Professor of University Science Malaysia (USM). As former Chairman of Programme Advisory Committee Panel on Food, Nutrition and Quality, former Chairman of MPOB Nutrition Projects Committee and as former Chairman of International Advisory Panel on Nutrition, Dr Ong has been actively involved in various research projects of Malaysian Palm Oil Board.
Tan Sri Datuk Dr Ong graduated with a Bachelor of Science degree with First Class Honours and obtained a Master of Science from the University of Malaya. He also obtained a Doctor of Philosophy (PhD) in organic chemistry from King’s College University of London and the Distinguished Sc. Alumni Award from National University of Singapore. He was Fulbright-Hays Fellow at MIT. He was Visiting Professor at Dyson Perrins Laboratory, University of Oxford. He is a Senior Fellow of the Academy of Sciences Malaysia with the title “Academician”, Fellow of King’s College, London and Fellow of TWAS Academy of Sciences. On 21 September 2015, he received the Anugerah Tokoh Akademik Negara Award. In February 2016, he was awarded Hon D.Sc by University of Nottingham.
DATUK DR FAWZIA BINTI ABDULLAHIndependent Director
Date of first appointment as Director: 8 August 2017Date of last re-election: 26 April 2018
• Member of Board of Directors• Member of Audit Committee• Member of Nominating Committee
Datuk Dr Fawzia Binti Dato Abdullah currently sits on the board of Econ Health Care and Nursing Home Sdn. Bhd. in Malaysia and is an advisor to BookDoc.com .
In 2010, Datuk Dr Fawzia was appointed as Foundation Dean of SEGI University in Malaysia and was Professor and Head of the Dental Faculty till her retirement in 2016.
In 1999, Datuk Dr Fawzia was appointed as Public Services Commissioner by DYMM the Yang Di Pertuan Agong of Malaysia for a term of 5 years.
In recognition of her services to the country, she was conferred the honourable title – Panglima Jasa Negara by DYMM Yang Di Pertuan Agong of Malaysia. Datuk Dr Fawzia was also awarded Pingat Ibrahim Sultan in 1976 and Setia Mahkota Johor in 1978 by DYMM Sultan Ismail Johor.
Datuk Dr Fawzia was the first woman to be conferred as Honorary Member of the Malaysian Dental Association (MDA) and was the Vice President of the MDA from 1981 to 1991. Datuk Dr Fawzia was inducted as Fellow of Federation Dentaire International which was founded in Paris in 1986.
Datuk Dr Fawzia graduated from the University of Singapore with a Bachelor of Dental Surgery in 1968 and she did her post graduate in Public Health Dentistry at London University in 1976.
She was with the Ministry of Health Malaysia for 32 years and was the first female Director of Oral Health.
8 MEWAH INTERNATIONAL INC.
SENIOR MANAGEMENT
Prior to joining our Group, Mr Kumbhat worked with Pan Century Edible Oils Sdn Bhd, a member of the India-based multinational Birla Group as Vice President, Marketing from 1977 to 1995.
MS WONG LAI WANMs Wong Lai Wan is our Executive Director and Head, Risk Management. Details of her working experience and qualifications are set out in “Board of Directors”, page 7.
MS AGNES LIM SIEW CHOOMs Agnes Lim Siew Choo is the Head, Operations in Malaysia. She joined our Group in 1988 as Factory Operations Executive, and subsequently progressed to overseeing the factory operations of our Malaysian subsidiaries as the Group expanded.
Ms Lim has more than 30 years’ experience in factory operation. Her present portfolio spans production, quality assurance, procurement, as well as ensuring all local and overseas delivery commitments. Prior to joining us, Ms Lim worked with Southern Edible Oils Sdn Bhd from 1983 to 1988 as an Operations Executive, and was responsible for receiving and dispatching edible oil, production planning and the fulfilment of local and overseas shipment requirements.
She obtained a Bachelor of Arts degree from The University of York, in Toronto, Canada in 1982.
DR CHEO TONG CHOON @ LEE TONG CHOONDr Cheo Tong Choon @ Lee Tong Choon is our Chairman and Executive Director. Details of his working experience and qualifications are set out in “Board of Directors”, page 6.
MS MICHELLE CHEO HUI NINGMs Michelle Cheo Hui Ning is our Executive Director and Chief Executive Officer. Details of her working experience and qualifications are set out in “Board of Directors”, page 6.
MS BIANCA CHEO HUI HSINMs Bianca Cheo Hui Hsin is our Executive Director and Chief Operating Officer. Details of her working experience and qualifications are set out in “Board of Directors”, page 6.
MR JAMES SOO WENG FATTMr James Soo Weng Fatt was appointed as Chief Financial Officer on 01 December 2017. He is responsible for financial strategies and planning, treasury, corporate accounts, financial reporting, taxation, corporate affairs and investor relations. He has more than 30 years’ experience mainly in financial services. Prior to joining our Group, he had held senior finance positions in several reputable financial institutions including AXA Partners, Deutsche Bank, Aviva, Standard Chartered Bank and ABN Amro Bank. These roles have taken him from London to across Asia namely Singapore, Hong Kong and Shanghai.
Mr James Soo is a Fellow of Chartered Accountant from the Institute of Chartered Accountants in England and Wales (ICAEW). He was also an honours graduate from the London School of Economics.
MR SHYAM KUMBHATMr Shyam Kumbhat is the Head, Trading and Merchandising. He is responsible for overseeing our palm oil bulk trading and marketing activities. He joined our Group in 1995 as the president of Mewah Oils & Fats Pte Ltd. He has more than 40 years of experience in the edible oils and fats industry.
9ANNUAL REPORT 2018

STRENGTHENING BRAND
PORTFOLIO
OPERATIONS AND FINANCIAL REVIEW
FY 2016 FY 2017 FY 2018
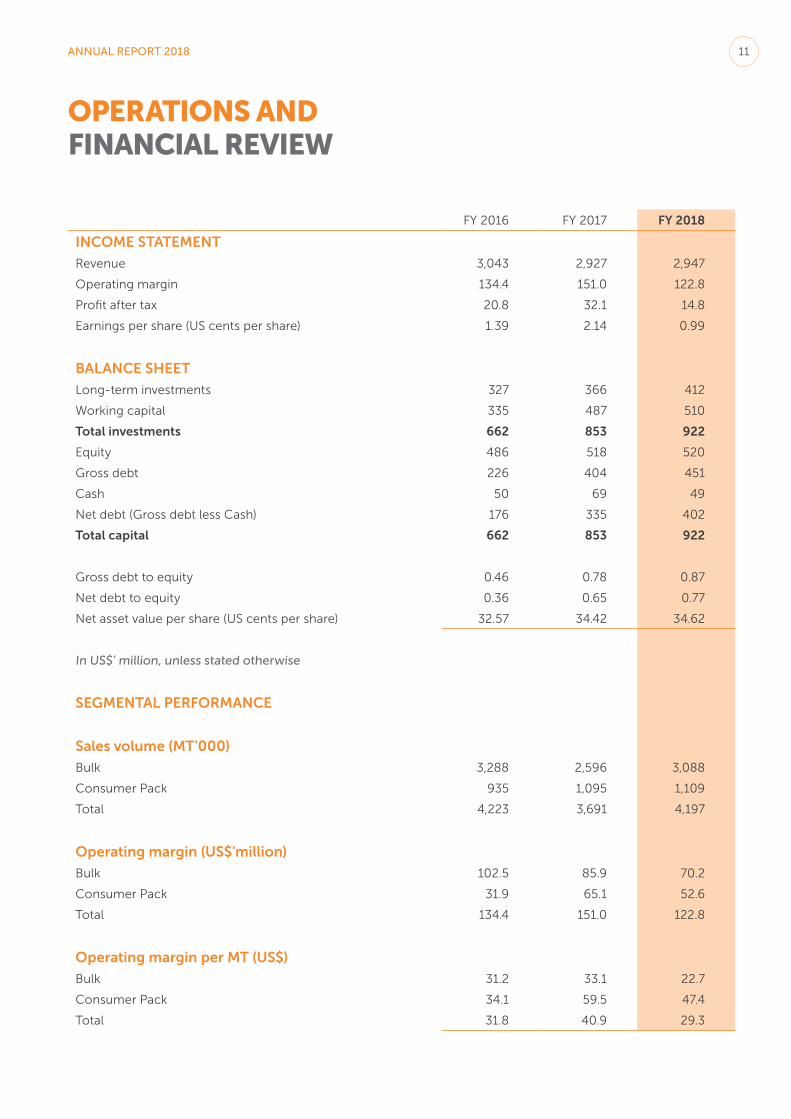
INCOME STATEMENT
Revenue 3,043 2,927 2,947
Operating margin 134.4 151.0 122.8
Profit after tax 20.8 32.1 14.8
Earnings per share (US cents per share) 1.39 2.14 0.99
BALANCE SHEET
Long-term investments 327 366 412
Working capital 335 487 510
Total investments 662 853 922
Equity 486 518 520
Gross debt 226 404 451
Cash 50 69 49
Net debt (Gross debt less Cash) 176 335 402
Total capital 662 853 922
Gross debt to equity 0.46 0.78 0.87
Net debt to equity 0.36 0.65 0.77
Net asset value per share (US cents per share) 32.57 34.42 34.62
In US$’ million, unless stated otherwise
SEGMENTAL PERFORMANCE
Sales volume (MT'000)
Bulk 3,288 2,596 3,088
Consumer Pack 935 1,095 1,109
Total 4,223 3,691 4,197
Operating margin (US$'million)
Bulk 102.5 85.9 70.2
Consumer Pack 31.9 65.1 52.6
Total 134.4 151.0 122.8
Operating margin per MT (US$)
Bulk 31.2 33.1 22.7
Consumer Pack 34.1 59.5 47.4
Total 31.8 40.9 29.3
11ANNUAL REPORT 2018
Sales Volume (MT’000)
OPERATIONS AND FINANCIAL REVIEW
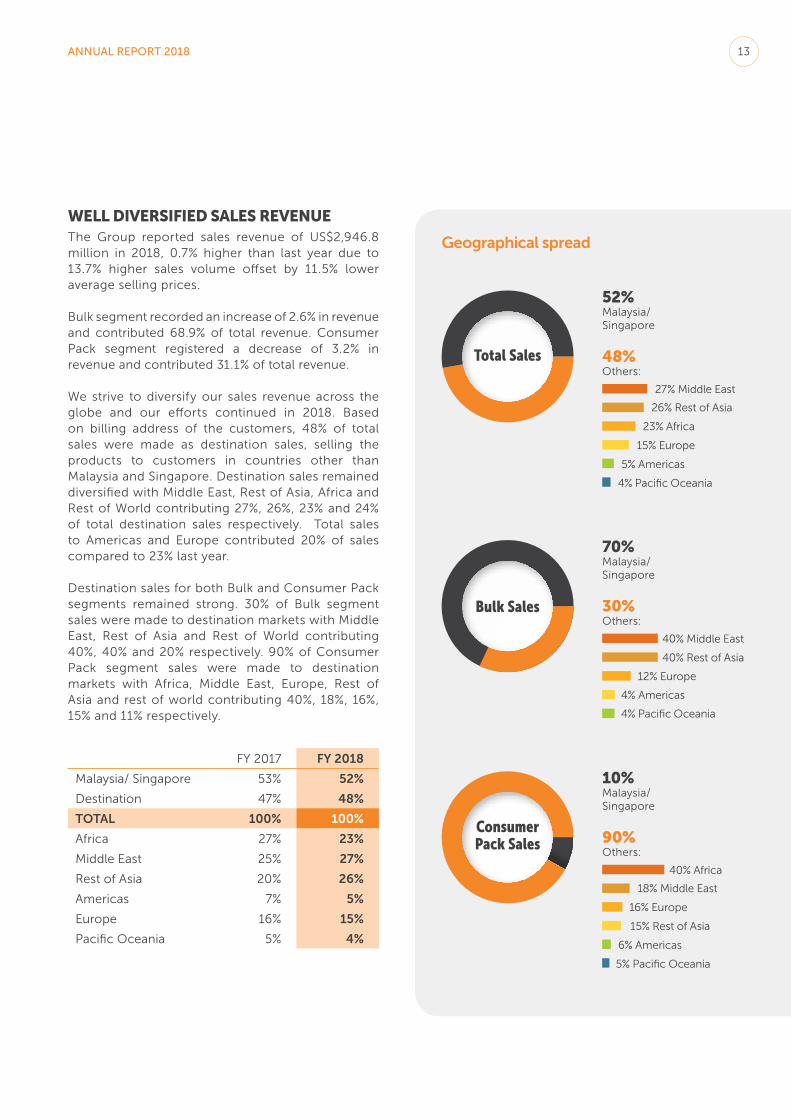
22.1%935
29.7%1,095
26.4%1,109
77.9%3,288
70.3%2,596
73.6%3,088
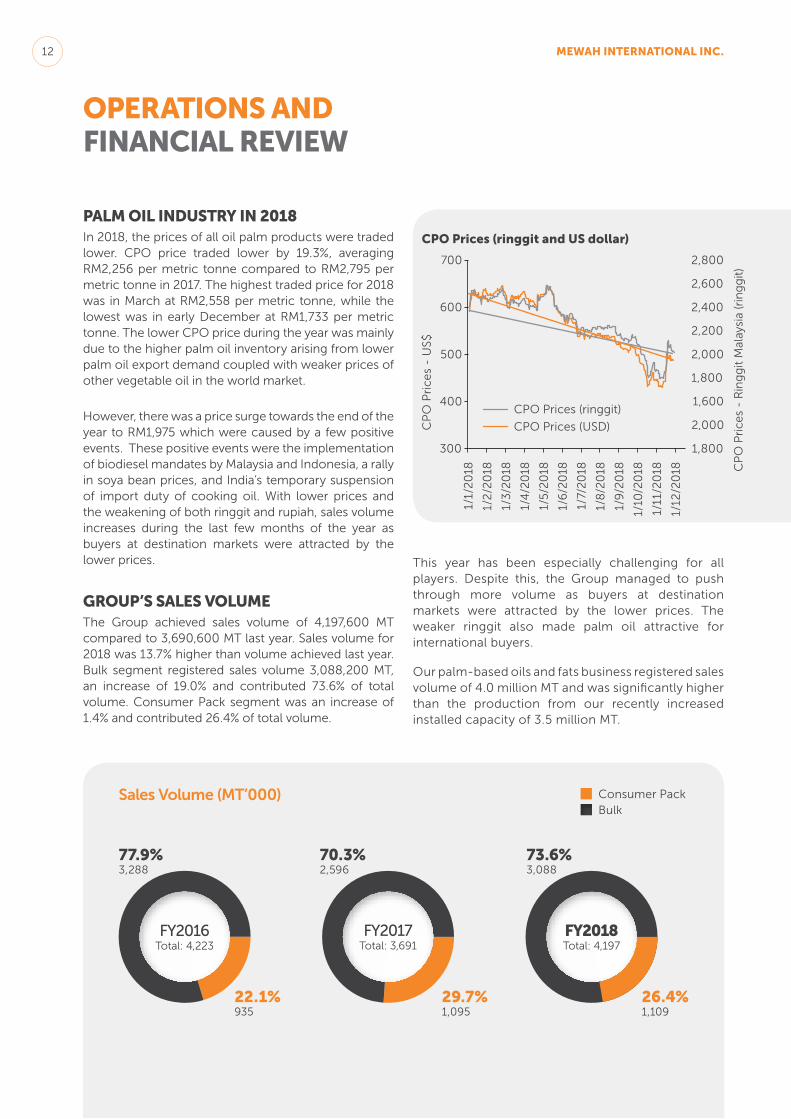
PALM OIL INDUSTRY IN 2018In 2018, the prices of all oil palm products were traded lower. CPO price traded lower by 19.3%, averaging RM2,256 per metric tonne compared to RM2,795 per metric tonne in 2017. The highest traded price for 2018 was in March at RM2,558 per metric tonne, while the lowest was in early December at RM1,733 per metric tonne. The lower CPO price during the year was mainly due to the higher palm oil inventory arising from lower palm oil export demand coupled with weaker prices of other vegetable oil in the world market.
However, there was a price surge towards the end of the year to RM1,975 which were caused by a few positive events. These positive events were the implementation of biodiesel mandates by Malaysia and Indonesia, a rally in soya bean prices, and India’s temporary suspension of import duty of cooking oil. With lower prices and the weakening of both ringgit and rupiah, sales volume increases during the last few months of the year as buyers at destination markets were attracted by the lower prices.
GROUP’S SALES VOLUMEThe Group achieved sales volume of 4,197,600 MT compared to 3,690,600 MT last year. Sales volume for 2018 was 13.7% higher than volume achieved last year. Bulk segment registered sales volume 3,088,200 MT, an increase of 19.0% and contributed 73.6% of total volume. Consumer Pack segment was an increase of 1.4% and contributed 26.4% of total volume.
CPO Prices (ringgit and US dollar)
1/1/
20
18
1/12
/20
18
1/11
/20
18
1/10
/20
18
1/9
/20
18
1/8
/20
18
1/7/
20
18
1/6
/20
18
1/5/
20
18
1/4
/20
18
1/3
/20
18
1/2
/20
18
CP
O P
rice
s -
US$
CP
O P
rice
s -
Rin
gg
it M
alay
sia
(rin
gg
it)
2,800
2,600
2,400
2,200
2,000
1,800
1,600
2,000
1,800300
400
500
600
700
CPO Prices (ringgit)
CPO Prices (USD)
This year has been especially challenging for all players. Despite this, the Group managed to push through more volume as buyers at destination markets were attracted by the lower prices. The weaker ringgit also made palm oil attractive for international buyers.
Our palm-based oils and fats business registered sales volume of 4.0 million MT and was significantly higher than the production from our recently increased installed capacity of 3.5 million MT.
FY2016Total: 4,223
FY2017Total: 3,691
Consumer PackBulk
FY2018Total: 4,197
12 MEWAH INTERNATIONAL INC.
Geographical spread
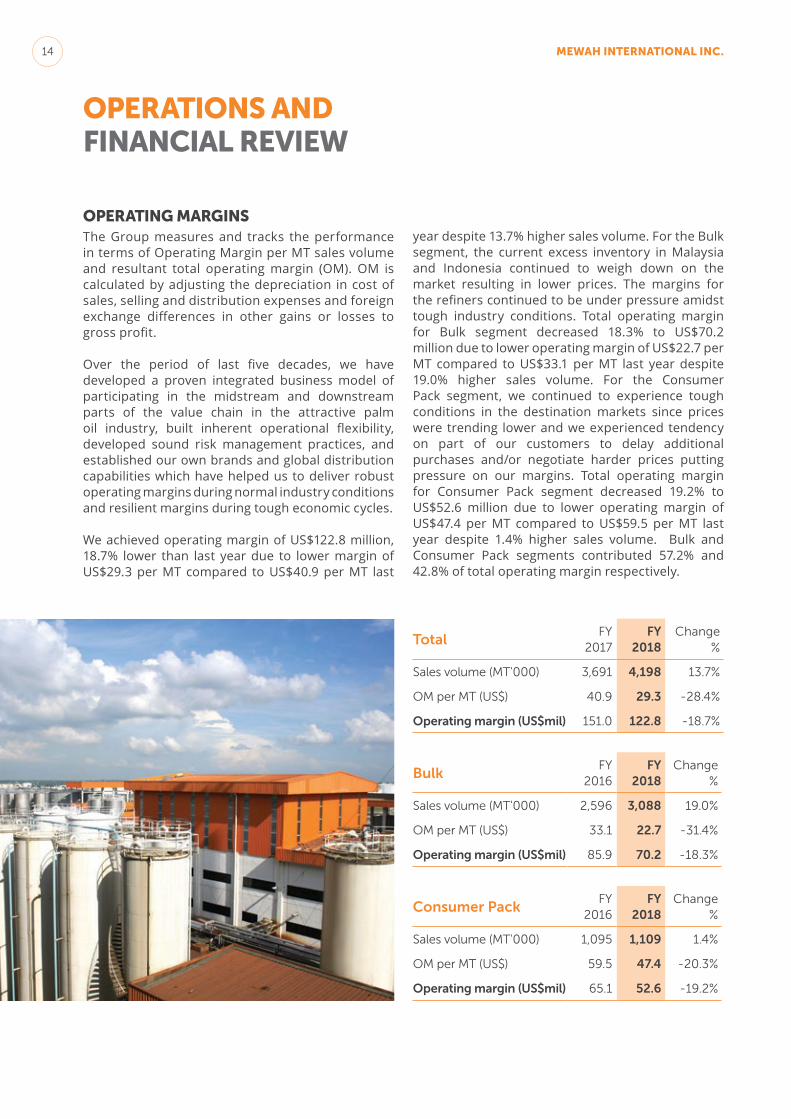
WELL DIVERSIFIED SALES REVENUEThe Group reported sales revenue of US$2,946.8 million in 2018, 0.7% higher than last year due to 13.7% higher sales volume offset by 11.5% lower average selling prices.
Bulk segment recorded an increase of 2.6% in revenue and contributed 68.9% of total revenue. Consumer Pack segment registered a decrease of 3.2% in revenue and contributed 31.1% of total revenue.
We strive to diversify our sales revenue across the globe and our efforts continued in 2018. Based on billing address of the customers, 48% of total sales were made as destination sales, selling the products to customers in countries other than Malaysia and Singapore. Destination sales remained diversified with Middle East, Rest of Asia, Africa and Rest of World contributing 27%, 26%, 23% and 24% of total destination sales respectively. Total sales to Americas and Europe contributed 20% of sales compared to 23% last year.
Destination sales for both Bulk and Consumer Pack segments remained strong. 30% of Bulk segment sales were made to destination markets with Middle East, Rest of Asia and Rest of World contributing 40%, 40% and 20% respectively. 90% of Consumer Pack segment sales were made to destination markets with Africa, Middle East, Europe, Rest of Asia and rest of world contributing 40%, 18%, 16%, 15% and 11% respectively.
52%Malaysia/Singapore
48%Others:
4% Pacific Oceania
4% Pacific Oceania
5% Americas
23% Africa
27% Middle East
26% Rest of Asia
15% Europe
70%Malaysia/Singapore
30%Others:
4% Americas
40% Middle East
40% Rest of Asia
12% Europe
10%Malaysia/Singapore
90%Others:
5% Pacific Oceania
6% Americas
40% Africa
18% Middle East
15% Rest of Asia
16% Europe
FY 2017 FY 2018
Malaysia/ Singapore 53% 52%
Destination 47% 48%
TOTAL 100% 100%
Africa 27% 23%
Middle East 25% 27%
Rest of Asia 20% 26%
Americas 7% 5%
Europe 16% 15%
Pacific Oceania 5% 4%
13ANNUAL REPORT 2018
OPERATIONS AND FINANCIAL REVIEW
OPERATING MARGINSThe Group measures and tracks the performance in terms of Operating Margin per MT sales volume and resultant total operating margin (OM). OM is calculated by adjusting the depreciation in cost of sales, selling and distribution expenses and foreign exchange differences in other gains or losses to gross profit.
Over the period of last five decades, we have developed a proven integrated business model of participating in the midstream and downstream parts of the value chain in the attractive palm oil industry, built inherent operational flexibility, developed sound risk management practices, and established our own brands and global distribution capabilities which have helped us to deliver robust operating margins during normal industry conditions and resilient margins during tough economic cycles.
We achieved operating margin of US$122.8 million, 18.7% lower than last year due to lower margin of US$29.3 per MT compared to US$40.9 per MT last
TotalFY
2017FY
2018Change
%
Sales volume (MT'000) 3,691 4,198 13.7%
OM per MT (US$) 40.9 29.3 -28.4%
Operating margin (US$mil) 151.0 122.8 -18.7%
BulkFY
2016FY
2018Change
%
Sales volume (MT'000) 2,596 3,088 19.0%
OM per MT (US$) 33.1 22.7 -31.4%
Operating margin (US$mil) 85.9 70.2 -18.3%
Consumer PackFY
2016FY
2018Change
%
Sales volume (MT'000) 1,095 1,109 1.4%
OM per MT (US$) 59.5 47.4 -20.3%
Operating margin (US$mil) 65.1 52.6 -19.2%
year despite 13.7% higher sales volume. For the Bulk segment, the current excess inventory in Malaysia and Indonesia continued to weigh down on the market resulting in lower prices. The margins for the refiners continued to be under pressure amidst tough industry conditions. Total operating margin for Bulk segment decreased 18.3% to US$70.2 million due to lower operating margin of US$22.7 per MT compared to US$33.1 per MT last year despite 19.0% higher sales volume. For the Consumer Pack segment, we continued to experience tough conditions in the destination markets since prices were trending lower and we experienced tendency on part of our customers to delay additional purchases and/or negotiate harder prices putting pressure on our margins. Total operating margin for Consumer Pack segment decreased 19.2% to US$52.6 million due to lower operating margin of US$47.4 per MT compared to US$59.5 per MT last year despite 1.4% higher sales volume. Bulk and Consumer Pack segments contributed 57.2% and 42.8% of total operating margin respectively.
14 MEWAH INTERNATIONAL INC.
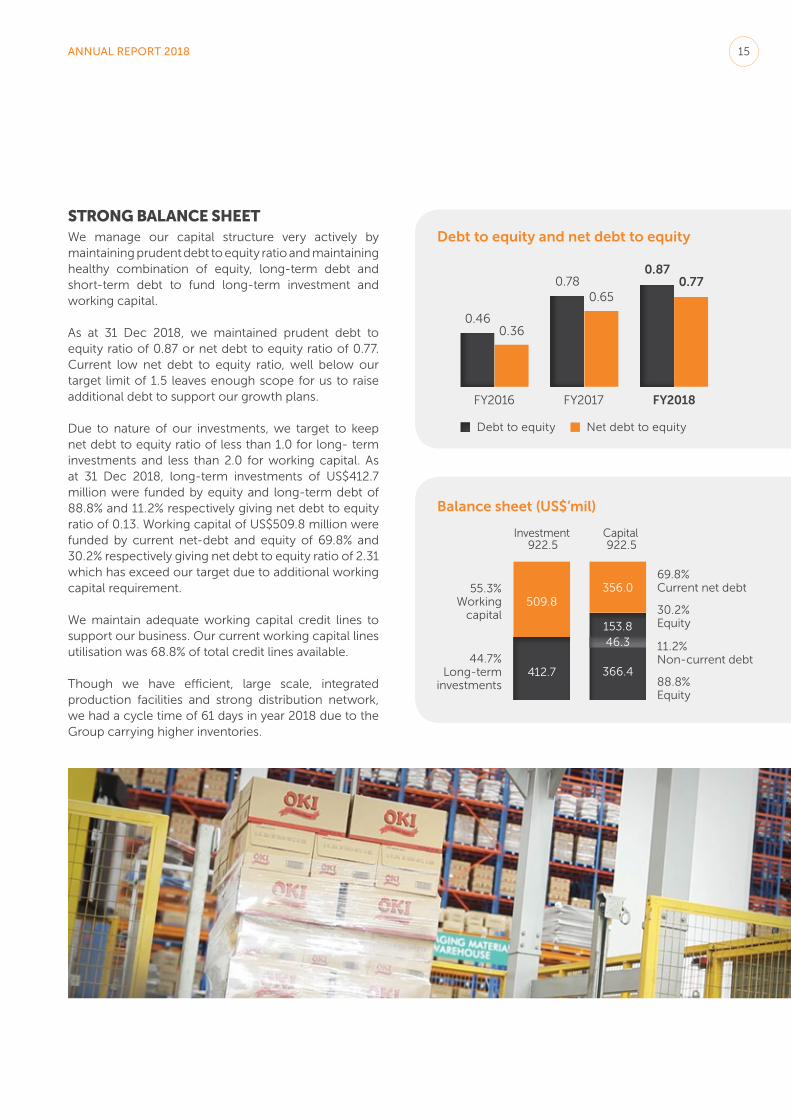
STRONG BALANCE SHEETWe manage our capital structure very actively by maintaining prudent debt to equity ratio and maintaining healthy combination of equity, long-term debt and short-term debt to fund long-term investment and working capital.
As at 31 Dec 2018, we maintained prudent debt to equity ratio of 0.87 or net debt to equity ratio of 0.77. Current low net debt to equity ratio, well below our target limit of 1.5 leaves enough scope for us to raise additional debt to support our growth plans.
Due to nature of our investments, we target to keep net debt to equity ratio of less than 1.0 for long- term investments and less than 2.0 for working capital. As at 31 Dec 2018, long-term investments of US$412.7 million were funded by equity and long-term debt of 88.8% and 11.2% respectively giving net debt to equity ratio of 0.13. Working capital of US$509.8 million were funded by current net-debt and equity of 69.8% and 30.2% respectively giving net debt to equity ratio of 2.31 which has exceed our target due to additional working capital requirement.
We maintain adequate working capital credit lines to support our business. Our current working capital lines utilisation was 68.8% of total credit lines available.
Though we have efficient, large scale, integrated production facilities and strong distribution network, we had a cycle time of 61 days in year 2018 due to the Group carrying higher inventories.
Investment Capital922.5 922.5
55.3%Working
capital
69.8%Current net debt
11.2%Non-current debt
30.2%Equity
88.8%Equity
44.7%Long-term
investments
FY2016 FY2017 FY2018
Debt to equity and net debt to equity
Balance sheet (US$’mil)
0.46
0.870.78
0.36
0.770.65
Debt to equity Net debt to equity
509.8
366.4
46.3153.8
356.0
412.7
15ANNUAL REPORT 2018

DELIVERING SUSTAINABLE
VALUE
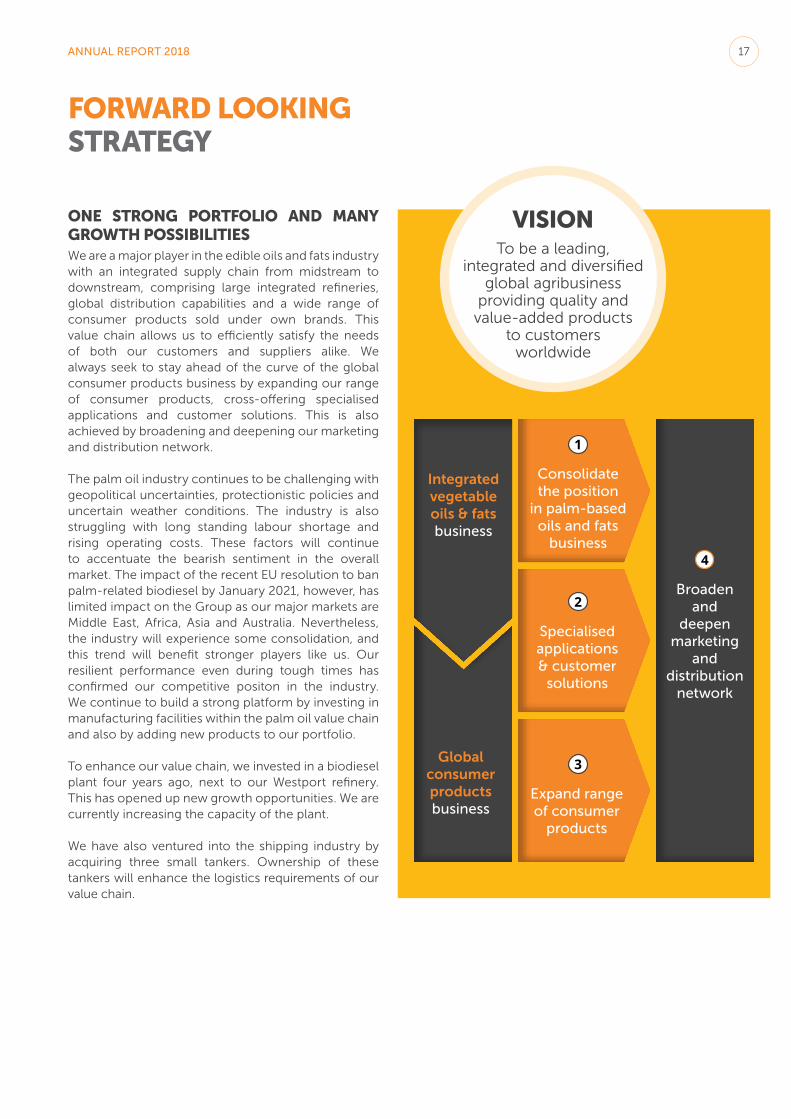
ONE STRONG PORTFOLIO AND MANY GROWTH POSSIBILITIESWe are a major player in the edible oils and fats industry with an integrated supply chain from midstream to downstream, comprising large integrated refineries, global distribution capabilities and a wide range of consumer products sold under own brands. This value chain allows us to efficiently satisfy the needs of both our customers and suppliers alike. We always seek to stay ahead of the curve of the global consumer products business by expanding our range of consumer products, cross-offering specialised applications and customer solutions. This is also achieved by broadening and deepening our marketing and distribution network.
The palm oil industry continues to be challenging with geopolitical uncertainties, protectionistic policies and uncertain weather conditions. The industry is also struggling with long standing labour shortage and rising operating costs. These factors will continue to accentuate the bearish sentiment in the overall market. The impact of the recent EU resolution to ban palm-related biodiesel by January 2021, however, has limited impact on the Group as our major markets are Middle East, Africa, Asia and Australia. Nevertheless, the industry will experience some consolidation, and this trend will benefit stronger players like us. Our resilient performance even during tough times has confirmed our competitive positon in the industry. We continue to build a strong platform by investing in manufacturing facilities within the palm oil value chain and also by adding new products to our portfolio.
To enhance our value chain, we invested in a biodiesel plant four years ago, next to our Westport refinery. This has opened up new growth opportunities. We are currently increasing the capacity of the plant.
We have also ventured into the shipping industry by acquiring three small tankers. Ownership of these tankers will enhance the logistics requirements of our value chain.
FORWARD LOOKING STRATEGY
To be a leading, integrated and diversified
global agribusiness providing quality and value-added products
to customers worldwide
VISION
Consolidate the position
in palm-based oils and fats
business
Specialised applications & customer
solutions
Expand range of consumer
products
Integrated vegetable oils & fats business
Global consumer products business
Broaden and
deepen marketing
and distribution
network
4
1
2
3
17ANNUAL REPORT 2018

Five years ago, we completed the installation of a manufacturing facility in Malaysia to produce dairy products. It has provided significant marketing and distribution synergies with our current Consumer Pack segment. We plan to add more flexibility to our packing lines and add more dairy based products. Last year, we installed a can-making facility in order to supply the packaging for our sweetened condensed and evaporated milk products.
We continue to develop our distribution businesses with an objective that the platform will be robust and dynamic enough to cater to the expected increase in volume and the active markets activity which we are selling into.
We continue to explore more consumer products that can be sold as a basket of products to our existing and prospective customers. We have added rice to our product portfolio, including Basmati rice. We source from Asia and sell to Africa and Middle East under our own brands. Working closely with the customers, we continue to develop and offer specialised applications and customer solutions for different industries such as confectionaries, bakeries, food ingredients and the infant nutrition businesses. Investing in brands remains of paramount importance to us.
We continue to make efforts to improve our customer reach across the globe by partnering with local players and increasing our own presence in key geographies. We have also set up subsidiaries for local distribution in various locations in Africa & USA.
18 MEWAH INTERNATIONAL INC.
RESEARCH & DEVELOPMENT
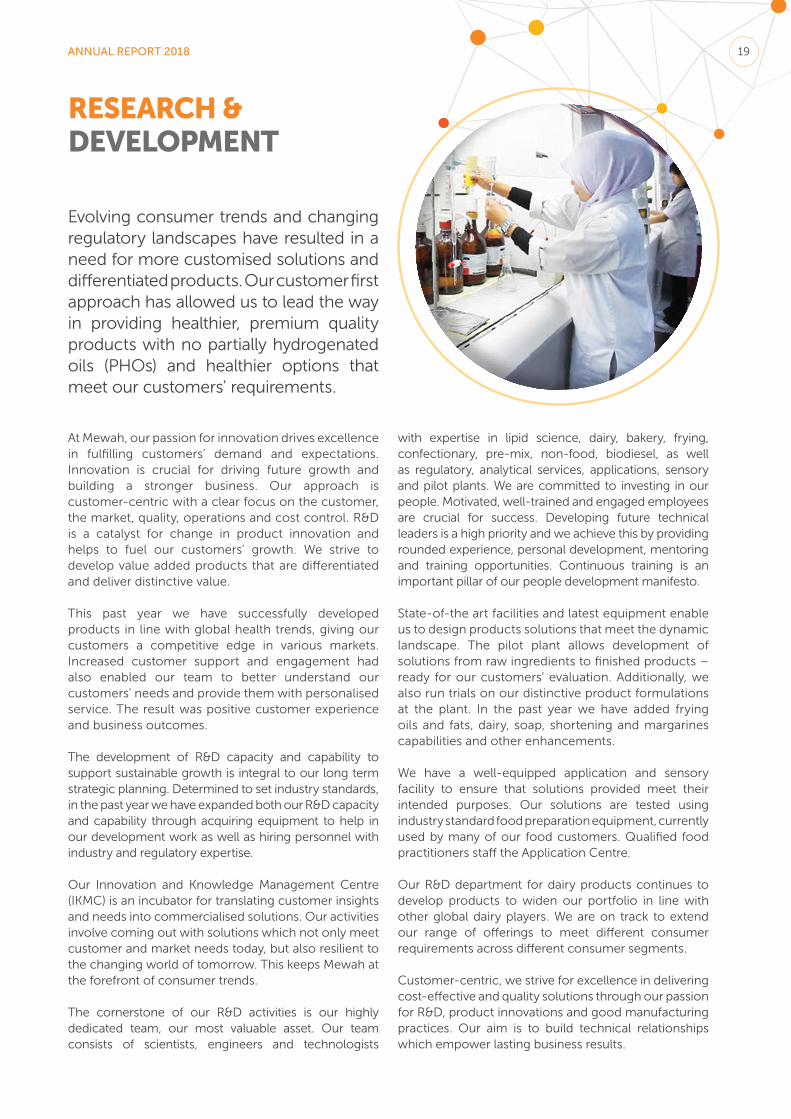
Evolving consumer trends and changing regulatory landscapes have resulted in a need for more customised solutions and differentiated products. Our customer first approach has allowed us to lead the way in providing healthier, premium quality products with no partially hydrogenated oils (PHOs) and healthier options that meet our customers’ requirements.
At Mewah, our passion for innovation drives excellence in fulfilling customers’ demand and expectations. Innovation is crucial for driving future growth and building a stronger business. Our approach is customer-centric with a clear focus on the customer, the market, quality, operations and cost control. R&D is a catalyst for change in product innovation and helps to fuel our customers’ growth. We strive to develop value added products that are differentiated and deliver distinctive value.
This past year we have successfully developed products in line with global health trends, giving our customers a competitive edge in various markets. Increased customer support and engagement had also enabled our team to better understand our customers’ needs and provide them with personalised service. The result was positive customer experience and business outcomes.
The development of R&D capacity and capability to support sustainable growth is integral to our long term strategic planning. Determined to set industry standards, in the past year we have expanded both our R&D capacity and capability through acquiring equipment to help in our development work as well as hiring personnel with industry and regulatory expertise.
Our Innovation and Knowledge Management Centre (IKMC) is an incubator for translating customer insights and needs into commercialised solutions. Our activities involve coming out with solutions which not only meet customer and market needs today, but also resilient to the changing world of tomorrow. This keeps Mewah at the forefront of consumer trends.
The cornerstone of our R&D activities is our highly dedicated team, our most valuable asset. Our team consists of scientists, engineers and technologists
with expertise in lipid science, dairy, bakery, frying, confectionary, pre-mix, non-food, biodiesel, as well as regulatory, analytical services, applications, sensory and pilot plants. We are committed to investing in our people. Motivated, well-trained and engaged employees are crucial for success. Developing future technical leaders is a high priority and we achieve this by providing rounded experience, personal development, mentoring and training opportunities. Continuous training is an important pillar of our people development manifesto.
State-of-the art facilities and latest equipment enable us to design products solutions that meet the dynamic landscape. The pilot plant allows development of solutions from raw ingredients to finished products – ready for our customers’ evaluation. Additionally, we also run trials on our distinctive product formulations at the plant. In the past year we have added frying oils and fats, dairy, soap, shortening and margarines capabilities and other enhancements.
We have a well-equipped application and sensory facility to ensure that solutions provided meet their intended purposes. Our solutions are tested using industry standard food preparation equipment, currently used by many of our food customers. Qualified food practitioners staff the Application Centre.
Our R&D department for dairy products continues to develop products to widen our portfolio in line with other global dairy players. We are on track to extend our range of offerings to meet different consumer requirements across different consumer segments.
Customer-centric, we strive for excellence in delivering cost-effective and quality solutions through our passion for R&D, product innovations and good manufacturing practices. Our aim is to build technical relationships which empower lasting business results.
19ANNUAL REPORT 2018
RISK MANAGEMENT
Our system comprises of processes and policies designed to address risks such as commodity prices, foreign currency exchange rates, interest rates, counterparties’ credit and liquidity.
As a result of our Group’s global operating and financing activities, we are exposed to various types of market risks, including fluctuations in agricultural commodity prices, foreign currency exchange rates, interest rates, counterparty credit and liquidity risk. We use certain financial instruments to hedge the risk of commercial exposures and we do not hold such financial instruments for speculative purposes. These market risk management activities are governed by our risk management system that is designed to identify, quantify, monitor and manage various risks encountered in our operations and minimise the adverse effects from the unpredictability of financial market risks on our financial performance.
Our system comprises of processes and policies designed to address risks such as commodity prices, foreign currency exchange rates, interest rates, counterparties’ credit and liquidity. Our risk management system is based on the following main principles:
RISK GOVERNANCE STRUCTUREThe on-going compliance of these risk management processes and policies are carried out by the heads of the respective operating units. Our risk governance structure consists of a team of employees led by our Executive Director, Ms Wong Lai Wan in the Risk Department of our Singapore office, who is responsible for monitoring and improving the overall effectiveness of our risk management system, the review and setting of trade positions and limits to manage our overall risk exposure. The Risk Department monitors and assesses risks on a regular basis and holds periodical meetings with our marketing and operations teams. The Risk Department has the authority to make temporary increases or changes to risk limits but such increases or changes must at all times remain within our overall risk management guidelines and framework of the Group.
Where the execution of any activity will result in the breach of any applicable limits in our risk management guidelines and framework, specific approval for that activity must be sought, and obtained from the Executive Risk Management Team prior to the execution of the activity. Any risk-related issues which are outside the scope of our risk management guidelines and framework are reported to the committee consisting of our Executive Directors, Dr Cheo Tong Choon @ Lee Tong Choon, Ms Michelle Cheo Hui Ning, Ms Bianca Cheo Hui Hsin, Ms Wong Lai Wan and our Chief Financial Officer, Mr James Soo (the “Executive Risk Management Team”).
SETTING OF RISK LIMITSThe Executive Risk Management Team establishes and reviews periodically our overall risk tolerance thresholds, measured in terms of Value-At-Risk (“VAR”). The team is responsible for overall systems, procedures and processes for risk management including derivatives trading. Such risk tolerance threshold is based on a percentage of total shareholders’ funds, and/or the budgeted annual operating profit, after taking into account, among other things, the Executive Risk Management Team’s view on the overall production capacity of refining and processing operations and the market in which trading activities take place, the price (and price trend) of raw materials, the track record of management in managing its risk exposures in the prior period, and the financial budgets including projected sales volume and turnover. The risk tolerance threshold is also based on the counterparty’s background, financial performance
20 MEWAH INTERNATIONAL INC.

and management team. The risk tolerance threshold refers to the maximum potential loss if all trading and operations across all products and geographical regions materialise at the same time. Such threshold limits are approved and reviewed by Audit Committee.
REPORTING AND REVIEWING STRUCTUREOur Risk Department is responsible for the capture and measurement of Group-wide risk and ensuring compliance with our risk management system, procedures and processes. The Risk Department analyses and reviews our daily risk exposure with oversight from the Executive Risk Management Team. Any changes to our risk management system, standards, practices, policies and risk appetite require the approval of our Board. With respect to risks related to the use of derivative financial instruments, once limits for derivatives positions have been established by our Executive Risk Management Team, our Risk Department monitors our trading activities to ensure compliance with these limits. If additional exposure is required, the trading department approaches the Risk Department to approve an increase in the limits.
On a case-by-case basis, the Risk Department makes a recommendation to the Executive Risk Management
Team to change established limits. If approved by the Executive Risk Management Team, the revised limits implemented and monitored by the Risk Department. Any breach (whether of trading limits or non-adherence to established policies), disclosed or revealed by the Risk Department, will be acted upon by the Executive Risk Management Team. Where the Executive Risk Management Team considers the breach to be significant (whether in terms of financial impact or otherwise), the Executive Risk Management Team will report the breach to the Board.
Our Internal Audit Department reviews our internal control systems regularly on an annual basis to ensure compliance with the risk management system and internal control procedures of the Company. Any material findings such as breaches of trading limits or non-adherence to established risk management policies will be reported to our Audit Committee as and when they arise. Our Audit Committee regularly reviews our internal control systems, internal audit reports and risk tolerance threshold limits. The Company also engages external professionals from time to time to review and improve on our internal control systems.
21ANNUAL REPORT 2018
CORPORATE SOCIAL RESPONSIBILITY & SUSTAINABILITY
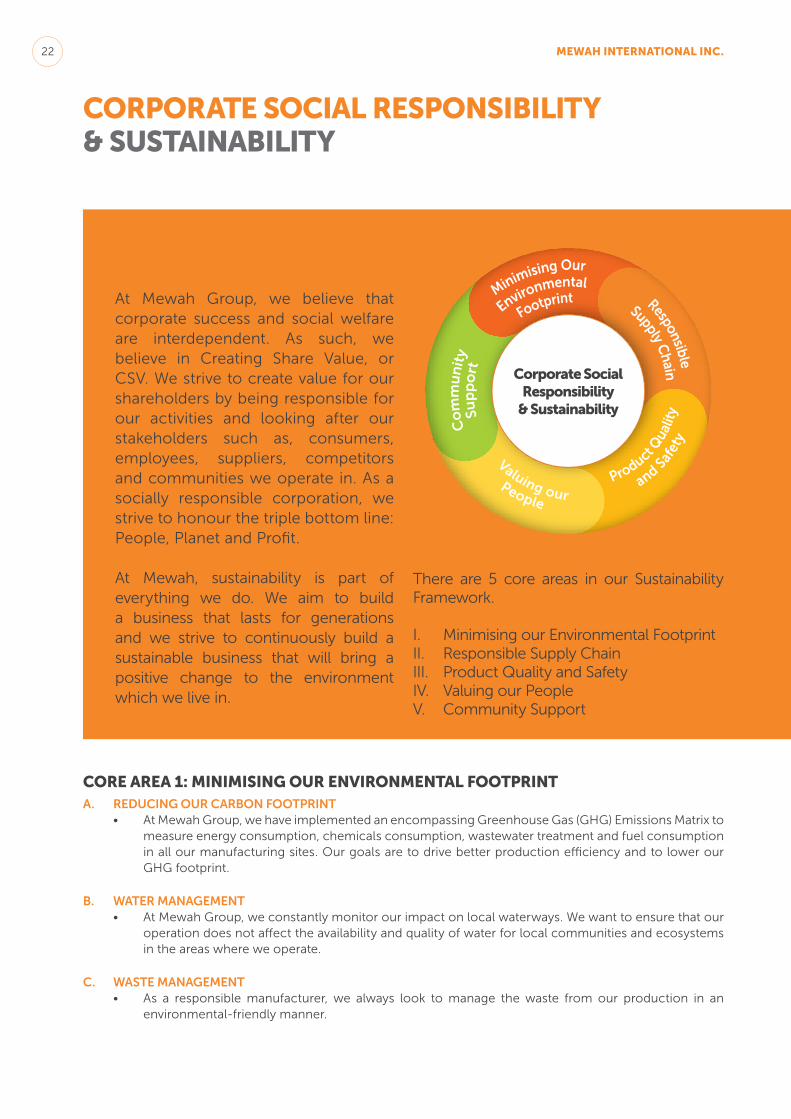
There are 5 core areas in our Sustainability Framework.
I. Minimising our Environmental FootprintII. Responsible Supply ChainIII. Product Quality and Safety IV. Valuing our People V. Community Support
CORE AREA 1: MINIMISING OUR ENVIRONMENTAL FOOTPRINTA. REDUCING OUR CARBON FOOTPRINT
• At Mewah Group, we have implemented an encompassing Greenhouse Gas (GHG) Emissions Matrix to measure energy consumption, chemicals consumption, wastewater treatment and fuel consumption in all our manufacturing sites. Our goals are to drive better production efficiency and to lower our GHG footprint.
B. WATER MANAGEMENT• At Mewah Group, we constantly monitor our impact on local waterways. We want to ensure that our
operation does not affect the availability and quality of water for local communities and ecosystems in the areas where we operate.
C. WASTE MANAGEMENT• As a responsible manufacturer, we always look to manage the waste from our production in an
environmental-friendly manner.
At Mewah Group, we believe that corporate success and social welfare are interdependent. As such, we believe in Creating Share Value, or CSV. We strive to create value for our shareholders by being responsible for our activities and looking after our stakeholders such as, consumers, employees, suppliers, competitors and communities we operate in. As a socially responsible corporation, we strive to honour the triple bottom line: People, Planet and Profit.
At Mewah, sustainability is part of everything we do. We aim to build a business that lasts for generations and we strive to continuously build a sustainable business that will bring a positive change to the environment which we live in.
Corporate Social Responsibility
& Sustainability
22 MEWAH INTERNATIONAL INC.
• Our action plan to assure sustainable waste management includes:i. Regular assessment of waste-related impacts and risks across all direct operations and
supply chain.
ii. Continue to identify the 4R’ components in managing waste:a. Reduce – Focus to improve efficiency. To establish practices that are capable to reduce the
amount of waste we generate to help the environment.
b. Reuse – Practice to reuse materials without change whether for the original or a different application instead of throwing them away, or pass those unused materials on to others who could use them.
c. Recover – To set up ways to recover the energy values contained within the waste material.
d. Recycle – Many of the things we use every day can be recycled. Recycled items are put through a process that makes it possible to create new products out of the materials from the old ones.
CORE AREA 2: RESPONSIBLE SUPPLY CHAINA. SUSTAINABLE PALM OIL POLICY
• Oil palm has the highest oil output for the least amount of land area than any other vegetable oil. It is also the most widely used vegetable oil in the world. The oil palm industry employs many people and creates opportunity to bring many communities out of poverty. However, this opportunity comes with the responsibility to address the known risks associated in the palm oil supply chain.
• Our sustainable Palm Oil policy is a multi-stakeholder approach which seeks:1. To build a traceable and transparent supply chain.2. To continue the journey of no deforestation and to commit no burning, protection of high
conservation value (HCV) areas and high carbon stock (HCS) areas. 3. To reject new oil palm development in forested peatland plantation after May 2015. 4. To respect human rights and ensure protection of the rights of all workers. 5. To respect the rights of indigenous people and local communities to give or withhold Free, Prior,
and Informed Consent (FPIC) where oil palm development takes place.
B. TOWARDS FULL TRACEABILITY• Mewah Group has developed a Traceable Palm Oil Framework to trace the origin of our palm oil.
At the initial stage, we review each of our suppliers through desktop assessment and in-house risk profiling analysis, with the traceability process developing well; we are progressing fast to the next step of assessing the suppliers’ practices. Based on the outcome from our risk analysis, we will perform the site assessment of the suppliers’ mills based on the general principle & criteria, procedures and questionnaires that are in line with industrial standards.
• For every ton of palm oil and palm kernel oil received into our refineries, we need to know the source of this oil. Traceability is useful because the information can be utilised to evaluate our suppliers’ performance against our Sustainable Palm Oil policy, and to engage with our supply base to bridge the gap between us and our suppliers.
23ANNUAL REPORT 2018

1. Traceability to Mill Approach• Today, transparency and accountability are critical aspects of sustainability. It is extremely
crucial that companies are capable of tracing the palm oil they use back to the origin.
• We started tracing back our direct suppliers (palm oil mills) since year 2015. There are 5 key components in our traceability to mill approach:i. Parent Company Name of Mill Partyii. Mill Name iii. Mill Address iv. GPS Coordinates of Mill Party v. Volumes of CPO receive into our refinery
2. Traceability to Plantation Approach• The definition of traceable to plantation, or fresh fruit bunch (FFB) traceability, is a subject of
considerable debate. This is because there is still no common consensus on the definition of traceable to plantation in the industry today.
• The Mewah’s current approach on traceability to plantations establishes on ensuring the availability & validity of Malaysia Palm Oil Board (MPOB) and volumes of FFB supply to the supplied mills.
C. SUPPLIER ENGAGEMENT PROGRAM• We hold training and engagement dialogue sessions with our suppliers as well as periodic audits
to evaluate and ensure compliance to our Sustainable Palm Oil Policy. The supplier engagement program also provides us the opportunity to socialise our Sustainable Palm Oil Policy with our direct suppliers, providing them with a platform to discuss the implications and requirement of adopting similar policies.
• In year 2018, we have successfully gathered more than 45 participants from a number of key suppliers
group from palm oil mills and kernel crushers for the annual Supplier Engagement Workshop on “Labour & Human Rights” in our refinery, Mewah-Oils Sdn Bhd.
D. GRIEVANCE PROCEDURE• As part of our Sustainability Sourcing Guide, the grievance procedure set the guideline on how
grievances raised by the stakeholders in our supply chain will be handled by us.
• We started the Grievance Procedure on our Sustainability Dashboard since June 2016. This procedure serves as a platform for all stakeholders in our supply chain to address concerns or to report complaints that can be found in Mewah Sustainability Dashboard. The Grievance Procedure is to ensure that we are responsive to grievances from external parties. This includes any individuals, government organizations, NGOs or media outlets with concerns related to the implementation of Mewah’s Sustainable Palm Oil Policy.
Traceability to Plantation
Volume FFB Supplied
Availability of MPOB License
Validy of MPOB License
Estate/Plantation
Smallholders
Dealers
CORPORATE SOCIAL RESPONSIBILITY & SUSTAINABILITY
24 MEWAH INTERNATIONAL INC.
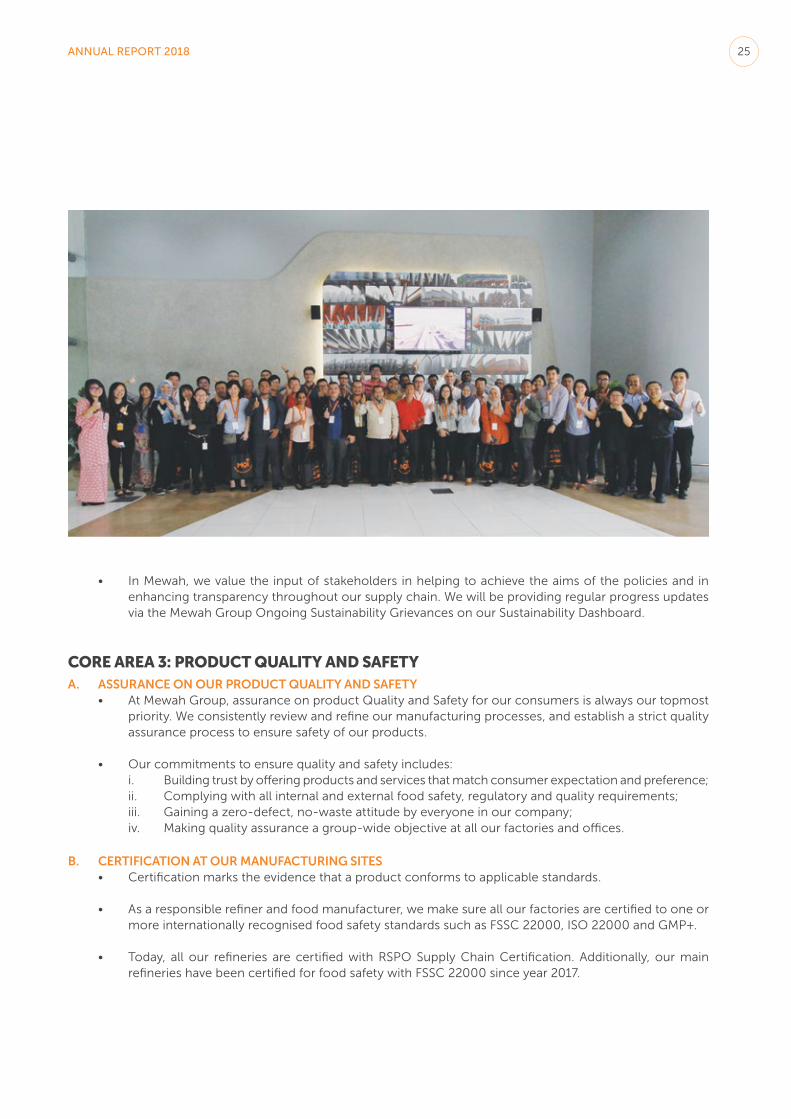
• In Mewah, we value the input of stakeholders in helping to achieve the aims of the policies and in enhancing transparency throughout our supply chain. We will be providing regular progress updates via the Mewah Group Ongoing Sustainability Grievances on our Sustainability Dashboard.
CORE AREA 3: PRODUCT QUALITY AND SAFETYA. ASSURANCE ON OUR PRODUCT QUALITY AND SAFETY
• At Mewah Group, assurance on product Quality and Safety for our consumers is always our topmost priority. We consistently review and refine our manufacturing processes, and establish a strict quality assurance process to ensure safety of our products.
• Our commitments to ensure quality and safety includes: i. Building trust by offering products and services that match consumer expectation and preference; ii. Complying with all internal and external food safety, regulatory and quality requirements; iii. Gaining a zero-defect, no-waste attitude by everyone in our company; iv. Making quality assurance a group-wide objective at all our factories and offices.
B. CERTIFICATION AT OUR MANUFACTURING SITES• Certification marks the evidence that a product conforms to applicable standards.
• As a responsible refiner and food manufacturer, we make sure all our factories are certified to one or more internationally recognised food safety standards such as FSSC 22000, ISO 22000 and GMP+.
• Today, all our refineries are certified with RSPO Supply Chain Certification. Additionally, our main refineries have been certified for food safety with FSSC 22000 since year 2017.
25ANNUAL REPORT 2018
CORPORATE SOCIAL RESPONSIBILITY & SUSTAINABILITY
CORE AREA 4: VALUING OUR PEOPLEAt Mewah Group, we believe that people and businesses achieve the greatest impact in sustainable development when they join forces and invest in each other.
A. HUMAN CAPITAL – TALENT MANAGEMENT We are committed to recruit, employ and promote employees on the sole basis of the qualifications and abilities needed for the work to be performed.
The Group recognises that one of the cornerstones of its success is our employees and we believe in investing in our people. We believe that having a highly motivated, well trained and involved set of employees is crucial to the enduring success of our corporation. To this end, we will ensure that our employees are developed to their fullest potential and talent, and their competency are fully recognised and rewarded. Department heads, who are also their mentors, will continuously assess and evaluate their subordinates to ensure that there is a structured career development in accordance with their potential, talent and competency.
We will continue to attract, motivate and retain our talented employees at all levels by providing them with job security and growth opportunities. We strive to provide all employees with career and personal development opportunities and to promote a continuous learning through training and development, job rotations and overseas assignments. We continuously recruit fresh graduates from reputable universities worldwide to be part of our team. Potential leaders will undergo a comprehensive, 2-year Leadership Training Programme to prepare them to take on challenging roles within the Group.
It is our view that an all-rounder workforce is essential for motivation and endurance. Aside from providing job satisfaction, we encourage our employees to have a balanced work life by organizing and promoting social activities.
B. FAIR EMPLOYMENT PRACTICESWe believe in providing equal opportunities and follow fair employment practices. The Group recognises the value of its employees and long term retention as key to the success of the business. The Group aims to attract and retain skilled employees by giving them job security. On a side note, all our main refineries are the members of Sedex and all have passed the ethical Sedex SMETA audit. Sedex (Supplier Ethical Data Exchange) was founded in 2001 by a group of UK retailers to drive convergence in social audit standards and monitoring. It is a not-for-profit membership organization for business committed to the continuous improvement of ethical performance within their supply chain.
C. WORKPLACE HEALTH AND SAFETYThe Group aims to provide each employee with a safe place to work. All group locations are required to abide by local health and safety regulations. We conduct regular work risk assessments, vigorously taking action to address any identified risks by setting up protective guidance, employing the usage of personal protective equipment, embarking on work sites audits and inspections, as well as regular reviews and controls of safety risks. We strive to achieve zero loss work day due to work place accidents.
All our refineries have adopted the latest OHSAS (International Occupational Health and Safety Management System) guideline with the objective to build a demonstrably sound occupational health and safety workplace. Mewaholeo Industries Sdn Bhd was the first company under Mewah Group to be certified with OHSAS 18001 in February 2010. All our refineries have the quality management system IS0 9001, ISO 14001 and HACCP in place.
26 MEWAH INTERNATIONAL INC.

Mewah’s CSR committee present the donations to Rumah Amal Soleh and Solehah (RASS)
CORE AREA 5: COMMUNITY SUPPORTAt Mewah Group, we realise that it is important to proactively engaging with the community which we operate in. Contributing to, and being part of, the community in which Mewah operates is essential for maintaining a positive relationship with our neighbors. We find regular engagement is very effective for keeping pulse on what is happening on the ground and what concerns and priorities our stakeholders have.
At every place that we operate, Mewah partners with the local communities to support the particular needs of the community. We contribute regularly to local charities. Our people organise and participate in social events to support and bring joy to the less fortunate in our nearby community. Our goal is to enrich the lives of the people around the touchpoints that we have established.
There are three (3) major objectives that we have set for our CSR programs:
A. SUPPORTING OUR CHILDRENWe believe that every child deserves a chance at a life filled with love, laughter, friends and family.
B. ACTIVE VOLUNTEERISM OF OUR EMPLOYEESWe encourage our staff to volunteer and give back to the community. Therefore we hold companywide community volunteer events so that the majority of our staff can find it easier to give back to community.
C. DISASTER RELIEFWe wish to support the communities that we operate in. One of the most important initiatives is to help our neighbours in their time of need. When there are natural disasters in our neighbourhood, we raise money and donate other necessities to support victims of natural disasters.
In 2018, our volunteers from Mewaholeo Industries made regular visitations to the Sherun Old Folks Home & Handicap Center to donate groceries items and essential food items with the aim of easing its daily operating expenses.
In 2018, our people from Mewah Datu Sdn Bhd spent some quality time with children from the RASS orphanage and contributed to general maintenance of the orphanage such as tree trimming and fence painting. In addition, we made regular donations to the orphanage with the aim of bringing positive changes for the children.
CSR Program: Contribution for Rumah Amal Soleh Solehan (RASS) in Lahad Datu, Sabah
CSR Program: Donation toward Sherun Old Folks Home & Handicap Center in Skudai, Johor
Sherun Old Folks Home & Handicap Center’s elderly together with the donors of groceries and needed items.
27ANNUAL REPORT 2018
CORPORATEINFORMATION
BOARD OF DIRECTORSEXECUTIVE DIRECTORS
Dr Cheo Tong Choon @ Lee Tong Choon (Chairman)Ms Michelle Cheo Hui NingMs Bianca Cheo Hui HsinMs Wong Lai Wan
INDEPENDENT DIRECTORS
Dr Foo Say Mui (Bill) (Lead Independent Director)Mr Robert Loke Tan ChengTan Sri Datuk Dr Ong Soon HockDatuk Dr Fawzia Binti Abdullah
AUDIT COMMITTEEMr Robert Loke Tan Cheng (Chairman)Tan Sri Datuk Dr Ong Soon Hock Datuk Dr Fawzia Binti Abdullah
NOMINATING COMMITTEEDr Foo Say Mui (Bill) (Chairman)Mr Robert Loke Tan ChengDr Cheo Tong Choon @ Lee Tong ChoonTan Sri Datuk Dr Ong Soon HockDatuk Dr Fawzia Binti Abdullah
REMUNERATION COMMITTEEDr Foo Say Mui (Bill) (Chairman)Mr Robert Loke Tan ChengTan Sri Datuk Dr Ong Soon Hock
SENIOR MANAGEMENTDr Cheo Tong Choon @ Lee Tong ChoonMs Michelle Cheo Hui NingMs Bianca Cheo Hui HsinMr James Soo Weng FattMr Shyam KumbhatMs Wong Lai WanMs Agnes Lim Siew Choo
COMPANY SECRETARYMr Abdul Jabbar Bin Karam Din, LLB
COMPANY REGISTRATION NUMBERCR-166055
REGISTERED OFFICEHarbour Place, 2nd Floor103 South Church StreetP.O. Box 472George TownGrand Cayman, KY1-1106Cayman Islands
PRINCIPAL PLACE OF BUSINESS5 International Business Park#05-00 Mewah BuildingSingapore 609914
CAYMAN ISLANDS SHARE REGISTRARInternational Corporation Services Ltd.Harbour Place, 2nd Floor103 South Church StreetP.O. Box 472, George TownGrand Cayman KY1-1106Cayman Islands
SINGAPORE SHARE TRANSFER AGENTBoardroom Corporate & Advisory Services Pte. Ltd.50 Raffles Place #32-01Singapore Land TowerSingapore 048623
AUDITORSPricewaterhouseCoopers LLP7 Straits ViewMarina OneEast Tower, Level 12Singapore 018936Partner-in-charge: Ms Tan Bee Nah(Effective from the financial year ended 31 December 2015)
PRINCIPAL BANKERS
Alliance BankAmBankArab Bank CorporationBangkok BankBank of ChinaBank MandiriCTBC BankCIMB BankDBS BankDeutsche BankExim Bank MalaysiaICICI BankOCBC BankRHB BankUnited Overseas Bank
28 MEWAH INTERNATIONAL INC.
ANNUAL REPORT 2018 29
CORPORATE GOVERNANCE
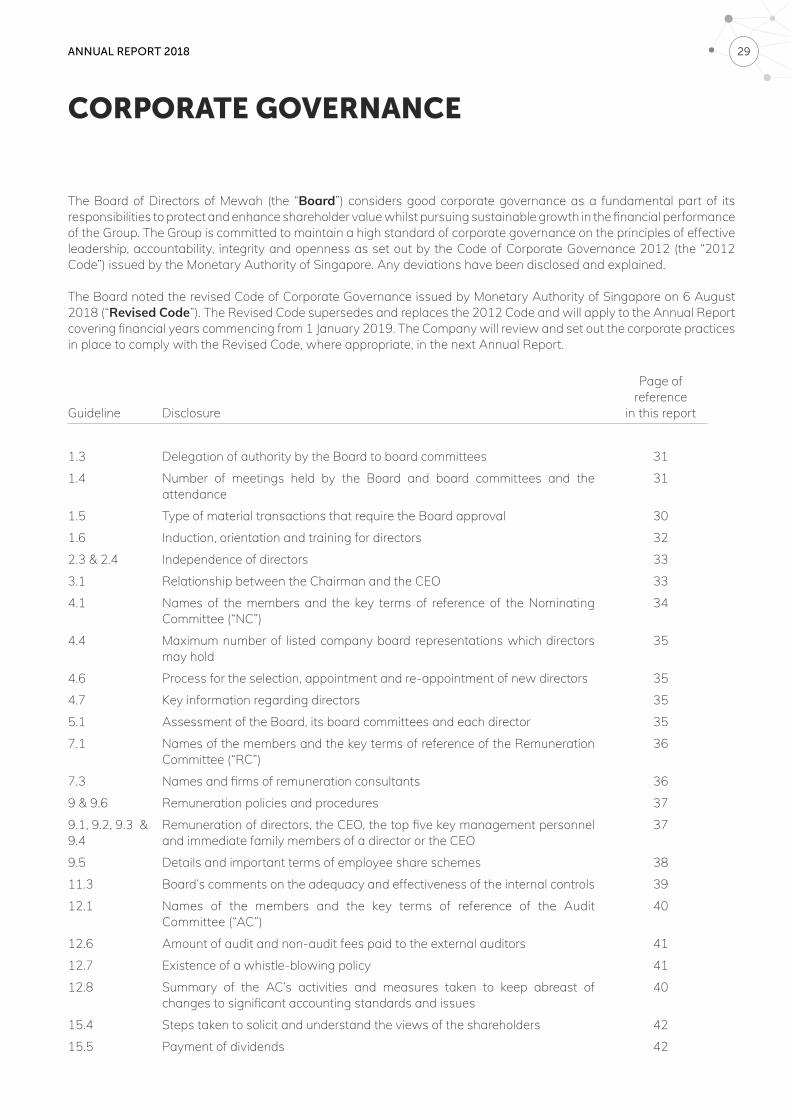
The Board of Directors of Mewah (the “Board”) considers good corporate governance as a fundamental part of its responsibilities to protect and enhance shareholder value whilst pursuing sustainable growth in the financial performance of the Group. The Group is committed to maintain a high standard of corporate governance on the principles of effective leadership, accountability, integrity and openness as set out by the Code of Corporate Governance 2012 (the “2012 Code”) issued by the Monetary Authority of Singapore. Any deviations have been disclosed and explained.
The Board noted the revised Code of Corporate Governance issued by Monetary Authority of Singapore on 6 August 2018 (“Revised Code”). The Revised Code supersedes and replaces the 2012 Code and will apply to the Annual Report covering financial years commencing from 1 January 2019. The Company will review and set out the corporate practices in place to comply with the Revised Code, where appropriate, in the next Annual Report.
Guideline Disclosure
Page of reference
in this report
1.3 Delegation of authority by the Board to board committees 31
1.4 Number of meetings held by the Board and board committees and the attendance
31
1.5 Type of material transactions that require the Board approval 30
1.6 Induction, orientation and training for directors 32
2.3 & 2.4 Independence of directors 33
3.1 Relationship between the Chairman and the CEO 33
4.1 Names of the members and the key terms of reference of the Nominating Committee (“NC”)
34
4.4 Maximum number of listed company board representations which directors may hold
35
4.6 Process for the selection, appointment and re-appointment of new directors 35
4.7 Key information regarding directors 35
5.1 Assessment of the Board, its board committees and each director 35
7.1 Names of the members and the key terms of reference of the Remuneration Committee (“RC”)
36
7.3 Names and firms of remuneration consultants 36
9 & 9.6 Remuneration policies and procedures 37
9.1, 9.2, 9.3 & 9.4
Remuneration of directors, the CEO, the top five key management personnel and immediate family members of a director or the CEO
37
9.5 Details and important terms of employee share schemes 38
11.3 Board’s comments on the adequacy and effectiveness of the internal controls 39
12.1 Names of the members and the key terms of reference of the Audit Committee (“AC”)
40
12.6 Amount of audit and non-audit fees paid to the external auditors 41
12.7 Existence of a whistle-blowing policy 41
12.8 Summary of the AC’s activities and measures taken to keep abreast of changes to significant accounting standards and issues
40
15.4 Steps taken to solicit and understand the views of the shareholders 42
15.5 Payment of dividends 42
MEWAH INTERNATIONAL INC. 30
CORPORATE GOVERNANCE
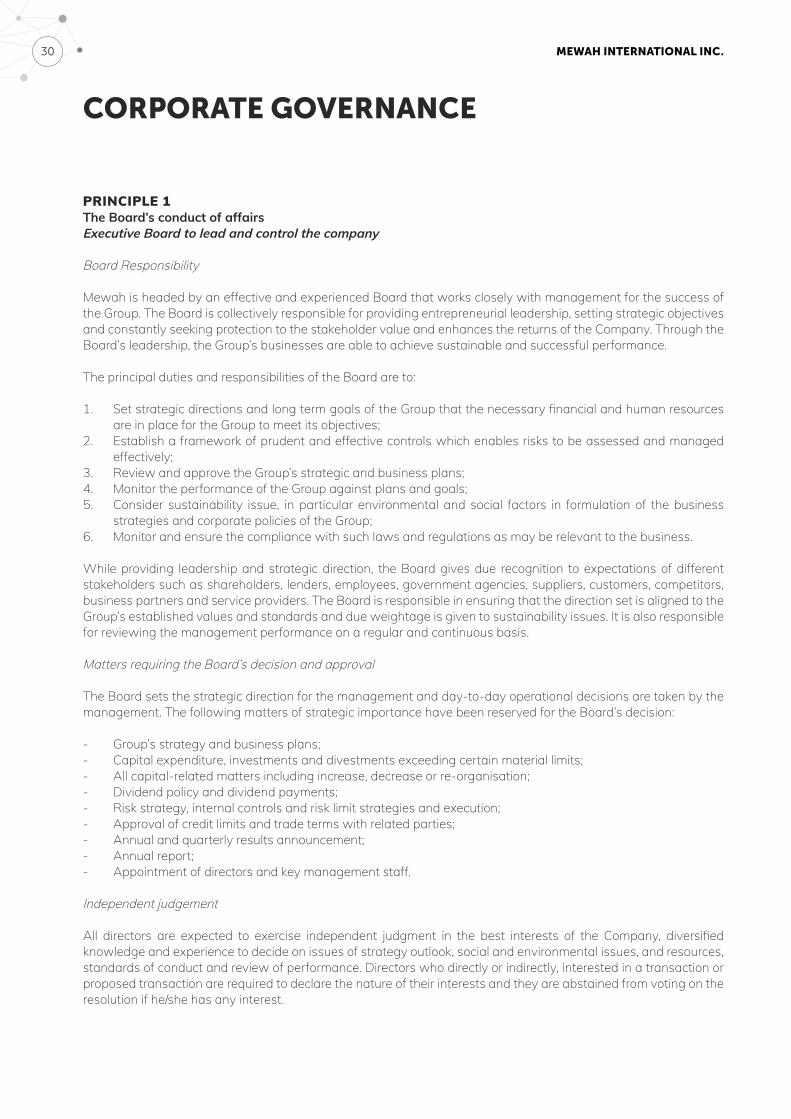
PRINCIPLE 1The Board’s conduct of affairsExecutive Board to lead and control the company
Board Responsibility
Mewah is headed by an effective and experienced Board that works closely with management for the success of the Group. The Board is collectively responsible for providing entrepreneurial leadership, setting strategic objectives and constantly seeking protection to the stakeholder value and enhances the returns of the Company. Through the Board’s leadership, the Group’s businesses are able to achieve sustainable and successful performance.
The principal duties and responsibilities of the Board are to:
1. Set strategic directions and long term goals of the Group that the necessary financial and human resources are in place for the Group to meet its objectives;
2. Establish a framework of prudent and effective controls which enables risks to be assessed and managed effectively;
3. Review and approve the Group’s strategic and business plans;4. Monitor the performance of the Group against plans and goals;5. Consider sustainability issue, in particular environmental and social factors in formulation of the business
strategies and corporate policies of the Group;6. Monitor and ensure the compliance with such laws and regulations as may be relevant to the business.
While providing leadership and strategic direction, the Board gives due recognition to expectations of different stakeholders such as shareholders, lenders, employees, government agencies, suppliers, customers, competitors, business partners and service providers. The Board is responsible in ensuring that the direction set is aligned to the Group’s established values and standards and due weightage is given to sustainability issues. It is also responsible for reviewing the management performance on a regular and continuous basis.
Matters requiring the Board’s decision and approval
The Board sets the strategic direction for the management and day-to-day operational decisions are taken by the management. The following matters of strategic importance have been reserved for the Board’s decision:
- Group’s strategy and business plans;- Capital expenditure, investments and divestments exceeding certain material limits;- All capital-related matters including increase, decrease or re-organisation;- Dividend policy and dividend payments;- Risk strategy, internal controls and risk limit strategies and execution;- Approval of credit limits and trade terms with related parties;- Annual and quarterly results announcement;- Annual report;- Appointment of directors and key management staff.
Independent judgement
All directors are expected to exercise independent judgment in the best interests of the Company, diversified knowledge and experience to decide on issues of strategy outlook, social and environmental issues, and resources, standards of conduct and review of performance. Directors who directly or indirectly, interested in a transaction or proposed transaction are required to declare the nature of their interests and they are abstained from voting on the resolution if he/she has any interest.
ANNUAL REPORT 2018 31
CORPORATE GOVERNANCE
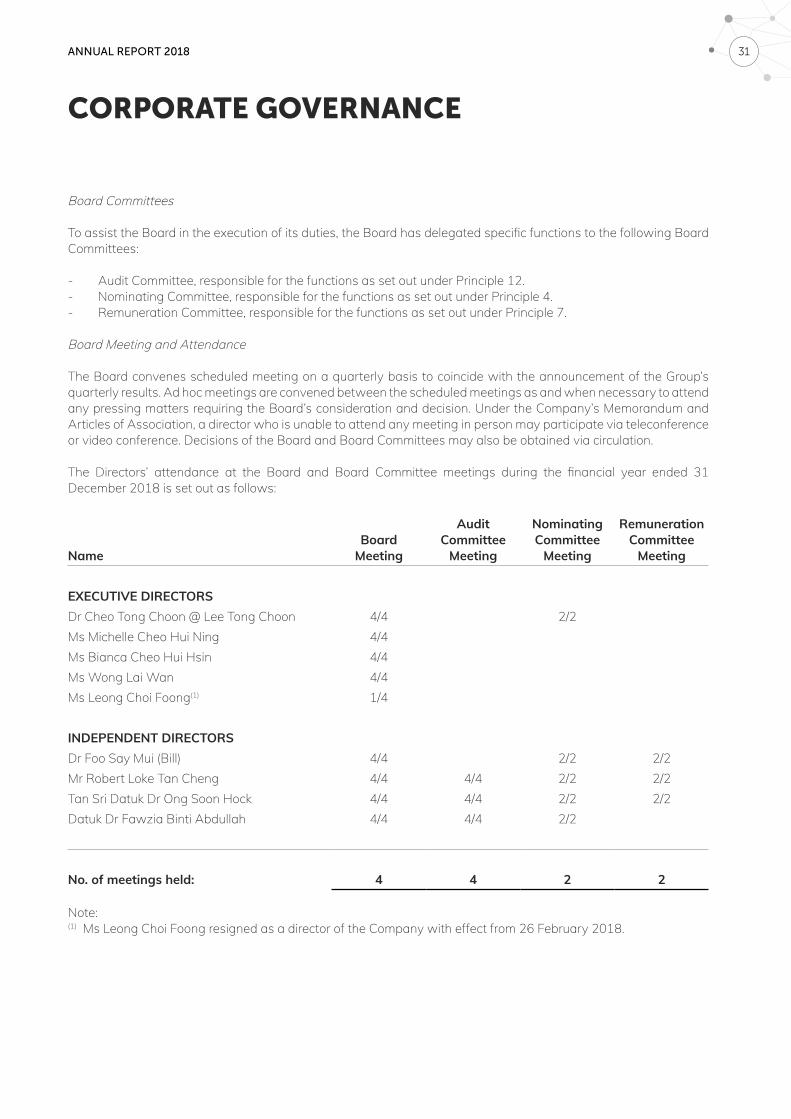
Board Committees
To assist the Board in the execution of its duties, the Board has delegated specific functions to the following Board Committees:
- Audit Committee, responsible for the functions as set out under Principle 12.- Nominating Committee, responsible for the functions as set out under Principle 4.- Remuneration Committee, responsible for the functions as set out under Principle 7.
Board Meeting and Attendance
The Board convenes scheduled meeting on a quarterly basis to coincide with the announcement of the Group’s quarterly results. Ad hoc meetings are convened between the scheduled meetings as and when necessary to attend any pressing matters requiring the Board’s consideration and decision. Under the Company’s Memorandum and Articles of Association, a director who is unable to attend any meeting in person may participate via teleconference or video conference. Decisions of the Board and Board Committees may also be obtained via circulation.
The Directors’ attendance at the Board and Board Committee meetings during the financial year ended 31 December 2018 is set out as follows:
NameBoard
Meeting
Audit Committee
Meeting
Nominating Committee
Meeting
Remuneration Committee
Meeting
EXECUTIVE DIRECTORSDr Cheo Tong Choon @ Lee Tong Choon 4/4 2/2Ms Michelle Cheo Hui Ning 4/4Ms Bianca Cheo Hui Hsin 4/4Ms Wong Lai Wan 4/4Ms Leong Choi Foong(1) 1/4
INDEPENDENT DIRECTORSDr Foo Say Mui (Bill) 4/4 2/2 2/2Mr Robert Loke Tan Cheng 4/4 4/4 2/2 2/2Tan Sri Datuk Dr Ong Soon Hock 4/4 4/4 2/2 2/2Datuk Dr Fawzia Binti Abdullah 4/4 4/4 2/2
No. of meetings held: 4 4 2 2
Note:(1) Ms Leong Choi Foong resigned as a director of the Company with effect from 26 February 2018.
MEWAH INTERNATIONAL INC. 32
CORPORATE GOVERNANCE
Induction, orientation and training
Upon joining the Board, all directors are provided with formal letters setting out their duties and obligations. The Group also conducts an orientation program for new directors to familiarise them with the business activities of the Group, its strategic direction and corporate governance practices. A first time director who has no prior experience as a director of a listed company will undergo training in the roles and responsibilities of a director of a listed company in areas such as accounting, risk management, legal, corporate compliance and industry-specific knowledge as appropriate. In 2018, the Company has arranged a briefing session on updates in the requirements of the SGX-ST and Code of Corporate Governance 2018 to the Board. Directors will also be briefed on Companies Act, Chapter 50 or other regulations/statutory requirements from time to time. Annually, the Company will arrange the external auditors to update to all directors on the new and revised financial reporting standards that are applicable to the Company. Directors are given regular training and updates on specific matters relevant to ensure they carry out their role effectively. Directors are also encouraged to participate in external training at the Group’s expense.
To facilitate ongoing knowledge enhancement for existing directors, the following orientations and trainings were provided during the year:
- Overview of the Oils and Fats industry and Group’s strategy to grow the business;- Group strategic plans to further consolidate its position in Palm oils industry;- Risk management practices for Group’s trading and review of Group’s overall risk limits;- Group’s capital structure and financing flexibility to align to growth plans;- Update on Code of Corporate Governance 2018 and the revised listing rule relevant to the Group;- Global transition: impacts and opportunities to business;- External seminars and conferences on regulatory matters;- Briefings were provided by the external auditor to Audit Committee on new accounting standards.
PRINCIPLE 2Board Composition and GuidanceStrong and independent element on the Board
Board Size and Board Composition
The Board, in concurrence with the Nominating Committee examines the Board structure, size and composition including the skills, knowledge and core competencies of the Board members to ensure that an appropriate balance of expertise, experience and knowledge. A brief profile of each director is given on pages 6 to 8 of this Report.
The Board comprises eight members, half of the Board are Independent Directors. The current Board possesses diversified and varied expertise, experience and knowledge in the areas of the Group’s palm oil business and geographical operations, as well as in the areas of strategy formulation, manufacturing, marketing, legal, taxation, finance, accounting and corporate compliances. With their varied experience in different industries and areas of expertise, Independent directors play a crucial role in challenging the Board to develop strategies in the best interest of the Group. They also contribute independent perspective in reviewing the performance of the management in meeting agreed goals and objectives, and performance monitoring.
The Group also emphasises great importance to gender equality. The Company has four women on the Board, namely Ms Michelle Cheo Hui Ning, Ms Bianca Cheo Hui Hsin, Ms Wong Lai Wan and Datuk Dr Fawzia Binti Abdullah.
ANNUAL REPORT 2018 33
CORPORATE GOVERNANCE
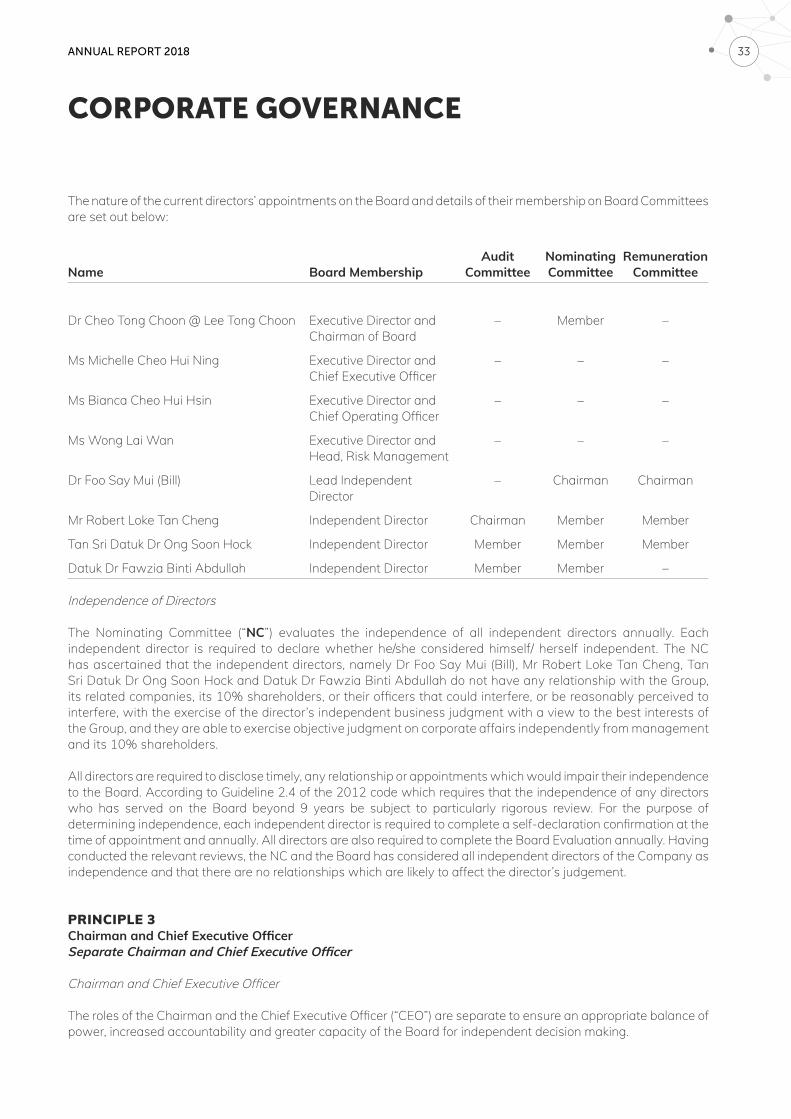
The nature of the current directors’ appointments on the Board and details of their membership on Board Committees are set out below:
Name Board MembershipAudit
CommitteeNominating Committee
RemunerationCommittee
Dr Cheo Tong Choon @ Lee Tong Choon Executive Director andChairman of Board
– Member –
Ms Michelle Cheo Hui Ning Executive Director andChief Executive Officer
– – –
Ms Bianca Cheo Hui Hsin Executive Director andChief Operating Officer
– – –
Ms Wong Lai Wan Executive Director andHead, Risk Management
– – –
Dr Foo Say Mui (Bill) Lead Independent Director
– Chairman Chairman
Mr Robert Loke Tan Cheng Independent Director Chairman Member Member
Tan Sri Datuk Dr Ong Soon Hock Independent Director Member Member Member
Datuk Dr Fawzia Binti Abdullah Independent Director Member Member –
Independence of Directors
The Nominating Committee (“NC”) evaluates the independence of all independent directors annually. Each independent director is required to declare whether he/she considered himself/ herself independent. The NC has ascertained that the independent directors, namely Dr Foo Say Mui (Bill), Mr Robert Loke Tan Cheng, Tan Sri Datuk Dr Ong Soon Hock and Datuk Dr Fawzia Binti Abdullah do not have any relationship with the Group, its related companies, its 10% shareholders, or their officers that could interfere, or be reasonably perceived to interfere, with the exercise of the director’s independent business judgment with a view to the best interests of the Group, and they are able to exercise objective judgment on corporate affairs independently from management and its 10% shareholders.
All directors are required to disclose timely, any relationship or appointments which would impair their independence to the Board. According to Guideline 2.4 of the 2012 code which requires that the independence of any directors who has served on the Board beyond 9 years be subject to particularly rigorous review. For the purpose of determining independence, each independent director is required to complete a self-declaration confirmation at the time of appointment and annually. All directors are also required to complete the Board Evaluation annually. Having conducted the relevant reviews, the NC and the Board has considered all independent directors of the Company as independence and that there are no relationships which are likely to affect the director’s judgement.
PRINCIPLE 3Chairman and Chief Executive OfficerSeparate Chairman and Chief Executive Officer
Chairman and Chief Executive Officer
The roles of the Chairman and the Chief Executive Officer (“CEO”) are separate to ensure an appropriate balance of power, increased accountability and greater capacity of the Board for independent decision making.
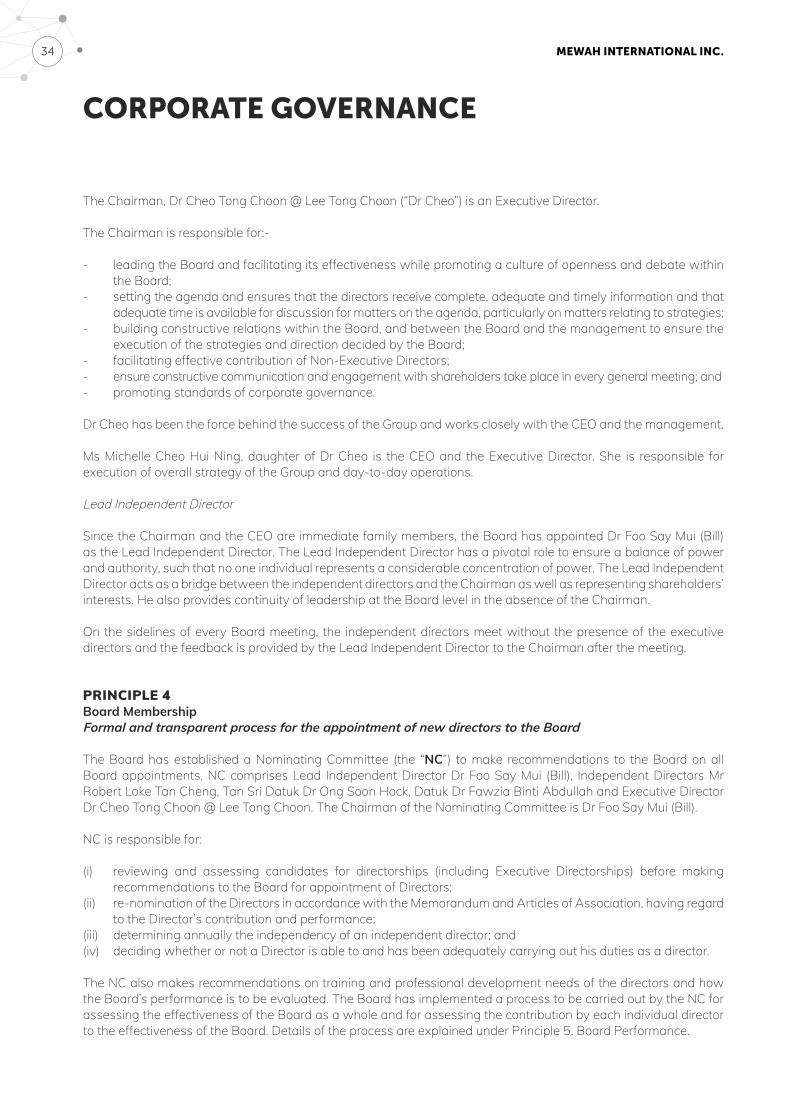
MEWAH INTERNATIONAL INC. 34
CORPORATE GOVERNANCE
The Chairman, Dr Cheo Tong Choon @ Lee Tong Choon (“Dr Cheo”) is an Executive Director.
The Chairman is responsible for:-
- leading the Board and facilitating its effectiveness while promoting a culture of openness and debate within the Board;
- setting the agenda and ensures that the directors receive complete, adequate and timely information and that adequate time is available for discussion for matters on the agenda, particularly on matters relating to strategies;
- building constructive relations within the Board, and between the Board and the management to ensure the execution of the strategies and direction decided by the Board;
- facilitating effective contribution of Non-Executive Directors;- ensure constructive communication and engagement with shareholders take place in every general meeting; and - promoting standards of corporate governance.
Dr Cheo has been the force behind the success of the Group and works closely with the CEO and the management.
Ms Michelle Cheo Hui Ning, daughter of Dr Cheo is the CEO and the Executive Director. She is responsible for execution of overall strategy of the Group and day-to-day operations.
Lead Independent Director
Since the Chairman and the CEO are immediate family members, the Board has appointed Dr Foo Say Mui (Bill) as the Lead Independent Director. The Lead Independent Director has a pivotal role to ensure a balance of power and authority, such that no one individual represents a considerable concentration of power. The Lead Independent Director acts as a bridge between the independent directors and the Chairman as well as representing shareholders’ interests. He also provides continuity of leadership at the Board level in the absence of the Chairman.
On the sidelines of every Board meeting, the independent directors meet without the presence of the executive directors and the feedback is provided by the Lead Independent Director to the Chairman after the meeting.
PRINCIPLE 4Board MembershipFormal and transparent process for the appointment of new directors to the Board
The Board has established a Nominating Committee (the “NC”) to make recommendations to the Board on all Board appointments. NC comprises Lead Independent Director Dr Foo Say Mui (Bill), Independent Directors Mr Robert Loke Tan Cheng, Tan Sri Datuk Dr Ong Soon Hock, Datuk Dr Fawzia Binti Abdullah and Executive Director Dr Cheo Tong Choon @ Lee Tong Choon. The Chairman of the Nominating Committee is Dr Foo Say Mui (Bill).
NC is responsible for:
(i) reviewing and assessing candidates for directorships (including Executive Directorships) before making recommendations to the Board for appointment of Directors;
(ii) re-nomination of the Directors in accordance with the Memorandum and Articles of Association, having regard to the Director’s contribution and performance;
(iii) determining annually the independency of an independent director; and(iv) deciding whether or not a Director is able to and has been adequately carrying out his duties as a director.
The NC also makes recommendations on training and professional development needs of the directors and how the Board’s performance is to be evaluated. The Board has implemented a process to be carried out by the NC for assessing the effectiveness of the Board as a whole and for assessing the contribution by each individual director to the effectiveness of the Board. Details of the process are explained under Principle 5, Board Performance.

ANNUAL REPORT 2018 35
CORPORATE GOVERNANCE
The Board has not set the maximum number of Board representations which any director may hold. The NC continuously assesses the performance of individual directors taking into consideration the director’s number of Board representation and other principal commitments. The NC is satisfied that sufficient time and attention is being given to the affairs of the Group by each director.
Each member of the NC is required to abstain from deliberating, participating or voting in the matters relating to him including the assessment of his performance and re-nomination as director.
All Board appointments are approved by way of written resolutions or approved by the shareholders at any general meeting based on the recommendations of the NC. In searching, nominating and selecting new directors, the NC will continue to tap on the resources of directors’ personal contacts and recommendations of potential candidates and participate in the shortlisting and interviewing process, if required. The NC will engage external agencies to assist if required, at the expense of the Group.
In assessing re-appointment of the directors, the NC evaluates based on several criteria including qualifications, contributions and independence of the directors. In accordance with the Company’s Memorandum and Articles of Association, each director shall retire at least once in every three years. A retiring director shall be eligible for re-election subject to approval by the shareholders at the Annual General Meeting (“AGM”). New directors appointed by the Board will hold office only until the next AGM following their appointments and they will be eligible for re-election. Such directors are not taken into account in determining the number of directors who are to retire by rotation. The Board generally does not have a practice of appointing alternate directors. However, new directors appointed by the shareholders in any general meeting shall retire at least once in every three years.
Key information regarding each director’s qualifications, shareholdings, relationships (if any), date of first appointment, directorship and other principal commitments is presented on pages 6 to 8 of the ‘Board of Directors’ and ‘Directors’ Statement’ on pages 45 to 48 of this Annual Report.
PRINCIPLE 5Board PerformanceFormal assessment of the effectiveness of the Board and its members
The NC has in place a process for the evaluation of the Board’s effectiveness as a whole, its Board Committees and a process for assessing the contribution by the Chairman and each individual director to the effectiveness of the Board on an annual basis. The evaluation is done through written assessments by individual directors. The assessment is based on objective performance criteria including the Board’s understanding of the Group’s business operations, development of strategic directions, the effectiveness of the Board meetings to facilitate discussion and decision on critical and major corporate matters, as well as individual’s contribution and commitment to their roles. The collated findings are reported and recommendations are submitted to the Board for review and to further enhance the Board’s effectiveness. There were no significant issues that warrant the Board’s attention.
PRINCIPLE 6Access to InformationBoard members to have complete, adequate and timely information
The Group recognises that the flow of relevant information on an accurate and timely basis is critical for the Board to be effective in discharge of its duties. Management is therefore expected to provide the Board with accurate information in a timely manner concerning the Group’s progress or shortcomings in meeting its strategic business objectives or financial targets and other information relevant to the strategic issues facing the Group.
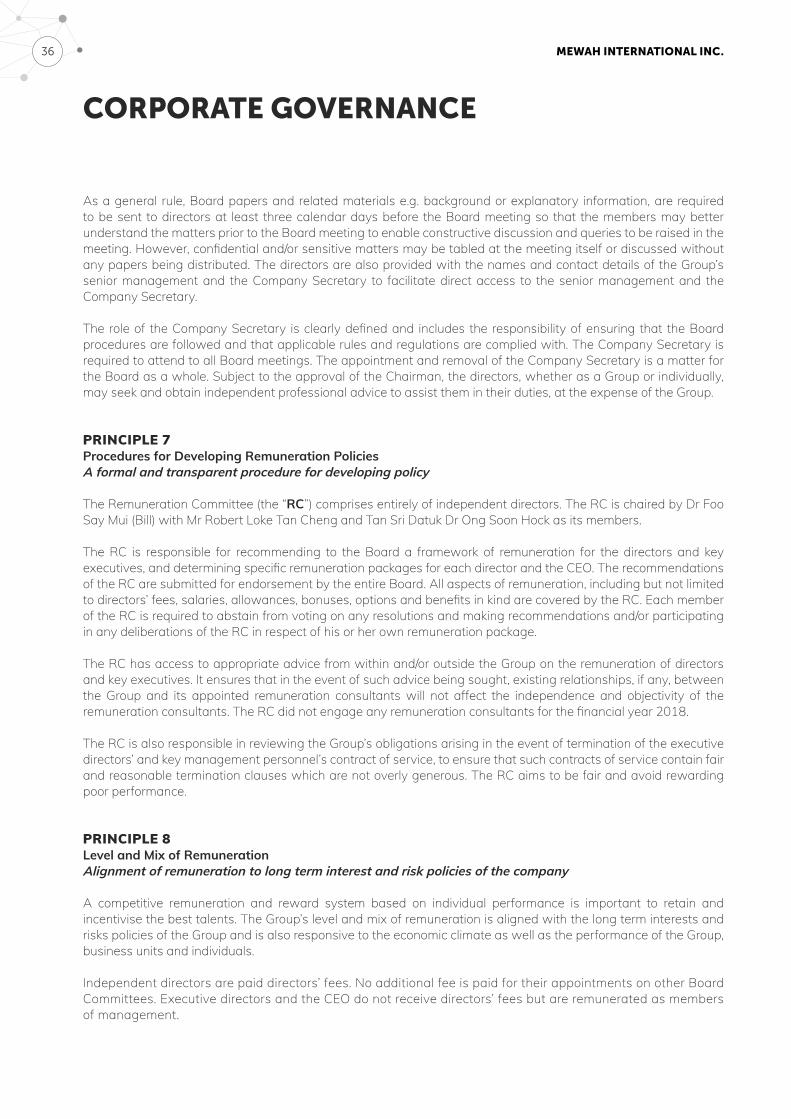
MEWAH INTERNATIONAL INC. 36
CORPORATE GOVERNANCE
As a general rule, Board papers and related materials e.g. background or explanatory information, are required to be sent to directors at least three calendar days before the Board meeting so that the members may better understand the matters prior to the Board meeting to enable constructive discussion and queries to be raised in the meeting. However, confidential and/or sensitive matters may be tabled at the meeting itself or discussed without any papers being distributed. The directors are also provided with the names and contact details of the Group’s senior management and the Company Secretary to facilitate direct access to the senior management and the Company Secretary.
The role of the Company Secretary is clearly defined and includes the responsibility of ensuring that the Board procedures are followed and that applicable rules and regulations are complied with. The Company Secretary is required to attend to all Board meetings. The appointment and removal of the Company Secretary is a matter for the Board as a whole. Subject to the approval of the Chairman, the directors, whether as a Group or individually, may seek and obtain independent professional advice to assist them in their duties, at the expense of the Group.
PRINCIPLE 7Procedures for Developing Remuneration PoliciesA formal and transparent procedure for developing policy
The Remuneration Committee (the “RC”) comprises entirely of independent directors. The RC is chaired by Dr Foo Say Mui (Bill) with Mr Robert Loke Tan Cheng and Tan Sri Datuk Dr Ong Soon Hock as its members.
The RC is responsible for recommending to the Board a framework of remuneration for the directors and key executives, and determining specific remuneration packages for each director and the CEO. The recommendations of the RC are submitted for endorsement by the entire Board. All aspects of remuneration, including but not limited to directors’ fees, salaries, allowances, bonuses, options and benefits in kind are covered by the RC. Each member of the RC is required to abstain from voting on any resolutions and making recommendations and/or participating in any deliberations of the RC in respect of his or her own remuneration package.
The RC has access to appropriate advice from within and/or outside the Group on the remuneration of directors and key executives. It ensures that in the event of such advice being sought, existing relationships, if any, between the Group and its appointed remuneration consultants will not affect the independence and objectivity of the remuneration consultants. The RC did not engage any remuneration consultants for the financial year 2018.
The RC is also responsible in reviewing the Group’s obligations arising in the event of termination of the executive directors’ and key management personnel’s contract of service, to ensure that such contracts of service contain fair and reasonable termination clauses which are not overly generous. The RC aims to be fair and avoid rewarding poor performance.
PRINCIPLE 8Level and Mix of RemunerationAlignment of remuneration to long term interest and risk policies of the company
A competitive remuneration and reward system based on individual performance is important to retain and incentivise the best talents. The Group’s level and mix of remuneration is aligned with the long term interests and risks policies of the Group and is also responsive to the economic climate as well as the performance of the Group, business units and individuals.
Independent directors are paid directors’ fees. No additional fee is paid for their appointments on other Board Committees. Executive directors and the CEO do not receive directors’ fees but are remunerated as members of management.
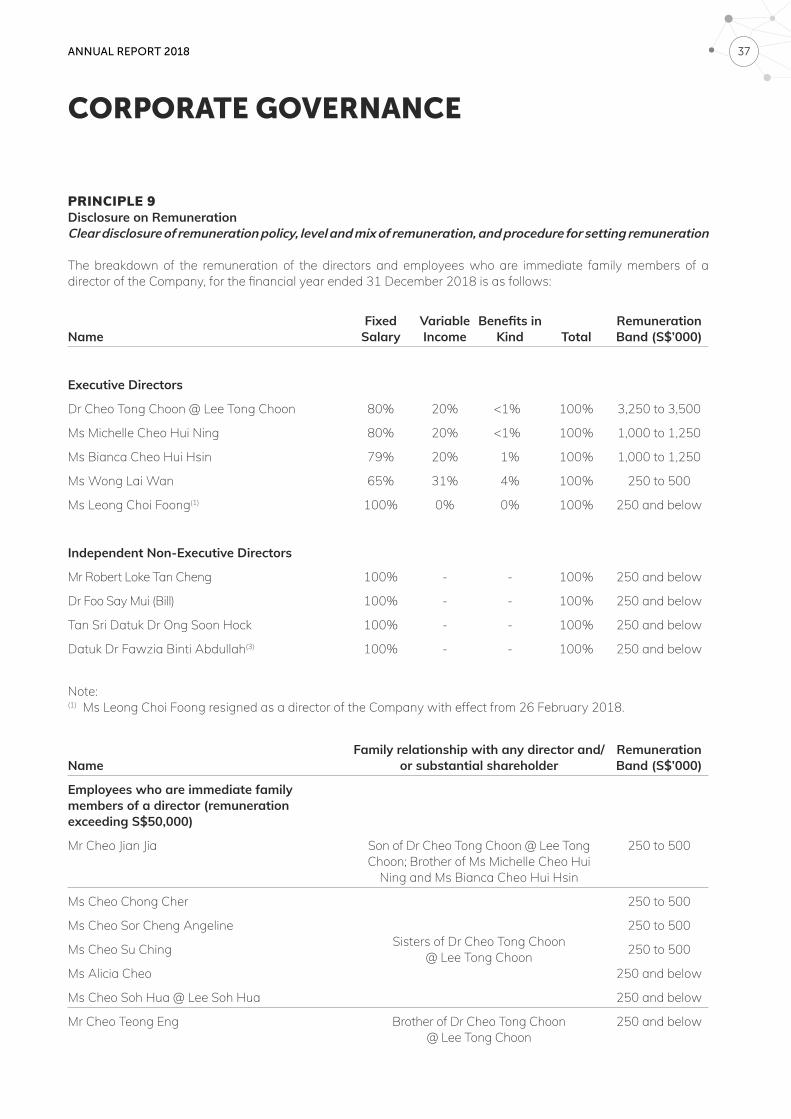
ANNUAL REPORT 2018 37
CORPORATE GOVERNANCE
PRINCIPLE 9Disclosure on RemunerationClear disclosure of remuneration policy, level and mix of remuneration, and procedure for setting remuneration
The breakdown of the remuneration of the directors and employees who are immediate family members of a director of the Company, for the financial year ended 31 December 2018 is as follows:
NameFixed
SalaryVariable Income
Benefits in Kind Total
Remuneration Band (S$’000)
Executive Directors
Dr Cheo Tong Choon @ Lee Tong Choon 80% 20% <1% 100% 3,250 to 3,500
Ms Michelle Cheo Hui Ning 80% 20% <1% 100% 1,000 to 1,250
Ms Bianca Cheo Hui Hsin 79% 20% 1% 100% 1,000 to 1,250
Ms Wong Lai Wan 65% 31% 4% 100% 250 to 500
Ms Leong Choi Foong(1) 100% 0% 0% 100% 250 and below
Independent Non-Executive Directors
Mr Robert Loke Tan Cheng 100% - - 100% 250 and below
Dr Foo Say Mui (Bill) 100% - - 100% 250 and below
Tan Sri Datuk Dr Ong Soon Hock 100% - - 100% 250 and below
Datuk Dr Fawzia Binti Abdullah(3) 100% - - 100% 250 and below
Note:(1) Ms Leong Choi Foong resigned as a director of the Company with effect from 26 February 2018.
NameFamily relationship with any director and/
or substantial shareholderRemuneration Band (S$’000)
Employees who are immediate familymembers of a director (remunerationexceeding S$50,000)
Mr Cheo Jian Jia Son of Dr Cheo Tong Choon @ Lee Tong Choon; Brother of Ms Michelle Cheo Hui
Ning and Ms Bianca Cheo Hui Hsin
250 to 500
Ms Cheo Chong Cher
Sisters of Dr Cheo Tong Choon @ Lee Tong Choon
250 to 500
Ms Cheo Sor Cheng Angeline 250 to 500
Ms Cheo Su Ching 250 to 500
Ms Alicia Cheo 250 and below
Ms Cheo Soh Hua @ Lee Soh Hua 250 and below
Mr Cheo Teong Eng Brother of Dr Cheo Tong Choon @ Lee Tong Choon
250 and below
MEWAH INTERNATIONAL INC. 38
CORPORATE GOVERNANCE
Top Five Key Management Personnel
Remuneration paid to the top five key management personnel (who are not directors or the CEO) ranged between S$250,000 and S$1,500,000 and aggregated to S$3,141,000 49%, 49%, 2% of which were fixed salary, variable income and benefits in kind respectively.
In considering the disclosure of remuneration of the directors, immediate family members of a director or key management personnel (“KMP”), the Group measures the industry conditions in which the Group operates and considers the confidential nature of the remuneration. The Group believes that more detailed disclosures such as disclosure of remuneration on individually named basis for KMPs, exact amounts for directors, and disclosure in incremental bands of S$50,000 for the immediate family members of the directors would be detrimental to the long term interest of the Group and in attracting, retaining and motivating the employees of the Group.
Remuneration of executive directors and key executives includes a variable component which is linked directly to performance measures identified by the Group. The quantum of variable component is dependent on the individual performance against those measures that includes knowledge and understanding of the Group and industry, execution of strategies, personal qualities, as well as performance of the Group in general. The Company does not have contractual provisions to reclaim incentive components of remuneration from executive directors and KMPs in exceptional circumstances of misstatement of financial results, or of misconduct resulting in financial loss to the Company as it is of the view that, in any case, it has legal recourse under such circumstances.
The Company did not have any Employee Share Schemes for the financial year 2018.
PRINCIPLE 10AccountabilityBalanced and understandable assessment of the Company’s performance, position and prospects
The Board has embraced openness and transparency in the conduct of the Group’s affairs, whilst preserving the commercial interests of the Group. The Group presents a balanced and clear assessment of the Group’s performance, position and prospects to shareholders through the timely release of its quarterly and annual financial reports via SGXNET to the SGX, press releases and the Company’s website at www.mewahgroup.com.
The Board reviews and approves the financial reports to ensure that the disclosure of material information to shareholders is in compliance with statutory requirements and the Listing Manual of the SGX-ST before publication. As recommended in the Guidebook for Audit Committees in Singapore, the Board also reviews and approves any media release of its financial results. Negative Assurance confirmation were issued by the Board to accompany the quarterly financial results announcements, confirming that to the best of its knowledge, nothing had come to its attention which would render the Group’s quarterly results false or misleading.
ANNUAL REPORT 2018 39
CORPORATE GOVERNANCE
PRINCIPLE 11Risk Management and Internal ControlsSound system of internal controls;PRINCIPLE 13Internal AuditEstablishment of an effective internal audit function
The internal audit function of the Group is established and maintained on an ongoing basis by in-house Group Internal Audit (“IA”) Department. The IA is an independent function within the Group. The IA Department, headed by Mr Larry Cheng, and suitably qualified executives meets the Standards for the Professional Practice of Internal Auditing of the Institute of Internal Auditors. Mr Cheng reports direct to the Chairman of Audit Committee and to CEO administratively.
The Audit Committee approves the hiring, removal, evaluation, and compensation of the Group IA Manager.
The Group’s IA conducts an annual review of the effectiveness of the Group’s material internal controls, including financial, operational, compliance, information technology controls, and risk management. Any material non-compliance or failures in internal controls and recommendations for improvements are reported to the Audit Committee. The Audit Committee also reviews the effectiveness of the actions taken by management on the recommendations made by the internal and external auditors in this respect.
The Group IA adopted a risk-based auditing approach that focuses on material internal controls, including financial, operational and compliance controls. Audits were carried out on all significant business units in the Group, inclusive of limited review performed on dormant and inactive companies. All the Group IA’s reports are submitted to the Audit Committee for deliberation with copies of these reports extended to the Chairman, CEO and the relevant Senior Management Officers. In addition, IA’s summary of findings and recommendations are discussed at the Audit Committee meetings.
Risk Management and Internal Control
The role of the IA function is to assist the Audit Committee to provide reasonable assurance that the Group maintains a sound system of internal controls by regular monitoring of key controls and procedures and ensuring their effectiveness, undertaking investigations as directed by the Audit Committee, and conducting regular in-depth audits of high risk areas. The Audit Committee ensures that the IA are adequately resourced and have appropriate standing within the Group and ensures, on an annual basis, the adequacy of the internal audit function and reviews the adequacy and effectiveness of the IA function.
Opinion on the Adequacy and Effectiveness of Internal Control and Risk Management Systems
Based on the internal control and risk management systems established and maintained by the Group, audit checks performed by the internal and external auditors and regular reviews performed by management, the Board and various Board Committees, the Audit Committee and the Board is of the opinion that the Group’s internal control and risk management systems are adequate and effective as at 31 December 2018 to address the financial, operational, compliance and information technology risks of the Group.
MEWAH INTERNATIONAL INC. 40
CORPORATE GOVERNANCE
The internal control and risk management systems established by the Group provides reasonable, but not absolute, assurance that the Group will not be adversely affected by any event that can be reasonably foreseen as it strives to achieve its business objectives.
Assurance from the CEO and CFO in respect of financial statements and financial records
The Chief Executive Officer and Chief Financial Officer have also provided a written confirmation to the Board that to the best of their understanding (a) the financial records have been properly maintained, the financial statements give a true and fair view of the Group’s operations and finances and (b) the Group’s risk management and internal control systems are effective.
PRINCIPLE 12Audit CommitteeEstablishment of Audit Committee with written terms of reference
The Audit Committee (“AC”) comprises entirely non-executive and independent directors, namely Mr Robert Loke Tan Cheng, Tan Sri Datuk Dr Ong Soon Hock and Datuk Dr Fawzia Binti Abdullah. The Board considers the members of the AC are appropriately qualified with sufficient and relevant financial management expertise and experience to discharge its functions. The AC is also kept abreast of changes to accounting standards and issues which have a direct impact on financial statements through meetings with the external auditors who will update the AC on recent related developments. It held four meetings in FY 2018. The AC has met with the internal and external auditors without the presence of the management during the year. The AC does not have any member who was a former partner or director of the Company’s external auditor, PwC, within the last 12 months, or who holds any financial interest in PwC.
The AC is guided by the following key terms of reference which defines its scope of authority:
(i) commission internal investigations and review any significant findings and otherwise carry out its obligations under Rule 719 of the SGX-ST Listing Manual (for example, in relation to any suspected fraud or irregularity or suspected infringement of any Singapore laws or regulations or rules of the SGX-ST or any other regulatory authority of Singapore, which has or is likely to have a material impact on the Company’s operating results or financial position);
(ii) reviewing and reporting to the Board the adequacy and effectiveness of the Group’s internal controls, including financial, operational, compliance and information technology controls at least annually;
(iii) review the qualification and adequacy of the head of the internal audit function;(iv) monitor and review the adequacy and effectiveness of the Company’s internal audit function in the context of
the Company’s overall risk management system;(v) consider and approve the remit of the internal audit function and ensure it has adequate resources and
appropriate access to information to enable it to perform its function effectively and in accordance with the relevant professional standards. The Committee shall also ensure the function has adequate standing and is free from management or other restrictions;
(vi) reviewing the scope, approach and results of the audit and its effectiveness, and the independence and objectivity of the external auditors;
(vii) nominating external auditors for re-appointment;(viii) reviewing the integrity of any financial information presented to the Company’s shareholders;(ix) reviewing interested person transactions and potential conflicts of interest, if any;(x) reviewing all hedging policies and instruments to be implemented by the Group, if any;(xi) reviewing all investment instruments that are not principal protected;(xii) reviewing the Group’s risk management structure and any oversight of risk management processes and
activities to mitigate and manage risk at acceptable levels determined by the Board.
Each member of the AC must abstain from voting on any resolution in respect of matters in which he/she is interested.
ANNUAL REPORT 2018 41
CORPORATE GOVERNANCE
The AC has conducted annual review on the independence and objectivity of the external auditors as well as non-audit services provided by them and is satisfied that the nature and extent of such services do not affect the independence of the external auditors. Details of the fees paid and payable to the auditors in respect of audit and non-audit services are set out in the notes to financial statements on page 86 of this Report. The Group has complied with Rule 712, and Rule 715 read with Rule 716 of the SGX Listing Manual in relation to its auditors.
The AC has explicit authority to investigate any activity within its terms of reference, full access to and co-operation from the management and full discretion to invite any director or executive officer to attend its meetings. It also has reasonable resources to enable it to discharge its function properly.
The Group has put in place a policy on whistle-blowing, approved by the AC and endorsed by the Board to facilitate the reporting of activities or practices which are malpractice, illegal act or omission of work by an employee. Details of the whistle blowing policies and arrangements have been made available to all employees. By creating an atmosphere of openness and trust, the Group encourages the employees to use internal mechanisms for reporting any malpractice, illegal acts or omissions by any of Group’s employees or ex-employees and such reports will be treated fairly and be protected from reprisal.
Key Audit matters
The AC considered and discussed the key audit matters, as disclosed on page 50 of this Report, with management and the external auditors. The Audit Committee’s assessment and conclusion is explained below:
Valuation of commodities forward contracts of the Group
The AC reviewed the overall valuation methodology adopted by management, including the different sources of prices for consistency and appropriateness. The Audit Committee’s review also considered the work performed by the external auditors as well as an assessment of the sensitivity of the valuation to changes in the assumptions and the implications of the same and concluded that the valuation of the commodities forward contracts was reasonable.
PRINCIPLE 14Shareholder RightsAll shareholders are treated fairly and equitably;PRINCIPLE 15Communication with shareholdersRegular, effective and fair communication with shareholders;PRINCIPLE 16Conduct of shareholder meetingsGreater shareholder participation at Annual General Meetings
The Group values engagement with its shareholders and believes in regular, effective and fair communication with its shareholders. The Group is committed to upholding high standard of disclosure and continues to keep all stakeholders informed of its corporate activities on a timely and consistent basis. The Group disseminates all price sensitive and material information to its shareholders via SGXNET on a non-selective basis. Financial and other performance data of the Group as well as business units, where appropriate, is provided to shareholders in order to have a better insight into the Group’s performance. The date of the release of quarterly results is disclosed at least two weeks prior to the date of announcement through SGXNET. On the day of announcement, the financial statements as well as the accompanying press release and presentation slides are released onto the SGXNET website as well as on the Company website at www.mewahgroup.com.
MEWAH INTERNATIONAL INC. 42
CORPORATE GOVERNANCE
All shareholders of the Company whose names are registered in the Depository Register and the Register of Members are entitled to attend the general meetings of the Company. If any shareholder is unable to attend, he or she is allowed to appoint up to two proxies to vote on his or her behalf at the meeting through proxy forms sent in advance. Shareholders are informed of shareholders’ meetings through notices published in the newspapers and reports or circulars sent to all shareholders. All shareholders have the opportunity to participate effectively in and vote at general meetings of shareholders and have been informed of the rules, including voting procedures, which govern general meetings of shareholders. They are encouraged to meet with the Board and senior management to have a greater insight into the Group’s developments.
Voting in absentia by mail, facsimile or email has not been implemented as the authentication of shareholders’ identity, integrity of the information and other related security issues still remain a concern.
At shareholders’ meetings, each distinct issue is proposed as a separate resolution and the results of the votes are announced at the shareholders’ meetings. The results will also be announced on the SGXNET and the Company website at www.mewahgroup.com.
The Chairmen of each Board committee and management are required to be present to address questions at the AGM. External auditors are also present at such meetings to assist the directors to address shareholders’ queries, if necessary. Minutes of shareholder meetings are available upon request by registered shareholders.
In order to show appreciation for the support of the shareholders, the Board of Directors has proposed a final exempt dividend of S$0.0045 per ordinary share, which along with interim dividends of S$0.0022, making total dividend of S$0.0067 per ordinary share for the full year.
Dealings in Securities
The Group has adopted a Best Practice Code – Trading in Company’s Securities. As per the policy, the Company, its directors and all employees of the Group are prohibited from dealing in the Company’s shares two weeks before the announcement of the Group’s first quarter, second quarter and third quarter results and one month before the announcement of full year results, and ending one business day after the announcement of the results. Directors and all employees are also prohibited from trading in the Company’s securities on short-term considerations, defined as 30 days from last dealing; and in situations where the insider trading laws and rules would prohibit trading.The directors’ interests in shares of the Company are disclosed on page 46 of this Report.
Interested Person Transactions
The Company has established procedures to ensure that all transactions with interested persons are reported on a timely manner to the AC and that the transactions are carried out on a normal commercial terms and will not be prejudicial to the interests of the Company and its minority shareholders. The Company’s disclosures in respect of interested person transactions for the financial year ended 31 December 2018 are as follows:
CORPORATE GOVERNANCE
Name of Interested Person
Aggregate value of all IPT during the period under
review (excluding transactions less than SGD100,000 and
transactions conducted under shareholders’ mandate
pursuant to Rule 920)
Aggregate value of all IPT conducted under
shareholders’ mandate pursuant to Rule 920
(excluding transactions less than SGD100,000)
FY 2018US$’000
FY 2018US$’000
Prelude Gateway Sdn. Bhd. 108 3,508Perfect Venue Sdn. Bhd 9 NILEcolex Sdn. Bhd. 9 18,035Containers Printers Pte Ltd NIL 1,184Nature International Pte Ltd NIL 408Mr Cheo Seng Jin 800 NILMr Cheo Tiong Choon 800 NILKent Holidays (S) Pte Ltd 262 NILChoon Heng Logistics Pte Ltd 177 NIL
Statement by Audit Committee and Board of Directors
In accordance with Rule 716 of the Listing Manual, the Audit Committee and the Board of Directors of the Company have reviewed and satisfied that the appointment of different auditors for certain of its subsidiaries would not compromise the standard and effectiveness of the audit of the Group.
Material Contracts
There was no material contracts entered into by the Company or any of its subsidiaries involving the interests of the Chief Executive Officer, any director, or controlling shareholder subsisting at the end of financial year ended 31 December 2018 and no material contracts entered into since the end of the previous financial year.
43
MEWAH INTERNATIONAL INC. 44
FINANCIALSTATEMENTS
45 Directors’ Statement49 Independent Auditor’s Report53 Consolidated Income Statement54 Consolidated Statement of Comprehensive Income55 Balance Sheet – Group57 Balance Sheet – Company58 Consolidated Statement of Changes in Equity59 Consolidated Statement of Cash Flows61 Notes to the Financial Statements
ANNUAL REPORT 2018 45
DIRECTORS’ STATEMENTFor the financial year ended 31 December 2018
The directors present their statement to the members together with the audited financial statements of the Group for the financial year ended 31 December 2018 and the balance sheet of the Company as at 31 December 2018.
In the opinion of the directors,
(a) the balance sheet of the Company and the consolidated financial statements of the Group as set out on pages 53 to 138 are drawn up so as to give a true and fair view of the financial position of the Company and of the Group as at 31 December 2018 and the financial performance, changes in equity and cash flows of the Group for the financial year covered by the consolidated financial statements; and
(b) at the date of this statement, there are reasonable grounds to believe that the Company will be able to pay its debts as and when they fall due.
DIRECTORS
The directors of the Company in office at the date of this report are as follows:
Dr Cheo Tong Choon @ Lee Tong ChoonMs Michelle Cheo Hui NingMs Bianca Cheo Hui HsinMs Wong Lai WanDr Foo Say Mui (Bill)Mr Robert Loke Tan ChengTan Sri Datuk Dr Ong Soon HockDatuk Dr Fawzia Binti Abdullah
ARRANGEMENTS TO ENABLE DIRECTORS TO ACQUIRE SHARES AND DEBENTURES
Neither at the end of nor at any time during the financial year was the Company a party to any arrangement whose object was to enable the directors of the Company to acquire benefits by means of the acquisition of shares in, or debentures of, the Company or any other body corporate.
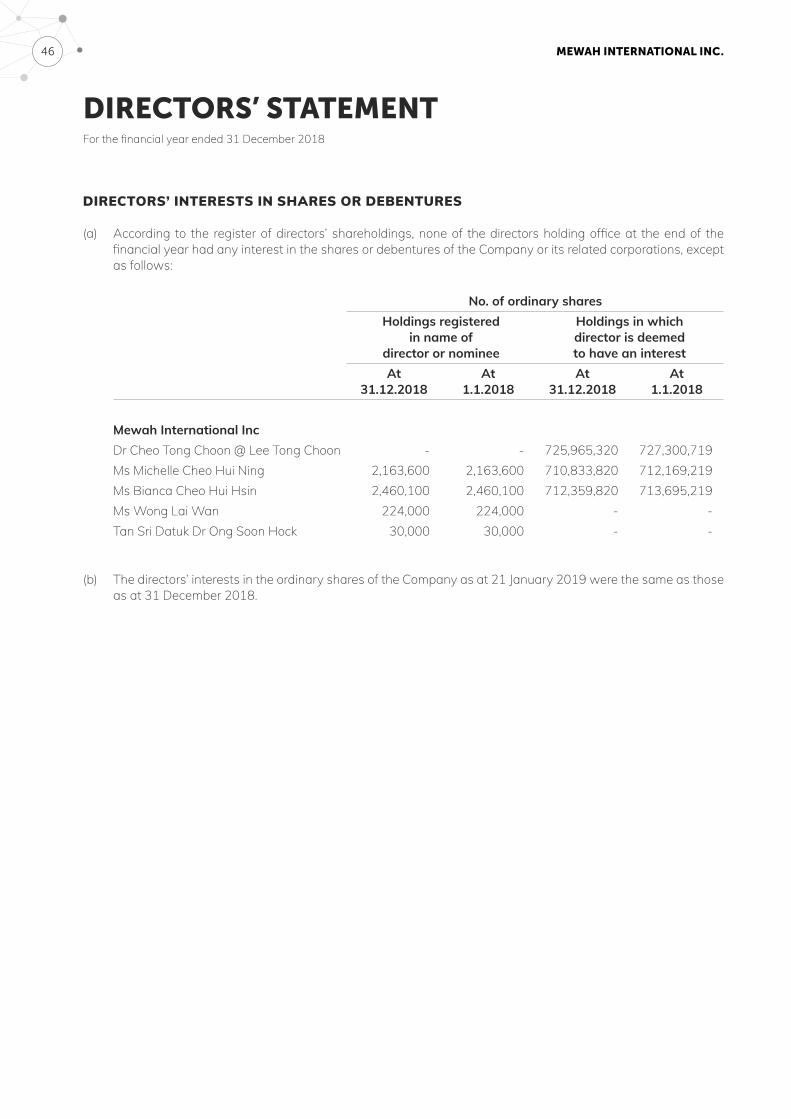
MEWAH INTERNATIONAL INC. 46
DIRECTORS’ STATEMENTFor the financial year ended 31 December 2018
DIRECTORS’ INTERESTS IN SHARES OR DEBENTURES
(a) According to the register of directors’ shareholdings, none of the directors holding office at the end of the financial year had any interest in the shares or debentures of the Company or its related corporations, except as follows:
No. of ordinary sharesHoldings registered
in name of director or nominee
Holdings in which director is deemed to have an interest
At31.12.2018
At1.1.2018
At31.12.2018
At1.1.2018
Mewah International IncDr Cheo Tong Choon @ Lee Tong Choon - - 725,965,320 727,300,719Ms Michelle Cheo Hui Ning 2,163,600 2,163,600 710,833,820 712,169,219Ms Bianca Cheo Hui Hsin 2,460,100 2,460,100 712,359,820 713,695,219Ms Wong Lai Wan 224,000 224,000 - -Tan Sri Datuk Dr Ong Soon Hock 30,000 30,000 - -
(b) The directors’ interests in the ordinary shares of the Company as at 21 January 2019 were the same as those as at 31 December 2018.
ANNUAL REPORT 2018 47
DIRECTORS’ STATEMENTFor the financial year ended 31 December 2018
AUDIT COMMITTEE
The members of the Audit Committee at the end of the financial year were as follows:
Mr Robert Loke Tan Cheng (Chairman)Tan Sri Datuk Dr Ong Soon Hock Datuk Dr Fawzia Binti Abdullah
All members of the Audit Committee were non-executive directors.
The Audit Committee carried out its functions in accordance with Section 201B(5) of the Singapore Companies Act. In performing those functions, the Committee reviewed:
• the scope and the results of internal audit procedures with the internal auditor;
• the audit plan of the Company’s independent auditor and any recommendations on internal accounting controls arising from the statutory audit;
• the assistance given by the Company’s management to the independent auditor; and
• the balance sheet of the Company and the consolidated financial statements of the Group for the financial year ended 31 December 2018 before their submission to the Board of Directors.
The Audit Committee has recommended to the Board that the independent auditor, PricewaterhouseCoopers LLP, be nominated for re-appointment at the forthcoming Annual General Meeting of the Company.
MEWAH INTERNATIONAL INC. 48
DIRECTORS’ STATEMENTFor the financial year ended 31 December 2018
INDEPENDENT AUDITOR
The independent auditor, PricewaterhouseCoopers LLP, has expressed its willingness to accept re-appointment.
On behalf of the directors
Dr Cheo Tong Choon @ Lee Tong Choon Ms Michelle Cheo Hui NingDirector Director
1 March 2019
ANNUAL REPORT 2018 49
INDEPENDENT AUDITOR’S REPORTTo the members of Mewah International Inc.
OUR OPINION
In our opinion, the accompanying consolidated financial statements of Mewah International Inc. (the “Company”) and its subsidiaries (the “Group”) and the balance sheet of the Company are properly drawn up in accordance with Singapore Financial Reporting Standards (International) [“SFRS(I)”] so as to present fairly, in all material respects, the consolidated financial position of the Group and the financial position of the Company as at 31 December 2018 and of the consolidated financial performance, consolidated changes in equity and consolidated cash flows of the Group for the financial year ended on that date.
What we have audited
The financial statements of the Company and the Group comprise:• the consolidated income statement of the Group for the financial year ended 31 December 2018;• the consolidated statement of comprehensive income of the Group for the financial year then ended;• the balance sheet of the Group as at 31 December 2018;• the balance sheet of the Company as at 31 December 2018;• the consolidated statement of changes in equity of the Group for the financial year then ended;• the consolidated statement of cash flows of the Group for the financial year then ended; and• the notes to the financial statements, including a summary of significant accounting policies.
BASIS FOR OPINION
We conducted our audit in accordance with Singapore Standards on Auditing (“SSAs”). Our responsibilities under those standards are further described in the Auditor’s Responsibilities for the Audit of the Financial Statements section of our report.
We believe that the audit evidence we have obtained is sufficient and appropriate to provide a basis for our opinion.
Independence
We are independent of the Group in accordance with the Accounting and Corporate Regulatory Authority Code of Professional Conduct and Ethics for Public Accountants and Accounting Entities (“ACRA Code”) together with the ethical requirements that are relevant to our audit of the financial statements in Singapore, and we have fulfilled our other ethical responsibilities in accordance with these requirements and the ACRA Code.
OUR AUDIT APPROACH
As part of designing our audit, we determined materiality and assessed the risks of material misstatement in the accompanying financial statements. In particular, we considered where management made subjective judgements; for example, in respect of significant accounting estimates that involved making assumptions and considering future events that are inherently uncertain. As in all of our audits, we also addressed the risk of management override of internal controls, including among other matters consideration of whether there was evidence of bias that represented a risk of material misstatement due to fraud.
Key Audit Matters
Key audit matters are those matters that, in our professional judgement, were of most significance in our audit of the financial statements for the financial year ended 31 December 2018. These matters were addressed in the context of our audit of the financial statements as a whole, and in forming our opinion thereon, and we do not provide a separate opinion on these matters.
MEWAH INTERNATIONAL INC. 50
INDEPENDENT AUDITOR’S REPORTTo the members of Mewah International Inc. (continued)
Key Audit Matters (continued)
Key Audit Matter How our audit addressed the Key Audit Matter
Valuation of commodities forward contracts
At 31 December 2018, the Group has recognised the following fair values of derivative financial assets/(liabilities) as disclosed in Note 16 to the financial statements:
• Commodities forward contracts included within current assets: US$51,640,000
• Commodities forward contracts included within current liabilities: US$16,039,000
• Commodities forward contracts included within non-current assets: US$483,000
As these commodities forward contracts are not traded in an active market, the related fair values are estimated using a level 2 valuation technique as described in Note 32(e) to the financial statements.
We focused on the valuation of the Group’s commodities forward contracts because of the critical accounting estimates involved in determining the indicative market prices which are used in the valuation of these contracts, as disclosed in Note 3(a) to the financial statements.
We held discussions with management to understand the determination of the fair values of these commodities forward contracts.
With the assistance of our internal valuation specialists, we assessed the appropriateness of the level 2 valuation technique adopted by management by evaluating the appropriateness of the valuation methodology and the basis of indicative market prices used by management. We also independently verified these indicative market prices to external sources.
On a sample basis, we tested management’s computation of the fair values of derivative financial assets/(liabilities).
Based on the work performed, we found the valuation methodology to be appropriate and the indicative market prices used by management to be within acceptable range.
OTHER INFORMATION
Management is responsible for the other information. The other information comprises the Directors’ Statement (but does not include the financial statements and our auditor’s report thereon), which we obtained prior to the date of this auditor’s report, and the other sections of the annual report (“the Other Sections”), which are expected to be made available to us after that date.
Our opinion on the financial statements does not cover the other information and we do not and will not express any form of assurance conclusion thereon.
In connection with our audit of the financial statements, our responsibility is to read the other information identified above and, in doing so, consider whether the other information is materially inconsistent with the financial statements or our knowledge obtained in the audit, or otherwise appears to be materially misstated.
If, based on the work we have performed on the other information that we obtained prior to the date of this auditor’s report, we conclude that there is a material misstatement of this other information, we are required to report that fact. We have nothing to report in this regard.
When we read the Other Sections, if we conclude that there is a material misstatement therein, we are required to communicate the matter to those charged with governance and take appropriate actions in accordance with SSAs.
ANNUAL REPORT 2018 51
INDEPENDENT AUDITOR’S REPORTTo the members of Mewah International Inc. (continued)
RESPONSIBILITIES OF MANAGEMENT AND DIRECTORS FOR THE FINANCIAL STATEMENTS
Management is responsible for the preparation and fair presentation of financial statements in accordance with SFRS(I) and for such internal control as management determines is necessary to enable the preparation of financial statements that are free from material misstatement, whether due to fraud or error.
In preparing the financial statements, management is responsible for assessing the Group’s ability to continue as a going concern, disclosing, as applicable, matters related to going concern and using the going concern basis of accounting unless management either intends to liquidate the Group or to cease operations, or has no realistic alternative but to do so.
The directors are responsible for overseeing the Group’s financial reporting process.
AUDITOR’S RESPONSIBILITIES FOR THE AUDIT OF THE FINANCIAL STATEMENTS
Our objectives are to obtain reasonable assurance about whether the financial statements as a whole are free from material misstatement, whether due to fraud or error, and to issue an auditor’s report that includes our opinion. Reasonable assurance is a high level of assurance, but is not a guarantee that an audit conducted in accordance with SSAs will always detect a material misstatement when it exists. Misstatements can arise from fraud or error and are considered material if, individually or in the aggregate, they could reasonably be expected to influence the economic decisions of users taken on the basis of these financial statements.
As part of an audit in accordance with SSAs, we exercise professional judgement and maintain professional scepticism throughout the audit. We also:
• Identify and assess the risks of material misstatement of the financial statements, whether due to fraud or error, design and perform audit procedures responsive to those risks, and obtain audit evidence that is sufficient and appropriate to provide a basis for our opinion. The risk of not detecting a material misstatement resulting from fraud is higher than for one resulting from error, as fraud may involve collusion, forgery, intentional omissions, misrepresentations, or the override of internal control.
• Obtain an understanding of internal control relevant to the audit in order to design audit procedures that are appropriate in the circumstances, but not for the purpose of expressing an opinion on the effectiveness of the Group’s internal control.
• Evaluate the appropriateness of accounting policies used and the reasonableness of accounting estimates and related disclosures made by management.
• Conclude on the appropriateness of management’s use of the going concern basis of accounting and, based on the audit evidence obtained, whether a material uncertainty exists related to events or conditions that may cast significant doubt on the Group’s ability to continue as a going concern. If we conclude that a material uncertainty exists, we are required to draw attention in our auditor’s report to the related disclosures in the financial statements or, if such disclosures are inadequate, to modify our opinion. Our conclusions are based on the audit evidence obtained up to the date of our auditor’s report. However, future events or conditions may cause the Group to cease to continue as a going concern.
• Evaluate the overall presentation, structure and content of the financial statements, including the disclosures, and whether the financial statements represent the underlying transactions and events in a manner that achieves fair presentation.
• Obtain sufficient appropriate audit evidence regarding the financial information of the entities or business activities within the Group to express an opinion on the consolidated financial statements. We are responsible for the direction, supervision and performance of the group audit. We remain solely responsible for our audit opinion.
MEWAH INTERNATIONAL INC. 52
INDEPENDENT AUDITOR’S REPORTTo the members of Mewah International Inc. (continued)
AUDITOR’S RESPONSIBILITIES FOR THE AUDIT OF THE FINANCIAL STATEMENTS (continued)
We communicate with the directors regarding, among other matters, the planned scope and timing of the audit and significant audit findings, including any significant deficiencies in internal control that we identify during our audit.
We also provide the directors with a statement that we have complied with relevant ethical requirements regarding independence, and to communicate with them all relationships and other matters that may reasonably be thought to bear on our independence, and where applicable, related safeguards.
From the matters communicated with the directors, we determine those matters that were of most significance in the audit of the financial statements of the current period and are therefore the key audit matters. We describe these matters in our auditor’s report unless law or regulation precludes public disclosure about the matter or when, in extremely rare circumstances, we determine that a matter should not be communicated in our report because the adverse consequences of doing so would reasonably be expected to outweigh the public interest benefits of such communication.
The engagement partner on the audit resulting in this independent auditor’s report is Tan Bee Nah.
PricewaterhouseCoopers LLPPublic Accountants and Chartered AccountantsSingapore, 1 March 2019
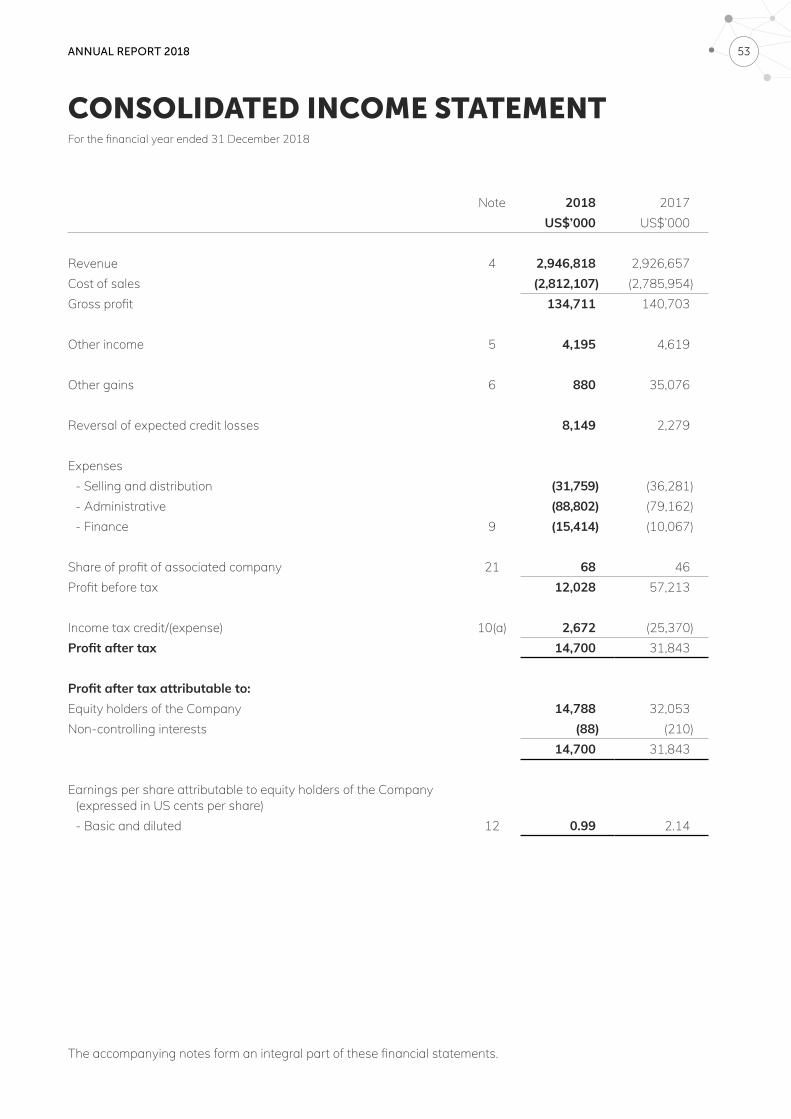
ANNUAL REPORT 2018 53
CONSOLIDATED INCOME STATEMENTFor the financial year ended 31 December 2018
Note 2018 2017US$’000 US$’000
Revenue 4 2,946,818 2,926,657Cost of sales (2,812,107) (2,785,954)Gross profit 134,711 140,703
Other income 5 4,195 4,619
Other gains 6 880 35,076
Reversal of expected credit losses 8,149 2,279
Expenses- Selling and distribution (31,759) (36,281)- Administrative (88,802) (79,162)- Finance 9 (15,414) (10,067)
Share of profit of associated company 21 68 46Profit before tax 12,028 57,213
Income tax credit/(expense) 10(a) 2,672 (25,370)Profit after tax 14,700 31,843
Profit after tax attributable to:Equity holders of the Company 14,788 32,053Non-controlling interests (88) (210)
14,700 31,843
Earnings per share attributable to equity holders of the Company (expressed in US cents per share)- Basic and diluted 12 0.99 2.14
The accompanying notes form an integral part of these financial statements.
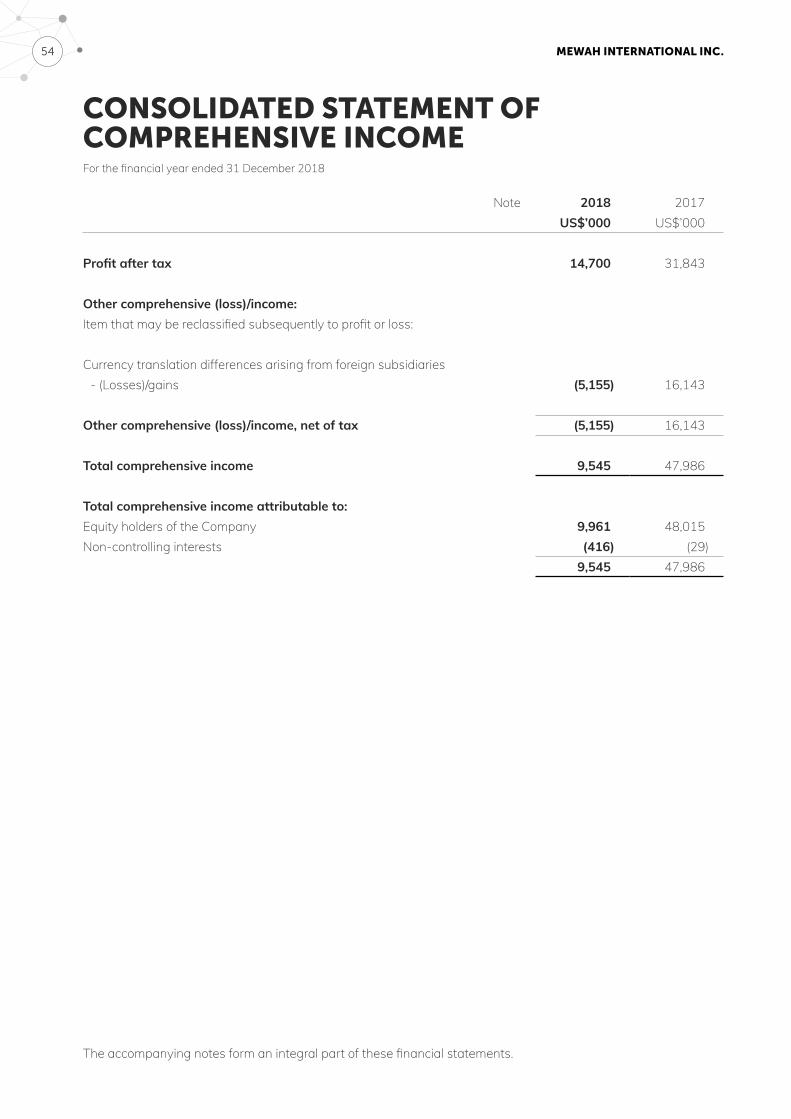
MEWAH INTERNATIONAL INC. 54
CONSOLIDATED STATEMENT OF COMPREHENSIVE INCOMEFor the financial year ended 31 December 2018
Note 2018 2017US$’000 US$’000
Profit after tax 14,700 31,843
Other comprehensive (loss)/income:Item that may be reclassified subsequently to profit or loss:
Currency translation differences arising from foreign subsidiaries- (Losses)/gains (5,155) 16,143
Other comprehensive (loss)/income, net of tax (5,155) 16,143
Total comprehensive income 9,545 47,986
Total comprehensive income attributable to:Equity holders of the Company 9,961 48,015Non-controlling interests (416) (29)
9,545 47,986
The accompanying notes form an integral part of these financial statements.
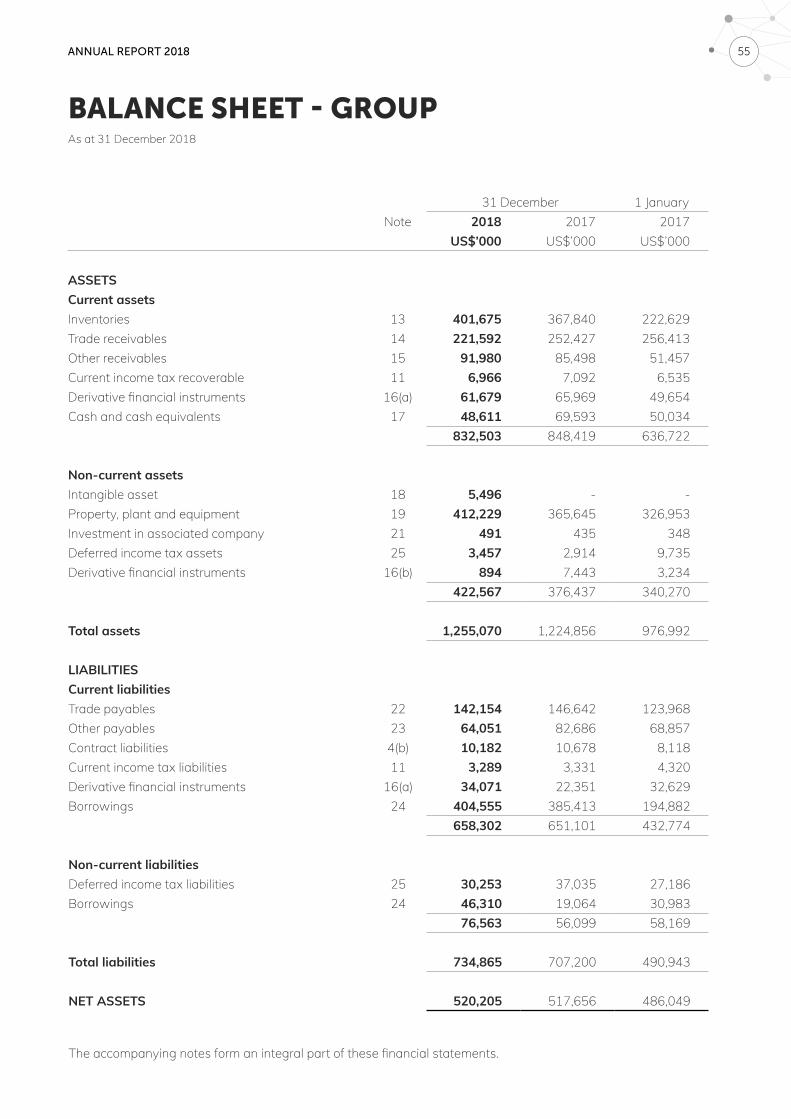
ANNUAL REPORT 2018 55
BALANCE SHEET - GROUPAs at 31 December 2018
31 December 1 JanuaryNote 2018 2017 2017
US$’000 US$’000 US$’000
ASSETSCurrent assetsInventories 13 401,675 367,840 222,629Trade receivables 14 221,592 252,427 256,413Other receivables 15 91,980 85,498 51,457Current income tax recoverable 11 6,966 7,092 6,535Derivative financial instruments 16(a) 61,679 65,969 49,654Cash and cash equivalents 17 48,611 69,593 50,034
832,503 848,419 636,722
Non-current assetsIntangible asset 18 5,496 - -Property, plant and equipment 19 412,229 365,645 326,953Investment in associated company 21 491 435 348Deferred income tax assets 25 3,457 2,914 9,735Derivative financial instruments 16(b) 894 7,443 3,234
422,567 376,437 340,270
Total assets 1,255,070 1,224,856 976,992
LIABILITIESCurrent liabilitiesTrade payables 22 142,154 146,642 123,968Other payables 23 64,051 82,686 68,857Contract liabilities 4(b) 10,182 10,678 8,118Current income tax liabilities 11 3,289 3,331 4,320Derivative financial instruments 16(a) 34,071 22,351 32,629Borrowings 24 404,555 385,413 194,882
658,302 651,101 432,774
Non-current liabilitiesDeferred income tax liabilities 25 30,253 37,035 27,186Borrowings 24 46,310 19,064 30,983
76,563 56,099 58,169
Total liabilities 734,865 707,200 490,943
NET ASSETS 520,205 517,656 486,049
The accompanying notes form an integral part of these financial statements.
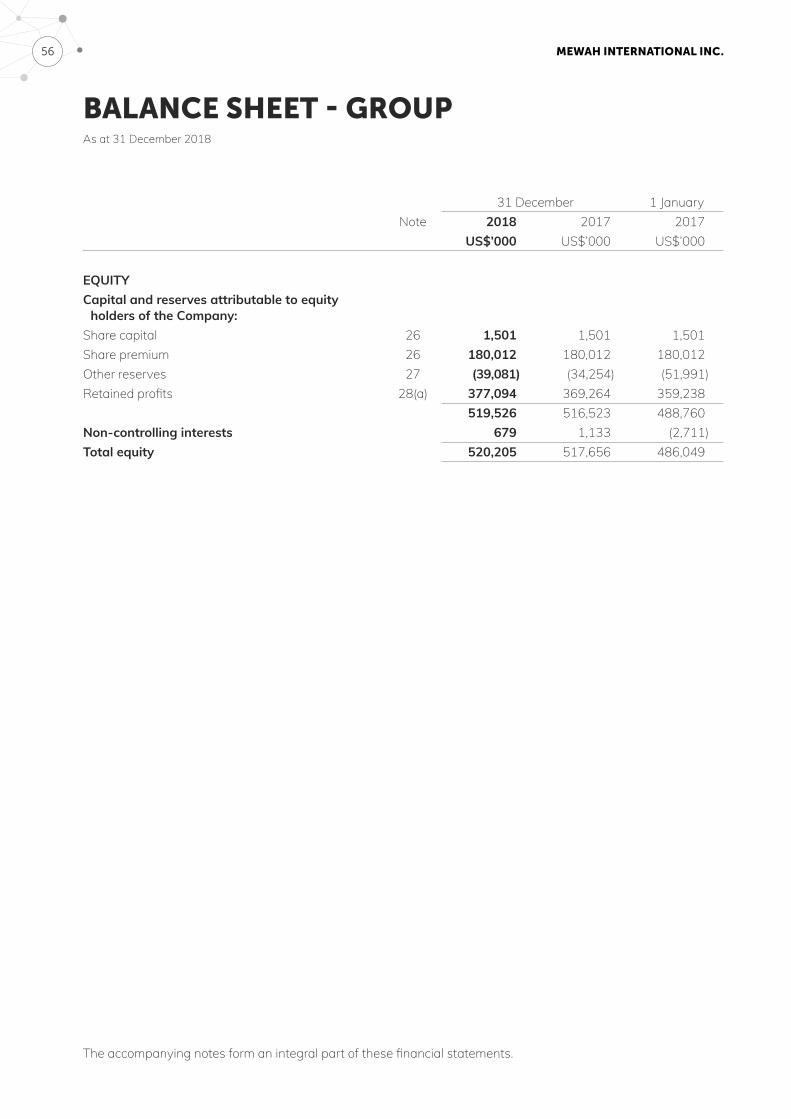
MEWAH INTERNATIONAL INC. 56
BALANCE SHEET - GROUPAs at 31 December 2018
The accompanying notes form an integral part of these financial statements.
31 December 1 JanuaryNote 2018 2017 2017
US$’000 US$’000 US$’000
EQUITYCapital and reserves attributable to equity
holders of the Company:Share capital 26 1,501 1,501 1,501Share premium 26 180,012 180,012 180,012Other reserves 27 (39,081) (34,254) (51,991)Retained profits 28(a) 377,094 369,264 359,238
519,526 516,523 488,760Non-controlling interests 679 1,133 (2,711)Total equity 520,205 517,656 486,049
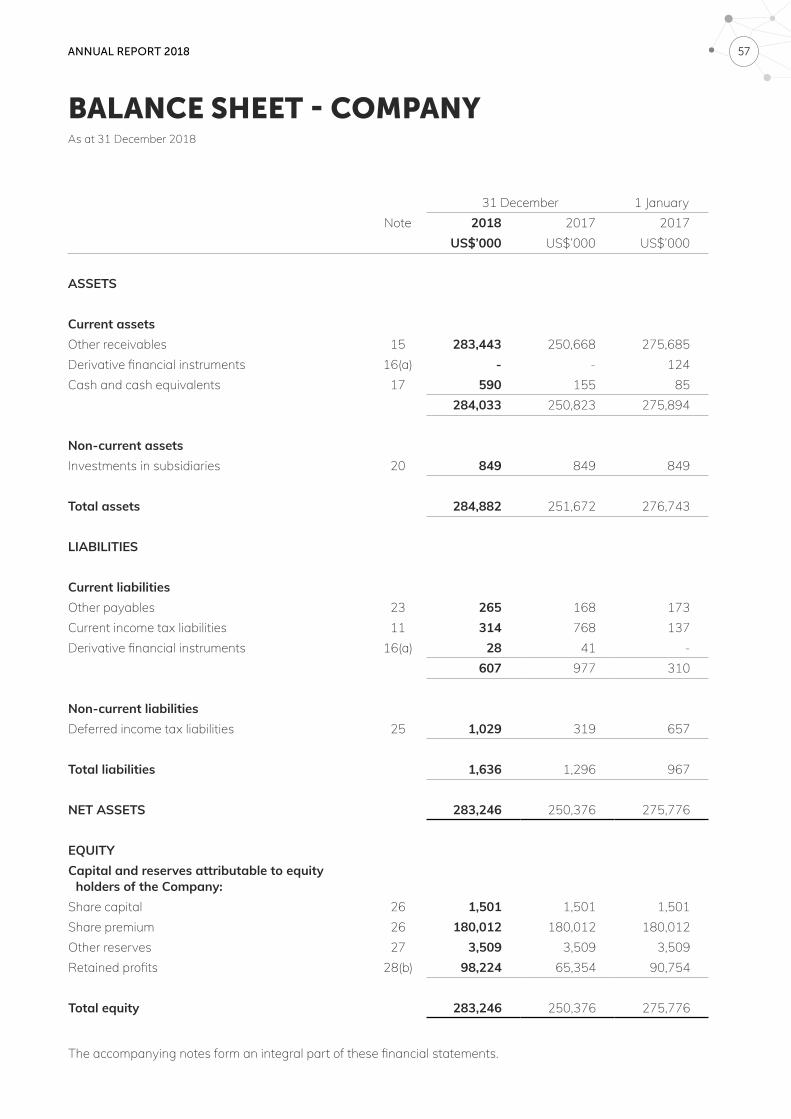
ANNUAL REPORT 2018 57
BALANCE SHEET - COMPANYAs at 31 December 2018
31 December 1 JanuaryNote 2018 2017 2017
US$’000 US$’000 US$’000
ASSETS
Current assetsOther receivables 15 283,443 250,668 275,685Derivative financial instruments 16(a) - - 124Cash and cash equivalents 17 590 155 85
284,033 250,823 275,894
Non-current assetsInvestments in subsidiaries 20 849 849 849
Total assets 284,882 251,672 276,743
LIABILITIES
Current liabilitiesOther payables 23 265 168 173Current income tax liabilities 11 314 768 137Derivative financial instruments 16(a) 28 41 -
607 977 310
Non-current liabilitiesDeferred income tax liabilities 25 1,029 319 657
Total liabilities 1,636 1,296 967
NET ASSETS 283,246 250,376 275,776
EQUITYCapital and reserves attributable to equity
holders of the Company:Share capital 26 1,501 1,501 1,501Share premium 26 180,012 180,012 180,012Other reserves 27 3,509 3,509 3,509Retained profits 28(b) 98,224 65,354 90,754
Total equity 283,246 250,376 275,776
The accompanying notes form an integral part of these financial statements.
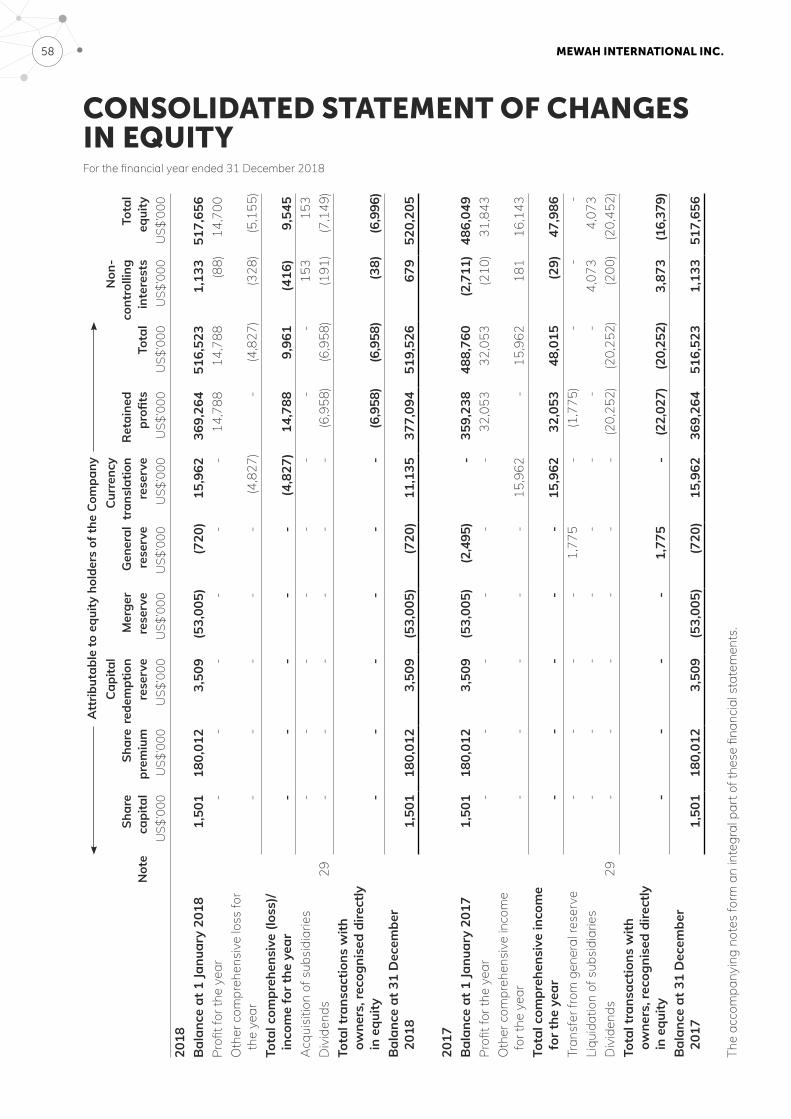
MEWAH INTERNATIONAL INC. 58
CONSOLIDATED STATEMENT OF CHANGES IN EQUITYFor the financial year ended 31 December 2018
The
acco
mpa
nyin
g no
tes
form
an
inte
gral
par
t of t
hese
fina
ncia
l sta
tem
ents
.
Att
ribut
able
to e
quity
hol
ders
of t
he C
ompa
ny
Not
eSh
are
capi
tal
Shar
e pr
emiu
m
Capi
tal
rede
mpt
ion
rese
rve
Mer
ger
rese
rve
Gen
eral
re
serv
e
Curr
ency
tr
ansl
atio
n re
serv
eR
etai
ned
profi
tsTo
tal
Non
-co
ntro
lling
in
tere
sts
Tota
l eq
uity
U
S$’0
00U
S$’0
00U
S$’0
00U
S$’0
00U
S$’0
00U
S$’0
00U
S$’0
00U
S$’0
00U
S$’0
00U
S$’0
0020
18B
alan
ce a
t 1 Ja
nuar
y 20
181,
501
180,
012
3,50
9(5
3,00
5)(7
20)
15,9
6236
9,26
451
6,52
31,
133
517,
656
Profi
t for
the
year
--
--
--
14,7
8814
,788
(88)
14,7
00O
ther
com
preh
ensi
ve lo
ss fo
r th
e ye
ar-
--
--
(4,8
27)
-(4
,827
)(3
28)
(5,1
55)
Tota
l com
preh
ensi
ve (l
oss)
/in
com
e fo
r the
yea
r-
--
--
(4,8
27)
14,7
889,
961
(416
)9,
545
Acq
uisi
tion
of s
ubsi
diar
ies
--
--
--
--
153
153
Div
iden
ds29
--
--
--
(6,9
58)
(6,9
58)
(191
)(7
,149
)To
tal t
rans
actio
ns w
ith
owne
rs, r
ecog
nise
d di
rect
ly
in e
quity
--
--
--
(6,9
58)
(6,9
58)
(38)
(6,9
96)
Bal
ance
at 3
1 D
ecem
ber
2018
1,50
118
0,01
23,
509
(53,
005)
(720
)11
,135
377,
094
519,
526
679
520,
205
2017
Bal
ance
at 1
Janu
ary
2017
1,50
118
0,01
23,
509
(53,
005)
(2,4
95)
-35
9,23
848
8,76
0(2
,711
)48
6,04
9Pr
ofit f
or th
e ye
ar-
--
--
-32
,053
32
,053
(210
)31
,843
O
ther
com
preh
ensi
ve in
com
e fo
r the
yea
r-
--
--
15,9
62-
15,9
6218
116
,143
Tota
l com
preh
ensi
ve in
com
e fo
r the
yea
r-
--
--
15,9
6232
,053
48,0
15(2
9)47
,986
Tran
sfer
from
gen
eral
rese
rve
--
--
1,77
5-
(1,7
75)
--
-Li
quid
atio
n of
sub
sidi
arie
s-
--
--
--
-4,
073
4,07
3D
ivid
ends
29-
--
--
-(2
0,25
2)(2
0,25
2)(2
00)
(20,
452)
Tota
l tra
nsac
tions
with
ow
ners
, rec
ogni
sed
dire
ctly
in
equ
ity-
--
-1,
775
-(2
2,02
7)(2
0,25
2)3,
873
(16,
379)
Bal
ance
at 3
1 D
ecem
ber
2017
1,50
118
0,01
23,
509
(53,
005)
(720
)15
,962
369,
264
516,
523
1,13
351
7,65
6
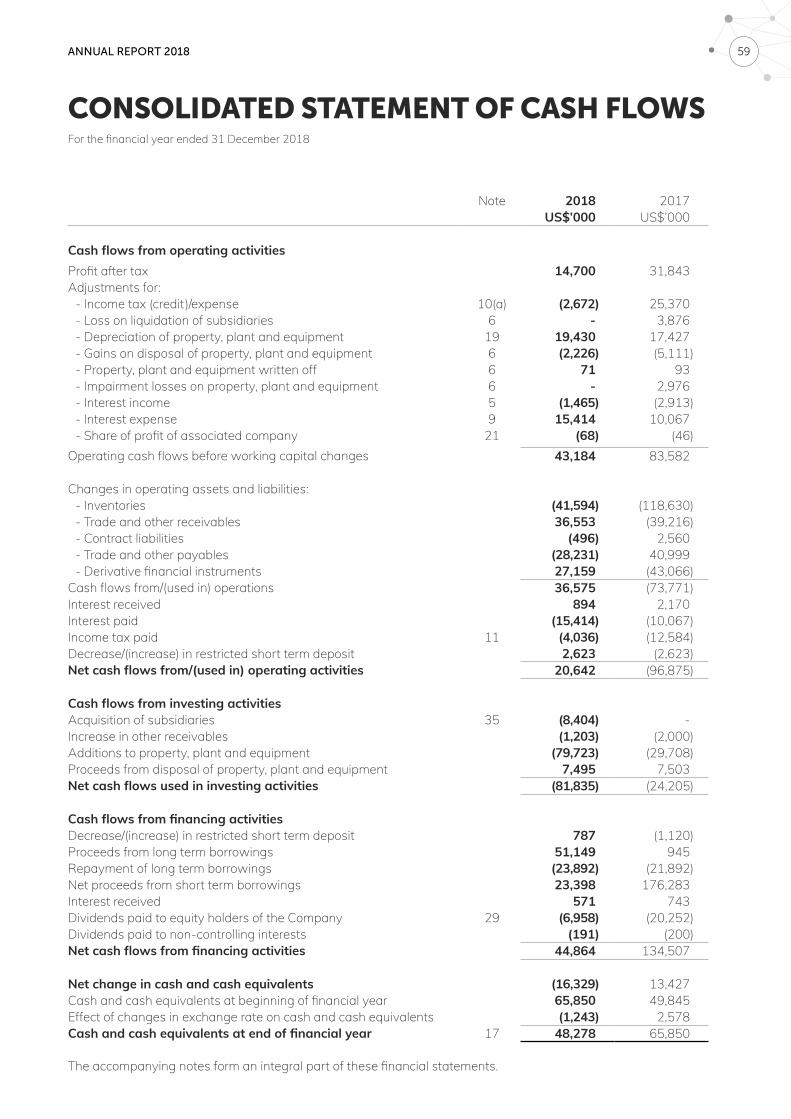
ANNUAL REPORT 2018 59
CONSOLIDATED STATEMENT OF CASH FLOWSFor the financial year ended 31 December 2018
Note 2018 2017US$’000 US$’000
Cash flows from operating activities Profit after tax 14,700 31,843Adjustments for:
- Income tax (credit)/expense 10(a) (2,672) 25,370- Loss on liquidation of subsidiaries 6 - 3,876- Depreciation of property, plant and equipment 19 19,430 17,427- Gains on disposal of property, plant and equipment 6 (2,226) (5,111)- Property, plant and equipment written off 6 71 93- Impairment losses on property, plant and equipment 6 - 2,976- Interest income 5 (1,465) (2,913)- Interest expense 9 15,414 10,067- Share of profit of associated company 21 (68) (46)
Operating cash flows before working capital changes 43,184 83,582
Changes in operating assets and liabilities:- Inventories (41,594) (118,630)- Trade and other receivables 36,553 (39,216)- Contract liabilities (496) 2,560- Trade and other payables (28,231) 40,999- Derivative financial instruments 27,159 (43,066)
Cash flows from/(used in) operations 36,575 (73,771)Interest received 894 2,170Interest paid (15,414) (10,067)Income tax paid 11 (4,036) (12,584)Decrease/(increase) in restricted short term deposit 2,623 (2,623)Net cash flows from/(used in) operating activities 20,642 (96,875)
Cash flows from investing activitiesAcquisition of subsidiaries 35 (8,404) -Increase in other receivables (1,203) (2,000)Additions to property, plant and equipment (79,723) (29,708)Proceeds from disposal of property, plant and equipment 7,495 7,503Net cash flows used in investing activities (81,835) (24,205)
Cash flows from financing activitiesDecrease/(increase) in restricted short term deposit 787 (1,120)Proceeds from long term borrowings 51,149 945Repayment of long term borrowings (23,892) (21,892)Net proceeds from short term borrowings 23,398 176,283Interest received 571 743Dividends paid to equity holders of the Company 29 (6,958) (20,252)Dividends paid to non-controlling interests (191) (200)Net cash flows from financing activities 44,864 134,507
Net change in cash and cash equivalents (16,329) 13,427Cash and cash equivalents at beginning of financial year 65,850 49,845Effect of changes in exchange rate on cash and cash equivalents (1,243) 2,578Cash and cash equivalents at end of financial year 17 48,278 65,850
The accompanying notes form an integral part of these financial statements.
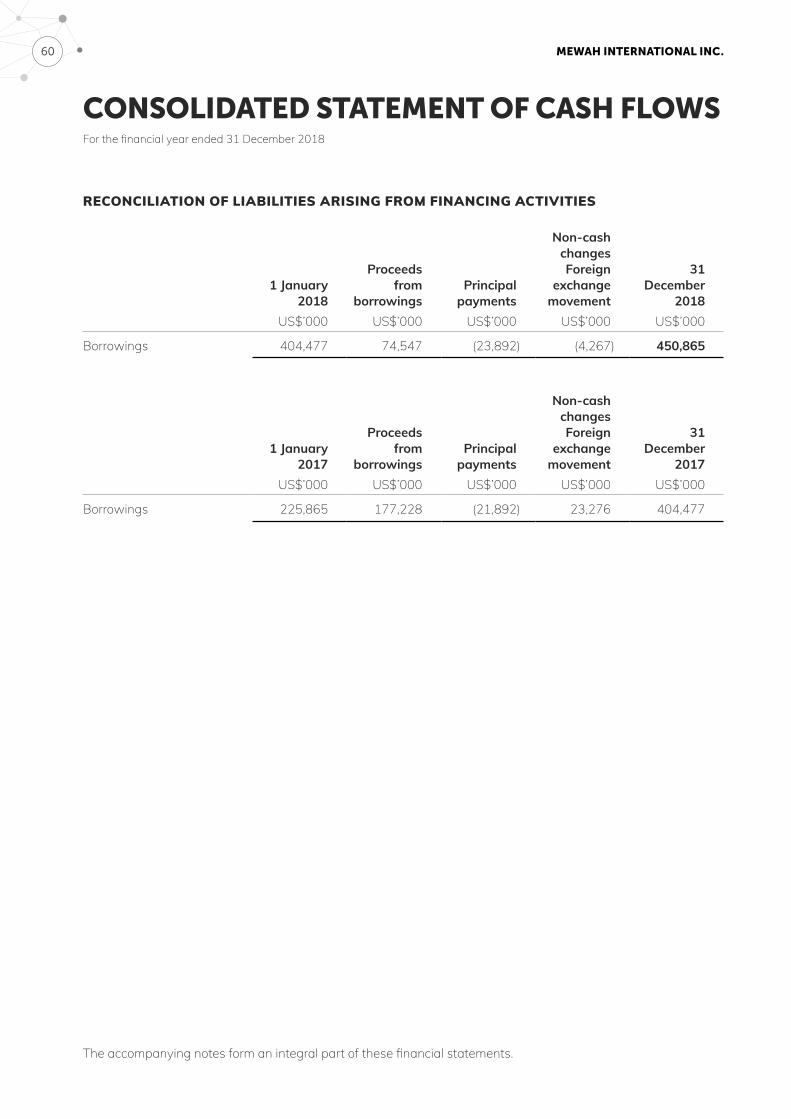
MEWAH INTERNATIONAL INC. 60
CONSOLIDATED STATEMENT OF CASH FLOWSFor the financial year ended 31 December 2018
RECONCILIATION OF LIABILITIES ARISING FROM FINANCING ACTIVITIES
1 January2018
Proceeds from
borrowingsPrincipal
payments
Non-cash changes Foreign
exchange movement
31 December
2018US$’000 US$’000 US$’000 US$’000 US$’000
Borrowings 404,477 74,547 (23,892) (4,267) 450,865
1 January2017
Proceeds from
borrowingsPrincipal
payments
Non-cash changes Foreign
exchange movement
31 December
2017US$’000 US$’000 US$’000 US$’000 US$’000
Borrowings 225,865 177,228 (21,892) 23,276 404,477
The accompanying notes form an integral part of these financial statements.
ANNUAL REPORT 2018 61
NOTES TO THE FINANCIAL STATEMENTSFor the financial year ended 31 December 2018
These notes form an integral part of and should be read in conjunction with the accompanying financial statements.
1. GENERAL INFORMATION
Mewah International Inc. (the “Company”) is listed on the Singapore Exchange and incorporated and domiciled in the Cayman Islands. The address of its registered office is Harbour Place, 2nd Floor, 103 South Church Street, P.O. Box 472, George Town, Grand Cayman, KY1-1106, Cayman Islands. The principal place of business of the Company is at 5, International Business Park, #05-00, Mewah Building, Singapore 609914.
The principal activity of the Company is that of investment holding. The principal activities of its significant subsidiaries are disclosed in Note 38 of the financial statements.
2. SIGNIFICANT ACCOUNTING POLICIES
2.1 Basis of preparation
These financial statements have been prepared in accordance with the Singapore Financial Reporting Standards (International) (“SFRS(I)”) under the historical cost convention, except as disclosed in the accounting policies below.
The preparation of financial statements in conformity with SFRS(I) requires management to exercise its judgement in the process of applying the Group’s accounting policies. It also requires the use of certain critical accounting estimates and assumptions. The areas involving a higher degree of judgement or complexity, or areas where assumptions and estimates are significant to the financial statements, are disclosed in Note 3.
2.2 Adoption of SFRS(I)
As required by the listing requirements of Singapore Exchange, the Group has adopted SFRS(I) on 1 January 2018. These financial statements for the financial year ended 31 December 2018 are the first set of financial statements the Group prepared in accordance with SFRS(I). The Group’s previously issued financial statements for periods up to and including the financial year ended 31 December 2017 were prepared in accordance with Singapore Financial Reporting Standards (“SFRS”).
In adopting SFRS(I) on 1 January 2018, the Group is required to apply all of the specific transition requirements in SFRS(I) 1 First-time Adoption of SFRS(I).
MEWAH INTERNATIONAL INC. 62
NOTES TO THE FINANCIAL STATEMENTSFor the financial year ended 31 December 2018
2. SIGNIFICANT ACCOUNTING POLICIES (continued)
2.2 Adoption of SFRS(I) (continued)
Under SFRS(I) 1, these financial statements are required to be prepared using accounting policies that comply with SFRS(I) effective as at 31 December 2018. The same accounting policies are applied throughout all periods presented in these financial statements, subject to the mandatory exceptions and optional exemptions under SFRS(I) 1.
The Group’s opening balance sheet has been prepared as at 1 January 2017, which is the Group’s date of transition to SFRS(I) (“date of transition”).
(a) Optional exemptions applied
SFRS(I) 1 allows the exemption from application of certain requirements under SFRS(I) on a retrospective basis. The Group has applied the following exemptions in preparing this first set of financial statements in accordance with SFRS(I):
(i) Deemed cost
The Group has elected to regard the carrying amount of certain property, plant and equipment as their deemed cost at the date of transition to SFRS(I) on 1 January 2017.
(ii) Cumulative translation differences
The Group has elected to deem the cumulative translation differences for all foreign operations to be zero as at the date of transition to SFRS(I) on 1 January 2017.
(iii) Short-term exemption on adoption of SFRS(I) 9 Financial Instruments
The Group has elected to apply the short-term exemption to adopt SFRS(I) 9 on 1 January 2018. Accordingly, the requirements of SFRS 39 Financial Instruments: Recognition and Measurement are applied to financial instruments up to the financial year ended 31 December 2017. The Group is also exempted from complying with SFRS(I) 7 Financial Instruments: Disclosure to the extent that the disclosures required by SFRS(I) 7 relate to the items within scope of SFRS(I) 9.
As a result, the requirements under SFRS are applied in place of the requirements under SFRS(I) 7 and SFRS(I) 9 to comparative information about items within scope of SFRS(I) 9.
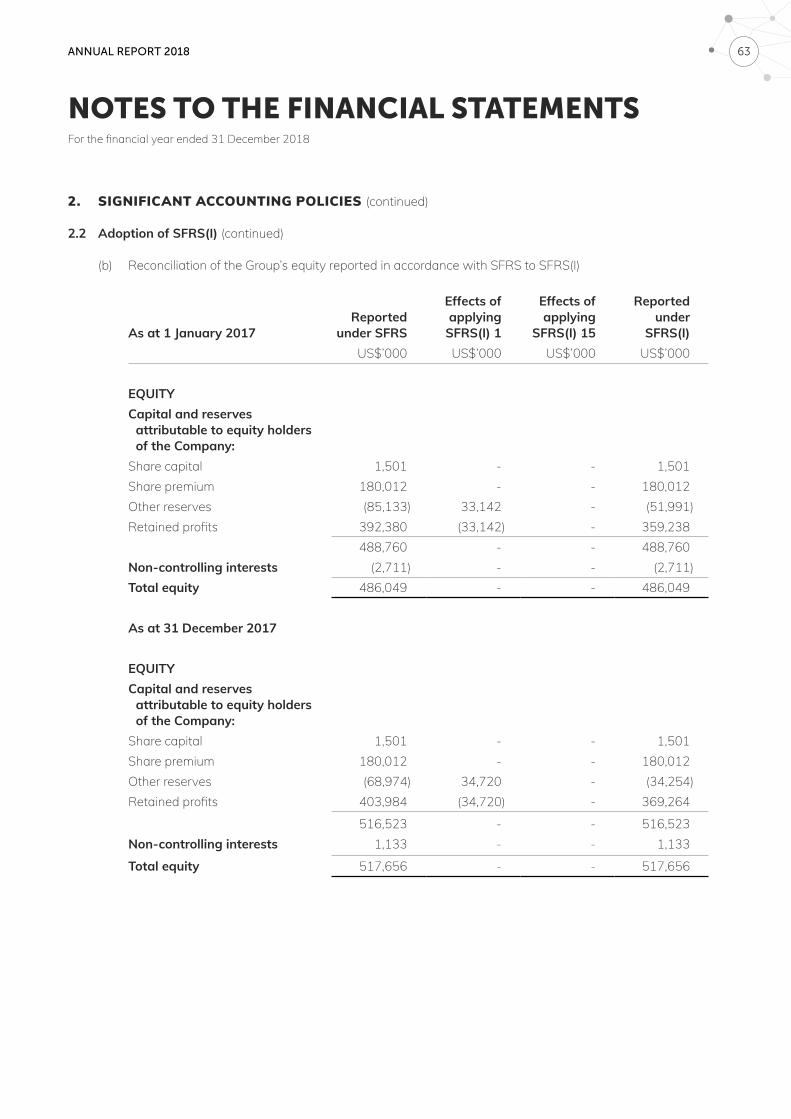
ANNUAL REPORT 2018 63
NOTES TO THE FINANCIAL STATEMENTSFor the financial year ended 31 December 2018
2. SIGNIFICANT ACCOUNTING POLICIES (continued)
2.2 Adoption of SFRS(I) (continued)
(b) Reconciliation of the Group’s equity reported in accordance with SFRS to SFRS(I)
As at 1 January 2017Reported
under SFRS
Effects of applying
SFRS(I) 1
Effects of applying
SFRS(I) 15
Reported under
SFRS(I)US$’000 US$’000 US$’000 US$’000
EQUITYCapital and reserves
attributable to equity holders of the Company:
Share capital 1,501 - - 1,501Share premium 180,012 - - 180,012Other reserves (85,133) 33,142 - (51,991)Retained profits 392,380 (33,142) - 359,238
488,760 - - 488,760Non-controlling interests (2,711) - - (2,711)Total equity 486,049 - - 486,049
As at 31 December 2017
EQUITYCapital and reserves
attributable to equity holders of the Company:
Share capital 1,501 - - 1,501Share premium 180,012 - - 180,012Other reserves (68,974) 34,720 - (34,254)Retained profits 403,984 (34,720) - 369,264
516,523 - - 516,523Non-controlling interests 1,133 - - 1,133
Total equity 517,656 - - 517,656
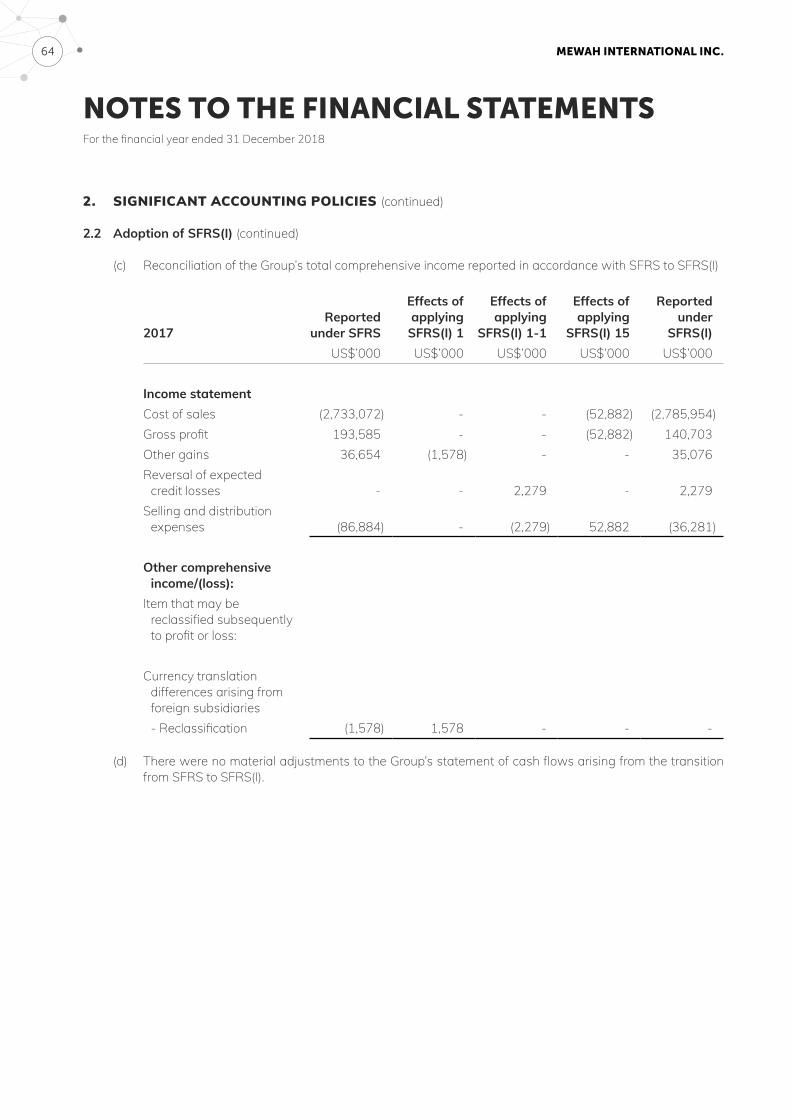
MEWAH INTERNATIONAL INC. 64
NOTES TO THE FINANCIAL STATEMENTSFor the financial year ended 31 December 2018
2. SIGNIFICANT ACCOUNTING POLICIES (continued)
2.2 Adoption of SFRS(I) (continued)
(c) Reconciliation of the Group’s total comprehensive income reported in accordance with SFRS to SFRS(I)
2017Reported
under SFRS
Effects of applying
SFRS(I) 1
Effects of applying
SFRS(I) 1-1
Effects of applying
SFRS(I) 15
Reported under
SFRS(I)US$’000 US$’000 US$’000 US$’000 US$’000
Income statementCost of sales (2,733,072) - - (52,882) (2,785,954)Gross profit 193,585 - - (52,882) 140,703Other gains 36,654 (1,578) - - 35,076Reversal of expected
credit losses - - 2,279 - 2,279Selling and distribution
expenses (86,884) - (2,279) 52,882 (36,281)
Other comprehensive income/(loss):
Item that may be reclassified subsequently to profit or loss:
Currency translation differences arising from foreign subsidiaries- Reclassification (1,578) 1,578 - - -
(d) There were no material adjustments to the Group’s statement of cash flows arising from the transition from SFRS to SFRS(I).
ANNUAL REPORT 2018 65
NOTES TO THE FINANCIAL STATEMENTSFor the financial year ended 31 December 2018
2. SIGNIFICANT ACCOUNTING POLICIES (continued)
2.2 Adoption of SFRS(I) (continued)
Explanatory notes to reconciliations:
The effects of transition to SFRS(I) mainly arises from the optional exemptions provided for under SFRS(I) 1 and the adoption of SFRS(I) 9 Financial Instruments and SFRS(I) 15 Revenue from Contracts with Customers.
A. Optional exemptions
As disclosed in Note 2.2(a), the Group has applied certain exemptions in preparing this first set of financial statements in accordance with SFRS(I). The exemptions that resulted in adjustments to the previously issued SFRS financial statements are as follows:
A1. Carrying amount as deemed costs on property, plant and equipment
As disclosed in Note 2.2(a)(i), the Group has elected to regard the carrying amount of certain property, plant and equipment as their deemed cost at the date of transition to SFRS(I) on 1 January 2017.
As a result, the Group’s asset revaluation reserve was reclassified directly into retained profits on the date of initial adoption and other reserves and retained profits as at 1 January 2017 and 1 January 2018 were reduced/increased by US$8,518,000 respectively.
A2. Cumulative translation differences
As disclosed in Note 2.2(a)(ii), the Group has elected to deem the cumulative translation differences for all foreign operations to be zero at the date of transition to SFRS(I) on 1 January 2017. As a result, other reserves and retained profits as at 1 January 2017 and 1 January 2018 were increased/reduced by US$41,660,000 and US$43,238,000 respectively.
B. Adoption of SFRS(I) 15
B1. Presentation of cost of sales
The Group has changed the presentation of certain amounts in the consolidated income statement for the financial year ended 31 December 2017 on adopting SFRS(I) 15:
(i) Freight costs and marine insurance of US$52,882,000 which were previously included in “selling and distribution expenses” under SFRS are now included in “cost of sales”.
B2. Presentation of contract liabilities
The Group has changed the presentation of certain amounts in the balance sheet as at 31 December 2017 on adopting SFRS(I) 15:
(i) Advances from customers which were previously presented as “non-trade payables to non-related parties” of US$10,678,000 (1 January 2017: US$8,118,000) under SFRS are now presented as “contract liabilities”.
MEWAH INTERNATIONAL INC. 66
2. SIGNIFICANT ACCOUNTING POLICIES (continued)
2.2 Adoption of SFRS(I) (continued)
C. Adoption of SFRS(I) 9
C1. Classification and measurement of financial assets
For financial assets held by the Group on 1 January 2018, management has assessed the business models that are applicable on that date to these assets so as to classify them into the appropriate categories under SFRS(I) 9. No reclassification is required to be made based on management’s assessment.
C2. Measurement of financial assets
The Group has the following financial assets subject to the expected credit loss impairment model under SFRS(I) 9:
(i) Trade receivables recognised under SFRS(I) 15(ii) Other receivables at amortised cost
2.3 Revenue
(a) Sale of goods
The Group produces and sells vegetable-based edible oil and fat products. Sales are recognised at a point in time when control of the products has transferred to its customer, being when the right to payment accrues, significant risks and rewards of ownership are transferred, and there is no unfulfilled obligation that could affect the customer’s acceptance of the products.
(b) Shipping services
Revenue from shipping services is recognised in the accounting period in which the services are rendered.
(c) Charter income
Revenue from time charter is recognised on a straight-line basis over the period of the time charter agreement.
Revenue from voyage charter is recognised rateably over the estimated length of the voyage within the reporting period and ends in subsequent reporting period.
The Group determines the percentage of completion of voyage freight using the load-to-discharge method. Under this method, voyage revenue is recognised rateably over the period from the departure of a vessel from the port of loading to departure from the discharge port.
Demurrage is included if a claim is considered probable.
(d) Interest income
Interest income is recognised using the effective interest method.
NOTES TO THE FINANCIAL STATEMENTSFor the financial year ended 31 December 2018
ANNUAL REPORT 2018 67
2. SIGNIFICANT ACCOUNTING POLICIES (continued)
2.3 Revenue (continued)
(e) Rental income
Rental income from operating leases (net of any incentives given to the lessees) is recognised on a straight-line basis over the lease term.
If payments by the customers are received before the sale of goods or shipping services, a contract liability is recognised.
2.4 Group accounting
(a) Subsidiaries
(i) Consolidation
Subsidiaries are all entities (including structured entities) over which the Group has control. The Group controls an entity when the Group is exposed to, or has rights to, variable returns from its involvement with the entity and has the ability to affect those returns through its power over the entity. Subsidiaries are fully consolidated from the date on which control is transferred to the Group. They are deconsolidated from the date on that control ceases.
In preparing the consolidated financial statements, transactions, balances and unrealised gains on transactions between Group entities are eliminated. Unrealised losses are also eliminated unless the transaction provides evidence of an impairment indicator of the transferred asset. Accounting policies of subsidiaries have been changed where necessary to ensure consistency with the policies adopted by the Group.
Non-controlling interests comprise the portion of a subsidiary’s net results of operations and its net assets, which is attributable to the interests that are not owned directly or indirectly by the equity holders of the Company. They are shown separately in the consolidated statement of comprehensive income, statement of changes in equity, and balance sheet. Total comprehensive income is attributed to the non-controlling interests based on their respective interests in a subsidiary, even if this results in the non-controlling interests having a deficit balance.
(ii) Acquisitions
The acquisition method of accounting is used to account for business combinations entered into by the Group, except for business combination under common control.
The consideration transferred for the acquisition of a subsidiary or business comprises the fair value of the assets transferred, the liabilities incurred and the equity interests issued by the Group. The consideration transferred also includes any contingent consideration arrangement and any pre-existing equity interest in the subsidiary measured at their fair values at the acquisition date.
Acquisition-related costs are expensed as incurred.
Identifiable assets acquired and liabilities and contingent liabilities assumed in a business combination are, with limited exceptions, measured initially at their fair values at the acquisition date.
On an acquisition-by-acquisition basis, the Group recognises any non-controlling interest in the acquiree at the date of acquisition either at fair value or at the non-controlling interest’s proportionate share of the acquiree’s identifiable net assets.
NOTES TO THE FINANCIAL STATEMENTSFor the financial year ended 31 December 2018
MEWAH INTERNATIONAL INC. 68
NOTES TO THE FINANCIAL STATEMENTSFor the financial year ended 31 December 2018
2. SIGNIFICANT ACCOUNTING POLICIES (continued)
2.4 Group accounting (continued)
(a) Subsidiaries (continued)
(ii) Acquisitions (continued)
The excess of (a) the consideration transferred, the amount of any non-controlling interest in the acquiree and the acquisition-date fair value of any previous equity interest in the acquiree over the (b) fair value of the identifiable net assets acquired is recorded as goodwill.
Acquisitions of entities under common control have been accounted for using the pooling-of-interest method. Under this method:
• The financial statements of the Group have been prepared as if the Group structure immediately after the transaction has been in existence since the earliest date the entities are under common control.
• The assets and liabilities are brought into the financial statements at their existing carrying amounts from the perspective of the controlling party.
• The income statement includes the results of the acquired entities since the earliest date the entities are under common control.
• The comparative figures of the Group represent the income statement, statement of comprehensive income, balance sheet, statement of cash flows and statement of changes in equity and have been prepared as if the combination had occurred from the date when the combining entities or businesses first came under common control.
• The cost of investment is recorded at the aggregate of the nominal value of the equity shares issued, cash and cash equivalents and fair values of other consideration.
• On consolidation, the difference between the cost of investment and the nominal value of the share capital of the merged subsidiary is taken to merger reserve. Cash paid/payable arising from the acquisition under common control is also taken to the merger reserve.
(iii) Disposals
When a change in the Group’s ownership interest in a subsidiary results in a loss of control over the subsidiary, the assets and liabilities of the subsidiary including any goodwill are derecognised. Amounts previously recognised in other comprehensive income in respect of that entity are also reclassified to profit or loss or transferred directly to retained profits if required by a specific Standard.
Any retained equity interest in the entity is remeasured at fair value. The difference between the carrying amount of the retained interest at the date when control is lost and its fair value is recognised in profit or loss.
Please refer to Note 2.6 for the accounting policy on investments in subsidiaries in the separate financial statements of the Company.
ANNUAL REPORT 2018 69
NOTES TO THE FINANCIAL STATEMENTSFor the financial year ended 31 December 2018
2. SIGNIFICANT ACCOUNTING POLICIES (continued)
2.4 Group accounting (continued)
(b) Transactions with non-controlling interests
Changes in the Group’s ownership interest in a subsidiary that do not result in a loss of control over the subsidiary are accounted for as transactions with equity owners of the Company. Any difference between the change in the carrying amounts of the non-controlling interest and the fair value of the consideration paid or received is recognised in general reserve within equity attributable to the equity holders of the Company.
(c) Associated company
Associated company is an entity over which the Group has significant influence, but not control, generally accompanied by a shareholding giving rise to voting rights of 20% and above but not exceeding 50%.
Investment in associated company is accounted for in the consolidated financial statements using the equity method of accounting less impairment losses, if any.
(i) Acquisitions
Investment in associated company is initially recognised at cost. The cost of an acquisition is measured at the fair value of the assets given, equity instruments issued or liabilities incurred or assumed at the date of exchange, plus costs directly attributable to the acquisition. Goodwill on associated company represents the excess of the cost of acquisition of the associated company over the Group’s share of the fair value of the identifiable net assets of the associated company and is included in the carrying amount of the investment.
(ii) Equity method of accounting
Under the equity method of accounting, the investment is initially recognised at cost and adjusted thereafter to recognise Group’s share of its associated company’s post-acquisition profits or losses of the investee in profit or loss and its share of movements in other comprehensive income of the investee’s other comprehensive income. Dividends received or receivable from the associated company is recognised as a reduction of the carrying amount of the investment. When the Group’s share of losses in an associated company equals to or exceeds its interest in the associated company, the Group does not recognise further losses, unless it has legal or constructive obligations to make, or has made, payments on behalf of the associated company. If the associated company subsequently reports profits, the Group resumes recognising its share of those profits only after its share of the profits equals the share of losses not recognised. Interest in an associated company includes any long-term loans for which settlement is never planned nor likely to occur in the foreseeable future.
Unrealised gains on transactions between the Group and its associated company are eliminated to the extent of the Group’s interest in the associated company. Unrealised losses are also eliminated unless the transaction provides evidence of impairment of the assets transferred. The accounting policies of associated company are changed where necessary to ensure consistency with the accounting policies adopted by the Group.
MEWAH INTERNATIONAL INC. 70
2. SIGNIFICANT ACCOUNTING POLICIES (continued)
2.4 Group accounting (continued)
(c) Associated company (continued)
(iii) Disposals
Investment in associated company is derecognised when the Group loses significant influence. If the retained equity interest in the former associated company is a financial asset, the retained equity interest is measured at fair value. The difference between the carrying amount of the retained interest at the date when significant influence is lost, and its fair value and any proceeds on partial disposal, is recognised in profit or loss.
Please refer to Note 2.6 for the accounting policy on investment in associated company in the separate financial statements of the Company.
2.5 Property, plant and equipment
(a) Measurement
(i) Property, plant and equipment
All property, plant and equipment are initially recognised at cost and subsequently carried at cost less accumulated depreciation and accumulated impairment losses.
(ii) Components of costs
The cost of an item of property, plant and equipment initially recognised includes its purchase price and any cost that is directly attributable to bringing the asset to the location and condition necessary for it to be capable of operating in the manner intended by management. Cost also includes borrowing costs (refer to Note 2.8 on borrowing costs).
(b) Depreciation
Freehold land and capital expenditure in progress are stated at cost and not depreciated. Depreciation on other items of property, plant and equipment is calculated using the straight-line method to allocate their depreciable amounts over their estimated useful lives as follows:
Freehold buildings 2%Leasehold land and buildings 1% to 3%
(Over the period of leases)Plant and equipment 2% to 5%Furniture, fixtures and office equipment 5% to 20%Motor vehicles 20%Vessels 4%
The residual values, estimated useful lives and depreciation method of property, plant and equipment are reviewed, and adjusted as appropriate, at each balance sheet date. The effects of any revision are recognised in profit or loss when the changes arise.
NOTES TO THE FINANCIAL STATEMENTSFor the financial year ended 31 December 2018
ANNUAL REPORT 2018 71
2. SIGNIFICANT ACCOUNTING POLICIES (continued)
2.5 Property, plant and equipment (continued)
(c) Subsequent expenditure
Subsequent expenditure relating to property, plant and equipment that has already been recognised is added to the carrying amount of the asset only when it is probable that future economic benefits associated with the item will flow to the Group and the cost of the item can be measured reliably. All other repair and maintenance expenses are recognised in profit or loss when incurred.
(d) Disposal
On disposal of an item of property, plant and equipment, the difference between the disposal proceeds and its carrying amount is recognised in profit or loss within “Other gains/losses”. Any amount in asset revaluation reserve relating to that asset is transferred to retained profits directly.
2.6 Investments in subsidiaries and associated company
Investments in subsidiaries and associated company are carried at cost less accumulated impairment losses in the Company’s balance sheet. On disposal of such investments, the difference between disposal proceeds and the carrying amounts of the investments are recognised in profit or loss.
2.7 Impairment of non-financial assets
(a) Goodwill
Goodwill recognised separately as an intangible asset is tested for impairment annually and whenever there is indication that the goodwill may be impaired.
For the purpose of impairment testing of goodwill, goodwill is allocated to each of the Group’s cash-generating-units (“CGU”) expected to benefit from synergies arising from the business combination.
An impairment loss is recognised when the carrying amount of a CGU, including the goodwill, exceeds the recoverable amount of the CGU. The recoverable amount of a CGU is the higher of the CGU’s fair value less cost to sell and value-in-use.
The total impairment loss of a CGU is allocated first to reduce the carrying amount of goodwill allocated to the CGU and then to the other assets of the CGU pro-rata on the basis of the carrying amount of each asset in the CGU.
An impairment loss on goodwill is recognised as an expense and is not reversed in a subsequent period.
(b) Property, plant and equipment Investments in subsidiaries and associated company
Property, plant and equipment and investments in subsidiaries and associated company are tested for impairment whenever there is any objective evidence or indication that these assets may be impaired.
For the purpose of impairment testing, the recoverable amount (i.e. the higher of the fair value less cost to sell and the value-in-use) is determined on an individual asset basis unless the asset does not generate cash inflows that are largely independent of those from other assets. If this is the case, the recoverable amount is determined for the CGU to which the asset belongs.
NOTES TO THE FINANCIAL STATEMENTSFor the financial year ended 31 December 2018
MEWAH INTERNATIONAL INC. 72
NOTES TO THE FINANCIAL STATEMENTSFor the financial year ended 31 December 2018
2. SIGNIFICANT ACCOUNTING POLICIES (continued)
2.7 Impairment of non-financial assets (continued)
(b) Property, plant and equipment Investments in subsidiaries and associated company (continued)
If the recoverable amount of the asset (or CGU) is estimated to be less than its carrying amount, the carrying amount of the asset (or CGU) is reduced to its recoverable amount.
The difference between the carrying amount and recoverable amount is recognised as an impairment loss in profit or loss, unless the asset is carried at deemed cost, in which case, such impairment loss is treated as a decrease to the asset revaluation reserve to the extent of the asset revaluation reserve relating to these assets.
An impairment loss for an asset other than goodwill is reversed only if, there has been a change in the estimates used to determine the asset’s recoverable amount since the last impairment loss was recognised. The carrying amount of this asset is increased to its revised recoverable amount, provided that this amount does not exceed the carrying amount that would have been determined (net of any accumulated amortisation or depreciation) had no impairment loss been recognised for the asset in prior years.
A reversal of impairment loss for an asset other than goodwill is recognised in profit or loss.
2.8 Borrowing costs
Borrowing costs are recognised in profit or loss using the effective interest method except for those costs that are directly attributable to the construction or development of properties and assets under construction. This includes those costs on borrowings acquired specifically for the construction or development of properties and assets under construction, as well as those in relation to general borrowings used to finance the construction or development of properties and assets under construction.
Borrowing costs on general borrowings are capitalised by applying a capitalisation rate to the acquisition, construction or production of qualifying assets that are financed by general borrowings.
2.9 Financial assets
The accounting for financial assets before 1 January 2018 are as follows:
(a) Classification
The Group classifies its financial assets in the following categories: financial assets at fair value through profit or loss and loans and receivables. The classification depends on the nature of the assets and the purpose for which the assets were acquired. Management determines the classification of its financial assets at initial recognition.
(i) Financial assets at fair value through profit or loss
This category has two sub-categories: financial assets held for trading, and those designated at fair value through profit or loss at inception. A financial asset is classified as held for trading if it is acquired principally for the purpose of selling in the short term.
ANNUAL REPORT 2018 73
NOTES TO THE FINANCIAL STATEMENTSFor the financial year ended 31 December 2018
2. SIGNIFICANT ACCOUNTING POLICIES (continued)
2.9 Financial assets (continued)
(a) Classification (continued)
(i) Financial assets at fair value through profit or loss (continued)
Financial assets designated as at fair value through profit or loss at inception are those that are managed and their performances are evaluated on a fair value basis, in accordance with a documented Group investment strategy. Derivatives are also categorised as held for trading unless they are designated as hedges. Assets in this category are presented as current assets if they are either held for trading or are expected to be realised within 12 months after the balance sheet date.
(ii) Loans and receivables
Loans and receivables are non-derivative financial assets with fixed or determinable payments that are not quoted in an active market. They are presented as current assets, except for those expected to be realised later than 12 months after the balance sheet date which are presented as non-current assets. Loans and receivables are presented as “trade receivables” (Note 14), “other receivables” (Note 15) and “cash and cash equivalents” (Note 17) on the balance sheet.
(b) Recognition and derecognition
Regular way purchases and sales of financial assets are recognised on trade date - the date on which the Group commits to purchase or sell the asset.
Financial assets are derecognised when the rights to receive cash flows from the financial assets have expired or have been transferred and the Group has transferred substantially all risks and rewards of ownership. On disposal of a financial asset, the difference between the carrying amount and the sale proceeds is recognised in profit or loss. Any amount previously recognised in other comprehensive income relating to that asset is reclassified to profit or loss.
(c) Initial measurement
Financial assets are initially recognised at fair value plus transaction costs except for financial assets at fair value through profit or loss, which are recognised at fair value. Transaction costs for financial assets at fair value through profit or loss are recognised immediately as expenses.
(d) Subsequent measurement
Financial assets at fair value through profit or loss are subsequently carried at fair value. Loans and receivables are subsequently carried at amortised cost using the effective interest method.
Changes in the fair values of financial assets at fair value through profit or loss including the effects of currency translation, interest and dividends, are recognised in profit or loss when the changes arise.
MEWAH INTERNATIONAL INC. 74
NOTES TO THE FINANCIAL STATEMENTSFor the financial year ended 31 December 2018
2. SIGNIFICANT ACCOUNTING POLICIES (continued)
2.9 Financial assets (continued)
(e) Impairment
The Group assesses at each balance sheet date whether there is objective evidence that a financial asset or a group of financial assets is impaired and recognises an allowance for impairment when such evidence exists.
(i) Loans and receivables
Significant financial difficulties of the debtor, probability that the debtor will enter bankruptcy, and default or significant delay in payments are objective evidence that these financial assets are impaired.
The carrying amount of these assets is reduced through the use of an impairment allowance account which is calculated as the difference between the carrying amount and the present value of estimated future cash flows, discounted at the original effective interest rate. When the asset becomes uncollectible, it is written off against the allowance account. Subsequent recoveries of amounts previously written off are recognised against the same line item in profit or loss.
The impairment allowance is reduced through profit or loss in a subsequent period when the amount of impairment loss decreases and the related decrease can be objectively measured. The carrying amount of the asset previously impaired is increased to the extent that the new carrying amount does not exceed the amortised cost had no impairment been recognised in prior periods.
The accounting for financial assets from 1 January 2018 are as follows:
(f) Classification and measurement
The Group classifies its financial assets as financial assets at amortised cost.
The classification depends on the Group’s business model for managing the financial assets as well as the contractual terms of the cash flows of the financial asset.
Financial assets with embedded derivatives are considered in their entirety when determining whether their cash flows are solely payment of principal and interest.
The Group reclassifies debt instruments when and only when its business model for managing those assets changes.
At initial recognition
At initial recognition, the Group measures a financial asset at its fair value plus transaction costs that are directly attributable to the acquisition of the financial asset.
ANNUAL REPORT 2018 75
NOTES TO THE FINANCIAL STATEMENTSFor the financial year ended 31 December 2018
2. SIGNIFICANT ACCOUNTING POLICIES (continued)
2.9 Financial assets (continued)
(f) Classification and measurement (continued)
At subsequent measurement
(i) Debt instruments
Debt instruments mainly comprise of cash and cash equivalents, and trade and other receivables.
Financial assets of the Group are subsequently measured as follows:
• Amortised cost: Debt instruments that are held for collection of contractual cash flows where those cash flows represent solely payments of principal and interest are measured at amortised cost. A gain or loss on a debt instrument that is subsequently measured at amortised cost and is not part of a hedging relationship is recognised in profit or loss when the asset is derecognised or impaired. Interest income from these financial assets is included in interest income using the effective interest rate method.
(g) Impairment
The Group assesses on a forward looking basis the expected credit losses associated with its debt financial assets carried at amortised cost. The impairment methodology applied depends on whether there has been a significant increase in credit risk. Note 32 details how the Group determines whether there has been a significant increase in credit risk.
For trade receivables, the Group applies the simplified approach permitted by the SFRS(I) 9, which requires expected lifetime losses to be recognised from initial recognition of the receivables.
(h) Recognition and derecognition
Regular way purchases and sales of financial assets are recognised on trade date – the date on which the Group commits to purchase or sell the asset.
Financial assets are derecognised when the rights to receive cash flows from the financial assets have expired or have been transferred and the Group has transferred substantially all risks and rewards of ownership.
On disposal of a debt instrument, the difference between the carrying amount and the sale proceeds is recognised in profit or loss. Any amount previously recognised in other comprehensive income relating to that asset is reclassified to profit or loss.
(i) Offsetting of financial instruments
Financial assets and liabilities are offset and the net amount reported in the balance sheet when there is a legally enforceable right to offset and there is an intention to settle on a net basis or realise the asset and settle the liability simultaneously.
MEWAH INTERNATIONAL INC. 76
NOTES TO THE FINANCIAL STATEMENTSFor the financial year ended 31 December 2018
2. SIGNIFICANT ACCOUNTING POLICIES (continued)
2.10 Financial guarantees
The Company has issued corporate guarantees to banks for borrowings of its subsidiaries. These guarantees are financial guarantees as they require the Company to reimburse the banks if the subsidiaries fail to make principal or interest payments when due in accordance with the terms of their borrowings. Intra-group transactions are eliminated on consolidation.
Financial guarantee contracts are initially measured at fair value plus transaction costs and subsequently measured at the higher of:
(a) premium received on initial recognition less the cumulative amount of income recognised in accordance with the principles of SFRS(I) 15; and
(b) the amount of expected loss computed using the impairment methodology under SFRS(I) 9.
Prior to 1 January 2018, financial guarantees were subsequently measured at the higher of (a) and the expected amounts payable to the banks in the event it is probable that the Company will reimburse the banks.
2.11 Borrowings
Borrowings are presented as current liabilities unless the Group has an unconditional right to defer settlement for at least 12 months after the balance sheet date, in which case they are presented as non-current liabilities.
Borrowings are initially recognised at fair value (net of transaction costs) and subsequently carried at amortised cost. Any difference between the proceeds (net of transaction costs) and the redemption value is recognised in profit or loss over the period of the borrowings using the effective interest method.
2.12 Trade and other payables
Trade and other payables represent liabilities for goods and services provided to the Group prior to the end of financial year which are unpaid. They are classified as current liabilities if payment is due within one year or less (or in the normal operating cycle of the business if longer). Otherwise, they are presented as non-current liabilities.
Trade and other payables are initially recognised at fair value, and subsequently carried at amortised cost using the effective interest method.
2.13 Derivative financial instruments
Derivative financial instruments comprise mainly of crude palm oil and palm oil products forward contracts, futures contracts and currency forward contracts.
A derivative financial instrument is initially recognised at its fair value on the date the contract is entered into and is subsequently carried at its fair value. Fair value changes on derivatives that are not designated or do not qualify for hedge accounting are recognised in profit or loss within “cost of sales” when the changes arise.
Derivative financial instruments are reported in the financial statements on a net basis where legal right of setoff exists. Derivative financial instruments are carried as assets when fair value is positive and as liabilities when fair value is negative.
ANNUAL REPORT 2018 77
NOTES TO THE FINANCIAL STATEMENTSFor the financial year ended 31 December 2018
2. SIGNIFICANT ACCOUNTING POLICIES (continued)
2.14 Fair value estimation of financial assets and liabilities
The Group’s commodities futures contracts are traded in active markets and their fair values take into consideration quoted prices at the balance sheet date in active markets such as Bursa Malaysia.
The Group’s commodities forward contracts are not traded in an active market and hence their fair values are estimated using a valuation technique as described in Note 32(e).
The fair values of currency forward contracts are determined using actively quoted forward exchange rates.
The fair values of current financial assets and liabilities carried at amortised cost approximate their carrying amounts.
2.15 Leases
(a) When the Group is the lessee:
Lessee - Operating leases
Leases where substantially all risks and rewards incidental to ownership are retained by the lessors are classified as operating leases. Payments made under operating leases (net of any incentives received from the lessors) are recognised in profit or loss on a straight-line basis over the period of the lease. Initial direct costs incurred by the Group in negotiating and arranging operating leases are capitalised as prepayments and recognised in profit or loss over the lease term on a straight-line basis.
Contingent rents are recognised as an expense in profit or loss when incurred.
(b) When the Group is the lessor:
Lessor - Operating leases
Leases where the Group retains substantially all risks and rewards incidental to ownership are classified as operating leases. Rental income from operating leases (net of any incentives given to the lessees) is recognised in profit or loss on a straight-line basis over the lease term.
Initial direct costs incurred by the Group in negotiating and arranging operating leases are added to the carrying amount of the leased assets and recognised as an expense in profit or loss over the lease term on the same basis as the lease income.
Contingent rents are recognised as income in profit or loss when earned.
2.16 Inventories
Inventories are carried at the lower of cost and net realisable value. Cost is determined on weighted average basis. The cost of finished goods and work-in-progress comprises raw materials, direct labour, other direct costs and related production overheads (based on normal operating capacity) but excludes borrowing costs. Net realisable value is the estimated selling price in the ordinary course of business, less the estimated costs of completion and applicable variable selling expenses.
MEWAH INTERNATIONAL INC. 78
NOTES TO THE FINANCIAL STATEMENTSFor the financial year ended 31 December 2018
2. SIGNIFICANT ACCOUNTING POLICIES (continued)
2.17 Income taxes
Current income tax for current and prior periods is recognised at the amount expected to be paid to or recovered from the tax authorities, using the tax rates and tax laws that have been enacted or substantively enacted by the balance sheet date.
Deferred income tax is recognised for all temporary differences arising between the tax bases of assets and liabilities and their carrying amounts in the financial statements except when the deferred income tax arises from the initial recognition of goodwill or an asset or liability in a transaction that is not a business combination and affects neither accounting nor taxable profit or loss at the time of the transaction.
A deferred income tax liability is recognised on temporary differences arising on investments in subsidiaries and associated companies, except where the Group is able to control the timing of the reversal of the temporary difference and it is probable that the temporary difference will not reverse in the foreseeable future.
A deferred income tax asset is recognised to the extent that it is probable that future taxable profit will be available against which the deductible temporary differences and tax losses can be utilised.
Deferred income tax is measured:
(i) at the tax rates that are expected to apply when the related deferred income tax asset is realised or the deferred income tax liability is settled, based on tax rates and tax laws that have been enacted or substantively enacted by the balance sheet date; and
(ii) based on the tax consequence that will follow from the manner in which the Group expects, at the balance sheet date, to recover or settle the carrying amounts of its assets and liabilities.
Current and deferred income taxes are recognised as income or expense in profit or loss, except to the extent that the tax arises from a business combination or a transaction which is recognised directly in equity. Deferred tax arising from a business combination is adjusted against goodwill on acquisition.
2.18 Provisions
Provisions for legal claims are recognised when the Group has a present legal or constructive obligation as a result of past events, it is more likely than not that an outflow of resources will be required to settle the obligation and the amount has been reliably estimated.
Other provisions are measured at the present value of the expenditure expected to be required to settle the obligation using a pre-tax discount rate that reflects the current market assessment of the time value of money and the risks specific to the obligation. The increase in the provision due to the passage of time is recognised in the profit or loss as finance expense.
Changes in the estimated timing or amount of the expenditure or discount rate are recognised in profit or loss when the changes arise.
ANNUAL REPORT 2018 79
NOTES TO THE FINANCIAL STATEMENTSFor the financial year ended 31 December 2018
2. SIGNIFICANT ACCOUNTING POLICIES (continued)
2.19 Employee compensation
Employee benefits are recognised as an expense, unless the cost qualifies to be capitalised as an asset.
(a) Defined contribution plans
Defined contribution plans are post-employment benefit plans under which the Group pays fixed contributions into separate entities such as the Central Provident Fund on a mandatory, contractual or voluntary basis. The Group has no further payment obligations once the contributions have been paid.
(b) Employee leave entitlement
Employee entitlements to annual leave are recognised when they accrue to employees. Accrual is made for the estimated liability for annual leave as a result of services rendered by employees up to the balance sheet date.
2.20 Currency translation
(a) Functional and presentation currency
Items included in the financial statements of each entity in the Group are measured using the currency of the primary economic environment in which the entity operates (“functional currency”). The financial statements are presented in United States Dollar (“presentation currency”), which is the functional currency of the Company.
(b) Transactions and balances
Transactions in a currency other than the functional currency (“foreign currency”) are translated into the functional currency using the exchange rates at the dates of the transactions. Currency exchange differences resulting from the settlement of such transactions and from the translation of monetary assets and liabilities denominated in foreign currencies at the closing rates at the balance sheet date are recognised in profit or loss. Monetary items include primarily financial assets (other than equity investments), contract assets and financial liabilities.
When a foreign operation is disposed of or any loan forming part of the net investment of the foreign operation is repaid, a proportionate share of the accumulated currency translation differences is reclassified to profit or loss, as part of the gain or loss on disposal.
Foreign exchange gains and losses are presented in the income statement within “other gains/losses”.
Non-monetary items measured at fair values in foreign currencies are translated using the exchange rates at the date when the fair values are determined.
MEWAH INTERNATIONAL INC. 80
NOTES TO THE FINANCIAL STATEMENTSFor the financial year ended 31 December 2018
2. SIGNIFICANT ACCOUNTING POLICIES (continued)
2.20 Currency translation (continued)
(c) Translation of Group entities’ financial statements
The results and financial position of all the Group entities (none of which has the currency of a hyperinflationary economy) that have a functional currency different from the presentation currency are translated into the presentation currency as follows:
(i) assets and liabilities are translated at the closing exchange rates at the reporting date;
(ii) income and expenses are translated at average exchange rates (unless the average is not a reasonable approximation of the cumulative effect of the rates prevailing on the transaction dates, in which case income and expenses are translated using the exchange rates at the dates of the transactions); and
(iii) all resulting currency translation differences are recognised in other comprehensive income and accumulated in the currency translation reserve. These currency translation differences are reclassified to profit or loss on disposal or partial disposal with loss of control of the foreign operation.
Goodwill and fair value adjustments arising on the acquisition of foreign operations are treated as assets and liabilities of the foreign operations and translated at the closing rates at the reporting date.
2.21 Segment reporting
Operating segments are reported in a manner consistent with the internal reporting provided to the Executive Committee whose members are responsible for allocating resources and assessing performance of the operating segments.
2.22 Cash and cash equivalents
For the purpose of presentation in the consolidated statement of cash flows, cash and cash equivalents include cash on hand, deposits with financial institutions which are subject to an insignificant risk of change in value, and bank overdrafts. Bank overdrafts are presented as current borrowings on the balance sheet.
For cash subjected to restriction, assessment is made on the economic substance of the restriction and whether they meet the definition of cash and cash equivalents.
2.23 Share capital
Ordinary shares are classified as equity. Incremental costs directly attributable to the issuance of new ordinary shares are deducted against the share premium account.
2.24 Dividends to Company’s shareholders
Dividends to the Company’s shareholders are recognised when the dividends are approved for payment.
ANNUAL REPORT 2018 81
NOTES TO THE FINANCIAL STATEMENTSFor the financial year ended 31 December 2018
2. SIGNIFICANT ACCOUNTING POLICIES (continued)
2.25 Government grants
Grants from the government are recognised as a receivable at their fair value when there is reasonable assurance that the grant will be received and the Group will comply with all the attached conditions.
Government grants receivable are recognised as income over the periods necessary to match them with the related costs which they are intended to compensate, on a systematic basis.
Government grants relating to assets are presented on the balance sheet under other payables as deferred income.
2.26 Intangible assets
(a) Goodwill
Goodwill on acquisitions of subsidiaries and businesses, represents the excess of (i) the sum of the consideration transferred, the amount of any non-controlling interest in the acquiree and the acquisition-date fair value of any previous equity interest in the acquiree over (ii) the fair value of the identifiable net assets acquired. Goodwill on subsidiaries is recognised separately as intangible assets and carried at cost less accumulated impairment losses.
Goodwill on acquisitions of associated companies represents the excess of the cost of the acquisition over the Group’s share of the fair value of the identifiable net assets acquired. Goodwill on associated companies is included in the carrying amount of the investments.
Gains and losses on the disposal of subsidiaries and associated companies include the carrying amount of goodwill relating to the entity sold.
3. CRITICAL ACCOUNTING ESTIMATES, ASSUMPTIONS AND JUDGEMENTS
Estimates, assumptions and judgements are continually evaluated and are based on historical experience and other factors, including expectations of future events that are believed to be reasonable under the circumstances.
(a) Valuation of commodities forward contracts
The Group is exposed to fluctuations in the prices of agri-commodities it deals in, including crude palm oil and palm oil products. The Group minimises the risk arising from such fluctuations by entering into commodities forward contracts and futures contracts. As the Group has not adopted hedge accounting, the fair value changes on these derivative financial instruments are recognised in the profit or loss when the changes arise.
The Group’s commodities forward contracts are not traded in an active market and hence their fair values are estimated using a valuation technique as described in Note 32(e).
If the commodities forward prices had been higher or lower by 5% from the management’s estimates and other variables remain constant, the Group’s profit after tax would have been lower or higher by US$11,679,000 (2017: lower or higher by US$15,645,000) respectively, arising from the changes in the fair value of the commodities forward contracts.
MEWAH INTERNATIONAL INC. 82
NOTES TO THE FINANCIAL STATEMENTSFor the financial year ended 31 December 2018
3. CRITICAL ACCOUNTING ESTIMATES, ASSUMPTIONS AND JUDGEMENTS (continued)
(b) Impairment assessment of a manufacturing plant of the Group
Property, plant and equipment (“PPE”) is tested for impairment whenever there are indications that these assets may be impaired. Management performs a review to determine whether there are any indications of impairment in relation to the property, plant and equipment held by the Group.
As at 31 December 2018, management has identified indications of impairment relating to PPE of a manufacturing plant of the Group. The total net book value of the PPE relating to this manufacturing plant that was recognised on the balance sheet amounted to approximately US$13,442,000 as at 31 December 2018.
The recoverable amount of this PPE was determined based on value-in-use calculations. The value-in-use calculations are based on a discounted cash flow model and requires the Group to make an estimate of the expected future cash flows from the continuing use of the PPE.
The key assumptions used in the value-in-use calculation that were subject to critical accounting estimates were relating to the estimation of the discount rate, terminal growth rate and operating margin as follows:
Discount rate 9.9%Terminal growth rate 3.0%Operating margin 5.8%
Operating margin is calculated as revenue, less cost of sales (excluding depreciation), selling and distribution expenses and foreign exchange gains/(losses).
An unfavorable change of 1% to any of the individual key assumptions listed above would not have resulted in the recoverable amounts of the PPE of this manufacturing plant to be lower than its carrying amount.
Based on the recoverable amount determined by management, no impairment for the PPE of this manufacturing plant was deemed necessary as at 31 December 2018.
(c) Assessment of recoverability of past due trade receivables of the Group
Management reviews its trade receivables on a regular basis to identify specific trade receivables that are credit impaired and recognises a loss allowance equal to lifetime expected credit loss in respect of these receivables. For the remaining trade receivables, they are grouped based on similar risk characteristics and days past due to determine the expected credit loss rate to be applied. In calculating the expected credit loss rates, management considers historical loss rates and adjusts to reflect current and forward looking macro economic factors affecting the ability of the customers to settle the receivables. Further details are disclosed in Note 32(b) to the financial statements.
Based on the assessment performed by management at 31 December 2018, the loss allowance recognised for specific trade receivables that are credit impaired amounted to US$23,056,000 (Note 14). For the remaining trade receivables, management has assessed that the associated credit risks are insignificant.
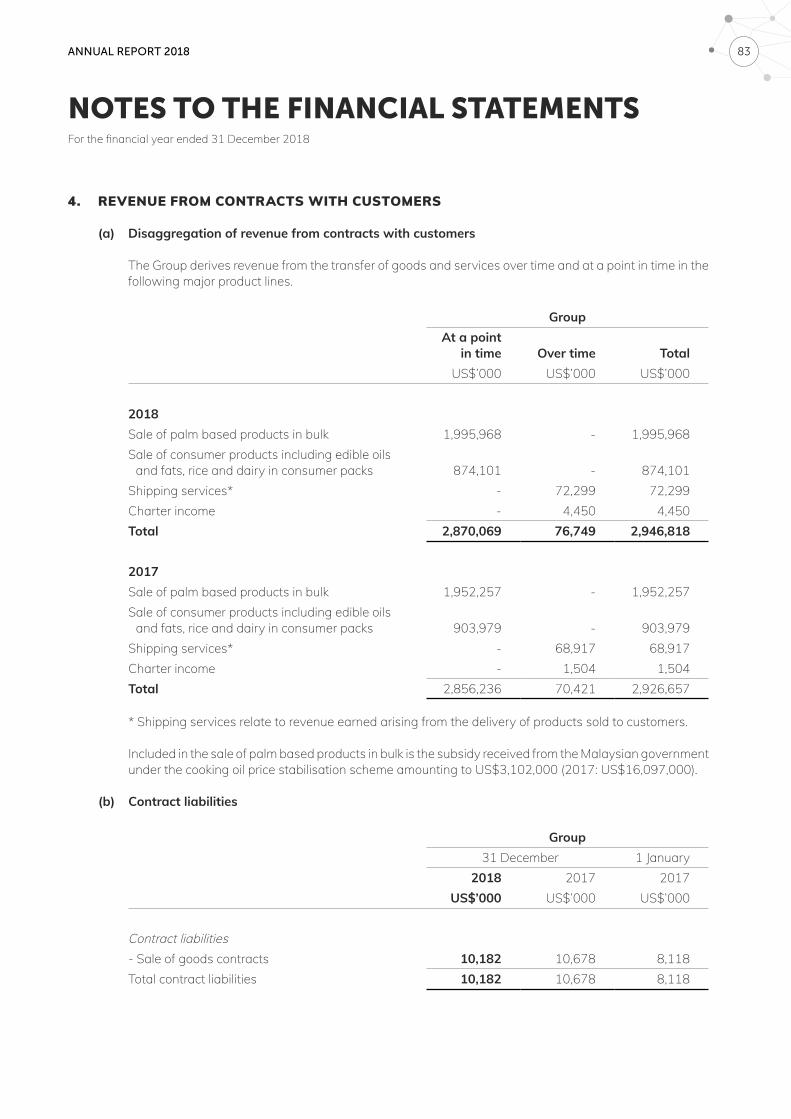
ANNUAL REPORT 2018 83
NOTES TO THE FINANCIAL STATEMENTSFor the financial year ended 31 December 2018
4. REVENUE FROM CONTRACTS WITH CUSTOMERS
(a) Disaggregation of revenue from contracts with customers
The Group derives revenue from the transfer of goods and services over time and at a point in time in the following major product lines.
GroupAt a point
in time Over time TotalUS$’000 US$’000 US$’000
2018Sale of palm based products in bulk 1,995,968 - 1,995,968Sale of consumer products including edible oils
and fats, rice and dairy in consumer packs 874,101 - 874,101Shipping services* - 72,299 72,299Charter income - 4,450 4,450Total 2,870,069 76,749 2,946,818
2017Sale of palm based products in bulk 1,952,257 - 1,952,257Sale of consumer products including edible oils
and fats, rice and dairy in consumer packs 903,979 - 903,979Shipping services* - 68,917 68,917Charter income - 1,504 1,504Total 2,856,236 70,421 2,926,657
* Shipping services relate to revenue earned arising from the delivery of products sold to customers.
Included in the sale of palm based products in bulk is the subsidy received from the Malaysian government under the cooking oil price stabilisation scheme amounting to US$3,102,000 (2017: US$16,097,000).
(b) Contract liabilities
Group31 December 1 January
2018 2017 2017US$’000 US$’000 US$’000
Contract liabilities- Sale of goods contracts 10,182 10,678 8,118Total contract liabilities 10,182 10,678 8,118
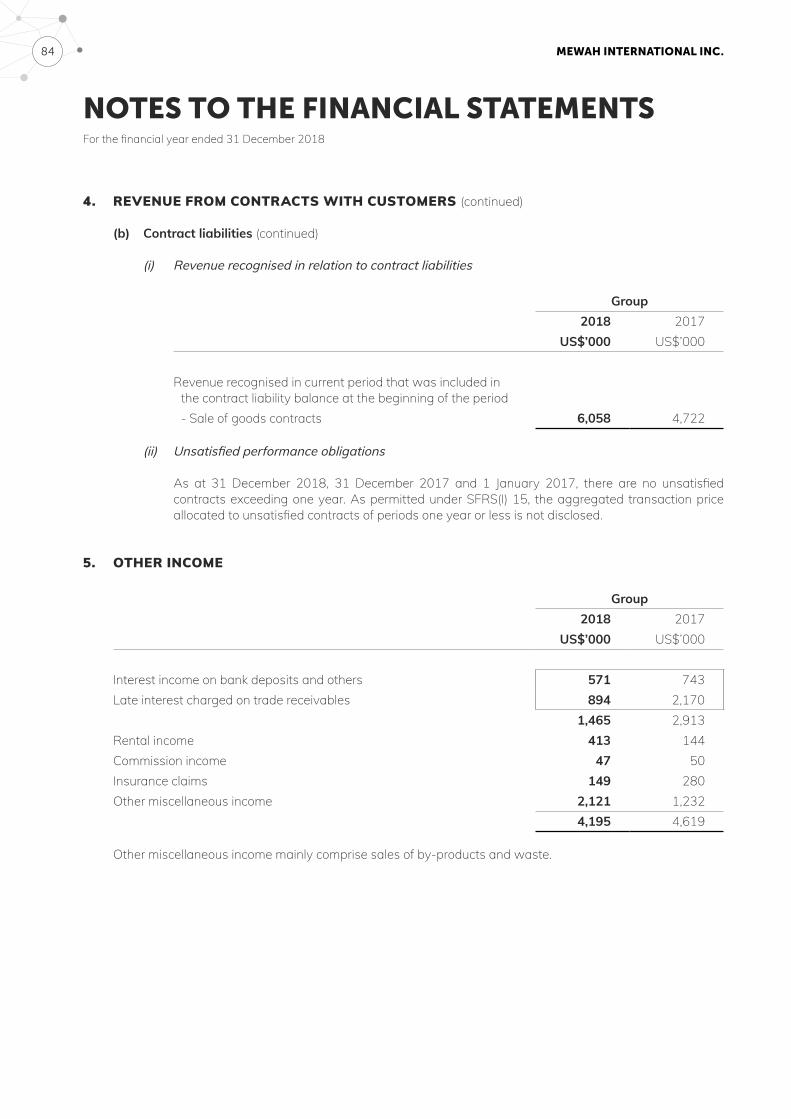
MEWAH INTERNATIONAL INC. 84
NOTES TO THE FINANCIAL STATEMENTSFor the financial year ended 31 December 2018
4. REVENUE FROM CONTRACTS WITH CUSTOMERS (continued)
(b) Contract liabilities (continued)
(i) Revenue recognised in relation to contract liabilities
Group2018 2017
US$’000 US$’000
Revenue recognised in current period that was included in the contract liability balance at the beginning of the period- Sale of goods contracts 6,058 4,722
(ii) Unsatisfiedperformanceobligations
As at 31 December 2018, 31 December 2017 and 1 January 2017, there are no unsatisfied contracts exceeding one year. As permitted under SFRS(I) 15, the aggregated transaction price allocated to unsatisfied contracts of periods one year or less is not disclosed.
5. OTHER INCOME
Group2018 2017
US$’000 US$’000
Interest income on bank deposits and others 571 743Late interest charged on trade receivables 894 2,170
1,465 2,913Rental income 413 144Commission income 47 50Insurance claims 149 280Other miscellaneous income 2,121 1,232
4,195 4,619
Other miscellaneous income mainly comprise sales of by-products and waste.
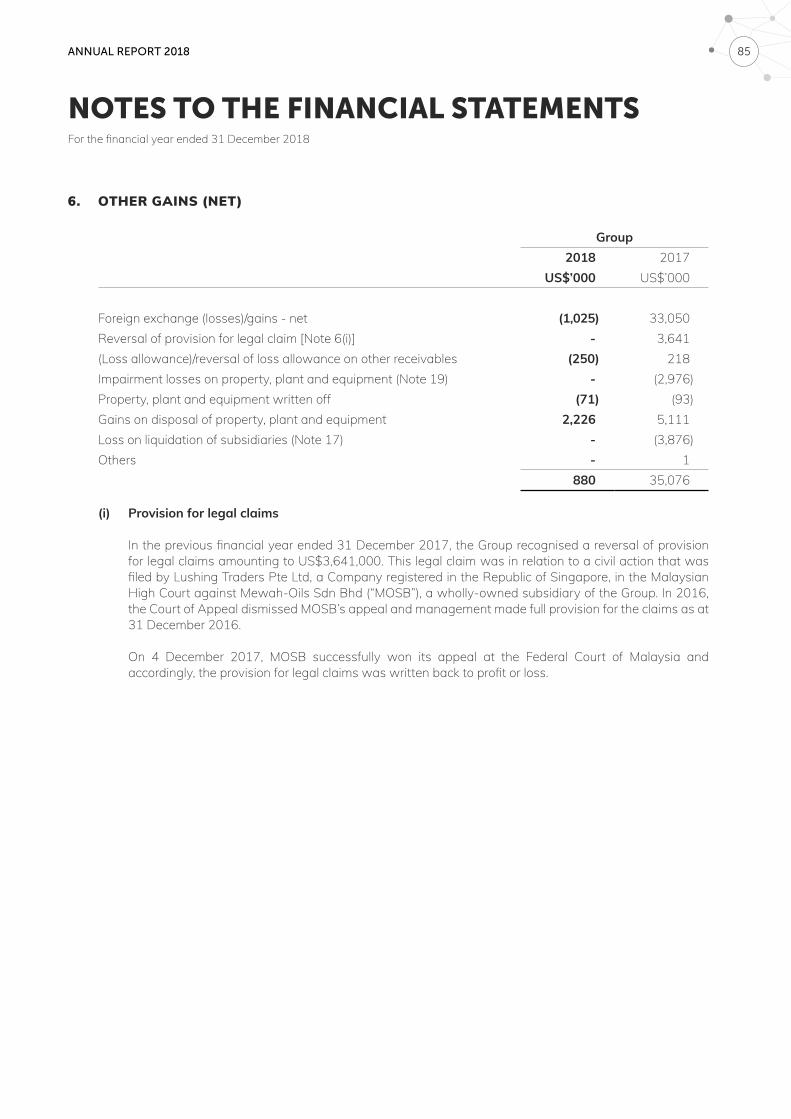
ANNUAL REPORT 2018 85
NOTES TO THE FINANCIAL STATEMENTSFor the financial year ended 31 December 2018
6. OTHER GAINS (NET)
Group2018 2017
US$’000 US$’000
Foreign exchange (losses)/gains - net (1,025) 33,050Reversal of provision for legal claim [Note 6(i)] - 3,641(Loss allowance)/reversal of loss allowance on other receivables (250) 218Impairment losses on property, plant and equipment (Note 19) - (2,976)Property, plant and equipment written off (71) (93)Gains on disposal of property, plant and equipment 2,226 5,111Loss on liquidation of subsidiaries (Note 17) - (3,876)Others - 1
880 35,076
(i) Provision for legal claims
In the previous financial year ended 31 December 2017, the Group recognised a reversal of provision for legal claims amounting to US$3,641,000. This legal claim was in relation to a civil action that was filed by Lushing Traders Pte Ltd, a Company registered in the Republic of Singapore, in the Malaysian High Court against Mewah-Oils Sdn Bhd (“MOSB”), a wholly-owned subsidiary of the Group. In 2016, the Court of Appeal dismissed MOSB’s appeal and management made full provision for the claims as at 31 December 2016.
On 4 December 2017, MOSB successfully won its appeal at the Federal Court of Malaysia and accordingly, the provision for legal claims was written back to profit or loss.
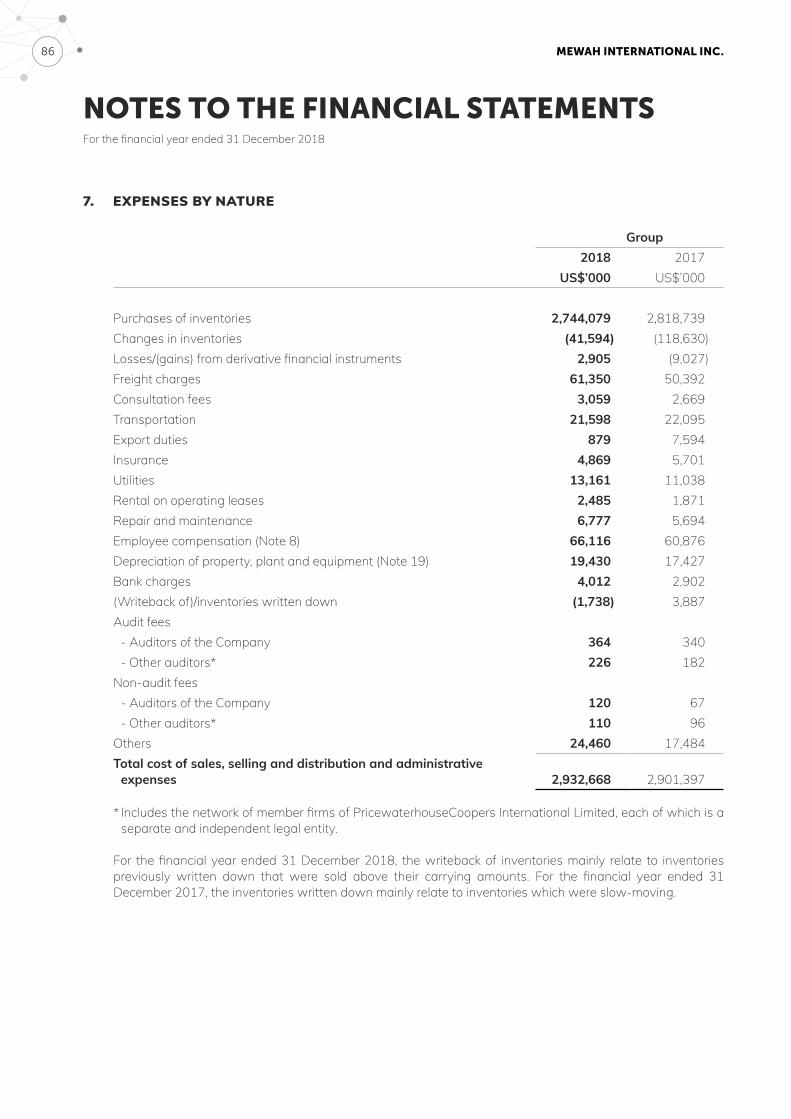
MEWAH INTERNATIONAL INC. 86
NOTES TO THE FINANCIAL STATEMENTSFor the financial year ended 31 December 2018
7. EXPENSES BY NATURE
Group2018 2017
US$’000 US$’000
Purchases of inventories 2,744,079 2,818,739Changes in inventories (41,594) (118,630)Losses/(gains) from derivative financial instruments 2,905 (9,027)Freight charges 61,350 50,392Consultation fees 3,059 2,669Transportation 21,598 22,095Export duties 879 7,594Insurance 4,869 5,701Utilities 13,161 11,038Rental on operating leases 2,485 1,871Repair and maintenance 6,777 5,694Employee compensation (Note 8) 66,116 60,876Depreciation of property, plant and equipment (Note 19) 19,430 17,427Bank charges 4,012 2,902(Writeback of)/inventories written down (1,738) 3,887Audit fees
- Auditors of the Company 364 340- Other auditors* 226 182
Non-audit fees- Auditors of the Company 120 67- Other auditors* 110 96
Others 24,460 17,484Total cost of sales, selling and distribution and administrative
expenses 2,932,668 2,901,397
* Includes the network of member firms of PricewaterhouseCoopers International Limited, each of which is a separate and independent legal entity.
For the financial year ended 31 December 2018, the writeback of inventories mainly relate to inventories previously written down that were sold above their carrying amounts. For the financial year ended 31 December 2017, the inventories written down mainly relate to inventories which were slow-moving.

ANNUAL REPORT 2018 87
NOTES TO THE FINANCIAL STATEMENTSFor the financial year ended 31 December 2018
8. EMPLOYEE COMPENSATION
Group2018 2017
US$’000 US$’000
Salaries 59,680 53,247Employer’s contributions to defined contribution plans 4,251 4,914Other staff benefits 2,185 2,715
66,116 60,876
9. FINANCE EXPENSES
Group2018 2017
US$’000 US$’000
Interest expenses:- Bank borrowings 15,414 10,067
Finance expenses recognised in profit or loss 15,414 10,067
10. INCOME TAXES
(a) Income tax (credit)/expense
Group2018 2017
US$’000 US$’000
Tax expense attributable to profit was made up of:
Current income tax- Singapore 2,470 1,744- Foreign 3,390 6,612
5,860 8,356Deferred income tax (6,636) 7,387
(776) 15,743
(Over)/under provision in prior financial years- Current income tax (Note 11) (1,870) 3,247- Deferred income tax (26) 6,380
(1,896) 9,627
Income tax (credit)/expense (2,672) 25,370
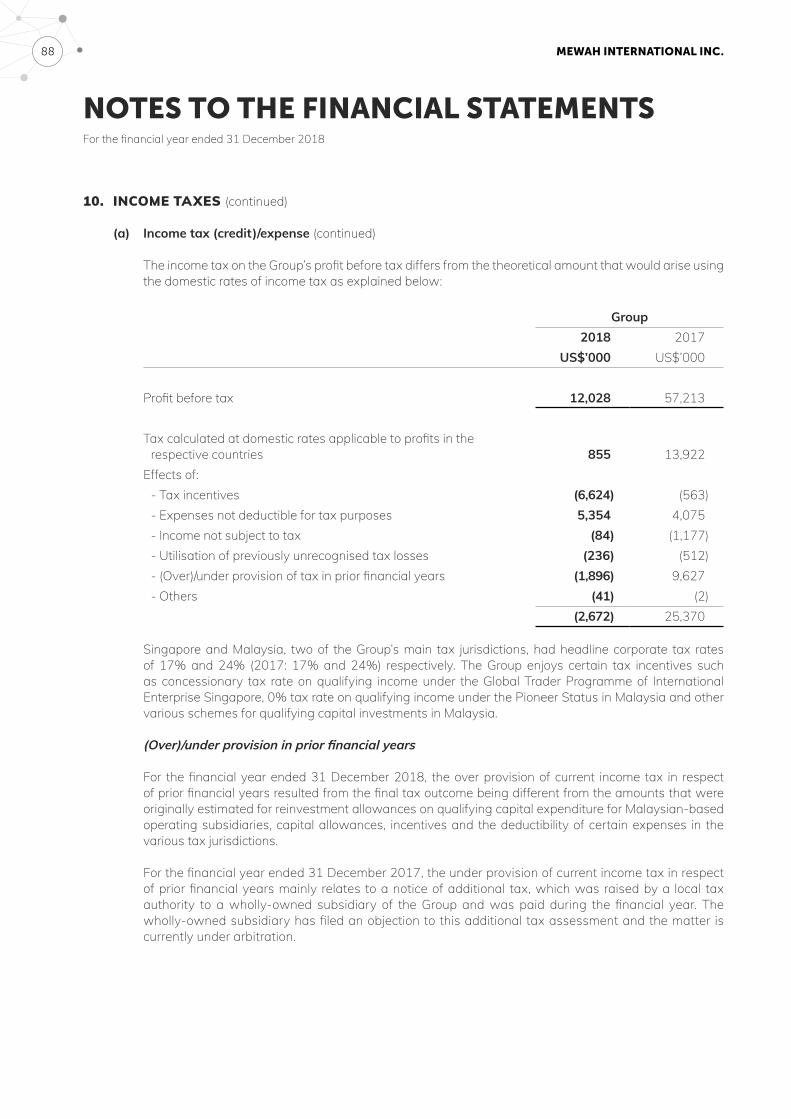
MEWAH INTERNATIONAL INC. 88
NOTES TO THE FINANCIAL STATEMENTSFor the financial year ended 31 December 2018
10. INCOME TAXES (continued)
(a) Income tax (credit)/expense (continued)
The income tax on the Group’s profit before tax differs from the theoretical amount that would arise using the domestic rates of income tax as explained below:
Group2018 2017
US$’000 US$’000
Profit before tax 12,028 57,213
Tax calculated at domestic rates applicable to profits in the respective countries 855 13,922
Effects of:- Tax incentives (6,624) (563)- Expenses not deductible for tax purposes 5,354 4,075- Income not subject to tax (84) (1,177)- Utilisation of previously unrecognised tax losses (236) (512)- (Over)/under provision of tax in prior financial years (1,896) 9,627- Others (41) (2)
(2,672) 25,370
Singapore and Malaysia, two of the Group’s main tax jurisdictions, had headline corporate tax rates of 17% and 24% (2017: 17% and 24%) respectively. The Group enjoys certain tax incentives such as concessionary tax rate on qualifying income under the Global Trader Programme of International Enterprise Singapore, 0% tax rate on qualifying income under the Pioneer Status in Malaysia and other various schemes for qualifying capital investments in Malaysia.
(Over)/under provision in prior financial years
For the financial year ended 31 December 2018, the over provision of current income tax in respect of prior financial years resulted from the final tax outcome being different from the amounts that were originally estimated for reinvestment allowances on qualifying capital expenditure for Malaysian-based operating subsidiaries, capital allowances, incentives and the deductibility of certain expenses in the various tax jurisdictions.
For the financial year ended 31 December 2017, the under provision of current income tax in respect of prior financial years mainly relates to a notice of additional tax, which was raised by a local tax authority to a wholly-owned subsidiary of the Group and was paid during the financial year. The wholly-owned subsidiary has filed an objection to this additional tax assessment and the matter is currently under arbitration.
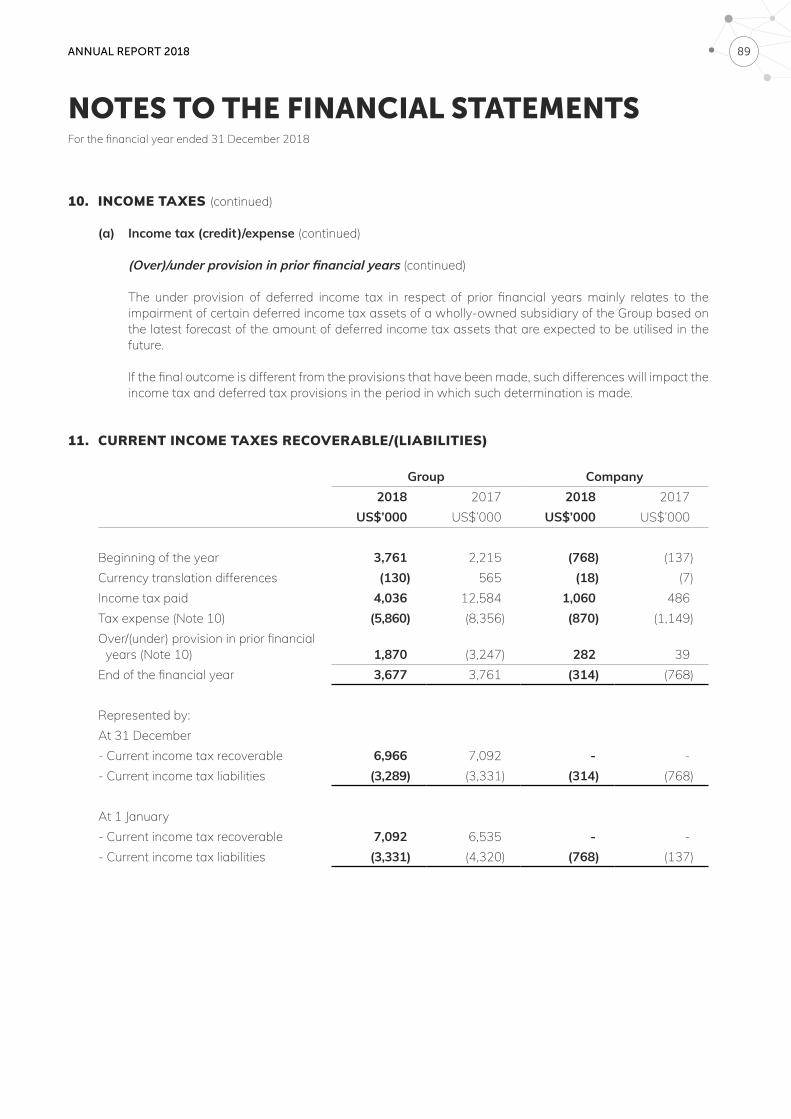
ANNUAL REPORT 2018 89
NOTES TO THE FINANCIAL STATEMENTSFor the financial year ended 31 December 2018
10. INCOME TAXES (continued)
(a) Income tax (credit)/expense (continued)
(Over)/under provision in prior financial years (continued)
The under provision of deferred income tax in respect of prior financial years mainly relates to the impairment of certain deferred income tax assets of a wholly-owned subsidiary of the Group based on the latest forecast of the amount of deferred income tax assets that are expected to be utilised in the future.
If the final outcome is different from the provisions that have been made, such differences will impact the income tax and deferred tax provisions in the period in which such determination is made.
11. CURRENT INCOME TAXES RECOVERABLE/(LIABILITIES)
Group Company2018 2017 2018 2017
US$’000 US$’000 US$’000 US$’000
Beginning of the year 3,761 2,215 (768) (137)Currency translation differences (130) 565 (18) (7)Income tax paid 4,036 12,584 1,060 486Tax expense (Note 10) (5,860) (8,356) (870) (1,149)Over/(under) provision in prior financial
years (Note 10) 1,870 (3,247) 282 39End of the financial year 3,677 3,761 (314) (768)
Represented by: At 31 December- Current income tax recoverable 6,966 7,092 - -- Current income tax liabilities (3,289) (3,331) (314) (768)
At 1 January- Current income tax recoverable 7,092 6,535 - -- Current income tax liabilities (3,331) (4,320) (768) (137)
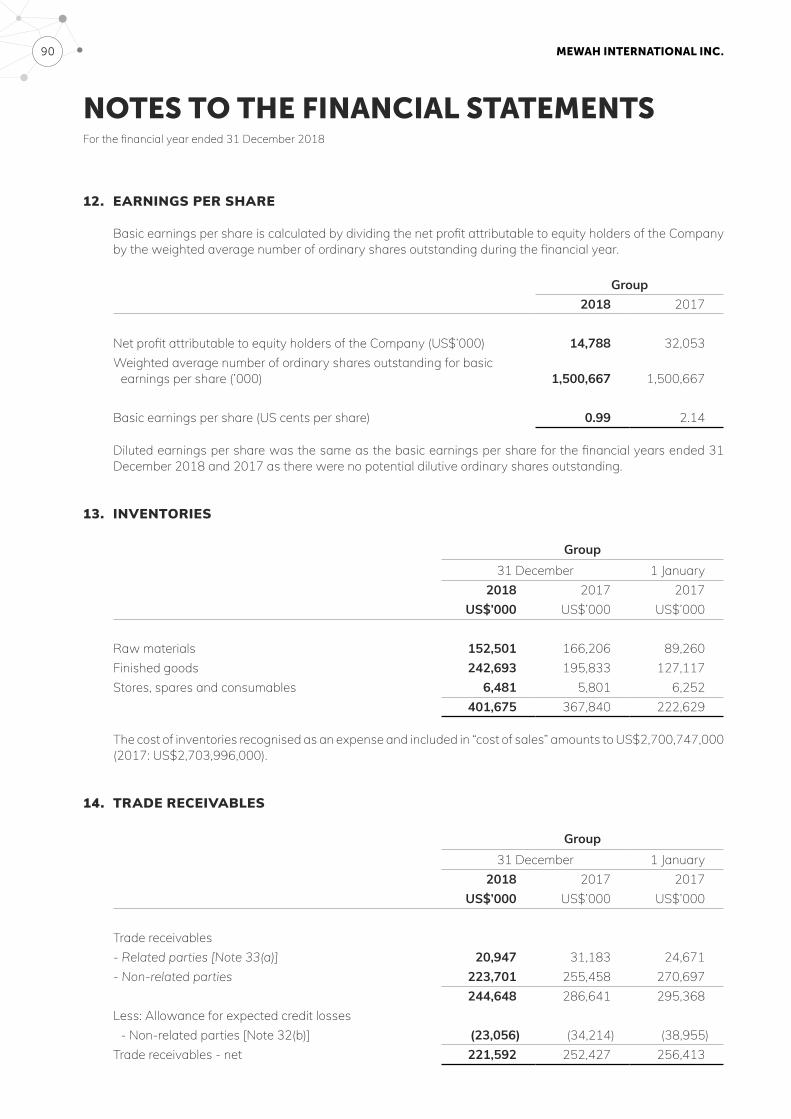
MEWAH INTERNATIONAL INC. 90
NOTES TO THE FINANCIAL STATEMENTSFor the financial year ended 31 December 2018
12. EARNINGS PER SHARE
Basic earnings per share is calculated by dividing the net profit attributable to equity holders of the Company by the weighted average number of ordinary shares outstanding during the financial year.
Group2018 2017
Net profit attributable to equity holders of the Company (US$’000) 14,788 32,053Weighted average number of ordinary shares outstanding for basic
earnings per share (’000) 1,500,667 1,500,667
Basic earnings per share (US cents per share) 0.99 2.14
Diluted earnings per share was the same as the basic earnings per share for the financial years ended 31 December 2018 and 2017 as there were no potential dilutive ordinary shares outstanding.
13. INVENTORIES
Group31 December 1 January
2018 2017 2017US$’000 US$’000 US$’000
Raw materials 152,501 166,206 89,260Finished goods 242,693 195,833 127,117Stores, spares and consumables 6,481 5,801 6,252
401,675 367,840 222,629
The cost of inventories recognised as an expense and included in “cost of sales” amounts to US$2,700,747,000 (2017: US$2,703,996,000).
14. TRADE RECEIVABLES
Group31 December 1 January
2018 2017 2017US$’000 US$’000 US$’000
Trade receivables- Related parties [Note 33(a)] 20,947 31,183 24,671- Non-related parties 223,701 255,458 270,697
244,648 286,641 295,368Less: Allowance for expected credit losses
- Non-related parties [Note 32(b)] (23,056) (34,214) (38,955)Trade receivables - net 221,592 252,427 256,413
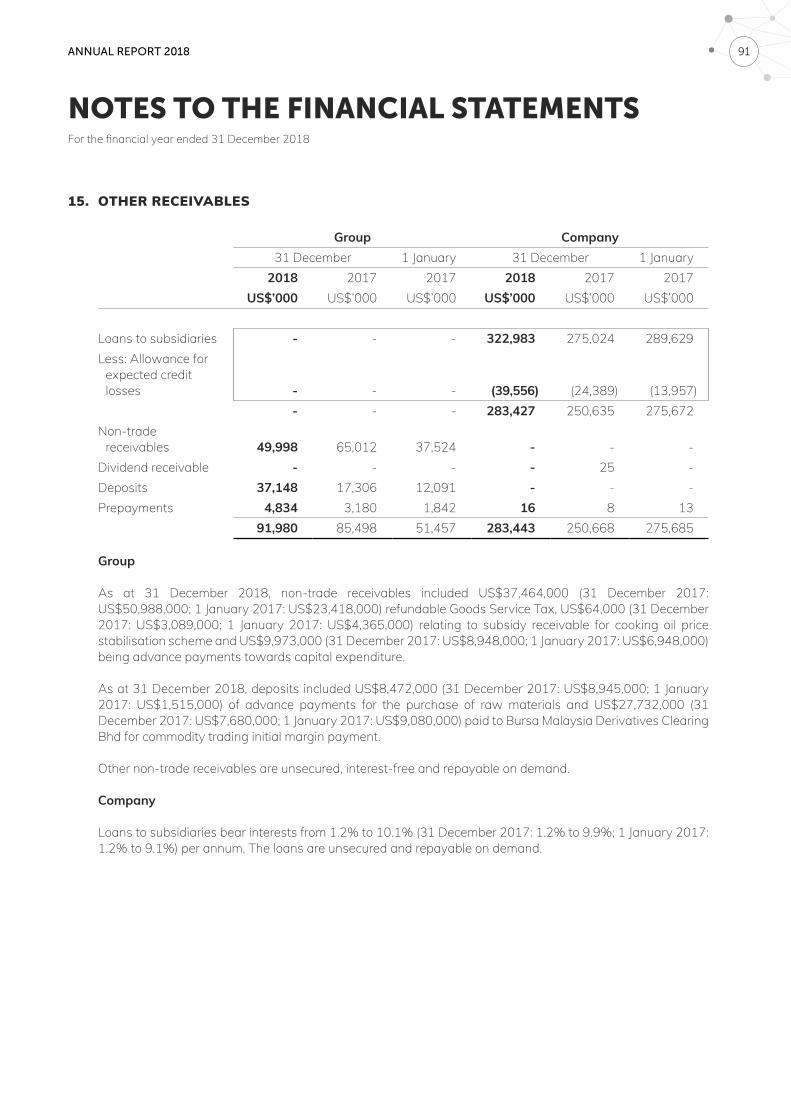
ANNUAL REPORT 2018 91
NOTES TO THE FINANCIAL STATEMENTSFor the financial year ended 31 December 2018
15. OTHER RECEIVABLES
Group Company31 December 1 January 31 December 1 January
2018 2017 2017 2018 2017 2017US$’000 US$’000 US$’000 US$’000 US$’000 US$’000
Loans to subsidiaries - - - 322,983 275,024 289,629Less: Allowance for
expected credit losses - - - (39,556) (24,389) (13,957)
- - - 283,427 250,635 275,672Non-trade
receivables 49,998 65,012 37,524 - - -Dividend receivable - - - - 25 -Deposits 37,148 17,306 12,091 - - -Prepayments 4,834 3,180 1,842 16 8 13
91,980 85,498 51,457 283,443 250,668 275,685
Group
As at 31 December 2018, non-trade receivables included US$37,464,000 (31 December 2017: US$50,988,000; 1 January 2017: US$23,418,000) refundable Goods Service Tax, US$64,000 (31 December 2017: US$3,089,000; 1 January 2017: US$4,365,000) relating to subsidy receivable for cooking oil price stabilisation scheme and US$9,973,000 (31 December 2017: US$8,948,000; 1 January 2017: US$6,948,000) being advance payments towards capital expenditure.
As at 31 December 2018, deposits included US$8,472,000 (31 December 2017: US$8,945,000; 1 January 2017: US$1,515,000) of advance payments for the purchase of raw materials and US$27,732,000 (31 December 2017: US$7,680,000; 1 January 2017: US$9,080,000) paid to Bursa Malaysia Derivatives Clearing Bhd for commodity trading initial margin payment.
Other non-trade receivables are unsecured, interest-free and repayable on demand.
Company
Loans to subsidiaries bear interests from 1.2% to 10.1% (31 December 2017: 1.2% to 9.9%; 1 January 2017: 1.2% to 9.1%) per annum. The loans are unsecured and repayable on demand.
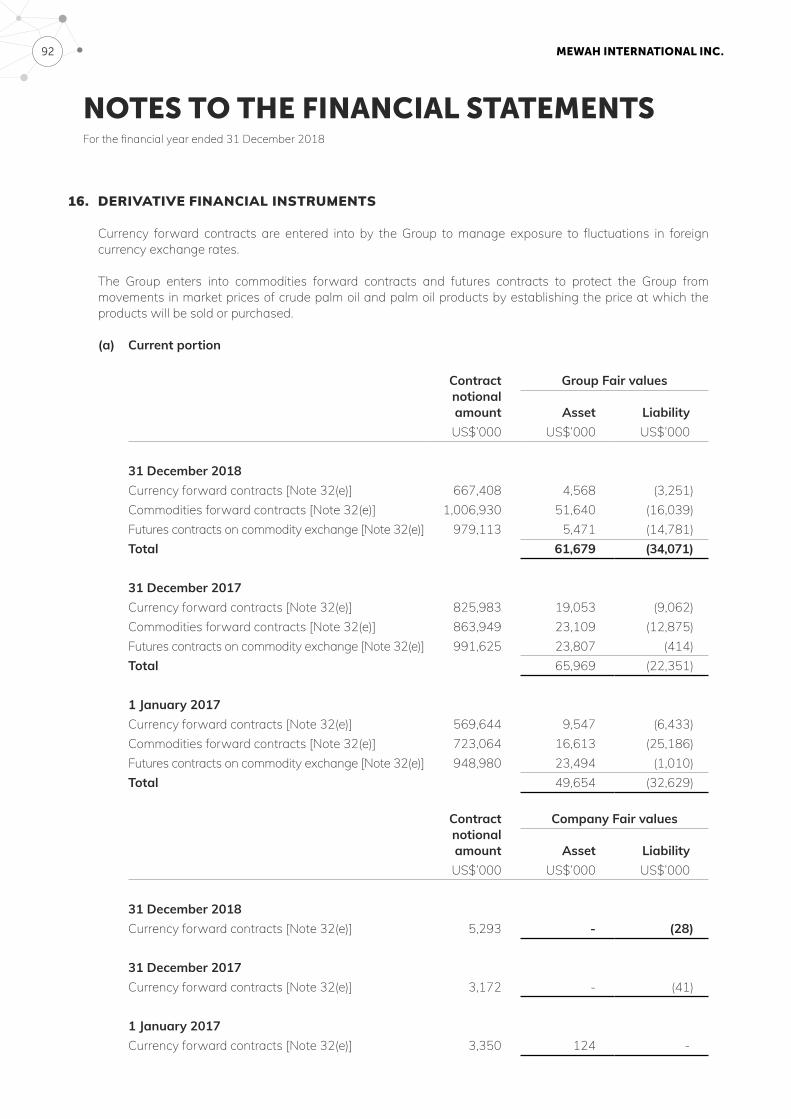
MEWAH INTERNATIONAL INC. 92
NOTES TO THE FINANCIAL STATEMENTSFor the financial year ended 31 December 2018
16. DERIVATIVE FINANCIAL INSTRUMENTS
Currency forward contracts are entered into by the Group to manage exposure to fluctuations in foreign currency exchange rates.
The Group enters into commodities forward contracts and futures contracts to protect the Group from movements in market prices of crude palm oil and palm oil products by establishing the price at which the products will be sold or purchased.
(a) Current portion
Contractnotional amount
Group Fair values
Asset LiabilityUS$’000 US$’000 US$’000
31 December 2018Currency forward contracts [Note 32(e)] 667,408 4,568 (3,251)Commodities forward contracts [Note 32(e)] 1,006,930 51,640 (16,039)Futures contracts on commodity exchange [Note 32(e)] 979,113 5,471 (14,781)Total 61,679 (34,071)
31 December 2017Currency forward contracts [Note 32(e)] 825,983 19,053 (9,062)Commodities forward contracts [Note 32(e)] 863,949 23,109 (12,875)Futures contracts on commodity exchange [Note 32(e)] 991,625 23,807 (414)Total 65,969 (22,351)
1 January 2017Currency forward contracts [Note 32(e)] 569,644 9,547 (6,433)Commodities forward contracts [Note 32(e)] 723,064 16,613 (25,186)Futures contracts on commodity exchange [Note 32(e)] 948,980 23,494 (1,010)Total 49,654 (32,629)
Contractnotional amount
Company Fair values
Asset LiabilityUS$’000 US$’000 US$’000
31 December 2018Currency forward contracts [Note 32(e)] 5,293 - (28)
31 December 2017Currency forward contracts [Note 32(e)] 3,172 - (41)
1 January 2017Currency forward contracts [Note 32(e)] 3,350 124 -
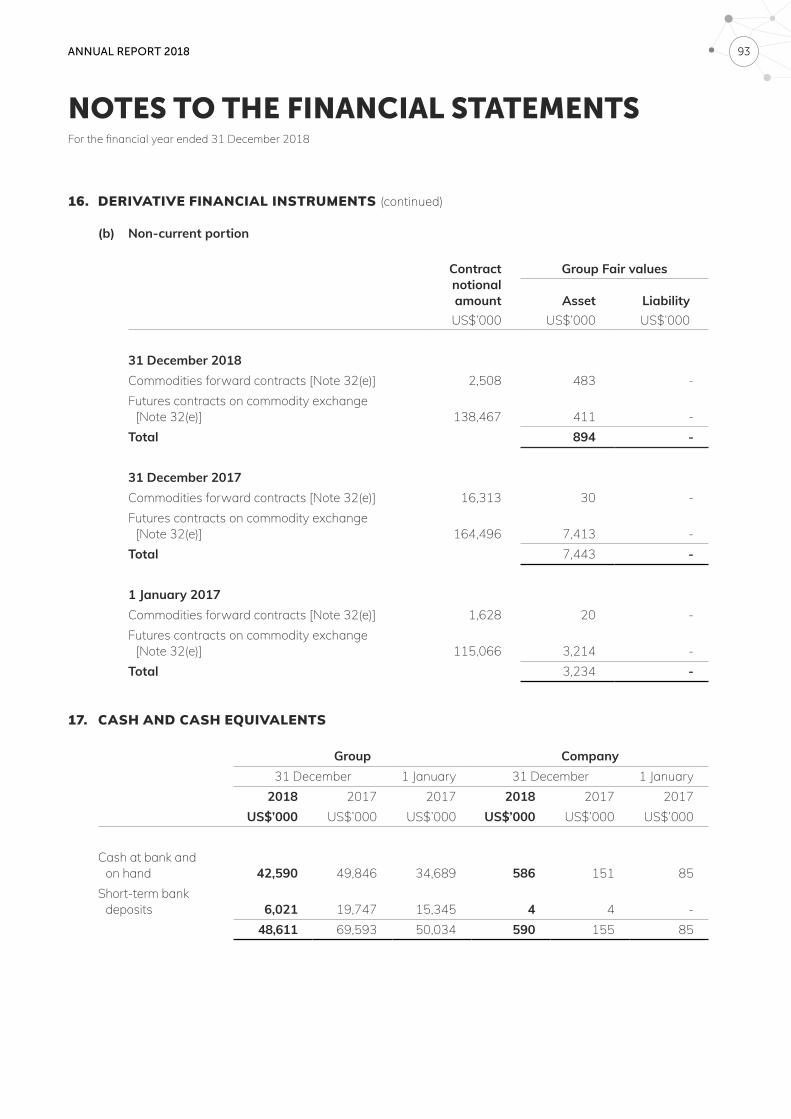
ANNUAL REPORT 2018 93
NOTES TO THE FINANCIAL STATEMENTSFor the financial year ended 31 December 2018
16. DERIVATIVE FINANCIAL INSTRUMENTS (continued)
(b) Non-current portion
Contractnotional amount
Group Fair values
Asset LiabilityUS$’000 US$’000 US$’000
31 December 2018Commodities forward contracts [Note 32(e)] 2,508 483 -Futures contracts on commodity exchange
[Note 32(e)] 138,467 411 -Total 894 -
31 December 2017Commodities forward contracts [Note 32(e)] 16,313 30 -Futures contracts on commodity exchange
[Note 32(e)] 164,496 7,413 -Total 7,443 -
1 January 2017Commodities forward contracts [Note 32(e)] 1,628 20 -Futures contracts on commodity exchange
[Note 32(e)] 115,066 3,214 -Total 3,234 -
17. CASH AND CASH EQUIVALENTS
Group Company31 December 1 January 31 December 1 January
2018 2017 2017 2018 2017 2017US$’000 US$’000 US$’000 US$’000 US$’000 US$’000
Cash at bank and on hand 42,590 49,846 34,689 586 151 85
Short-term bank deposits 6,021 19,747 15,345 4 4 -
48,611 69,593 50,034 590 155 85
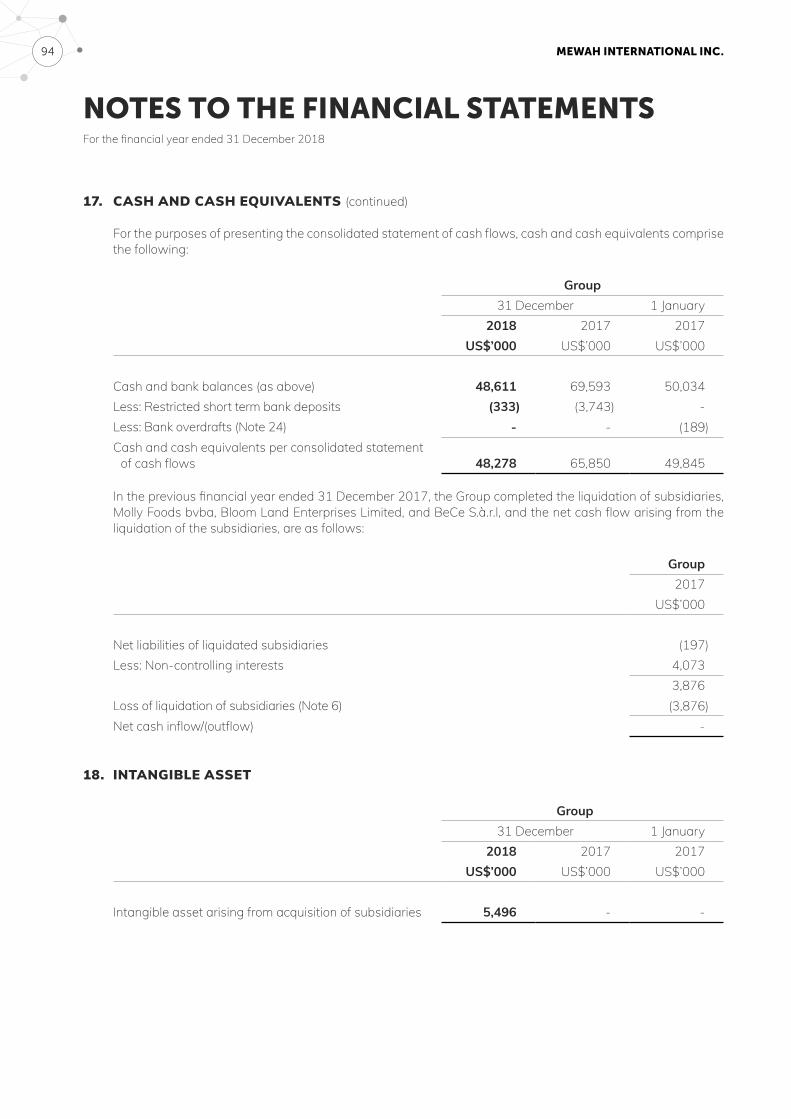
MEWAH INTERNATIONAL INC. 94
NOTES TO THE FINANCIAL STATEMENTSFor the financial year ended 31 December 2018
17. CASH AND CASH EQUIVALENTS (continued)
For the purposes of presenting the consolidated statement of cash flows, cash and cash equivalents comprise the following:
Group31 December 1 January
2018 2017 2017US$’000 US$’000 US$’000
Cash and bank balances (as above) 48,611 69,593 50,034Less: Restricted short term bank deposits (333) (3,743) -Less: Bank overdrafts (Note 24) - - (189)Cash and cash equivalents per consolidated statement
of cash flows 48,278 65,850 49,845
In the previous financial year ended 31 December 2017, the Group completed the liquidation of subsidiaries, Molly Foods bvba, Bloom Land Enterprises Limited, and BeCe S.à.r.l, and the net cash flow arising from the liquidation of the subsidiaries, are as follows:
Group2017
US$’000
Net liabilities of liquidated subsidiaries (197)Less: Non-controlling interests 4,073
3,876Loss of liquidation of subsidiaries (Note 6) (3,876)Net cash inflow/(outflow) -
18. INTANGIBLE ASSET
Group31 December 1 January
2018 2017 2017US$’000 US$’000 US$’000
Intangible asset arising from acquisition of subsidiaries 5,496 - -

ANNUAL REPORT 2018 95
NOTES TO THE FINANCIAL STATEMENTSFor the financial year ended 31 December 2018
18. INTANGIBLE ASSET (continued)
Group2018 2017
US$’000 US$’000
Beginning of financial year - -Acquisition of subsidiaries (Note 35) 5,496 -End of financial year 5,496 -
The Group completed the acquisition of 95.0% of the issued equity of PT Angso Duo Sawit (“PTADS”) and PT Jambi Batanghari Plantation (“PTJBP”), the companies incorporated in Indonesia involved primarily in milling and palm oil plantation businesses respectively. The acquisition will give the Group a foothold in the upstream part of the value chain. The total purchase consideration was IDR120,394,000,000 or approximately US$8,404,000.
Intangible asset in relation to the acquisition of PTADS and PTJBP have been determined provisionally as the underlying purchase price allocation is still ongoing. The purchase price allocation to goodwill, intangibles (excluding goodwill) and other assets and liabilities is currently being assessed and is expected to be finalised within 12 months from the date of acquisition and hence the intangibles asset has not been allocated to the relevant cash-generating-units.
Impairment tests for intangible asset
The recoverable amount of this intangible asset was determined based on value-in-use. Cash flow projections used in the value-in-use calculations were based on discounted cash flow model and requires the Group to make an estimate of the expected future cash flow from the continuing use of the intangible asset.
The key assumptions used in the value-in-use calculation were relating to the estimation of the discount rate, terminal growth rate and operating margin as follows:
Discount rate 15.0%Terminal growth rate 5.2%Operating margin 10.6% - 20.0%
Operating margin is calculated as revenue, less cost of sales (excluding depreciation), selling and distribution expenses and foreign exchange gains/(losses).
Based on the recoverable amount determined by management, no impairment for the goodwill was deemed necessary as at 31 December 2018.
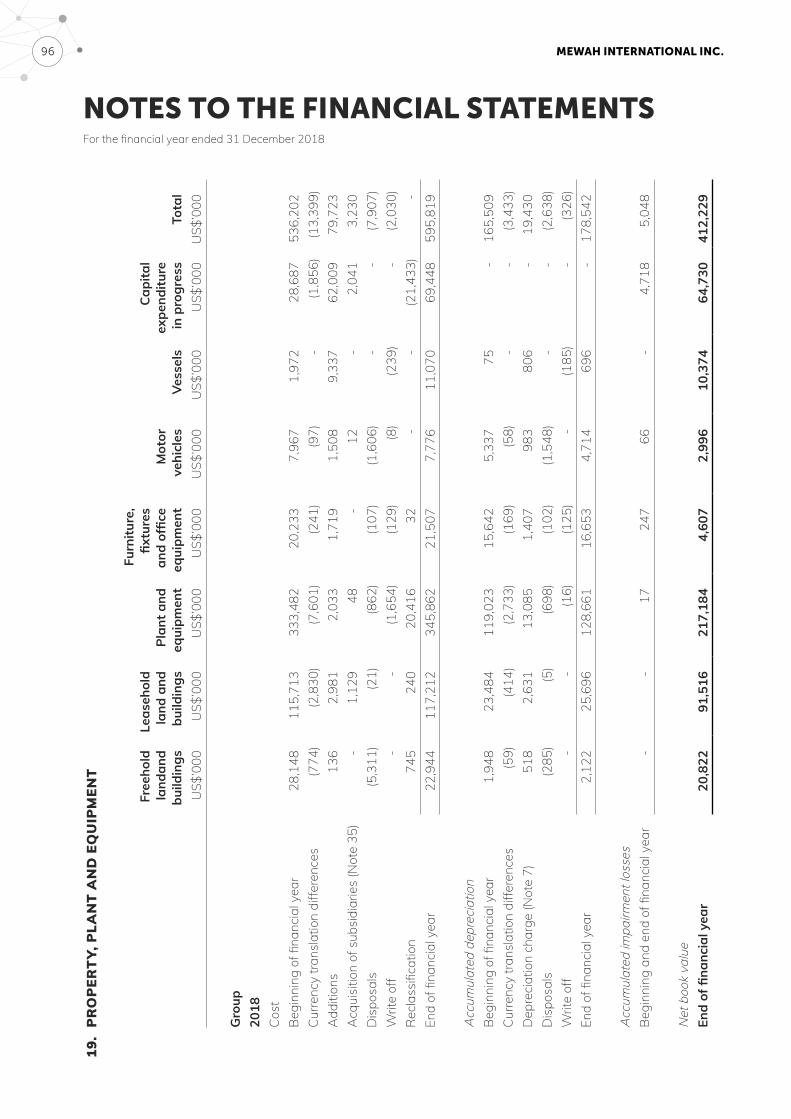
MEWAH INTERNATIONAL INC. 96
NOTES TO THE FINANCIAL STATEMENTSFor the financial year ended 31 December 2018
19.
PR
OP
ERT
Y, P
LAN
T A
ND
EQ
UIP
MEN
T
Free
hold
la
ndan
d bu
ildin
gs
Leas
ehol
dla
nd a
ndbu
ildin
gsPl
ant a
ndeq
uipm
ent
Furn
iture
,fix
ture
s an
d of
fice
equi
pmen
tM
otor
vehi
cles
Vess
els
Capi
tal
expe
nditu
rein
pro
gres
sTo
tal
US$
’000
US$
’000
US$
’000
US$
’000
US$
’000
US$
’000
US$
’000
US$
’000
Gro
up20
18Co
stBe
ginn
ing
of fi
nanc
ial y
ear
28,1
4811
5,71
333
3,48
220
,233
7,96
71,
972
28,6
8753
6,20
2Cu
rrenc
y tra
nsla
tion
diffe
renc
es(7
74)
(2,8
30)
(7,6
01)
(241
)(9
7)-
(1,8
56)
(13,
399)
Add
ition
s13
62,
981
2,03
31,
719
1,50
89,
337
62,0
0979
,723
Acq
uisi
tion
of s
ubsi
diar
ies
(Not
e 35
)-
1,12
948
-12
-2,
041
3,23
0D
ispo
sals
(5,3
11)
(21)
(862
)(1
07)
(1,6
06)
--
(7,9
07)
Writ
e of
f-
-(1
,654
)(1
29)
(8)
(239
)-
(2,0
30)
Rec
lass
ifica
tion
745
240
20,4
1632
--
(21,
433)
-En
d of
fina
ncia
l yea
r22
,944
117,
212
345,
862
21,5
077,
776
11,0
7069
,448
595,
819
Acc
umul
ated
dep
reci
atio
nBe
ginn
ing
of fi
nanc
ial y
ear
1,94
823
,484
119,
023
15,6
425,
337
75-
165,
509
Curre
ncy
trans
latio
n di
ffere
nces
(59)
(414
)(2
,733
)(1
69)
(58)
--
(3,4
33)
Dep
reci
atio
n ch
arge
(Not
e 7)
518
2,63
113
,085
1,40
798
380
6-
19,4
30D
ispo
sals
(285
)(5
)(6
98)
(102
)(1
,548
)-
-(2
,638
)W
rite
off
--
(16)
(125
)-
(185
)-
(326
)En
d of
fina
ncia
l yea
r2,
122
25,6
9612
8,66
116
,653
4,71
469
6-
178,
542
Acc
umul
ated
impa
irmen
t los
ses
Begi
nnin
g an
d en
d of
fina
ncia
l yea
r-
-17
247
66-
4,71
85,
048
Net
boo
k va
lue
End
of fi
nanc
ial y
ear
20,8
2291
,516
217,
184
4,60
72,
996
10,3
7464
,730
412,
229
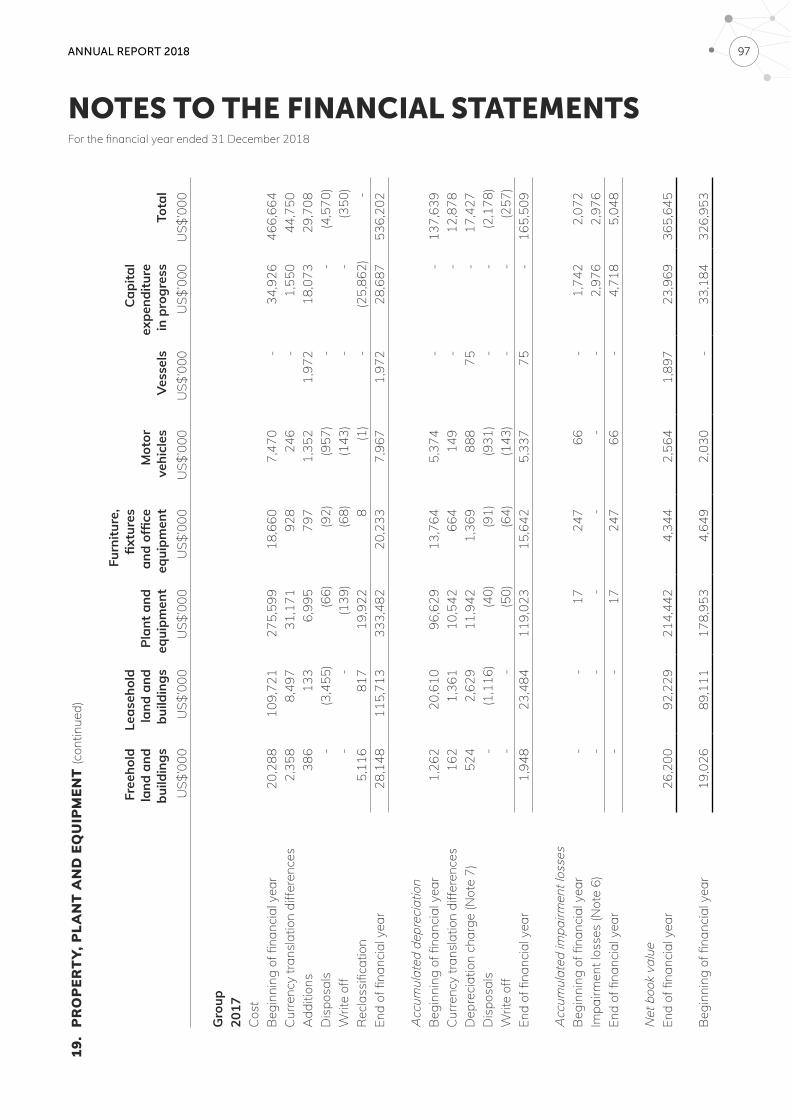
ANNUAL REPORT 2018 97
NOTES TO THE FINANCIAL STATEMENTSFor the financial year ended 31 December 2018
19.
PR
OP
ERT
Y, P
LAN
T A
ND
EQ
UIP
MEN
T (c
ontin
ued)
Free
hold
la
nd a
nd
build
ings
Leas
ehol
dla
nd a
ndbu
ildin
gsPl
ant a
ndeq
uipm
ent
Furn
iture
,fix
ture
s an
d of
fice
equi
pmen
tM
otor
vehi
cles
Vess
els
Capi
tal
expe
nditu
rein
pro
gres
sTo
tal
US$
’000
US$
’000
US$
’000
US$
’000
US$
’000
US$
’000
US$
’000
US$
’000
Gro
up20
17Co
stBe
ginn
ing
of fi
nanc
ial y
ear
20,2
8810
9,72
127
5,59
918
,660
7,47
0-
34,9
2646
6,66
4Cu
rrenc
y tra
nsla
tion
diffe
renc
es2,
358
8,49
731
,171
928
246
-1,
550
44,7
50A
dditi
ons
386
133
6,99
579
71,
352
1,97
218
,073
29,7
08D
ispo
sals
-(3
,455
)(6
6)(9
2)(9
57)
--
(4,5
70)
Writ
e of
f-
-(1
39)
(68)
(143
)-
-(3
50)
Rec
lass
ifica
tion
5,11
681
719
,922
8(1
)-
(25,
862)
-En
d of
fina
ncia
l yea
r28
,148
115,
713
333,
482
20,2
337,
967
1,97
228
,687
536,
202
Acc
umul
ated
dep
reci
atio
nBe
ginn
ing
of fi
nanc
ial y
ear
1,26
220
,610
96,6
2913
,764
5,37
4-
-13
7,63
9Cu
rrenc
y tra
nsla
tion
diffe
renc
es16
21,
361
10,5
4266
414
9-
-12
,878
Dep
reci
atio
n ch
arge
(Not
e 7)
524
2,62
911
,942
1,36
988
875
-17
,427
Dis
posa
ls-
(1,1
16)
(40)
(91)
(931
)-
-(2
,178
)W
rite
off
--
(50)
(64)
(143
)-
-(2
57)
End
of fi
nanc
ial y
ear
1,94
823
,484
119,
023
15,6
425,
337
75-
165,
509
Acc
umul
ated
impa
irmen
t los
ses
Begi
nnin
g of
fina
ncia
l yea
r-
-17
247
66-
1,74
22,
072
Impa
irmen
t los
ses
(Not
e 6)
--
--
--
2,97
62,
976
End
of fi
nanc
ial y
ear
--
1724
766
-4,
718
5,04
8
Net
boo
k va
lue
End
of fi
nanc
ial y
ear
26,2
0092
,229
214,
442
4,34
42,
564
1,89
723
,969
365,
645
Begi
nnin
g of
fina
ncia
l yea
r19
,026
89,1
1117
8,95
34,
649
2,03
0-
33,1
8432
6,95
3
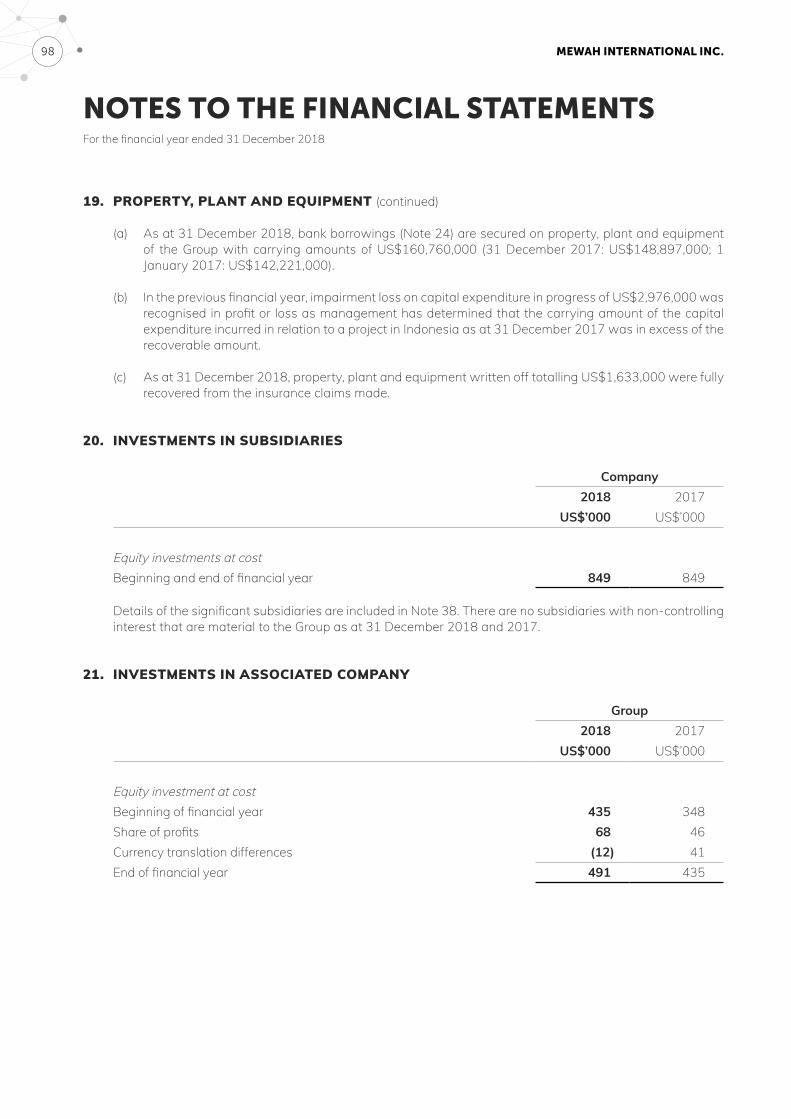
MEWAH INTERNATIONAL INC. 98
NOTES TO THE FINANCIAL STATEMENTSFor the financial year ended 31 December 2018
19. PROPERTY, PLANT AND EQUIPMENT (continued)
(a) As at 31 December 2018, bank borrowings (Note 24) are secured on property, plant and equipment of the Group with carrying amounts of US$160,760,000 (31 December 2017: US$148,897,000; 1 January 2017: US$142,221,000).
(b) In the previous financial year, impairment loss on capital expenditure in progress of US$2,976,000 was recognised in profit or loss as management has determined that the carrying amount of the capital expenditure incurred in relation to a project in Indonesia as at 31 December 2017 was in excess of the recoverable amount.
(c) As at 31 December 2018, property, plant and equipment written off totalling US$1,633,000 were fully recovered from the insurance claims made.
20. INVESTMENTS IN SUBSIDIARIES
Company2018 2017
US$’000 US$’000
Equity investments at costBeginning and end of financial year 849 849
Details of the significant subsidiaries are included in Note 38. There are no subsidiaries with non-controlling interest that are material to the Group as at 31 December 2018 and 2017.
21. INVESTMENTS IN ASSOCIATED COMPANY
Group2018 2017
US$’000 US$’000
Equity investment at costBeginning of financial year 435 348Share of profits 68 46Currency translation differences (12) 41End of financial year 491 435
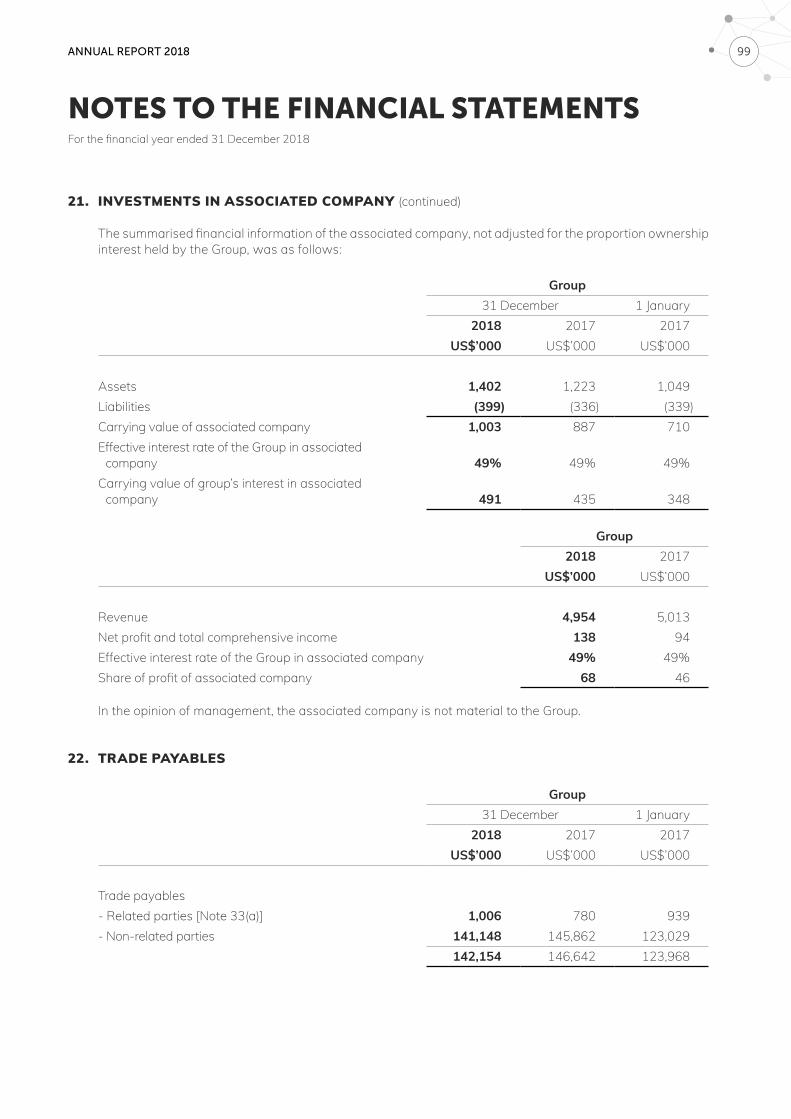
ANNUAL REPORT 2018 99
NOTES TO THE FINANCIAL STATEMENTSFor the financial year ended 31 December 2018
21. INVESTMENTS IN ASSOCIATED COMPANY (continued)
The summarised financial information of the associated company, not adjusted for the proportion ownership interest held by the Group, was as follows:
Group31 December 1 January
2018 2017 2017US$’000 US$’000 US$’000
Assets 1,402 1,223 1,049Liabilities (399) (336) (339)Carrying value of associated company 1,003 887 710Effective interest rate of the Group in associated
company 49% 49% 49%Carrying value of group’s interest in associated
company 491 435 348
Group2018 2017
US$’000 US$’000
Revenue 4,954 5,013Net profit and total comprehensive income 138 94Effective interest rate of the Group in associated company 49% 49%Share of profit of associated company 68 46
In the opinion of management, the associated company is not material to the Group.
22. TRADE PAYABLES
Group31 December 1 January
2018 2017 2017US$’000 US$’000 US$’000
Trade payables- Related parties [Note 33(a)] 1,006 780 939- Non-related parties 141,148 145,862 123,029
142,154 146,642 123,968
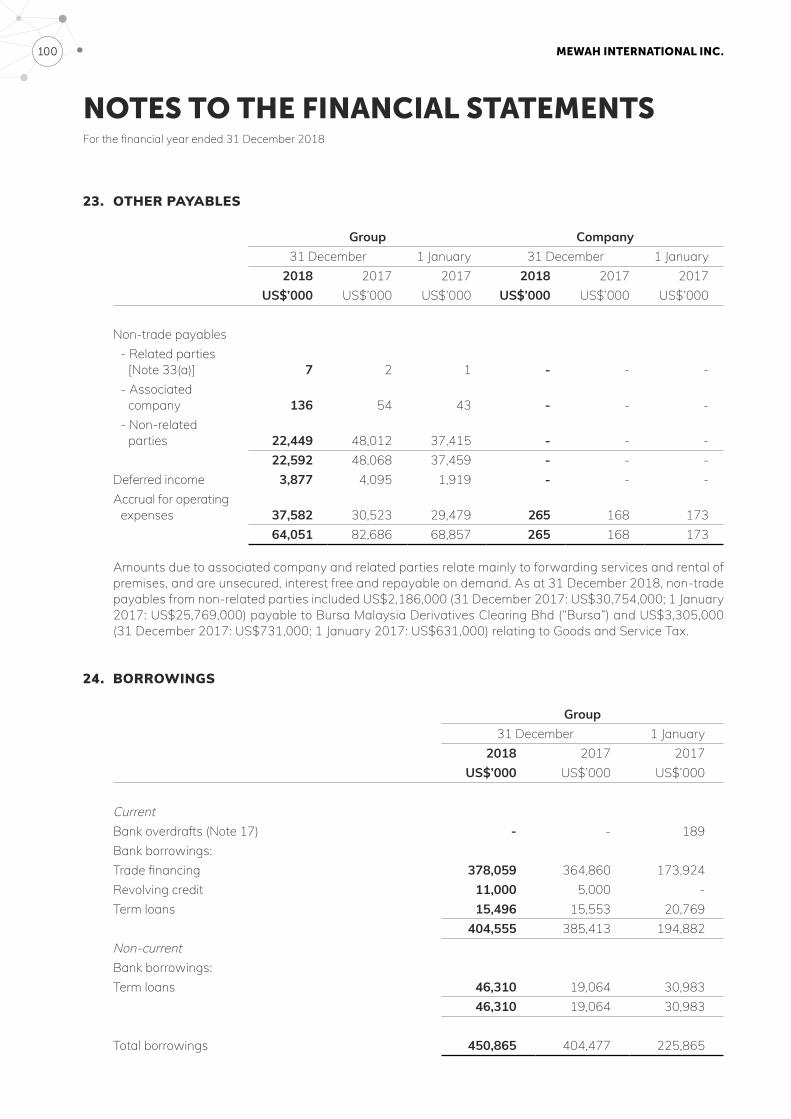
MEWAH INTERNATIONAL INC. 100
NOTES TO THE FINANCIAL STATEMENTSFor the financial year ended 31 December 2018
23. OTHER PAYABLES
Group Company31 December 1 January 31 December 1 January
2018 2017 2017 2018 2017 2017US$’000 US$’000 US$’000 US$’000 US$’000 US$’000
Non-trade payables- Related parties
[Note 33(a)] 7 2 1 - - -- Associated
company 136 54 43 - - -- Non-related
parties 22,449 48,012 37,415 - - -22,592 48,068 37,459 - - -
Deferred income 3,877 4,095 1,919 - - -Accrual for operating
expenses 37,582 30,523 29,479 265 168 17364,051 82,686 68,857 265 168 173
Amounts due to associated company and related parties relate mainly to forwarding services and rental of premises, and are unsecured, interest free and repayable on demand. As at 31 December 2018, non-trade payables from non-related parties included US$2,186,000 (31 December 2017: US$30,754,000; 1 January 2017: US$25,769,000) payable to Bursa Malaysia Derivatives Clearing Bhd (“Bursa”) and US$3,305,000 (31 December 2017: US$731,000; 1 January 2017: US$631,000) relating to Goods and Service Tax.
24. BORROWINGS
Group31 December 1 January
2018 2017 2017US$’000 US$’000 US$’000
CurrentBank overdrafts (Note 17) - - 189Bank borrowings:Trade financing 378,059 364,860 173,924Revolving credit 11,000 5,000 -Term loans 15,496 15,553 20,769
404,555 385,413 194,882Non-currentBank borrowings:Term loans 46,310 19,064 30,983
46,310 19,064 30,983
Total borrowings 450,865 404,477 225,865
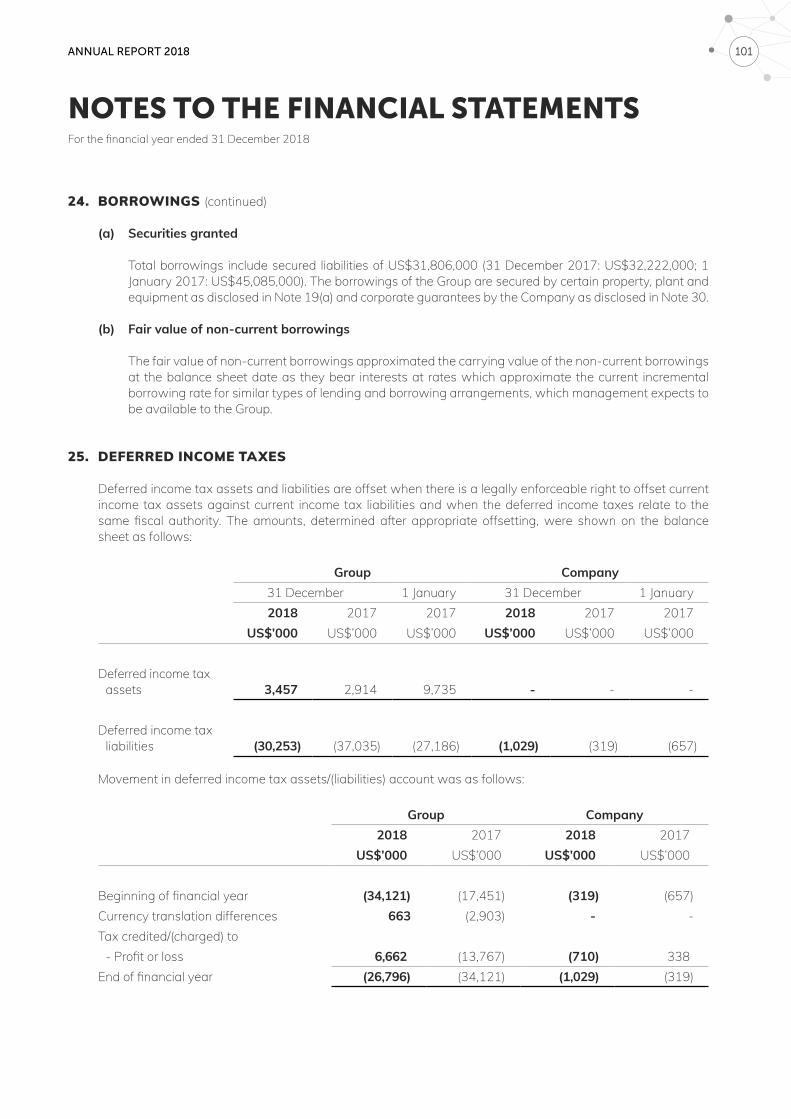
ANNUAL REPORT 2018 101
NOTES TO THE FINANCIAL STATEMENTSFor the financial year ended 31 December 2018
24. BORROWINGS (continued)
(a) Securities granted
Total borrowings include secured liabilities of US$31,806,000 (31 December 2017: US$32,222,000; 1 January 2017: US$45,085,000). The borrowings of the Group are secured by certain property, plant and equipment as disclosed in Note 19(a) and corporate guarantees by the Company as disclosed in Note 30.
(b) Fair value of non-current borrowings
The fair value of non-current borrowings approximated the carrying value of the non-current borrowings at the balance sheet date as they bear interests at rates which approximate the current incremental borrowing rate for similar types of lending and borrowing arrangements, which management expects to be available to the Group.
25. DEFERRED INCOME TAXES
Deferred income tax assets and liabilities are offset when there is a legally enforceable right to offset current income tax assets against current income tax liabilities and when the deferred income taxes relate to the same fiscal authority. The amounts, determined after appropriate offsetting, were shown on the balance sheet as follows:
Group Company31 December 1 January 31 December 1 January2018 2017 2017 2018 2017 2017
US$’000 US$’000 US$’000 US$’000 US$’000 US$’000
Deferred income tax assets 3,457 2,914 9,735 - - -
Deferred income tax liabilities (30,253) (37,035) (27,186) (1,029) (319) (657)
Movement in deferred income tax assets/(liabilities) account was as follows:
Group Company2018 2017 2018 2017
US$’000 US$’000 US$’000 US$’000
Beginning of financial year (34,121) (17,451) (319) (657)Currency translation differences 663 (2,903) - -Tax credited/(charged) to
- Profit or loss 6,662 (13,767) (710) 338End of financial year (26,796) (34,121) (1,029) (319)
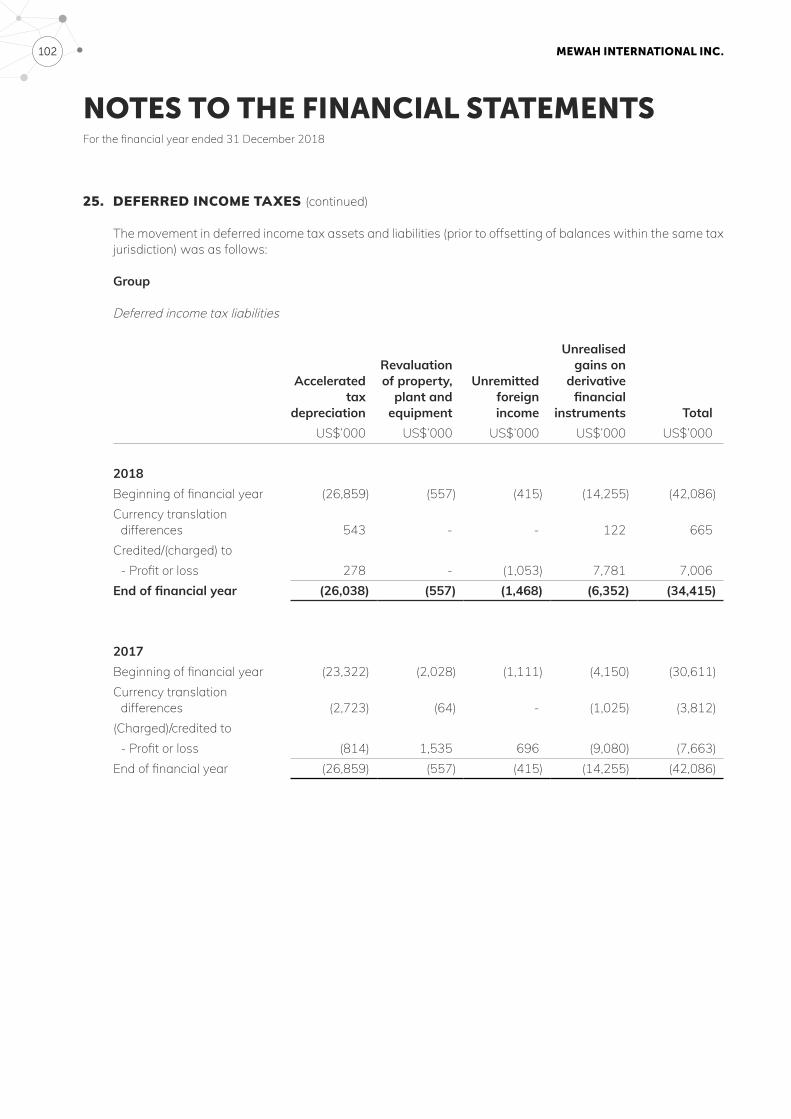
MEWAH INTERNATIONAL INC. 102
NOTES TO THE FINANCIAL STATEMENTSFor the financial year ended 31 December 2018
25. DEFERRED INCOME TAXES (continued)
The movement in deferred income tax assets and liabilities (prior to offsetting of balances within the same tax jurisdiction) was as follows:
Group
Deferred income tax liabilities
Acceleratedtax
depreciation
Revaluation of property,
plant and equipment
Unremitted foreign income
Unrealised gains on
derivative financial
instruments TotalUS$’000 US$’000 US$’000 US$’000 US$’000
2018Beginning of financial year (26,859) (557) (415) (14,255) (42,086)Currency translation
differences 543 - - 122 665Credited/(charged) to
- Profit or loss 278 - (1,053) 7,781 7,006End of financial year (26,038) (557) (1,468) (6,352) (34,415)
2017Beginning of financial year (23,322) (2,028) (1,111) (4,150) (30,611)Currency translation
differences (2,723) (64) - (1,025) (3,812)(Charged)/credited to
- Profit or loss (814) 1,535 696 (9,080) (7,663)End of financial year (26,859) (557) (415) (14,255) (42,086)
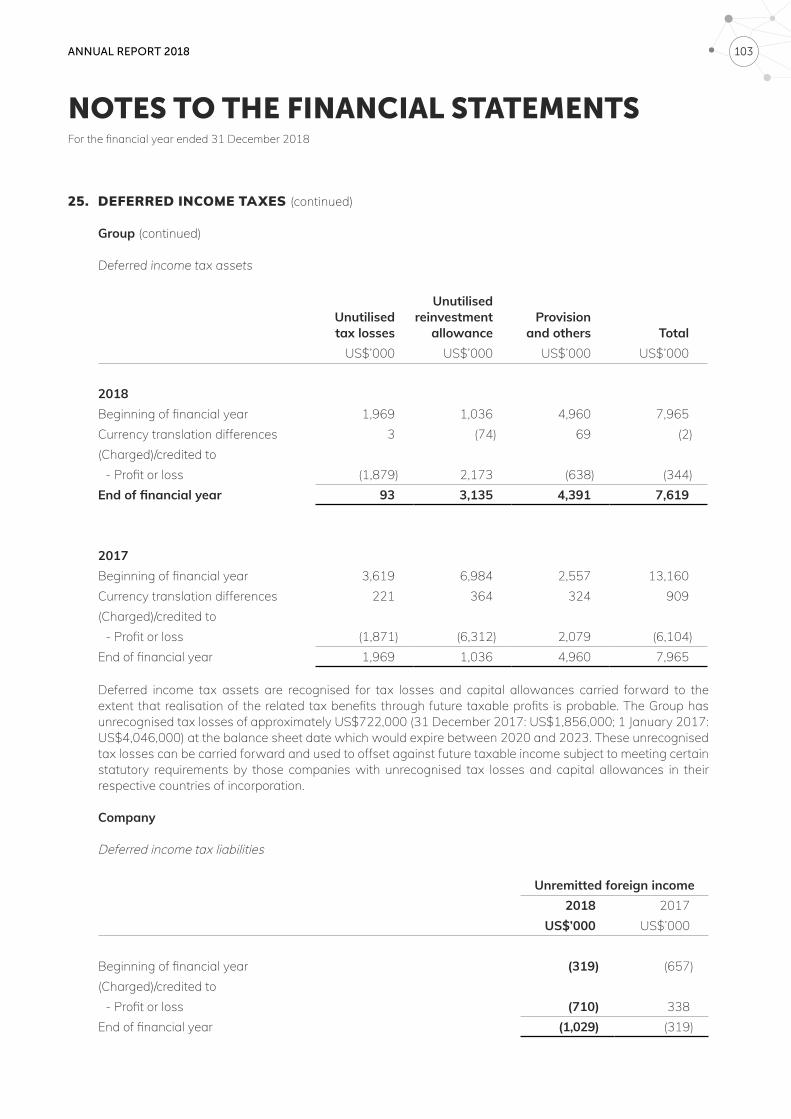
ANNUAL REPORT 2018 103
NOTES TO THE FINANCIAL STATEMENTSFor the financial year ended 31 December 2018
25. DEFERRED INCOME TAXES (continued)
Group (continued)
Deferred income tax assets
Unutilised tax losses
Unutilised reinvestment
allowanceProvision
and others TotalUS$’000 US$’000 US$’000 US$’000
2018Beginning of financial year 1,969 1,036 4,960 7,965Currency translation differences 3 (74) 69 (2)(Charged)/credited to
- Profit or loss (1,879) 2,173 (638) (344)End of financial year 93 3,135 4,391 7,619
2017Beginning of financial year 3,619 6,984 2,557 13,160Currency translation differences 221 364 324 909(Charged)/credited to
- Profit or loss (1,871) (6,312) 2,079 (6,104)End of financial year 1,969 1,036 4,960 7,965
Deferred income tax assets are recognised for tax losses and capital allowances carried forward to the extent that realisation of the related tax benefits through future taxable profits is probable. The Group has unrecognised tax losses of approximately US$722,000 (31 December 2017: US$1,856,000; 1 January 2017: US$4,046,000) at the balance sheet date which would expire between 2020 and 2023. These unrecognised tax losses can be carried forward and used to offset against future taxable income subject to meeting certain statutory requirements by those companies with unrecognised tax losses and capital allowances in their respective countries of incorporation.
Company
Deferred income tax liabilities
Unremitted foreign income2018 2017
US$’000 US$’000
Beginning of financial year (319) (657)(Charged)/credited to
- Profit or loss (710) 338End of financial year (1,029) (319)
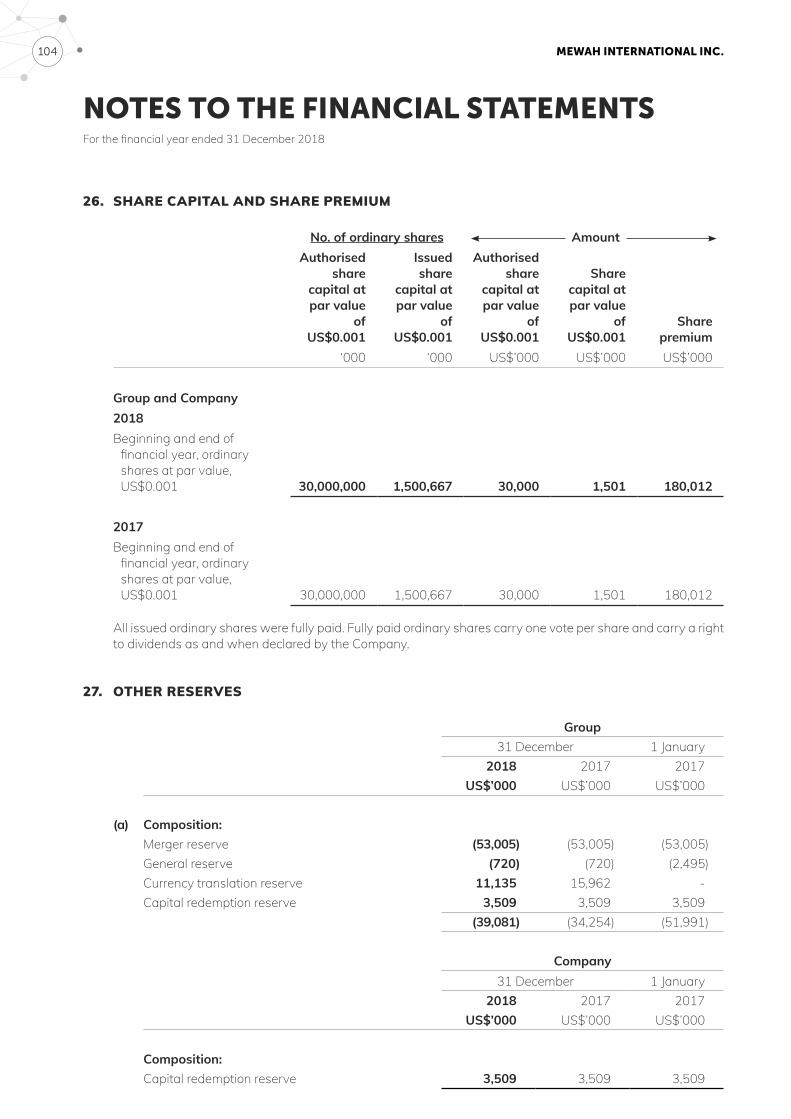
MEWAH INTERNATIONAL INC. 104
NOTES TO THE FINANCIAL STATEMENTSFor the financial year ended 31 December 2018
26. SHARE CAPITAL AND SHARE PREMIUM
No. of ordinary shares Amount Authorised
share capital at par value
ofUS$0.001
Issued share
capital at par value
ofUS$0.001
Authorised share
capital at par value
ofUS$0.001
Share capital at par value
ofUS$0.001
Share premium
‘000 ‘000 US$’000 US$’000 US$’000
Group and Company2018Beginning and end of
financial year, ordinary shares at par value, US$0.001 30,000,000 1,500,667 30,000 1,501 180,012
2017Beginning and end of
financial year, ordinary shares at par value, US$0.001 30,000,000 1,500,667 30,000 1,501 180,012
All issued ordinary shares were fully paid. Fully paid ordinary shares carry one vote per share and carry a right to dividends as and when declared by the Company.
27. OTHER RESERVES
Group31 December 1 January
2018 2017 2017US$’000 US$’000 US$’000
(a) Composition:Merger reserve (53,005) (53,005) (53,005)General reserve (720) (720) (2,495)Currency translation reserve 11,135 15,962 -Capital redemption reserve 3,509 3,509 3,509
(39,081) (34,254) (51,991)
Company31 December 1 January
2018 2017 2017US$’000 US$’000 US$’000
Composition:Capital redemption reserve 3,509 3,509 3,509
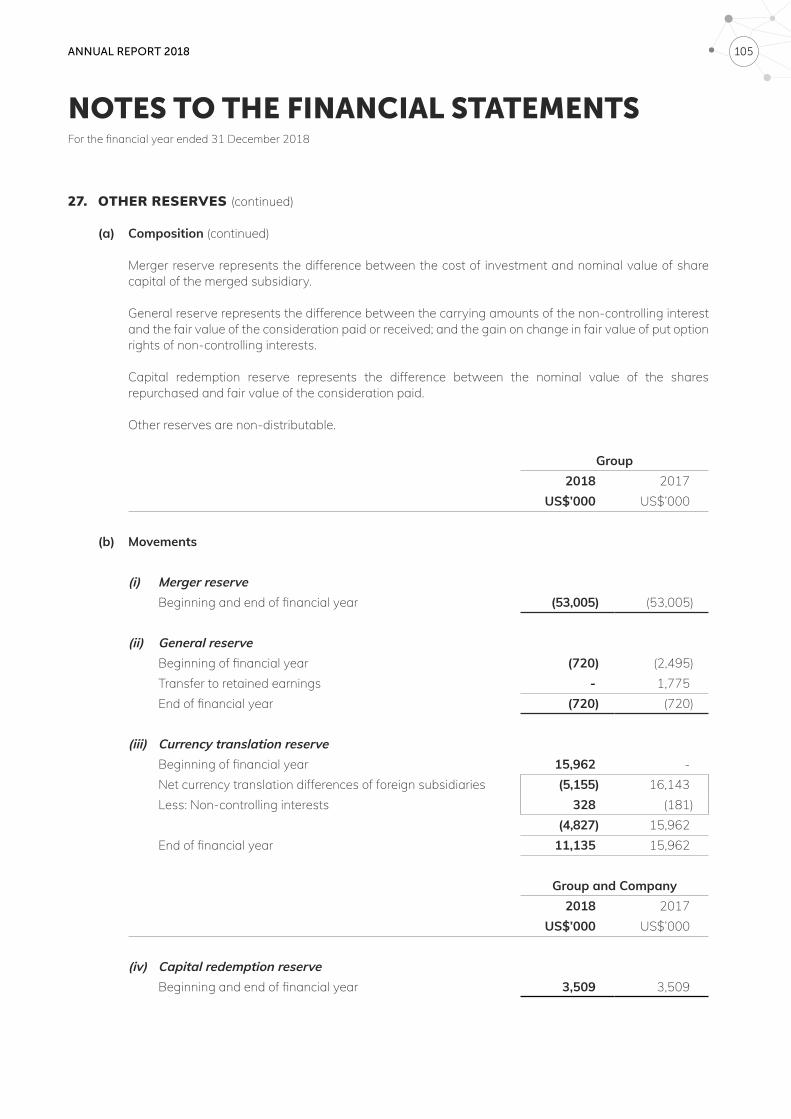
ANNUAL REPORT 2018 105
NOTES TO THE FINANCIAL STATEMENTSFor the financial year ended 31 December 2018
27. OTHER RESERVES (continued)
(a) Composition (continued)
Merger reserve represents the difference between the cost of investment and nominal value of share capital of the merged subsidiary.
General reserve represents the difference between the carrying amounts of the non-controlling interest and the fair value of the consideration paid or received; and the gain on change in fair value of put option rights of non-controlling interests.
Capital redemption reserve represents the difference between the nominal value of the shares repurchased and fair value of the consideration paid. Other reserves are non-distributable.
Group2018 2017
US$’000 US$’000
(b) Movements
(i) Merger reserveBeginning and end of financial year (53,005) (53,005)
(ii) General reserveBeginning of financial year (720) (2,495)Transfer to retained earnings - 1,775End of financial year (720) (720)
(iii) Currency translation reserveBeginning of financial year 15,962 -Net currency translation differences of foreign subsidiaries (5,155) 16,143Less: Non-controlling interests 328 (181)
(4,827) 15,962End of financial year 11,135 15,962
Group and Company2018 2017
US$’000 US$’000
(iv) Capital redemption reserveBeginning and end of financial year 3,509 3,509
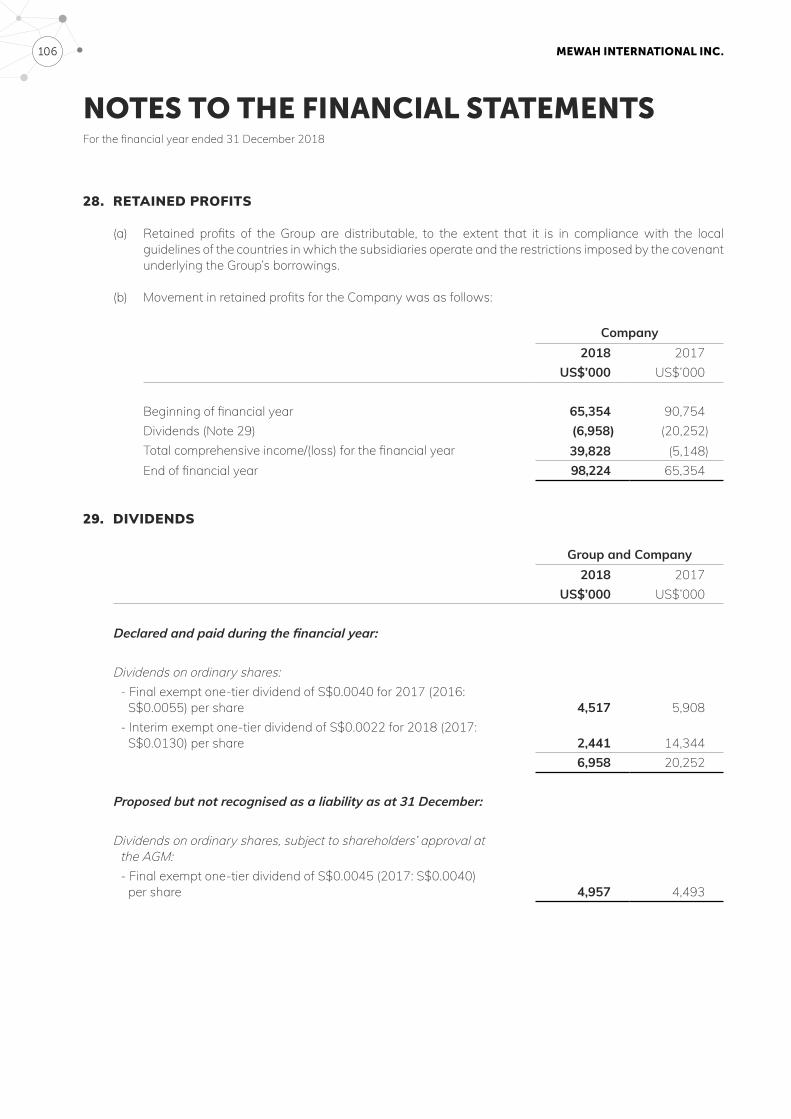
MEWAH INTERNATIONAL INC. 106
NOTES TO THE FINANCIAL STATEMENTSFor the financial year ended 31 December 2018
28. RETAINED PROFITS
(a) Retained profits of the Group are distributable, to the extent that it is in compliance with the local guidelines of the countries in which the subsidiaries operate and the restrictions imposed by the covenant underlying the Group’s borrowings.
(b) Movement in retained profits for the Company was as follows:
Company2018 2017
US$’000 US$’000
Beginning of financial year 65,354 90,754Dividends (Note 29) (6,958) (20,252)Total comprehensive income/(loss) for the financial year 39,828 (5,148)End of financial year 98,224 65,354
29. DIVIDENDS
Group and Company2018 2017
US$’000 US$’000
Declared and paid during the financial year:
Dividends on ordinary shares:- Final exempt one-tier dividend of S$0.0040 for 2017 (2016:
S$0.0055) per share 4,517 5,908- Interim exempt one-tier dividend of S$0.0022 for 2018 (2017:
S$0.0130) per share 2,441 14,3446,958 20,252
Proposed but not recognised as a liability as at 31 December:
Dividends on ordinary shares, subject to shareholders’ approval at the AGM:- Final exempt one-tier dividend of S$0.0045 (2017: S$0.0040)
per share 4,957 4,493
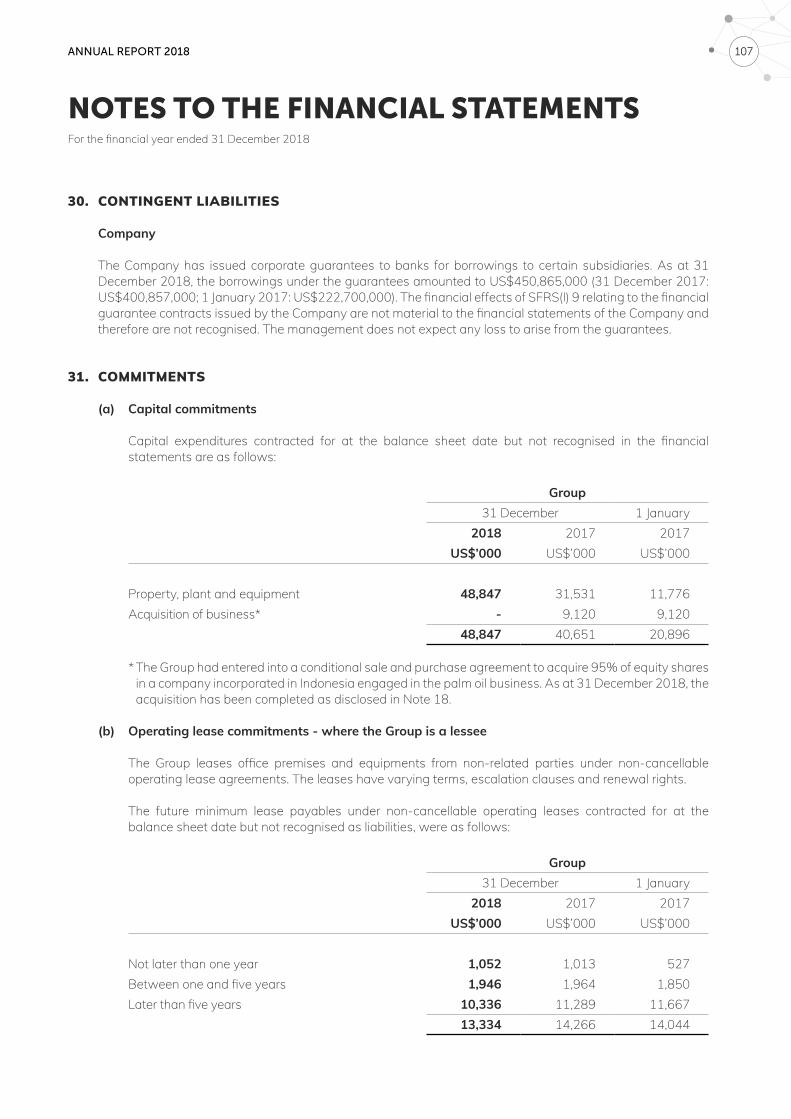
ANNUAL REPORT 2018 107
NOTES TO THE FINANCIAL STATEMENTSFor the financial year ended 31 December 2018
30. CONTINGENT LIABILITIES
Company
The Company has issued corporate guarantees to banks for borrowings to certain subsidiaries. As at 31 December 2018, the borrowings under the guarantees amounted to US$450,865,000 (31 December 2017: US$400,857,000; 1 January 2017: US$222,700,000). The financial effects of SFRS(I) 9 relating to the financial guarantee contracts issued by the Company are not material to the financial statements of the Company and therefore are not recognised. The management does not expect any loss to arise from the guarantees.
31. COMMITMENTS
(a) Capital commitments
Capital expenditures contracted for at the balance sheet date but not recognised in the financial statements are as follows:
Group31 December 1 January
2018 2017 2017US$’000 US$’000 US$’000
Property, plant and equipment 48,847 31,531 11,776Acquisition of business* - 9,120 9,120
48,847 40,651 20,896
* The Group had entered into a conditional sale and purchase agreement to acquire 95% of equity shares in a company incorporated in Indonesia engaged in the palm oil business. As at 31 December 2018, the acquisition has been completed as disclosed in Note 18.
(b) Operating lease commitments - where the Group is a lessee
The Group leases office premises and equipments from non-related parties under non-cancellable operating lease agreements. The leases have varying terms, escalation clauses and renewal rights.
The future minimum lease payables under non-cancellable operating leases contracted for at the balance sheet date but not recognised as liabilities, were as follows:
Group31 December 1 January
2018 2017 2017US$’000 US$’000 US$’000
Not later than one year 1,052 1,013 527Between one and five years 1,946 1,964 1,850Later than five years 10,336 11,289 11,667
13,334 14,266 14,044
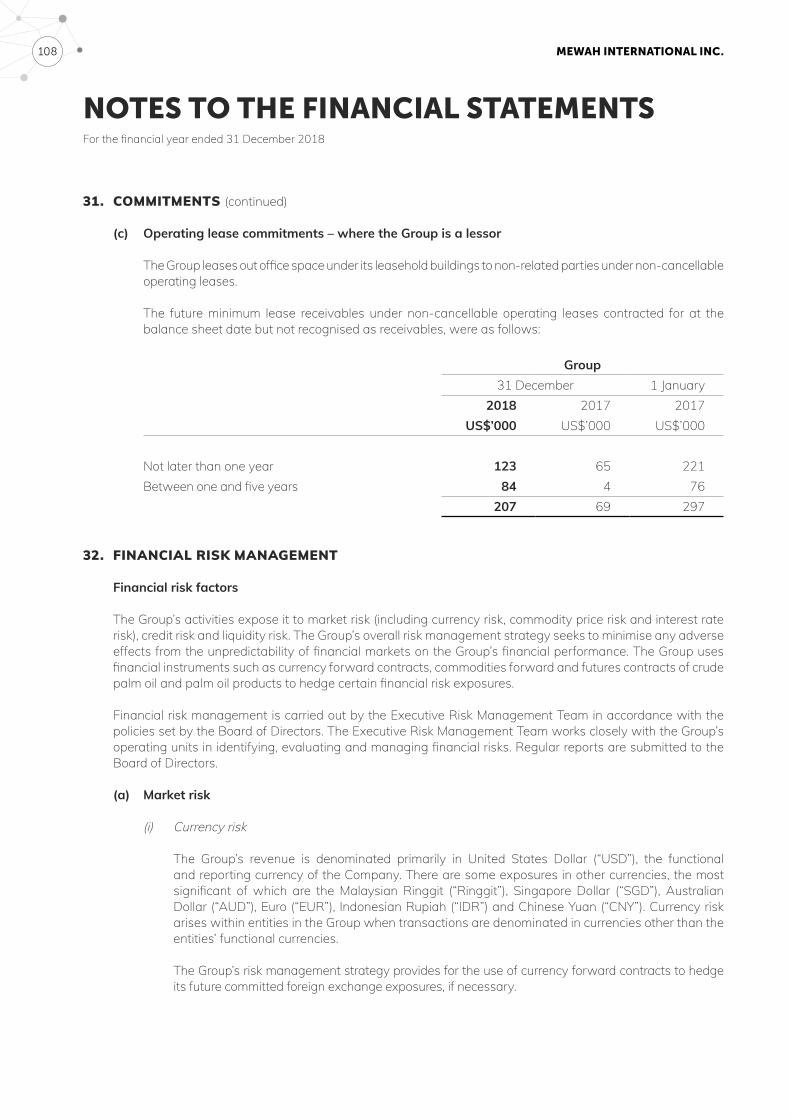
MEWAH INTERNATIONAL INC. 108
NOTES TO THE FINANCIAL STATEMENTSFor the financial year ended 31 December 2018
31. COMMITMENTS (continued)
(c) Operating lease commitments – where the Group is a lessor
The Group leases out office space under its leasehold buildings to non-related parties under non-cancellable operating leases.
The future minimum lease receivables under non-cancellable operating leases contracted for at the balance sheet date but not recognised as receivables, were as follows:
Group31 December 1 January
2018 2017 2017US$’000 US$’000 US$’000
Not later than one year 123 65 221Between one and five years 84 4 76
207 69 297
32. FINANCIAL RISK MANAGEMENT
Financial risk factors
The Group’s activities expose it to market risk (including currency risk, commodity price risk and interest rate risk), credit risk and liquidity risk. The Group’s overall risk management strategy seeks to minimise any adverse effects from the unpredictability of financial markets on the Group’s financial performance. The Group uses financial instruments such as currency forward contracts, commodities forward and futures contracts of crude palm oil and palm oil products to hedge certain financial risk exposures.
Financial risk management is carried out by the Executive Risk Management Team in accordance with the policies set by the Board of Directors. The Executive Risk Management Team works closely with the Group’s operating units in identifying, evaluating and managing financial risks. Regular reports are submitted to the Board of Directors.
(a) Market risk
(i) Currency risk
The Group’s revenue is denominated primarily in United States Dollar (“USD”), the functional and reporting currency of the Company. There are some exposures in other currencies, the most significant of which are the Malaysian Ringgit (“Ringgit”), Singapore Dollar (“SGD”), Australian Dollar (“AUD”), Euro (“EUR”), Indonesian Rupiah (“IDR”) and Chinese Yuan (“CNY”). Currency risk arises within entities in the Group when transactions are denominated in currencies other than the entities’ functional currencies.
The Group’s risk management strategy provides for the use of currency forward contracts to hedge its future committed foreign exchange exposures, if necessary.
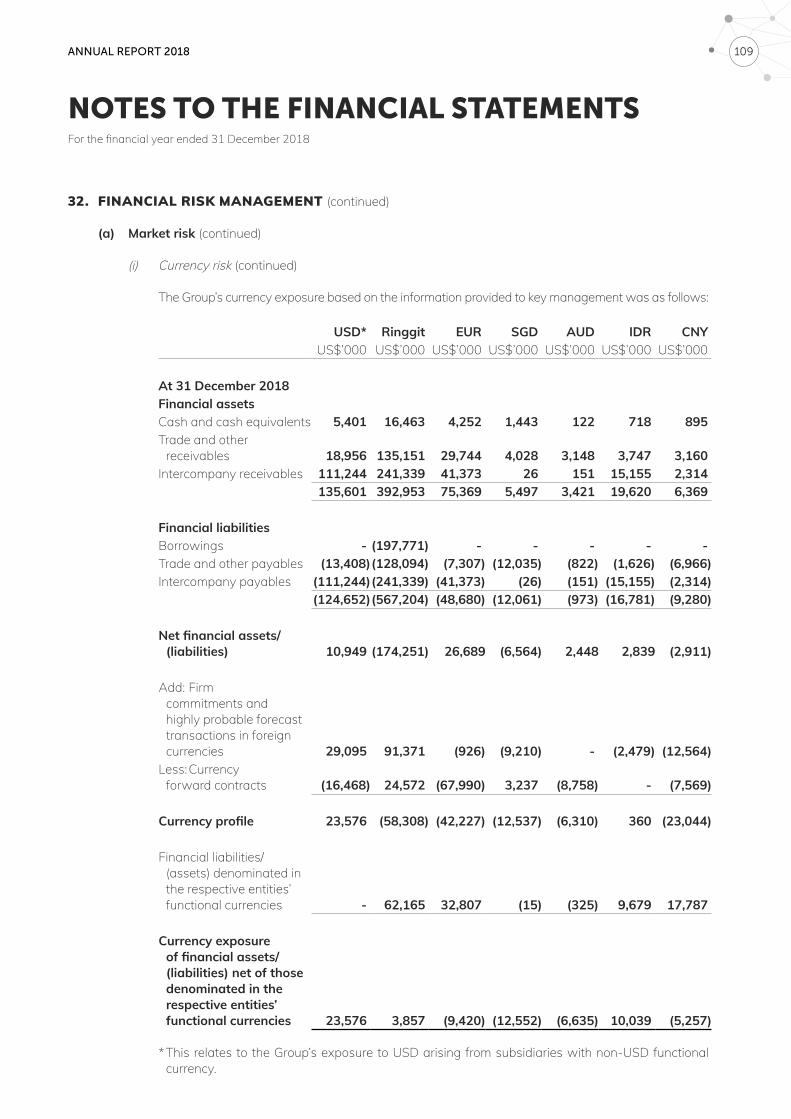
ANNUAL REPORT 2018 109
NOTES TO THE FINANCIAL STATEMENTSFor the financial year ended 31 December 2018
32. FINANCIAL RISK MANAGEMENT (continued)
(a) Market risk (continued)
(i) Currency risk (continued)
The Group’s currency exposure based on the information provided to key management was as follows:
USD* Ringgit EUR SGD AUD IDR CNYUS$’000 US$’000 US$’000 US$’000 US$’000 US$’000 US$’000
At 31 December 2018Financial assetsCash and cash equivalents 5,401 16,463 4,252 1,443 122 718 895Trade and other
receivables 18,956 135,151 29,744 4,028 3,148 3,747 3,160Intercompany receivables 111,244 241,339 41,373 26 151 15,155 2,314
135,601 392,953 75,369 5,497 3,421 19,620 6,369
Financial liabilitiesBorrowings - (197,771) - - - - -Trade and other payables (13,408)(128,094) (7,307) (12,035) (822) (1,626) (6,966)Intercompany payables (111,244)(241,339) (41,373) (26) (151) (15,155) (2,314)
(124,652)(567,204) (48,680) (12,061) (973) (16,781) (9,280)
Net financial assets/ (liabilities) 10,949 (174,251) 26,689 (6,564) 2,448 2,839 (2,911)
Add: Firm commitments and highly probable forecast transactions in foreign currencies 29,095 91,371 (926) (9,210) - (2,479) (12,564)
Less: Currency forward contracts (16,468) 24,572 (67,990) 3,237 (8,758) - (7,569)
Currency profile 23,576 (58,308) (42,227) (12,537) (6,310) 360 (23,044)
Financial liabilities/(assets) denominated in the respective entities’ functional currencies - 62,165 32,807 (15) (325) 9,679 17,787
Currency exposure of financial assets/ (liabilities) net of those denominated in the respective entities’ functional currencies 23,576 3,857 (9,420) (12,552) (6,635) 10,039 (5,257)
* This relates to the Group’s exposure to USD arising from subsidiaries with non-USD functional currency.
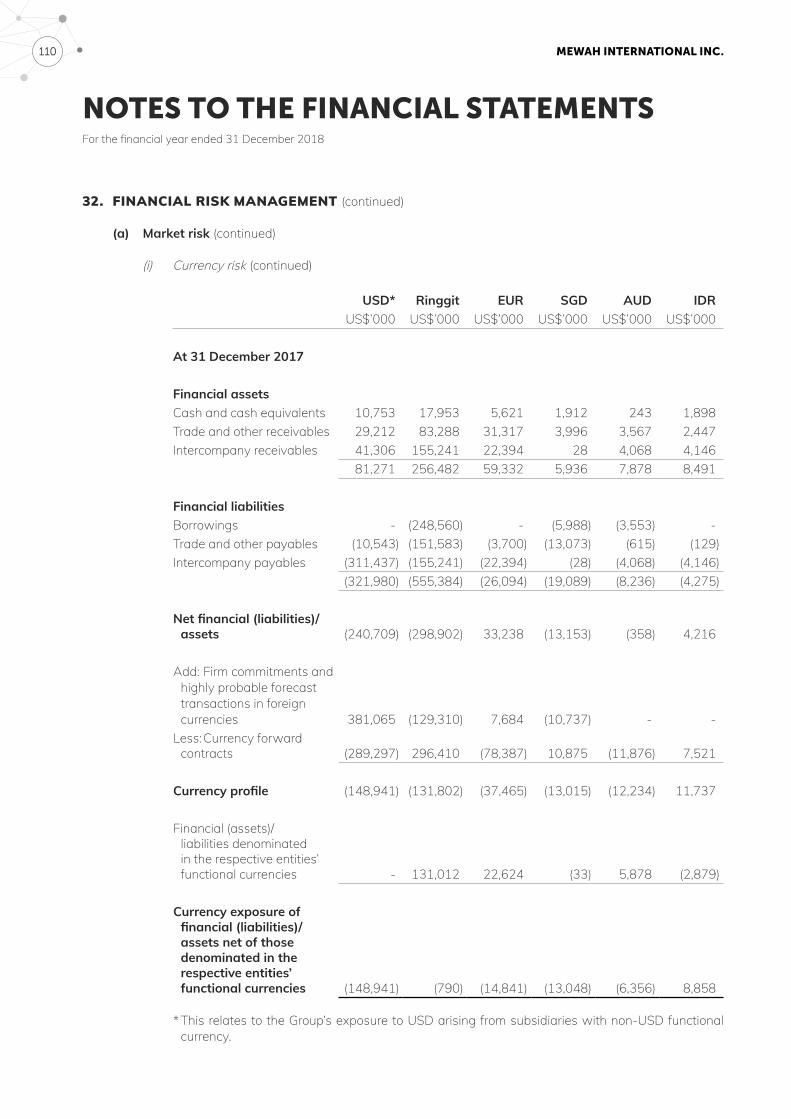
MEWAH INTERNATIONAL INC. 110
NOTES TO THE FINANCIAL STATEMENTSFor the financial year ended 31 December 2018
32. FINANCIAL RISK MANAGEMENT (continued)
(a) Market risk (continued)
(i) Currency risk (continued)
USD* Ringgit EUR SGD AUD IDRUS$’000 US$’000 US$’000 US$’000 US$’000 US$’000
At 31 December 2017
Financial assetsCash and cash equivalents 10,753 17,953 5,621 1,912 243 1,898Trade and other receivables 29,212 83,288 31,317 3,996 3,567 2,447Intercompany receivables 41,306 155,241 22,394 28 4,068 4,146
81,271 256,482 59,332 5,936 7,878 8,491
Financial liabilitiesBorrowings - (248,560) - (5,988) (3,553) -Trade and other payables (10,543) (151,583) (3,700) (13,073) (615) (129)Intercompany payables (311,437) (155,241) (22,394) (28) (4,068) (4,146)
(321,980) (555,384) (26,094) (19,089) (8,236) (4,275)
Net financial (liabilities)/assets (240,709) (298,902) 33,238 (13,153) (358) 4,216
Add: Firm commitments and highly probable forecast transactions in foreign currencies 381,065 (129,310) 7,684 (10,737) - -
Less: Currency forward contracts (289,297) 296,410 (78,387) 10,875 (11,876) 7,521
Currency profile (148,941) (131,802) (37,465) (13,015) (12,234) 11,737
Financial (assets)/ liabilities denominated in the respective entities’ functional currencies - 131,012 22,624 (33) 5,878 (2,879)
Currency exposure of financial (liabilities)/ assets net of those denominated in the respective entities’ functional currencies (148,941) (790) (14,841) (13,048) (6,356) 8,858
* This relates to the Group’s exposure to USD arising from subsidiaries with non-USD functional currency.
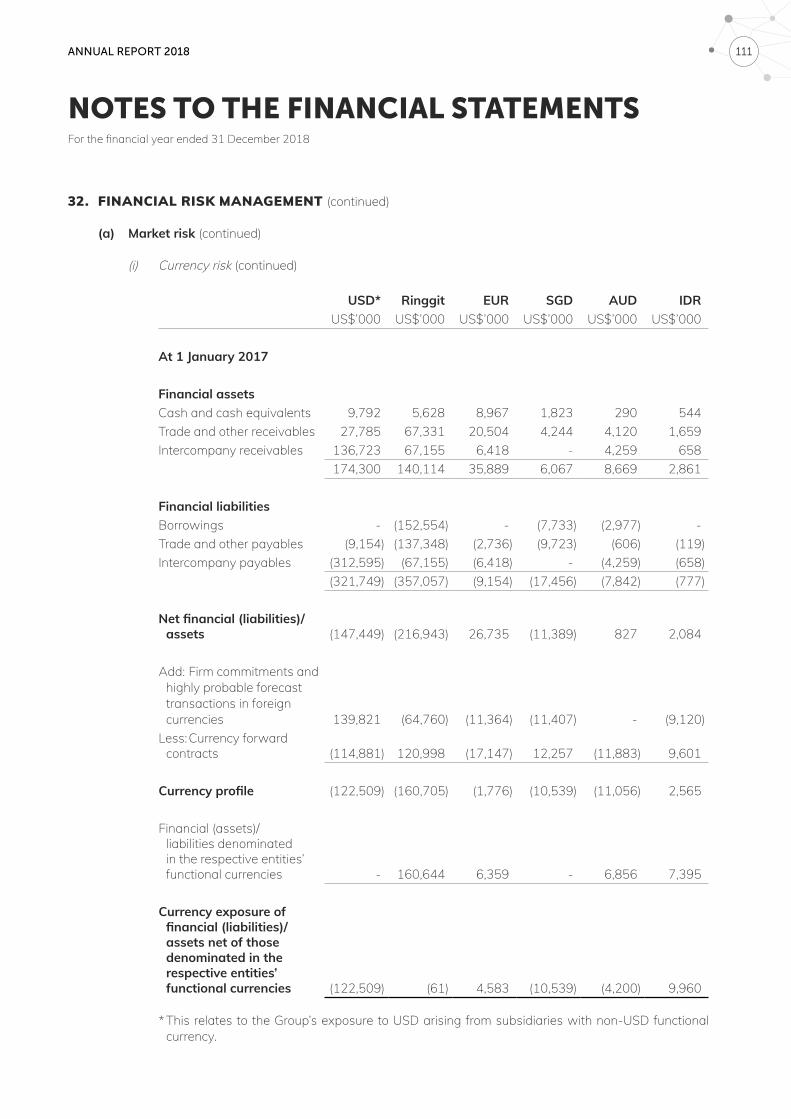
ANNUAL REPORT 2018 111
NOTES TO THE FINANCIAL STATEMENTSFor the financial year ended 31 December 2018
32. FINANCIAL RISK MANAGEMENT (continued)
(a) Market risk (continued)
(i) Currency risk (continued)
USD* Ringgit EUR SGD AUD IDRUS$’000 US$’000 US$’000 US$’000 US$’000 US$’000
At 1 January 2017
Financial assetsCash and cash equivalents 9,792 5,628 8,967 1,823 290 544Trade and other receivables 27,785 67,331 20,504 4,244 4,120 1,659Intercompany receivables 136,723 67,155 6,418 - 4,259 658
174,300 140,114 35,889 6,067 8,669 2,861
Financial liabilitiesBorrowings - (152,554) - (7,733) (2,977) -Trade and other payables (9,154) (137,348) (2,736) (9,723) (606) (119)Intercompany payables (312,595) (67,155) (6,418) - (4,259) (658)
(321,749) (357,057) (9,154) (17,456) (7,842) (777)
Net financial (liabilities)/assets (147,449) (216,943) 26,735 (11,389) 827 2,084
Add: Firm commitments and highly probable forecast transactions in foreign currencies 139,821 (64,760) (11,364) (11,407) - (9,120)
Less: Currency forward contracts (114,881) 120,998 (17,147) 12,257 (11,883) 9,601
Currency profile (122,509) (160,705) (1,776) (10,539) (11,056) 2,565
Financial (assets)/ liabilities denominated in the respective entities’ functional currencies - 160,644 6,359 - 6,856 7,395
Currency exposure of financial (liabilities)/ assets net of those denominated in the respective entities’ functional currencies (122,509) (61) 4,583 (10,539) (4,200) 9,960
* This relates to the Group’s exposure to USD arising from subsidiaries with non-USD functional currency.
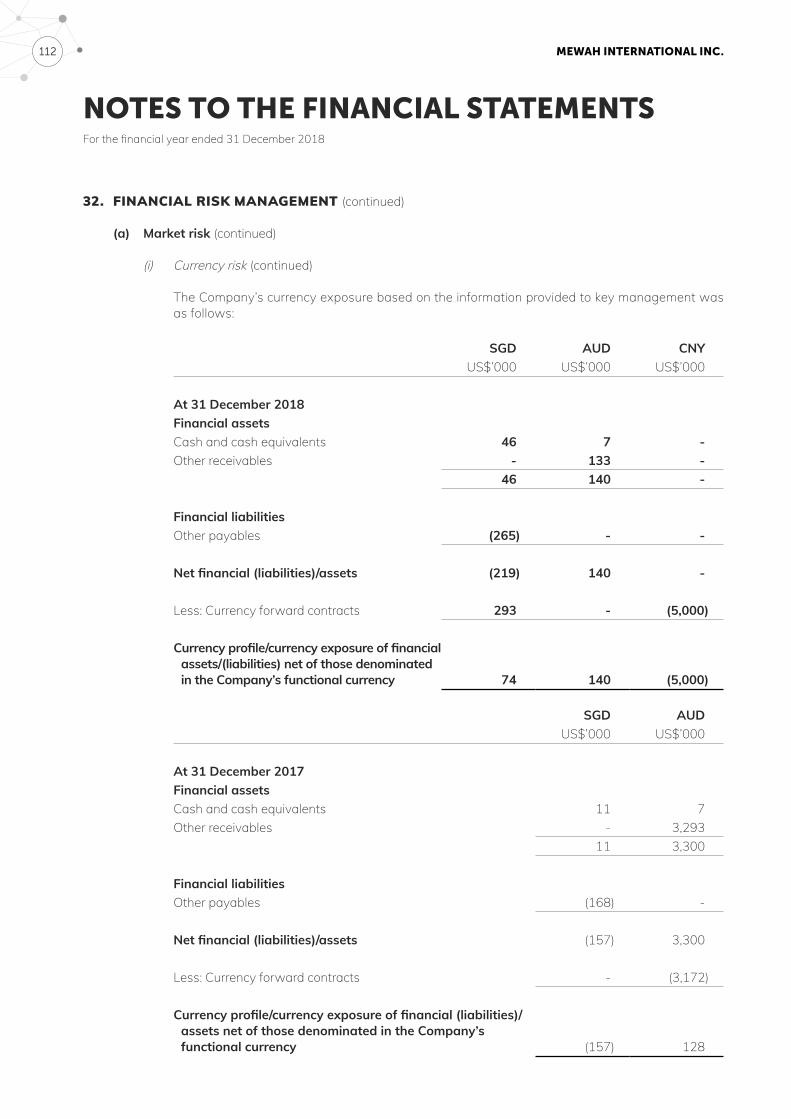
MEWAH INTERNATIONAL INC. 112
NOTES TO THE FINANCIAL STATEMENTSFor the financial year ended 31 December 2018
32. FINANCIAL RISK MANAGEMENT (continued)
(a) Market risk (continued)
(i) Currency risk (continued)
The Company’s currency exposure based on the information provided to key management was as follows:
SGD AUD CNYUS$’000 US$’000 US$’000
At 31 December 2018Financial assetsCash and cash equivalents 46 7 -Other receivables - 133 -
46 140 -
Financial liabilitiesOther payables (265) - -
Net financial (liabilities)/assets (219) 140 -
Less: Currency forward contracts 293 - (5,000)
Currency profile/currency exposure of financial assets/(liabilities) net of those denominated in the Company’s functional currency 74 140 (5,000)
SGD AUDUS$’000 US$’000
At 31 December 2017Financial assetsCash and cash equivalents 11 7Other receivables - 3,293
11 3,300
Financial liabilitiesOther payables (168) -
Net financial (liabilities)/assets (157) 3,300
Less: Currency forward contracts - (3,172)
Currency profile/currency exposure of financial (liabilities)/assets net of those denominated in the Company’s functional currency (157) 128
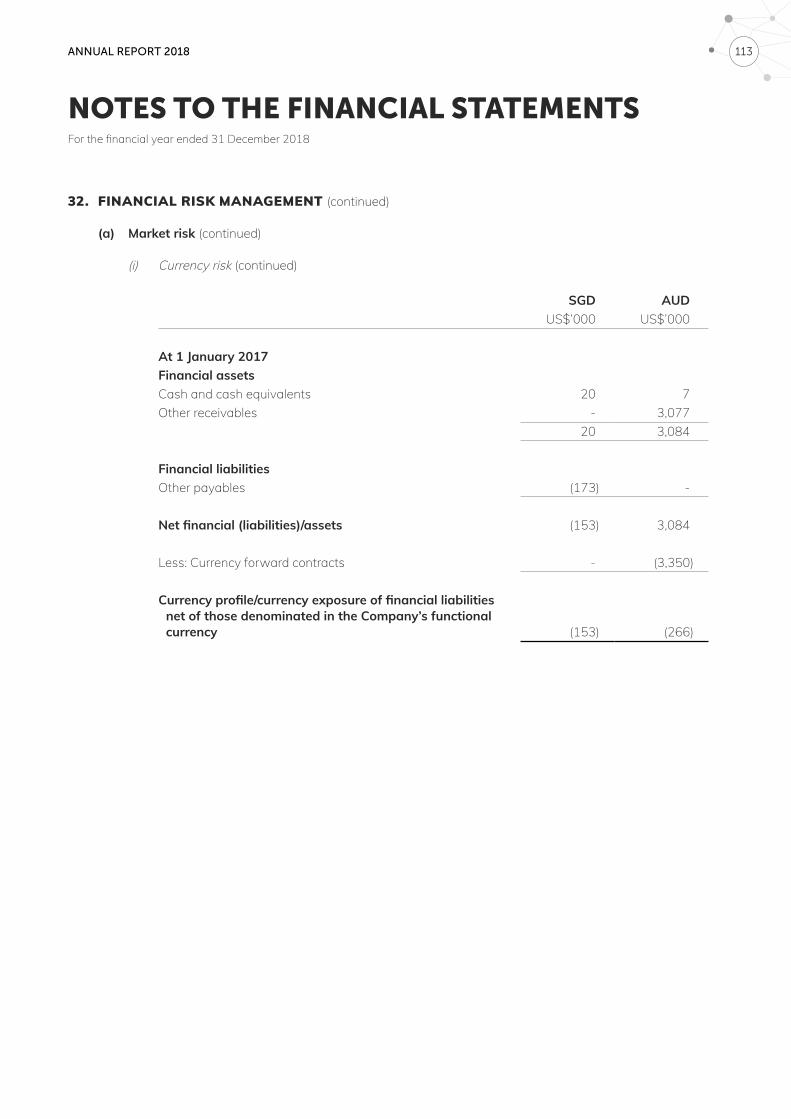
ANNUAL REPORT 2018 113
NOTES TO THE FINANCIAL STATEMENTSFor the financial year ended 31 December 2018
32. FINANCIAL RISK MANAGEMENT (continued)
(a) Market risk (continued)
(i) Currency risk (continued)
SGD AUDUS$’000 US$’000
At 1 January 2017Financial assetsCash and cash equivalents 20 7Other receivables - 3,077
20 3,084
Financial liabilitiesOther payables (173) -
Net financial (liabilities)/assets (153) 3,084
Less: Currency forward contracts - (3,350)
Currency profile/currency exposure of financial liabilities net of those denominated in the Company’s functional currency (153) (266)
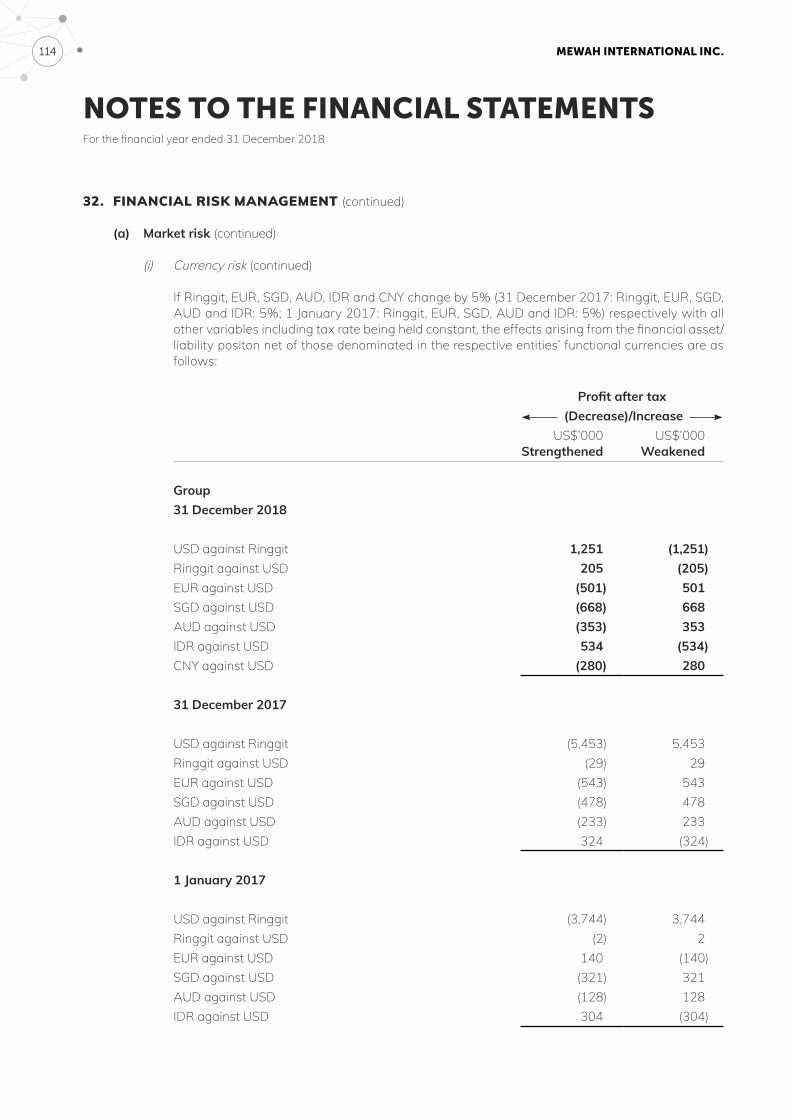
MEWAH INTERNATIONAL INC. 114
NOTES TO THE FINANCIAL STATEMENTSFor the financial year ended 31 December 2018
32. FINANCIAL RISK MANAGEMENT (continued)
(a) Market risk (continued)
(i) Currency risk (continued)
If Ringgit, EUR, SGD, AUD, IDR and CNY change by 5% (31 December 2017: Ringgit, EUR, SGD, AUD and IDR: 5%; 1 January 2017: Ringgit, EUR, SGD, AUD and IDR: 5%) respectively with all other variables including tax rate being held constant, the effects arising from the financial asset/liability positon net of those denominated in the respective entities’ functional currencies are as follows:
Profit after tax (Decrease)/Increase
US$’000Strengthened
US$’000Weakened
Group31 December 2018
USD against Ringgit 1,251 (1,251)Ringgit against USD 205 (205)EUR against USD (501) 501SGD against USD (668) 668AUD against USD (353) 353IDR against USD 534 (534)CNY against USD (280) 280
31 December 2017
USD against Ringgit (5,453) 5,453Ringgit against USD (29) 29EUR against USD (543) 543SGD against USD (478) 478AUD against USD (233) 233IDR against USD 324 (324)
1 January 2017
USD against Ringgit (3,744) 3,744Ringgit against USD (2) 2EUR against USD 140 (140)SGD against USD (321) 321AUD against USD (128) 128IDR against USD 304 (304)
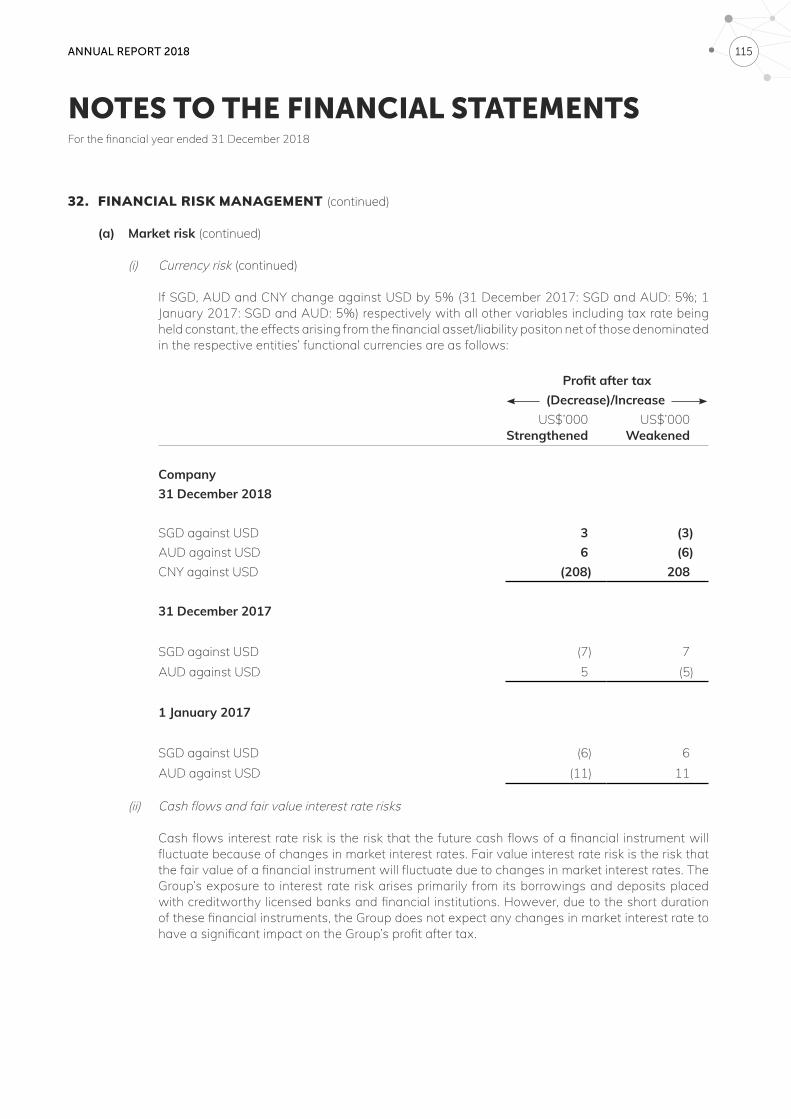
ANNUAL REPORT 2018 115
NOTES TO THE FINANCIAL STATEMENTSFor the financial year ended 31 December 2018
32. FINANCIAL RISK MANAGEMENT (continued)
(a) Market risk (continued)
(i) Currency risk (continued)
If SGD, AUD and CNY change against USD by 5% (31 December 2017: SGD and AUD: 5%; 1 January 2017: SGD and AUD: 5%) respectively with all other variables including tax rate being held constant, the effects arising from the financial asset/liability positon net of those denominated in the respective entities’ functional currencies are as follows:
Profit after tax (Decrease)/Increase US$’000
StrengthenedUS$’000
Weakened
Company31 December 2018
SGD against USD 3 (3)AUD against USD 6 (6)CNY against USD (208) 208
31 December 2017
SGD against USD (7) 7AUD against USD 5 (5)
1 January 2017
SGD against USD (6) 6AUD against USD (11) 11
(ii) Cash flows and fair value interest rate risks
Cash flows interest rate risk is the risk that the future cash flows of a financial instrument will fluctuate because of changes in market interest rates. Fair value interest rate risk is the risk that the fair value of a financial instrument will fluctuate due to changes in market interest rates. The Group’s exposure to interest rate risk arises primarily from its borrowings and deposits placed with creditworthy licensed banks and financial institutions. However, due to the short duration of these financial instruments, the Group does not expect any changes in market interest rate to have a significant impact on the Group’s profit after tax.
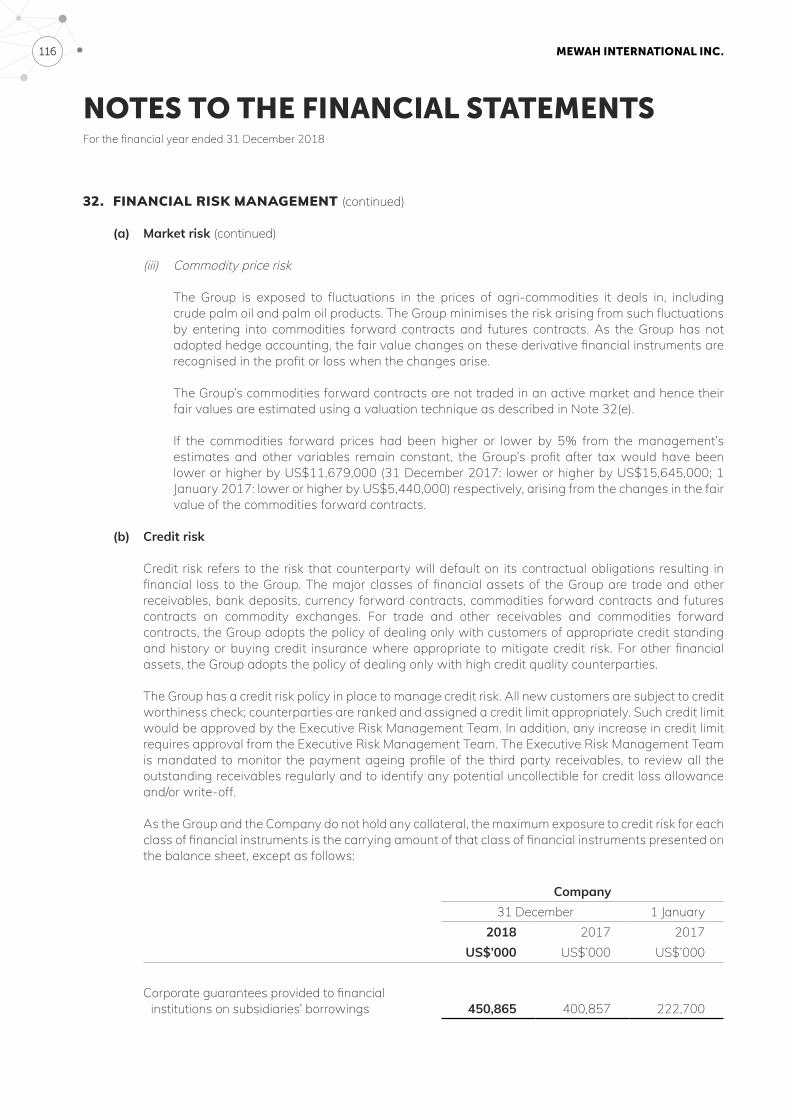
MEWAH INTERNATIONAL INC. 116
NOTES TO THE FINANCIAL STATEMENTSFor the financial year ended 31 December 2018
32. FINANCIAL RISK MANAGEMENT (continued)
(a) Market risk (continued)
(iii) Commodity price risk
The Group is exposed to fluctuations in the prices of agri-commodities it deals in, including crude palm oil and palm oil products. The Group minimises the risk arising from such fluctuations by entering into commodities forward contracts and futures contracts. As the Group has not adopted hedge accounting, the fair value changes on these derivative financial instruments are recognised in the profit or loss when the changes arise.
The Group’s commodities forward contracts are not traded in an active market and hence their fair values are estimated using a valuation technique as described in Note 32(e).
If the commodities forward prices had been higher or lower by 5% from the management’s estimates and other variables remain constant, the Group’s profit after tax would have been lower or higher by US$11,679,000 (31 December 2017: lower or higher by US$15,645,000; 1 January 2017: lower or higher by US$5,440,000) respectively, arising from the changes in the fair value of the commodities forward contracts.
(b) Credit risk
Credit risk refers to the risk that counterparty will default on its contractual obligations resulting in financial loss to the Group. The major classes of financial assets of the Group are trade and other receivables, bank deposits, currency forward contracts, commodities forward contracts and futures contracts on commodity exchanges. For trade and other receivables and commodities forward contracts, the Group adopts the policy of dealing only with customers of appropriate credit standing and history or buying credit insurance where appropriate to mitigate credit risk. For other financial assets, the Group adopts the policy of dealing only with high credit quality counterparties.
The Group has a credit risk policy in place to manage credit risk. All new customers are subject to credit worthiness check; counterparties are ranked and assigned a credit limit appropriately. Such credit limit would be approved by the Executive Risk Management Team. In addition, any increase in credit limit requires approval from the Executive Risk Management Team. The Executive Risk Management Team is mandated to monitor the payment ageing profile of the third party receivables, to review all the outstanding receivables regularly and to identify any potential uncollectible for credit loss allowance and/or write-off.
As the Group and the Company do not hold any collateral, the maximum exposure to credit risk for each class of financial instruments is the carrying amount of that class of financial instruments presented on the balance sheet, except as follows:
Company31 December 1 January
2018 2017 2017US$’000 US$’000 US$’000
Corporate guarantees provided to financial institutions on subsidiaries’ borrowings 450,865 400,857 222,700
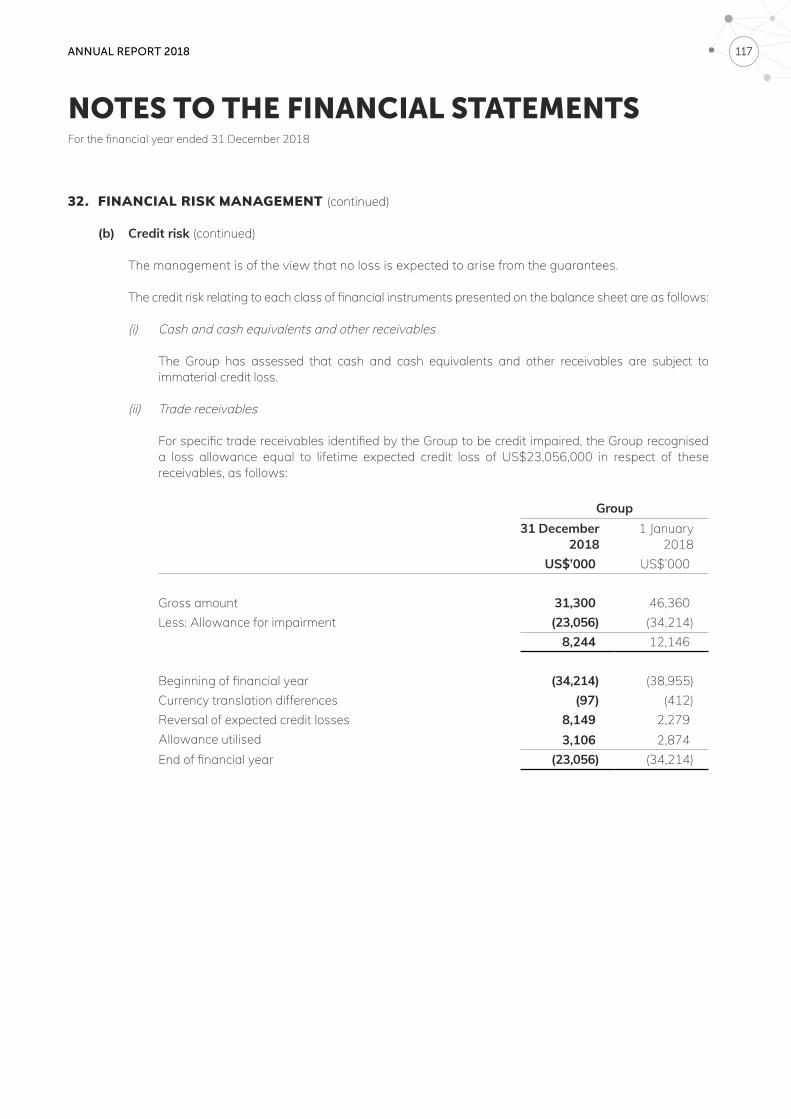
ANNUAL REPORT 2018 117
NOTES TO THE FINANCIAL STATEMENTSFor the financial year ended 31 December 2018
32. FINANCIAL RISK MANAGEMENT (continued)
(b) Credit risk (continued)
The management is of the view that no loss is expected to arise from the guarantees.
The credit risk relating to each class of financial instruments presented on the balance sheet are as follows:
(i) Cash and cash equivalents and other receivables
The Group has assessed that cash and cash equivalents and other receivables are subject to immaterial credit loss.
(ii) Trade receivables
For specific trade receivables identified by the Group to be credit impaired, the Group recognised a loss allowance equal to lifetime expected credit loss of US$23,056,000 in respect of these receivables, as follows:
Group31 December
20181 January
2018US$’000 US$’000
Gross amount 31,300 46,360Less: Allowance for impairment (23,056) (34,214)
8,244 12,146
Beginning of financial year (34,214) (38,955)Currency translation differences (97) (412)Reversal of expected credit losses 8,149 2,279Allowance utilised 3,106 2,874End of financial year (23,056) (34,214)
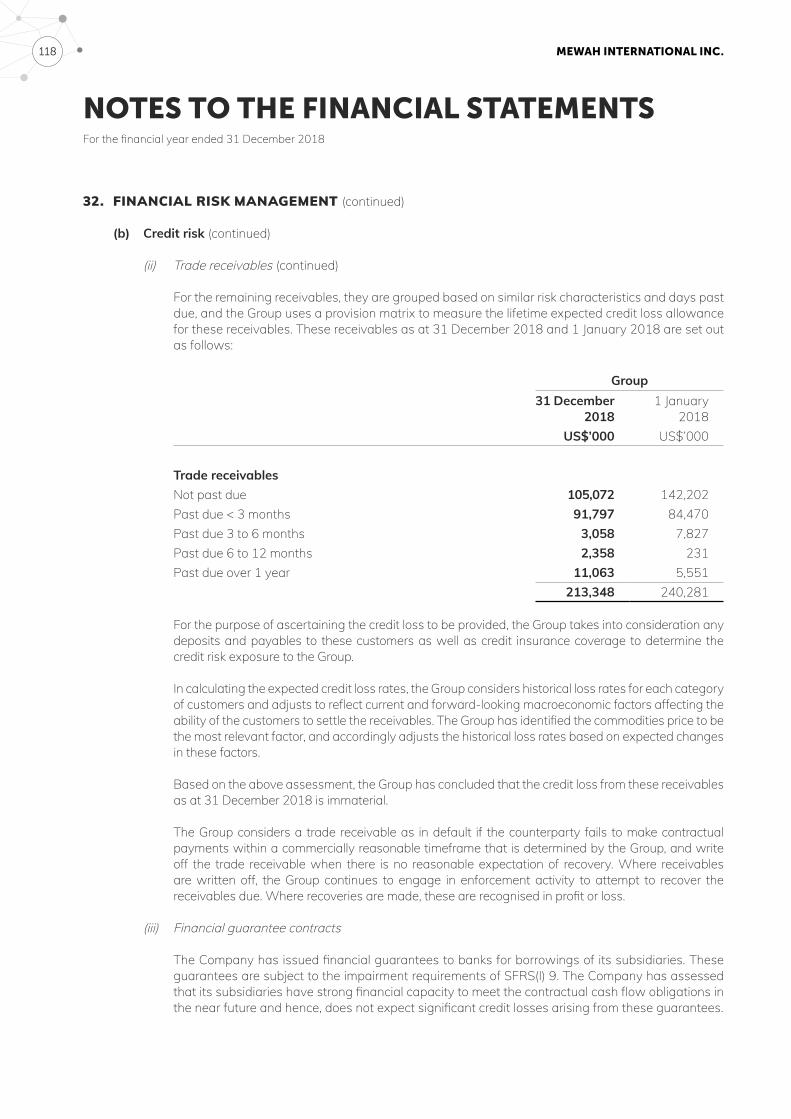
MEWAH INTERNATIONAL INC. 118
NOTES TO THE FINANCIAL STATEMENTSFor the financial year ended 31 December 2018
32. FINANCIAL RISK MANAGEMENT (continued)
(b) Credit risk (continued)
(ii) Trade receivables (continued)
For the remaining receivables, they are grouped based on similar risk characteristics and days past due, and the Group uses a provision matrix to measure the lifetime expected credit loss allowance for these receivables. These receivables as at 31 December 2018 and 1 January 2018 are set out as follows:
Group31 December
20181 January
2018US$’000 US$’000
Trade receivablesNot past due 105,072 142,202Past due < 3 months 91,797 84,470Past due 3 to 6 months 3,058 7,827Past due 6 to 12 months 2,358 231Past due over 1 year 11,063 5,551
213,348 240,281
For the purpose of ascertaining the credit loss to be provided, the Group takes into consideration any deposits and payables to these customers as well as credit insurance coverage to determine the credit risk exposure to the Group.
In calculating the expected credit loss rates, the Group considers historical loss rates for each category of customers and adjusts to reflect current and forward-looking macroeconomic factors affecting the ability of the customers to settle the receivables. The Group has identified the commodities price to be the most relevant factor, and accordingly adjusts the historical loss rates based on expected changes in these factors.
Based on the above assessment, the Group has concluded that the credit loss from these receivables as at 31 December 2018 is immaterial.
The Group considers a trade receivable as in default if the counterparty fails to make contractual payments within a commercially reasonable timeframe that is determined by the Group, and write off the trade receivable when there is no reasonable expectation of recovery. Where receivables are written off, the Group continues to engage in enforcement activity to attempt to recover the receivables due. Where recoveries are made, these are recognised in profit or loss.
(iii) Financial guarantee contracts
The Company has issued financial guarantees to banks for borrowings of its subsidiaries. These guarantees are subject to the impairment requirements of SFRS(I) 9. The Company has assessed that its subsidiaries have strong financial capacity to meet the contractual cash flow obligations in the near future and hence, does not expect significant credit losses arising from these guarantees.
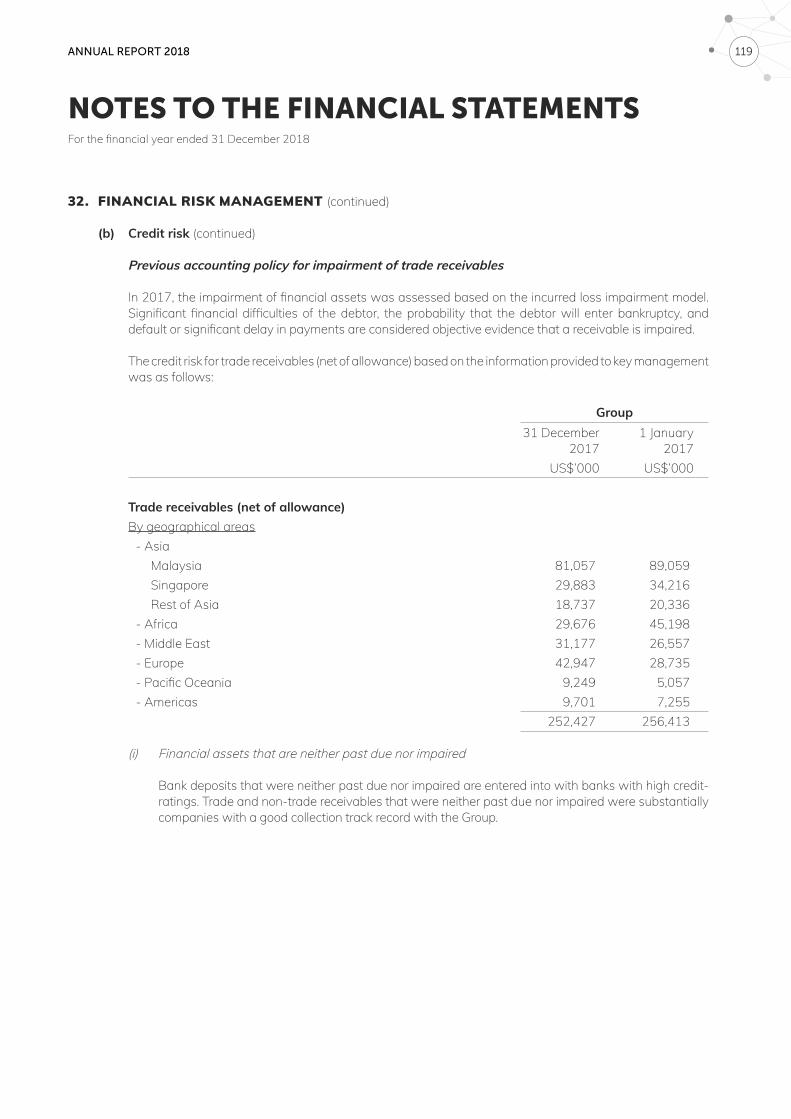
ANNUAL REPORT 2018 119
NOTES TO THE FINANCIAL STATEMENTSFor the financial year ended 31 December 2018
32. FINANCIAL RISK MANAGEMENT (continued)
(b) Credit risk (continued)
Previous accounting policy for impairment of trade receivables
In 2017, the impairment of financial assets was assessed based on the incurred loss impairment model. Significant financial difficulties of the debtor, the probability that the debtor will enter bankruptcy, and default or significant delay in payments are considered objective evidence that a receivable is impaired.
The credit risk for trade receivables (net of allowance) based on the information provided to key management was as follows:
Group31 December
20171 January
2017US$’000 US$’000
Trade receivables (net of allowance)By geographical areas
- AsiaMalaysia 81,057 89,059Singapore 29,883 34,216Rest of Asia 18,737 20,336
- Africa 29,676 45,198- Middle East 31,177 26,557- Europe 42,947 28,735- Pacific Oceania 9,249 5,057- Americas 9,701 7,255
252,427 256,413
(i) Financial assets that are neither past due nor impaired
Bank deposits that were neither past due nor impaired are entered into with banks with high credit-ratings. Trade and non-trade receivables that were neither past due nor impaired were substantially companies with a good collection track record with the Group.
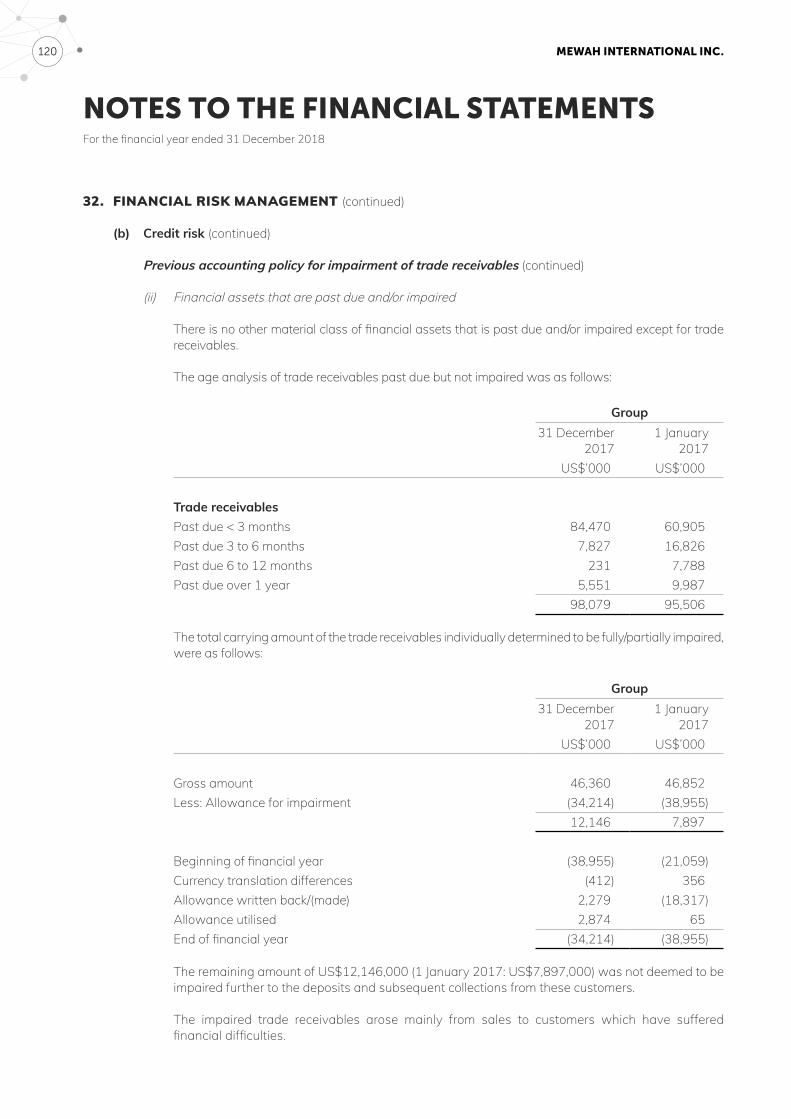
MEWAH INTERNATIONAL INC. 120
NOTES TO THE FINANCIAL STATEMENTSFor the financial year ended 31 December 2018
32. FINANCIAL RISK MANAGEMENT (continued)
(b) Credit risk (continued)
Previous accounting policy for impairment of trade receivables (continued)
(ii) Financial assets that are past due and/or impaired
There is no other material class of financial assets that is past due and/or impaired except for trade receivables.
The age analysis of trade receivables past due but not impaired was as follows:
Group31 December
20171 January
2017US$’000 US$’000
Trade receivablesPast due < 3 months 84,470 60,905Past due 3 to 6 months 7,827 16,826Past due 6 to 12 months 231 7,788Past due over 1 year 5,551 9,987
98,079 95,506
The total carrying amount of the trade receivables individually determined to be fully/partially impaired, were as follows:
Group31 December
20171 January
2017US$’000 US$’000
Gross amount 46,360 46,852Less: Allowance for impairment (34,214) (38,955)
12,146 7,897
Beginning of financial year (38,955) (21,059)Currency translation differences (412) 356Allowance written back/(made) 2,279 (18,317)Allowance utilised 2,874 65End of financial year (34,214) (38,955)
The remaining amount of US$12,146,000 (1 January 2017: US$7,897,000) was not deemed to be impaired further to the deposits and subsequent collections from these customers.
The impaired trade receivables arose mainly from sales to customers which have suffered financial difficulties.
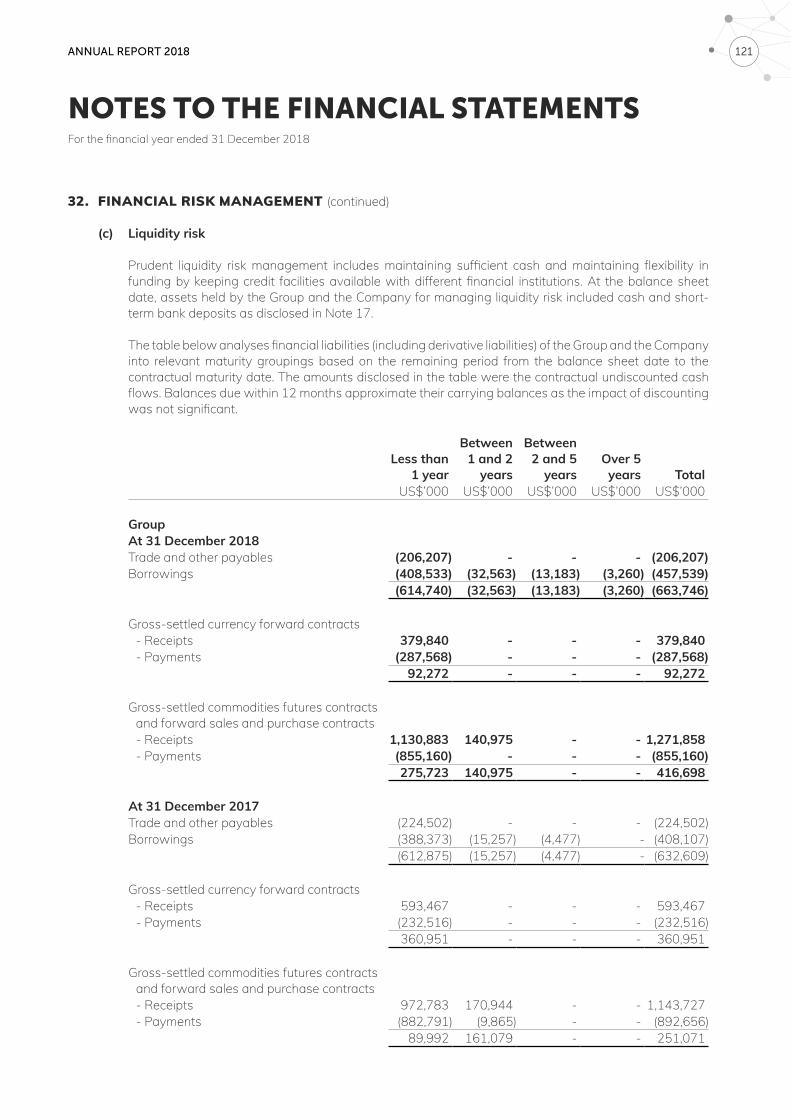
ANNUAL REPORT 2018 121
NOTES TO THE FINANCIAL STATEMENTSFor the financial year ended 31 December 2018
32. FINANCIAL RISK MANAGEMENT (continued)
(c) Liquidity risk
Prudent liquidity risk management includes maintaining sufficient cash and maintaining flexibility in funding by keeping credit facilities available with different financial institutions. At the balance sheet date, assets held by the Group and the Company for managing liquidity risk included cash and short-term bank deposits as disclosed in Note 17.
The table below analyses financial liabilities (including derivative liabilities) of the Group and the Company into relevant maturity groupings based on the remaining period from the balance sheet date to the contractual maturity date. The amounts disclosed in the table were the contractual undiscounted cash flows. Balances due within 12 months approximate their carrying balances as the impact of discounting was not significant.
Less than1 year
Between1 and 2
years
Between2 and 5
yearsOver 5years Total
US$’000 US$’000 US$’000 US$’000 US$’000
GroupAt 31 December 2018Trade and other payables (206,207) - - - (206,207)Borrowings (408,533) (32,563) (13,183) (3,260) (457,539)
(614,740) (32,563) (13,183) (3,260) (663,746)
Gross-settled currency forward contracts- Receipts 379,840 - - - 379,840- Payments (287,568) - - - (287,568)
92,272 - - - 92,272
Gross-settled commodities futures contracts and forward sales and purchase contracts- Receipts 1,130,883 140,975 - - 1,271,858- Payments (855,160) - - - (855,160)
275,723 140,975 - - 416,698
At 31 December 2017Trade and other payables (224,502) - - - (224,502)Borrowings (388,373) (15,257) (4,477) - (408,107)
(612,875) (15,257) (4,477) - (632,609)
Gross-settled currency forward contracts- Receipts 593,467 - - - 593,467- Payments (232,516) - - - (232,516)
360,951 - - - 360,951
Gross-settled commodities futures contracts and forward sales and purchase contracts- Receipts 972,783 170,944 - - 1,143,727 - Payments (882,791) (9,865) - - (892,656)
89,992 161,079 - - 251,071
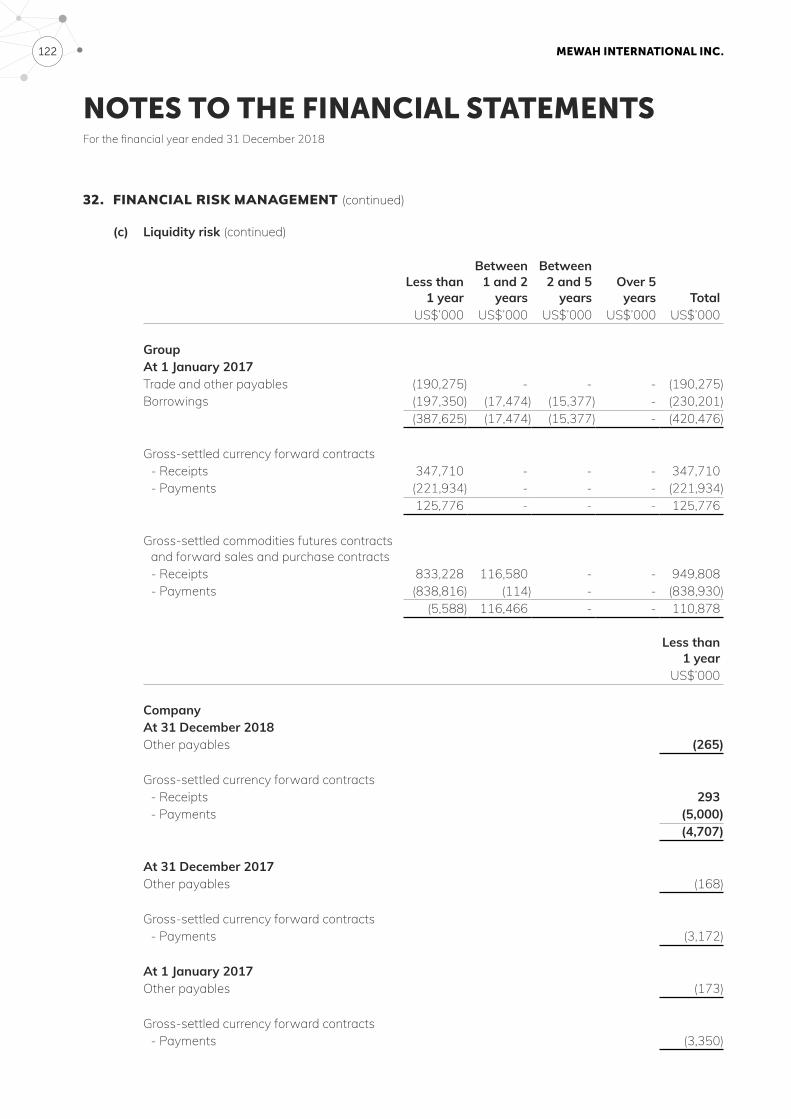
MEWAH INTERNATIONAL INC. 122
NOTES TO THE FINANCIAL STATEMENTSFor the financial year ended 31 December 2018
32. FINANCIAL RISK MANAGEMENT (continued)
(c) Liquidity risk (continued)
Less than1 year
Between1 and 2
years
Between2 and 5
yearsOver 5years Total
US$’000 US$’000 US$’000 US$’000 US$’000
GroupAt 1 January 2017Trade and other payables (190,275) - - - (190,275)Borrowings (197,350) (17,474) (15,377) - (230,201)
(387,625) (17,474) (15,377) - (420,476)
Gross-settled currency forward contracts- Receipts 347,710 - - - 347,710- Payments (221,934) - - - (221,934)
125,776 - - - 125,776
Gross-settled commodities futures contracts and forward sales and purchase contracts- Receipts 833,228 116,580 - - 949,808 - Payments (838,816) (114) - - (838,930)
(5,588) 116,466 - - 110,878
Less than1 year
US$’000
CompanyAt 31 December 2018Other payables (265)
Gross-settled currency forward contracts- Receipts 293- Payments (5,000)
(4,707)
At 31 December 2017Other payables (168)
Gross-settled currency forward contracts- Payments (3,172)
At 1 January 2017Other payables (173)
Gross-settled currency forward contracts- Payments (3,350)
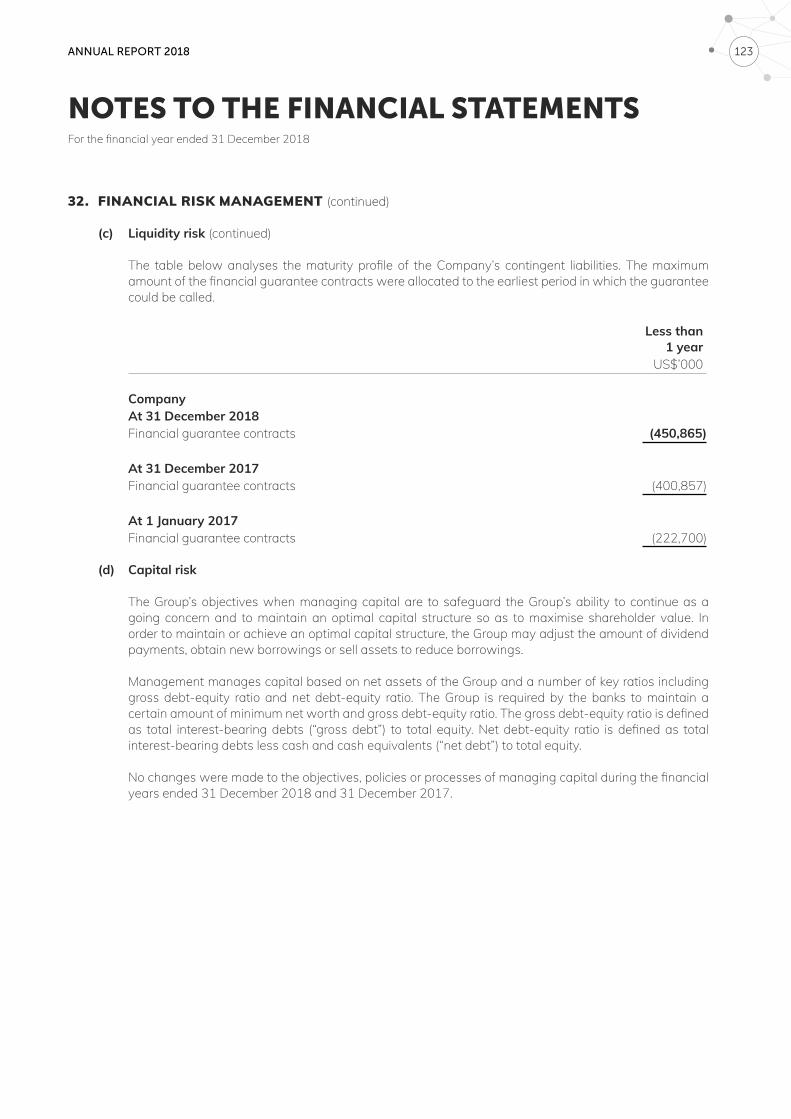
ANNUAL REPORT 2018 123
NOTES TO THE FINANCIAL STATEMENTSFor the financial year ended 31 December 2018
32. FINANCIAL RISK MANAGEMENT (continued)
(c) Liquidity risk (continued)
The table below analyses the maturity profile of the Company’s contingent liabilities. The maximum amount of the financial guarantee contracts were allocated to the earliest period in which the guarantee could be called.
Less than1 year
US$’000
CompanyAt 31 December 2018Financial guarantee contracts (450,865)
At 31 December 2017Financial guarantee contracts (400,857)
At 1 January 2017Financial guarantee contracts (222,700)
(d) Capital risk
The Group’s objectives when managing capital are to safeguard the Group’s ability to continue as a going concern and to maintain an optimal capital structure so as to maximise shareholder value. In order to maintain or achieve an optimal capital structure, the Group may adjust the amount of dividend payments, obtain new borrowings or sell assets to reduce borrowings.
Management manages capital based on net assets of the Group and a number of key ratios including gross debt-equity ratio and net debt-equity ratio. The Group is required by the banks to maintain a certain amount of minimum net worth and gross debt-equity ratio. The gross debt-equity ratio is defined as total interest-bearing debts (“gross debt”) to total equity. Net debt-equity ratio is defined as total interest-bearing debts less cash and cash equivalents (“net debt”) to total equity.
No changes were made to the objectives, policies or processes of managing capital during the financial years ended 31 December 2018 and 31 December 2017.
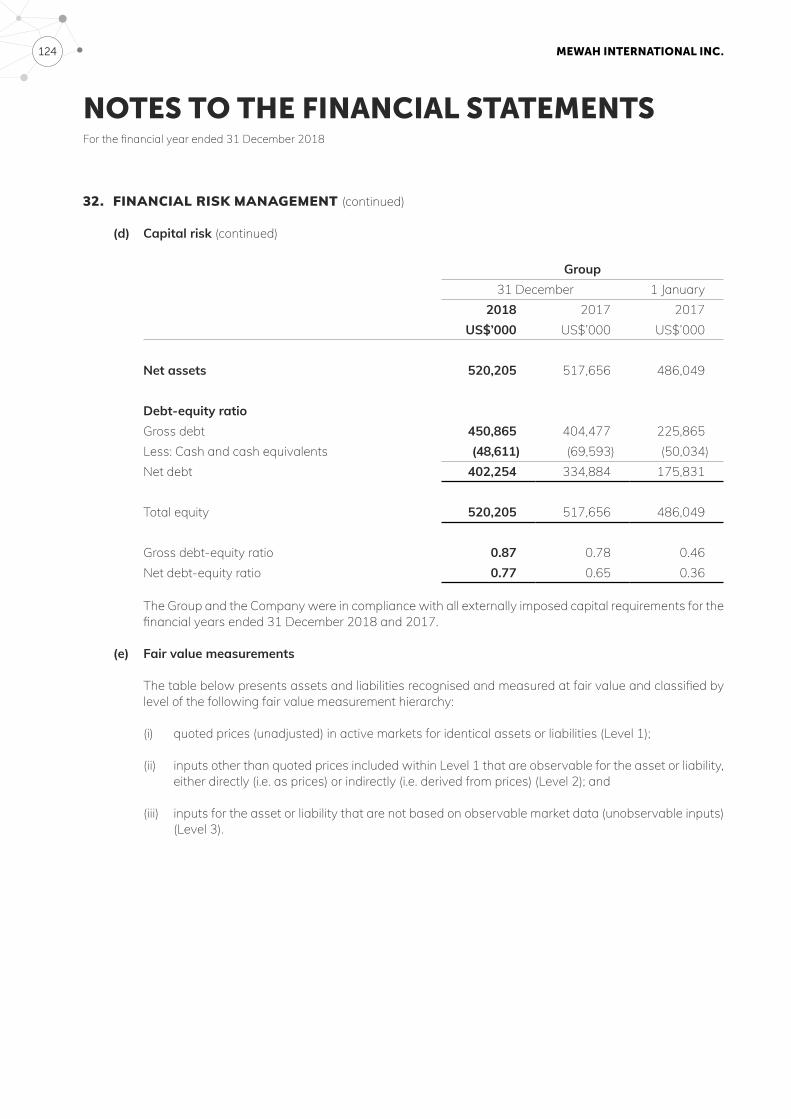
MEWAH INTERNATIONAL INC. 124
NOTES TO THE FINANCIAL STATEMENTSFor the financial year ended 31 December 2018
32. FINANCIAL RISK MANAGEMENT (continued)
(d) Capital risk (continued)
Group31 December 1 January
2018 2017 2017US$’000 US$’000 US$’000
Net assets 520,205 517,656 486,049
Debt-equity ratioGross debt 450,865 404,477 225,865Less: Cash and cash equivalents (48,611) (69,593) (50,034)Net debt 402,254 334,884 175,831
Total equity 520,205 517,656 486,049
Gross debt-equity ratio 0.87 0.78 0.46Net debt-equity ratio 0.77 0.65 0.36
The Group and the Company were in compliance with all externally imposed capital requirements for the financial years ended 31 December 2018 and 2017.
(e) Fair value measurements
The table below presents assets and liabilities recognised and measured at fair value and classified by level of the following fair value measurement hierarchy:
(i) quoted prices (unadjusted) in active markets for identical assets or liabilities (Level 1);
(ii) inputs other than quoted prices included within Level 1 that are observable for the asset or liability, either directly (i.e. as prices) or indirectly (i.e. derived from prices) (Level 2); and
(iii) inputs for the asset or liability that are not based on observable market data (unobservable inputs) (Level 3).
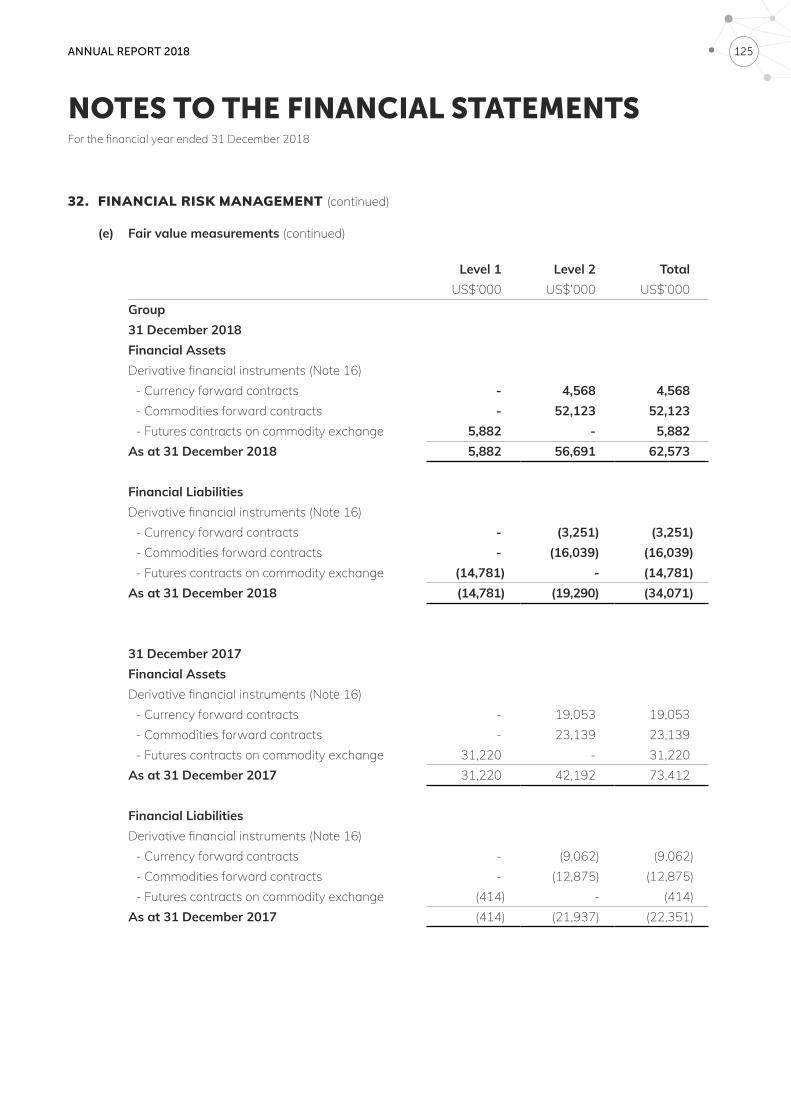
ANNUAL REPORT 2018 125
NOTES TO THE FINANCIAL STATEMENTSFor the financial year ended 31 December 2018
32. FINANCIAL RISK MANAGEMENT (continued)
(e) Fair value measurements (continued)
Level 1 Level 2 Total US$’000 US$’000 US$’000
Group31 December 2018Financial AssetsDerivative financial instruments (Note 16)
- Currency forward contracts - 4,568 4,568- Commodities forward contracts - 52,123 52,123- Futures contracts on commodity exchange 5,882 - 5,882
As at 31 December 2018 5,882 56,691 62,573
Financial LiabilitiesDerivative financial instruments (Note 16)
- Currency forward contracts - (3,251) (3,251)- Commodities forward contracts - (16,039) (16,039)- Futures contracts on commodity exchange (14,781) - (14,781)
As at 31 December 2018 (14,781) (19,290) (34,071)
31 December 2017Financial AssetsDerivative financial instruments (Note 16)
- Currency forward contracts - 19,053 19,053- Commodities forward contracts - 23,139 23,139- Futures contracts on commodity exchange 31,220 - 31,220
As at 31 December 2017 31,220 42,192 73,412
Financial LiabilitiesDerivative financial instruments (Note 16)
- Currency forward contracts - (9,062) (9,062)- Commodities forward contracts - (12,875) (12,875)- Futures contracts on commodity exchange (414) - (414)
As at 31 December 2017 (414) (21,937) (22,351)
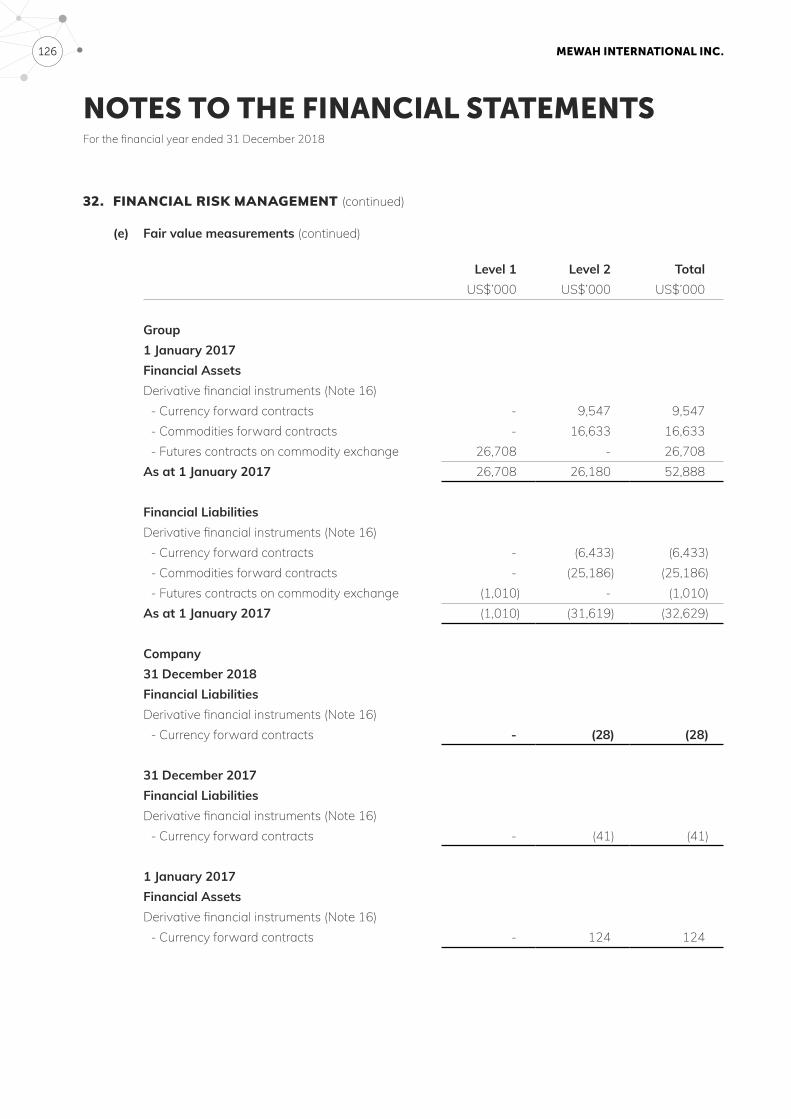
MEWAH INTERNATIONAL INC. 126
NOTES TO THE FINANCIAL STATEMENTSFor the financial year ended 31 December 2018
32. FINANCIAL RISK MANAGEMENT (continued)
(e) Fair value measurements (continued)
Level 1 Level 2 Total US$’000 US$’000 US$’000
Group1 January 2017Financial AssetsDerivative financial instruments (Note 16)
- Currency forward contracts - 9,547 9,547- Commodities forward contracts - 16,633 16,633- Futures contracts on commodity exchange 26,708 - 26,708
As at 1 January 2017 26,708 26,180 52,888
Financial LiabilitiesDerivative financial instruments (Note 16)
- Currency forward contracts - (6,433) (6,433)- Commodities forward contracts - (25,186) (25,186)- Futures contracts on commodity exchange (1,010) - (1,010)
As at 1 January 2017 (1,010) (31,619) (32,629)
Company31 December 2018Financial LiabilitiesDerivative financial instruments (Note 16)
- Currency forward contracts - (28) (28)
31 December 2017Financial LiabilitiesDerivative financial instruments (Note 16)
- Currency forward contracts - (41) (41)
1 January 2017Financial AssetsDerivative financial instruments (Note 16)
- Currency forward contracts - 124 124
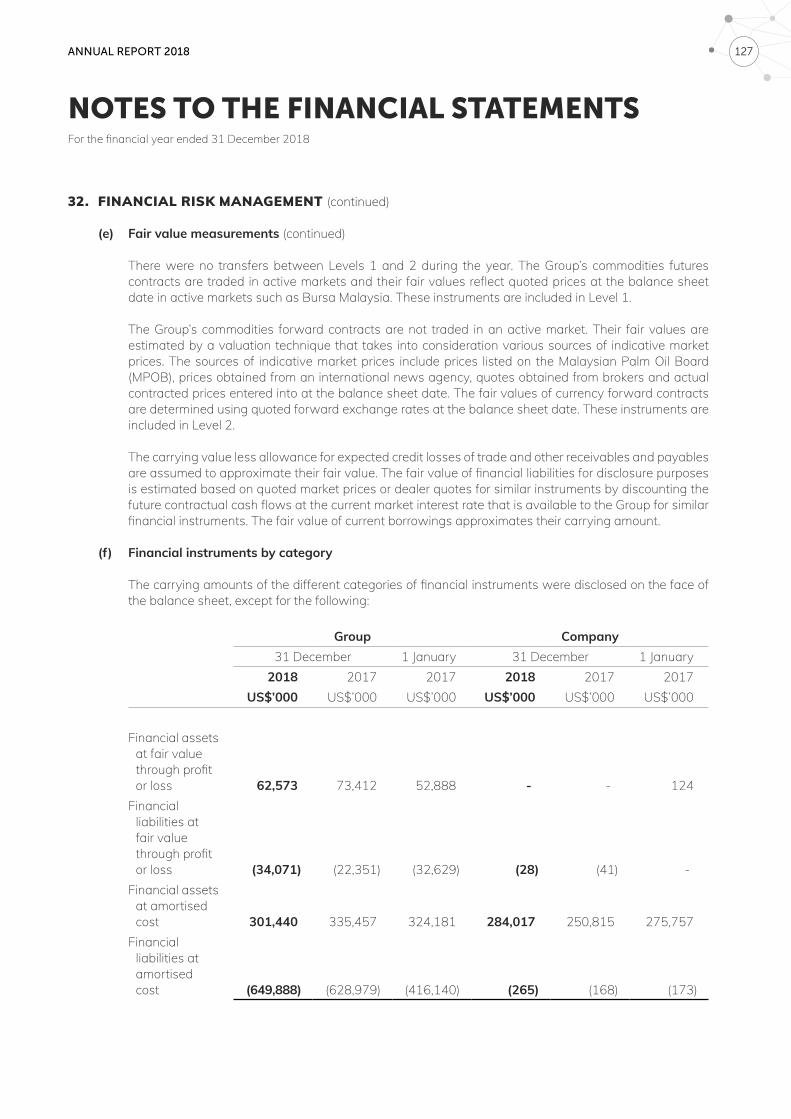
ANNUAL REPORT 2018 127
NOTES TO THE FINANCIAL STATEMENTSFor the financial year ended 31 December 2018
32. FINANCIAL RISK MANAGEMENT (continued)
(e) Fair value measurements (continued)
There were no transfers between Levels 1 and 2 during the year. The Group’s commodities futures contracts are traded in active markets and their fair values reflect quoted prices at the balance sheet date in active markets such as Bursa Malaysia. These instruments are included in Level 1.
The Group’s commodities forward contracts are not traded in an active market. Their fair values are estimated by a valuation technique that takes into consideration various sources of indicative market prices. The sources of indicative market prices include prices listed on the Malaysian Palm Oil Board (MPOB), prices obtained from an international news agency, quotes obtained from brokers and actual contracted prices entered into at the balance sheet date. The fair values of currency forward contracts are determined using quoted forward exchange rates at the balance sheet date. These instruments are included in Level 2.
The carrying value less allowance for expected credit losses of trade and other receivables and payables are assumed to approximate their fair value. The fair value of financial liabilities for disclosure purposes is estimated based on quoted market prices or dealer quotes for similar instruments by discounting the future contractual cash flows at the current market interest rate that is available to the Group for similar financial instruments. The fair value of current borrowings approximates their carrying amount.
(f) Financial instruments by category
The carrying amounts of the different categories of financial instruments were disclosed on the face of the balance sheet, except for the following:
Group Company31 December 1 January 31 December 1 January
2018 2017 2017 2018 2017 2017US$’000 US$’000 US$’000 US$’000 US$’000 US$’000
Financial assets at fair value through profit or loss 62,573 73,412 52,888 - - 124
Financial liabilities at fair value through profit or loss (34,071) (22,351) (32,629) (28) (41) -
Financial assets at amortised cost 301,440 335,457 324,181 284,017 250,815 275,757
Financial liabilities at amortised cost (649,888) (628,979) (416,140) (265) (168) (173)
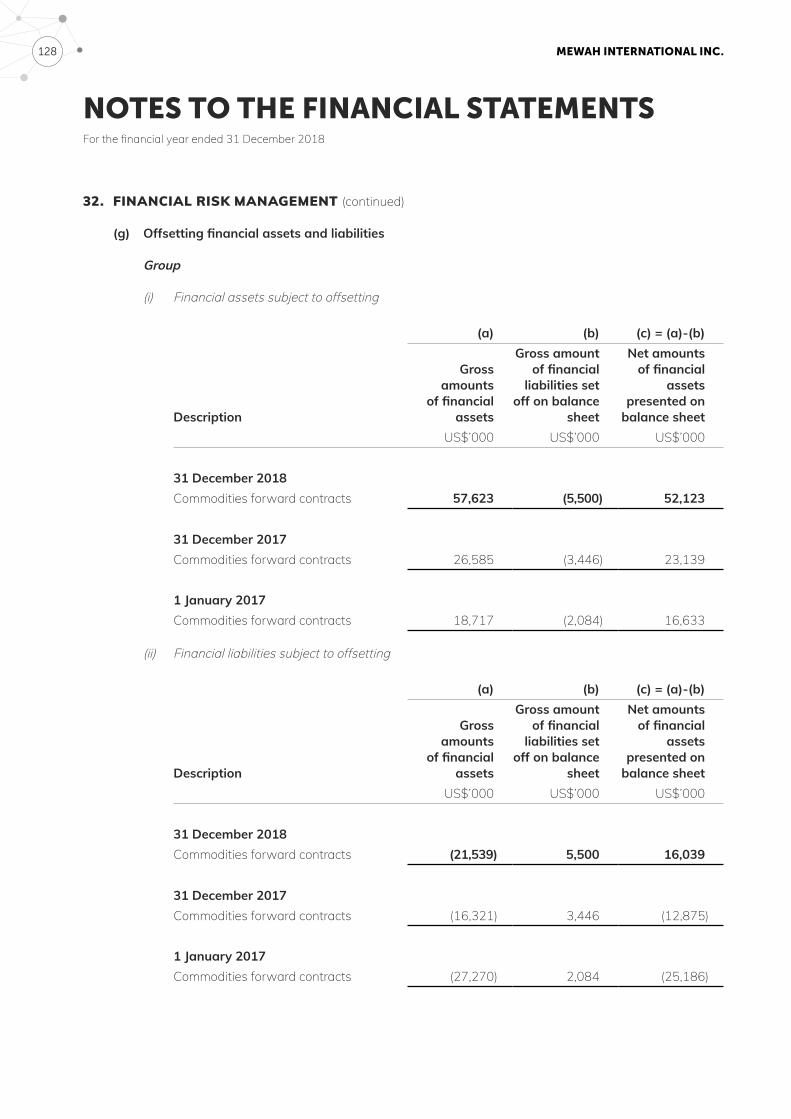
MEWAH INTERNATIONAL INC. 128
NOTES TO THE FINANCIAL STATEMENTSFor the financial year ended 31 December 2018
32. FINANCIAL RISK MANAGEMENT (continued)
(g) Offsetting financial assets and liabilities
Group
(i) Financial assets subject to offsetting
(a) (b) (c) = (a)-(b)
Description
Gross amounts
of financial assets
Gross amount of financial
liabilities set off on balance
sheet
Net amounts of financial
assets presented on
balance sheetUS$’000 US$’000 US$’000
31 December 2018Commodities forward contracts 57,623 (5,500) 52,123
31 December 2017Commodities forward contracts 26,585 (3,446) 23,139
1 January 2017Commodities forward contracts 18,717 (2,084) 16,633
(ii) Financial liabilities subject to offsetting
(a) (b) (c) = (a)-(b)
Description
Gross amounts
of financial assets
Gross amount of financial
liabilities set off on balance
sheet
Net amounts of financial
assets presented on
balance sheetUS$’000 US$’000 US$’000
31 December 2018Commodities forward contracts (21,539) 5,500 16,039
31 December 2017Commodities forward contracts (16,321) 3,446 (12,875)
1 January 2017Commodities forward contracts (27,270) 2,084 (25,186)
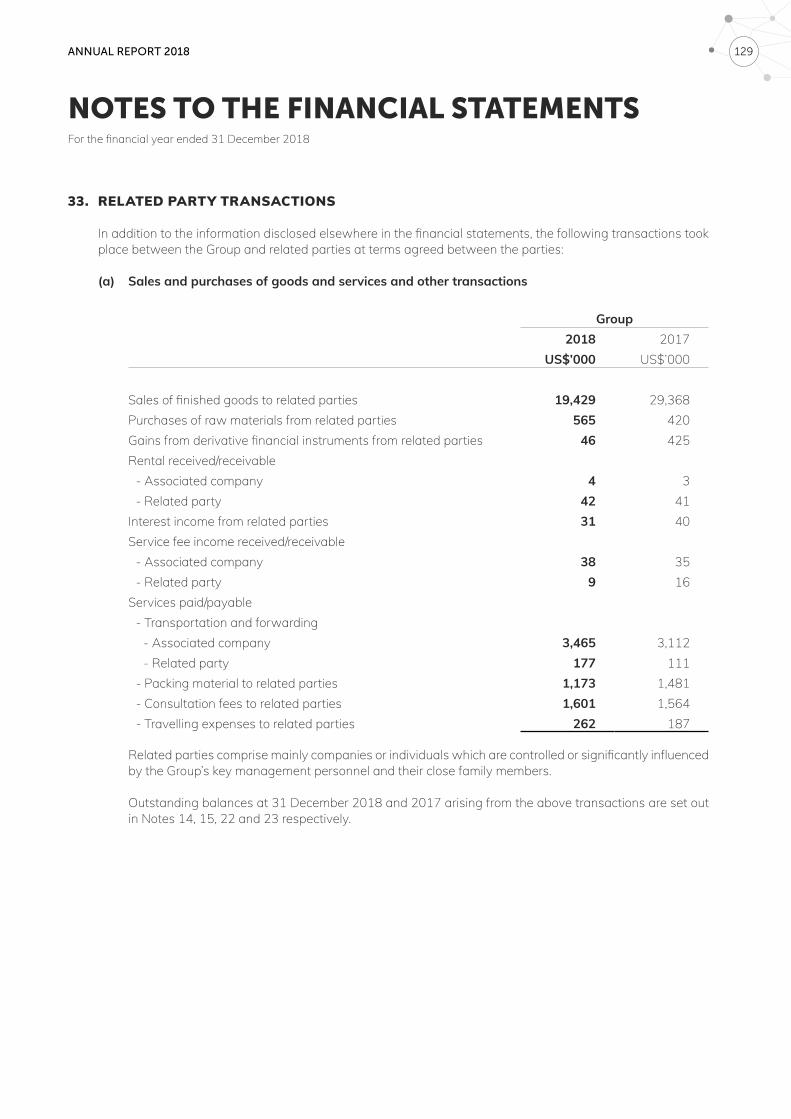
ANNUAL REPORT 2018 129
NOTES TO THE FINANCIAL STATEMENTSFor the financial year ended 31 December 2018
33. RELATED PARTY TRANSACTIONS
In addition to the information disclosed elsewhere in the financial statements, the following transactions took place between the Group and related parties at terms agreed between the parties:
(a) Sales and purchases of goods and services and other transactions
Group2018 2017
US$’000 US$’000
Sales of finished goods to related parties 19,429 29,368Purchases of raw materials from related parties 565 420Gains from derivative financial instruments from related parties 46 425Rental received/receivable
- Associated company 4 3- Related party 42 41
Interest income from related parties 31 40Service fee income received/receivable
- Associated company 38 35- Related party 9 16
Services paid/payable- Transportation and forwarding
- Associated company 3,465 3,112- Related party 177 111
- Packing material to related parties 1,173 1,481- Consultation fees to related parties 1,601 1,564- Travelling expenses to related parties 262 187
Related parties comprise mainly companies or individuals which are controlled or significantly influenced by the Group’s key management personnel and their close family members.
Outstanding balances at 31 December 2018 and 2017 arising from the above transactions are set out in Notes 14, 15, 22 and 23 respectively.
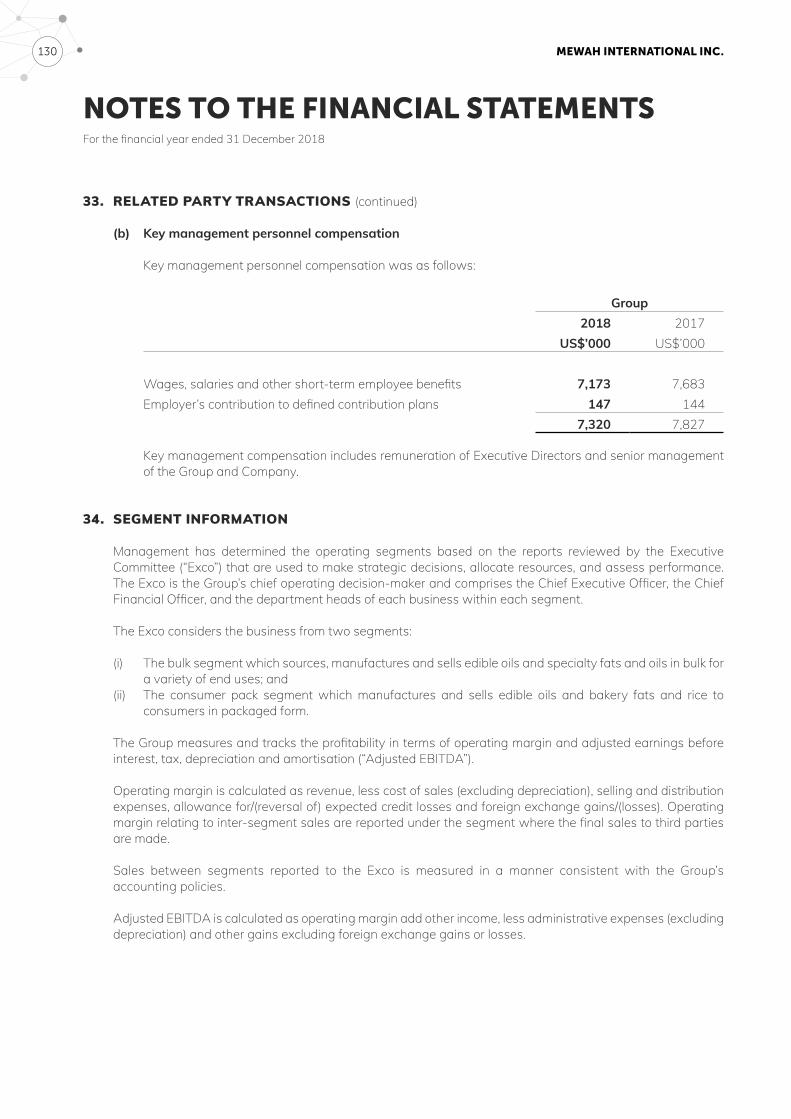
MEWAH INTERNATIONAL INC. 130
NOTES TO THE FINANCIAL STATEMENTSFor the financial year ended 31 December 2018
33. RELATED PARTY TRANSACTIONS (continued)
(b) Key management personnel compensation
Key management personnel compensation was as follows:
Group2018 2017
US$’000 US$’000
Wages, salaries and other short-term employee benefits 7,173 7,683Employer’s contribution to defined contribution plans 147 144
7,320 7,827
Key management compensation includes remuneration of Executive Directors and senior management of the Group and Company.
34. SEGMENT INFORMATION
Management has determined the operating segments based on the reports reviewed by the Executive Committee (“Exco”) that are used to make strategic decisions, allocate resources, and assess performance. The Exco is the Group’s chief operating decision-maker and comprises the Chief Executive Officer, the Chief Financial Officer, and the department heads of each business within each segment.
The Exco considers the business from two segments:
(i) The bulk segment which sources, manufactures and sells edible oils and specialty fats and oils in bulk for a variety of end uses; and
(ii) The consumer pack segment which manufactures and sells edible oils and bakery fats and rice to consumers in packaged form.
The Group measures and tracks the profitability in terms of operating margin and adjusted earnings before interest, tax, depreciation and amortisation (“Adjusted EBITDA”).
Operating margin is calculated as revenue, less cost of sales (excluding depreciation), selling and distribution expenses, allowance for/(reversal of) expected credit losses and foreign exchange gains/(losses). Operating margin relating to inter-segment sales are reported under the segment where the final sales to third parties are made.
Sales between segments reported to the Exco is measured in a manner consistent with the Group’s accounting policies.
Adjusted EBITDA is calculated as operating margin add other income, less administrative expenses (excluding depreciation) and other gains excluding foreign exchange gains or losses.
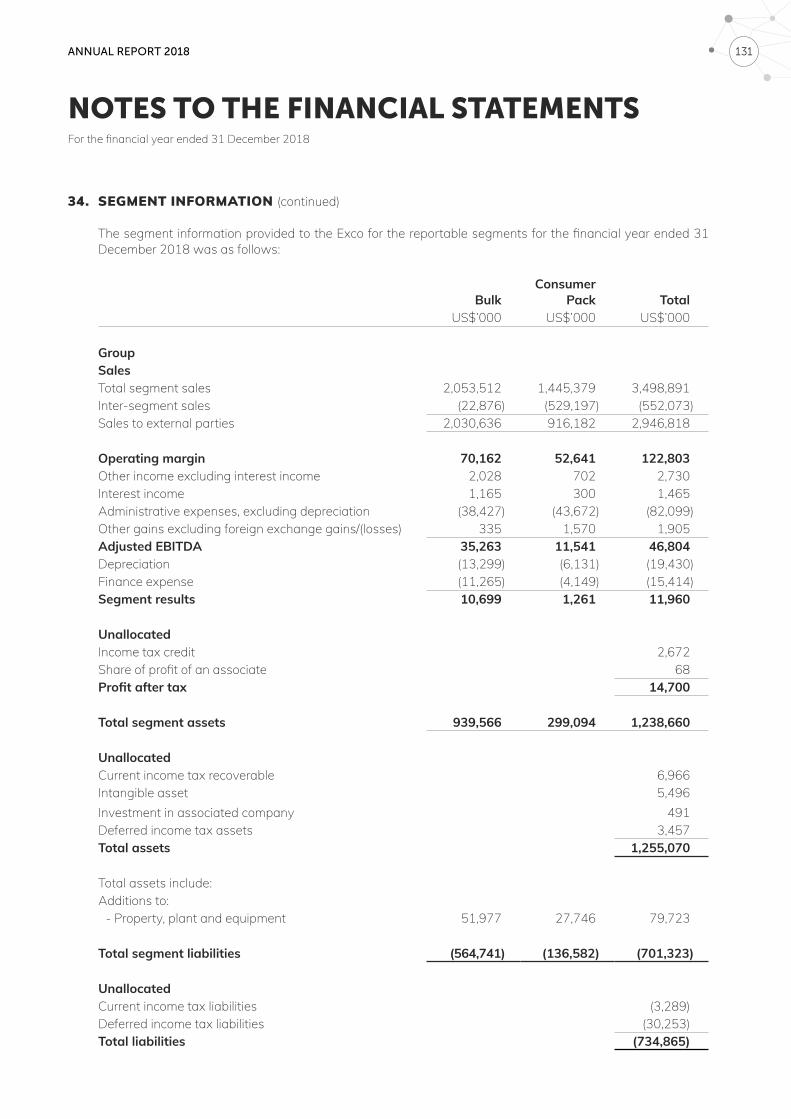
ANNUAL REPORT 2018 131
NOTES TO THE FINANCIAL STATEMENTSFor the financial year ended 31 December 2018
34. SEGMENT INFORMATION (continued)
The segment information provided to the Exco for the reportable segments for the financial year ended 31 December 2018 was as follows:
BulkConsumer
Pack TotalUS$’000 US$’000 US$’000
GroupSalesTotal segment sales 2,053,512 1,445,379 3,498,891Inter-segment sales (22,876) (529,197) (552,073)Sales to external parties 2,030,636 916,182 2,946,818
Operating margin 70,162 52,641 122,803Other income excluding interest income 2,028 702 2,730Interest income 1,165 300 1,465Administrative expenses, excluding depreciation (38,427) (43,672) (82,099)Other gains excluding foreign exchange gains/(losses) 335 1,570 1,905Adjusted EBITDA 35,263 11,541 46,804Depreciation (13,299) (6,131) (19,430)Finance expense (11,265) (4,149) (15,414)Segment results 10,699 1,261 11,960
Unallocated Income tax credit 2,672Share of profit of an associate 68Profit after tax 14,700
Total segment assets 939,566 299,094 1,238,660
UnallocatedCurrent income tax recoverable 6,966Intangible asset 5,496Investment in associated company 491Deferred income tax assets 3,457Total assets 1,255,070
Total assets include:Additions to:
- Property, plant and equipment 51,977 27,746 79,723
Total segment liabilities (564,741) (136,582) (701,323)
UnallocatedCurrent income tax liabilities (3,289)Deferred income tax liabilities (30,253)Total liabilities (734,865)
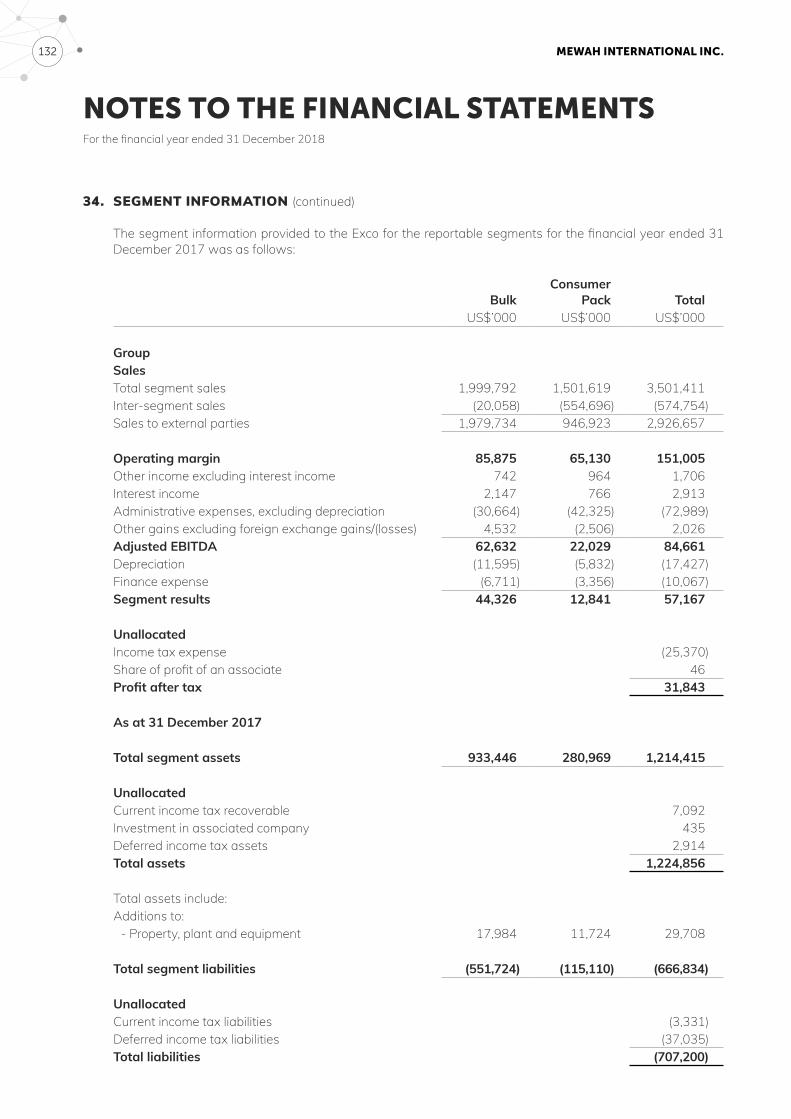
MEWAH INTERNATIONAL INC. 132
NOTES TO THE FINANCIAL STATEMENTSFor the financial year ended 31 December 2018
34. SEGMENT INFORMATION (continued)
The segment information provided to the Exco for the reportable segments for the financial year ended 31 December 2017 was as follows:
BulkConsumer
Pack TotalUS$’000 US$’000 US$’000
GroupSalesTotal segment sales 1,999,792 1,501,619 3,501,411Inter-segment sales (20,058) (554,696) (574,754)Sales to external parties 1,979,734 946,923 2,926,657
Operating margin 85,875 65,130 151,005Other income excluding interest income 742 964 1,706Interest income 2,147 766 2,913Administrative expenses, excluding depreciation (30,664) (42,325) (72,989)Other gains excluding foreign exchange gains/(losses) 4,532 (2,506) 2,026Adjusted EBITDA 62,632 22,029 84,661Depreciation (11,595) (5,832) (17,427)Finance expense (6,711) (3,356) (10,067)Segment results 44,326 12,841 57,167
Unallocated Income tax expense (25,370)Share of profit of an associate 46Profit after tax 31,843
As at 31 December 2017
Total segment assets 933,446 280,969 1,214,415
UnallocatedCurrent income tax recoverable 7,092Investment in associated company 435Deferred income tax assets 2,914Total assets 1,224,856
Total assets include:Additions to:
- Property, plant and equipment 17,984 11,724 29,708
Total segment liabilities (551,724) (115,110) (666,834)
UnallocatedCurrent income tax liabilities (3,331)Deferred income tax liabilities (37,035)Total liabilities (707,200)
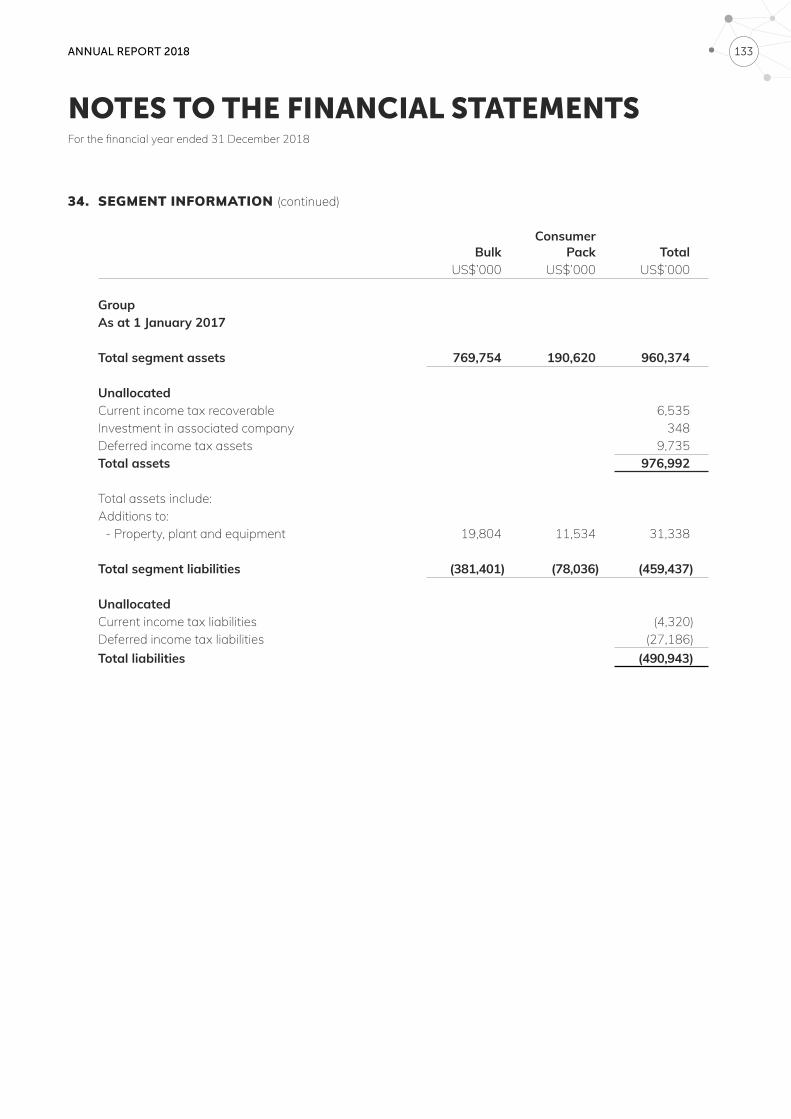
ANNUAL REPORT 2018 133
NOTES TO THE FINANCIAL STATEMENTSFor the financial year ended 31 December 2018
34. SEGMENT INFORMATION (continued)
BulkConsumer
Pack TotalUS$’000 US$’000 US$’000
GroupAs at 1 January 2017
Total segment assets 769,754 190,620 960,374
UnallocatedCurrent income tax recoverable 6,535Investment in associated company 348Deferred income tax assets 9,735Total assets 976,992
Total assets include:Additions to:
- Property, plant and equipment 19,804 11,534 31,338
Total segment liabilities (381,401) (78,036) (459,437)
UnallocatedCurrent income tax liabilities (4,320)Deferred income tax liabilities (27,186)Total liabilities (490,943)
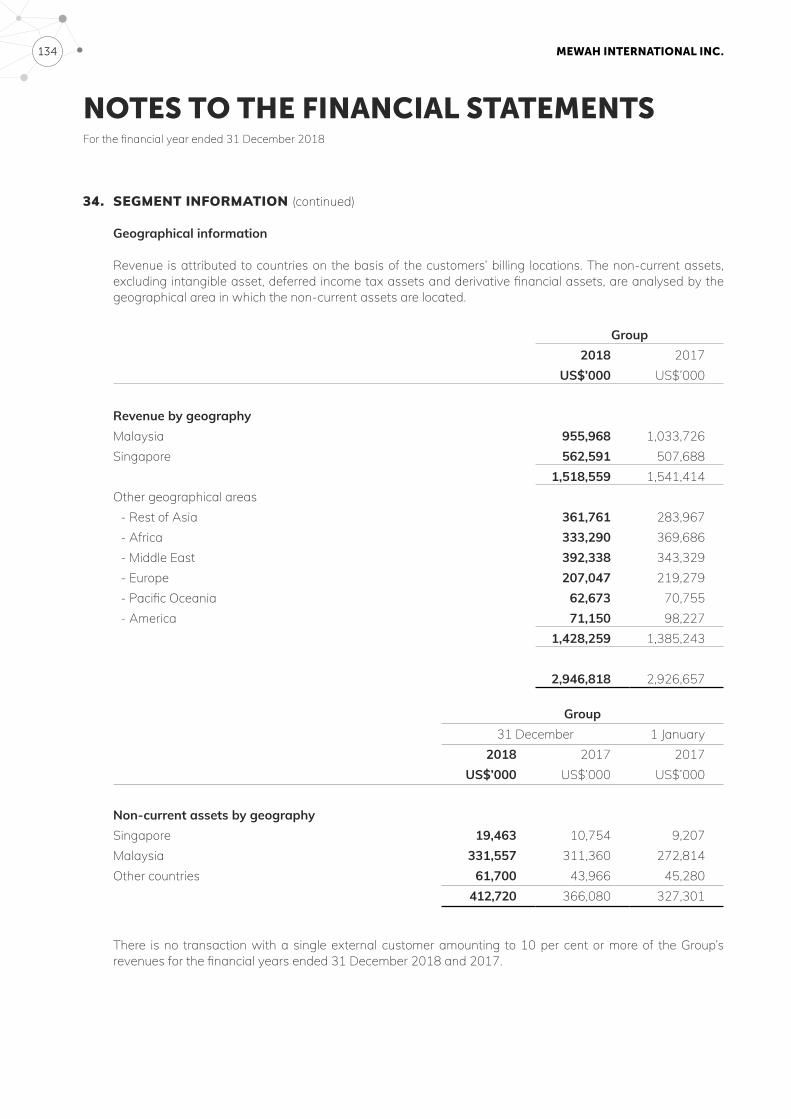
MEWAH INTERNATIONAL INC. 134
NOTES TO THE FINANCIAL STATEMENTSFor the financial year ended 31 December 2018
34. SEGMENT INFORMATION (continued)
Geographical information
Revenue is attributed to countries on the basis of the customers’ billing locations. The non-current assets, excluding intangible asset, deferred income tax assets and derivative financial assets, are analysed by the geographical area in which the non-current assets are located.
Group2018 2017
US$’000 US$’000
Revenue by geographyMalaysia 955,968 1,033,726Singapore 562,591 507,688
1,518,559 1,541,414Other geographical areas
- Rest of Asia 361,761 283,967- Africa 333,290 369,686- Middle East 392,338 343,329- Europe 207,047 219,279- Pacific Oceania 62,673 70,755- America 71,150 98,227
1,428,259 1,385,243
2,946,818 2,926,657
Group31 December 1 January
2018 2017 2017US$’000 US$’000 US$’000
Non-current assets by geographySingapore 19,463 10,754 9,207Malaysia 331,557 311,360 272,814Other countries 61,700 43,966 45,280
412,720 366,080 327,301
There is no transaction with a single external customer amounting to 10 per cent or more of the Group’s revenues for the financial years ended 31 December 2018 and 2017.
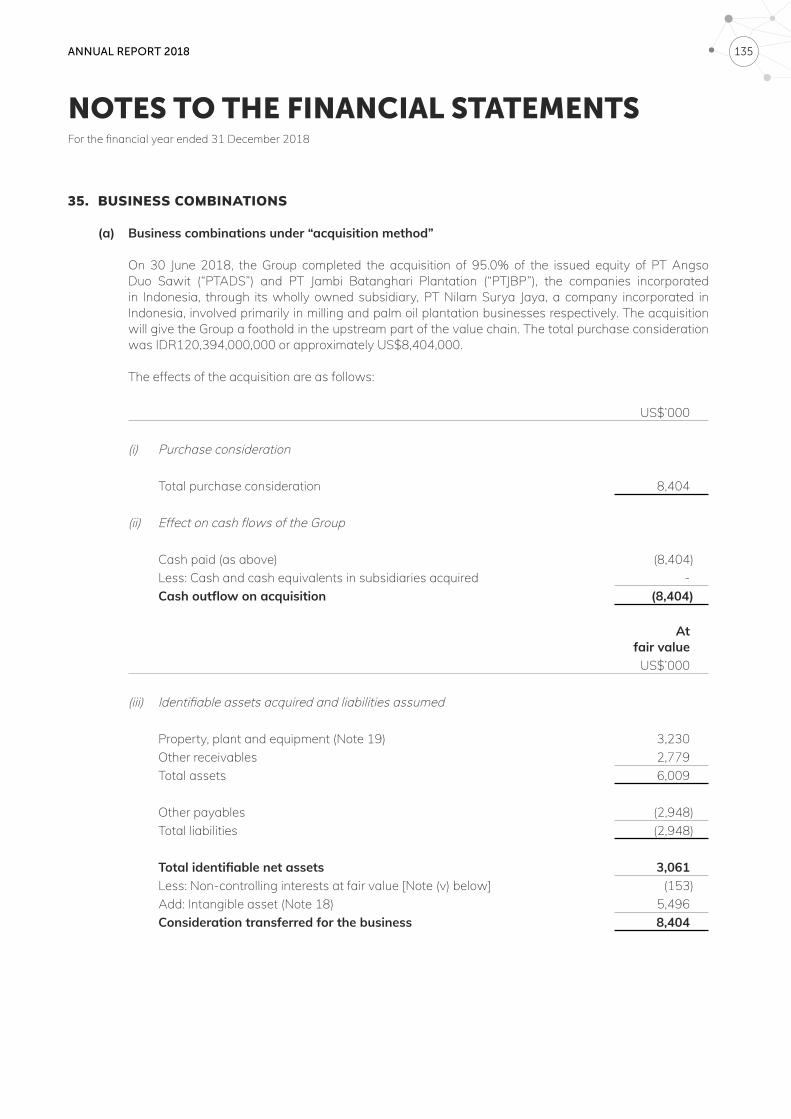
ANNUAL REPORT 2018 135
NOTES TO THE FINANCIAL STATEMENTSFor the financial year ended 31 December 2018
35. BUSINESS COMBINATIONS
(a) Business combinations under “acquisition method”
On 30 June 2018, the Group completed the acquisition of 95.0% of the issued equity of PT Angso Duo Sawit (“PTADS”) and PT Jambi Batanghari Plantation (“PTJBP”), the companies incorporated in Indonesia, through its wholly owned subsidiary, PT Nilam Surya Jaya, a company incorporated in Indonesia, involved primarily in milling and palm oil plantation businesses respectively. The acquisition will give the Group a foothold in the upstream part of the value chain. The total purchase consideration was IDR120,394,000,000 or approximately US$8,404,000.
The effects of the acquisition are as follows:
US$’000
(i) Purchase consideration
Total purchase consideration 8,404
(ii) Effect on cash flows of the Group
Cash paid (as above) (8,404)Less: Cash and cash equivalents in subsidiaries acquired -Cash outflow on acquisition (8,404)
Atfair value
US$’000
(iii) Identifiable assets acquired and liabilities assumed
Property, plant and equipment (Note 19) 3,230Other receivables 2,779Total assets 6,009
Other payables (2,948)Total liabilities (2,948)
Total identifiable net assets 3,061Less: Non-controlling interests at fair value [Note (v) below] (153)Add: Intangible asset (Note 18) 5,496Consideration transferred for the business 8,404
MEWAH INTERNATIONAL INC. 136
NOTES TO THE FINANCIAL STATEMENTSFor the financial year ended 31 December 2018
35. BUSINESS COMBINATIONS (continued)
(a) Business combinations under “acquisition method” (continued)
(iv) Fair values and intangible asset
The purchase price allocation to goodwill, intangibles (excluding goodwill) and other assets and liabilities is currently being assessed and is expected to be finalised within 12 months from the date of acquisition and hence the intangibles asset has not been allocated to the relevant cash-generating-units.
(v) Non-controlling interests
The Group has recognised the 5.0% non-controlling interests of US$153,000.
(vi) Revenue and profit contribution
The acquired business contributed revenue of US$2,286,000 and net loss of US$237,000 to the Group from the period from 1 July 2018 to 31 December 2018.
Had PTADS and PTJBP been acquired from 1 January 2018, the consolidated revenue and consolidated profit after tax of the Group for the year ended 31 December 2018 would have been US$2,953,009,000 and US$14,315,000 respectively.
36. NEW OR REVISED ACCOUNTING STANDARDS AND INTERPRETATIONS
Below are the mandatory standards, amendments and interpretations to existing standards that have been published, and are relevant for the Group’s accounting periods beginning on or after 1 January 2019 and which the Group has not early adopted:
(a) SFRS(I) 16 Leases (effective for annual periods beginning on or after 1 January 2019)
SFRS(I) 16 will result in almost all leases being recognised on the balance sheet, as the distinction between operating and finance leases is removed. Under the new standard, an asset (the right to use the leased item) and a financial liability to pay rentals are recognised. The only exceptions are short-term and low-value leases. The accounting for lessors will not change significantly.
The Group will apply the standard from its mandatory adoption date of 1 January 2019. The Group intends to apply the simplified transition approach and will not restate comparative amounts for the year prior to first adoption. Right-of-use assets for property leases will be measured on transition as if the new rules had always been applied. All other right-of-use assets will be measured at the amount of the lease liability on adoption (adjusted for any prepaid or accrued lease expenses).
As at 31 December 2018, the Group has non-cancellable operating lease commitments of US$13,334,000 [Note 31(b)]. Of these commitments, approximately US$500,000 relate to short-term leases and low value leases which will be recognised on a straight-line basis as expense in profit and loss.
For the remaining commitments, the Group expects to recognise right-of-use assets and lease liabilities of approximately US$7,400,000 on 1 January 2019. Overall there will be no impact to the net assets and net current assets will be approximately US$300,000 lower due to the presentation of a portion of the liability as a current liability.
The Group expects that net profit after tax will decrease by approximately US$200,000 for 2019 as a result of adopting the new rules.
ANNUAL REPORT 2018 137
NOTES TO THE FINANCIAL STATEMENTSFor the financial year ended 31 December 2018
36. NEW OR REVISED ACCOUNTING STANDARDS AND INTERPRETATIONS (continued)
(a) SFRS(I) 16 Leases (effective for annual periods beginning on or after 1 January 2019) (continued)
The Group’s activities as a lessor are not material and the Group does not expect any significant impact on the financial statements. However, some additional disclosures will be required from next year.
(b) SFRS(I) INT 23 Uncertainty Over Income Tax Treatments (effective for annual periods beginning on or after 1 January 2019)
The interpretation explains how to recognise and measure deferred and current income tax assets and liabilities where there is uncertainty over a tax treatment. In particular, it discusses:
(i) how to determine the appropriate unit of account, and that each uncertain tax treatment should be considered separately or together as a group, depending on which approach better predicts the resolution of the uncertainty;
(ii) that the entity should assume a tax authority will examine, the uncertain tax treatments and have full knowledge of all related information, i.e. that detection risk should be ignored
(iii) that the entity should reflect the effect of the uncertainty in its income tax accounting when it is not probable that the tax authorities will accept the treatment,
(iv) that the impact of the uncertainty should be measured using either the most likely amount or the expected value method, depending on which method better predicts the resolution of the uncertainty, and
(v) that the judgements and estimates made must be reassessed whenever circumstances have changed or there is new information that affects the judgements.
The Group does not expect additional tax liability to be recognised arising from the uncertain tax positions on the adoption of the interpretation on 1 January 2019.
37. AUTHORISATION OF FINANCIAL STATEMENTS
These financial statements were authorised for issue in accordance with a resolution of the Board of Directors of Mewah International Inc. on 1 March 2019.
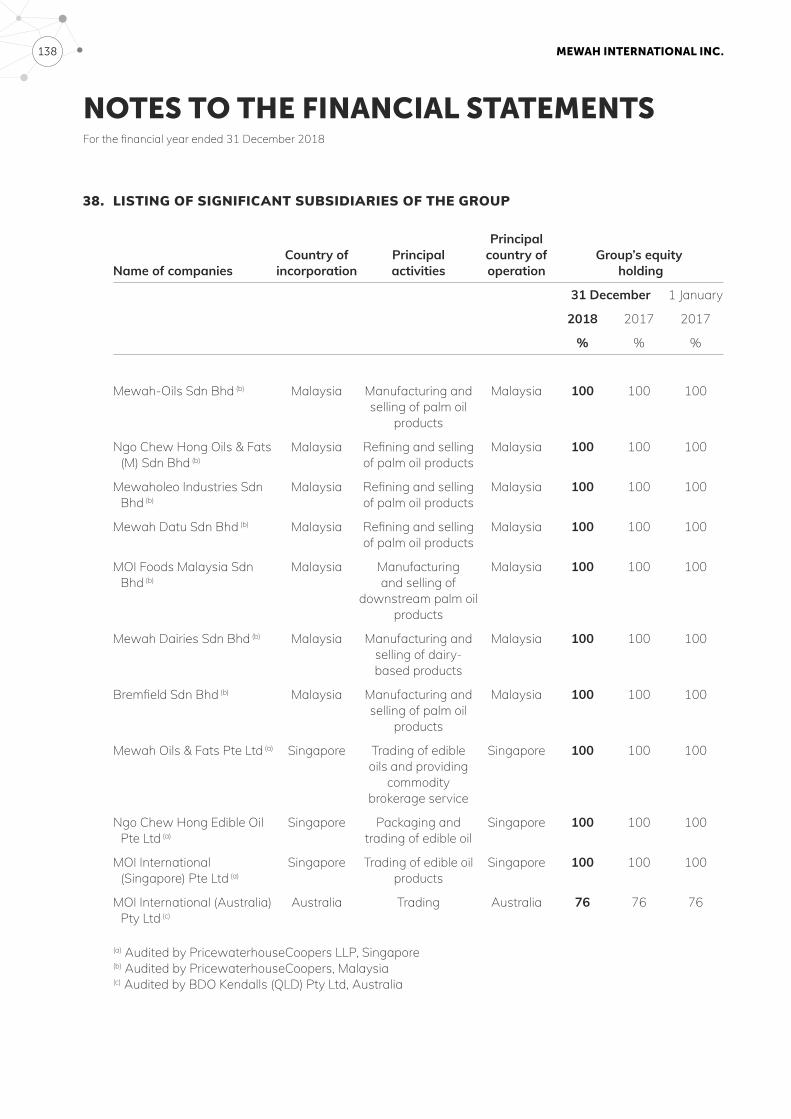
MEWAH INTERNATIONAL INC. 138
NOTES TO THE FINANCIAL STATEMENTSFor the financial year ended 31 December 2018
38. LISTING OF SIGNIFICANT SUBSIDIARIES OF THE GROUP
Name of companiesCountry of
incorporationPrincipal activities
Principal country of operation
Group’s equity holding
31 December 1 January
2018 2017 2017
% % %
Mewah-Oils Sdn Bhd (b) Malaysia Manufacturing and selling of palm oil
products
Malaysia 100 100 100
Ngo Chew Hong Oils & Fats (M) Sdn Bhd (b)
Malaysia Refining and selling of palm oil products
Malaysia 100 100 100
Mewaholeo Industries Sdn Bhd (b)
Malaysia Refining and selling of palm oil products
Malaysia 100 100 100
Mewah Datu Sdn Bhd (b) Malaysia Refining and selling of palm oil products
Malaysia 100 100 100
MOI Foods Malaysia Sdn Bhd (b)
Malaysia Manufacturing and selling of
downstream palm oil products
Malaysia 100 100 100
Mewah Dairies Sdn Bhd (b) Malaysia Manufacturing and selling of dairy-based products
Malaysia 100 100 100
Bremfield Sdn Bhd (b) Malaysia Manufacturing and selling of palm oil
products
Malaysia 100 100 100
Mewah Oils & Fats Pte Ltd (a) Singapore Trading of edible oils and providing
commodity brokerage service
Singapore 100 100 100
Ngo Chew Hong Edible Oil Pte Ltd (a)
Singapore Packaging and trading of edible oil
Singapore 100 100 100
MOI International (Singapore) Pte Ltd (a)
Singapore Trading of edible oil products
Singapore 100 100 100
MOI International (Australia) Pty Ltd (c)
Australia Trading Australia 76 76 76
(a) Audited by PricewaterhouseCoopers LLP, Singapore (b) Audited by PricewaterhouseCoopers, Malaysia (c) Audited by BDO Kendalls (QLD) Pty Ltd, Australia
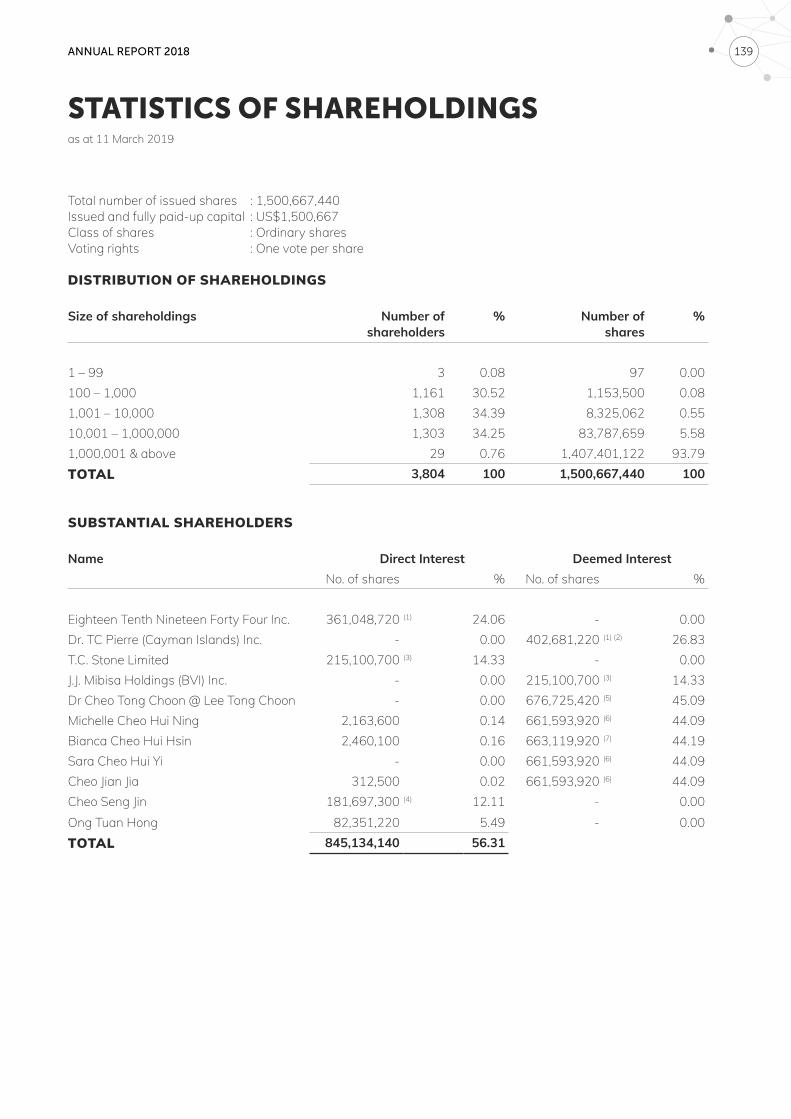
ANNUAL REPORT 2018 139
as at 11 March 2019
STATISTICS OF SHAREHOLDINGS
Total number of issued shares : 1,500,667,440Issued and fully paid-up capital : US$1,500,667Class of shares : Ordinary sharesVoting rights : One vote per share
DISTRIBUTION OF SHAREHOLDINGS
Size of shareholdings Number of shareholders
% Number of shares
%
1 – 99 3 0.08 97 0.00100 – 1,000 1,161 30.52 1,153,500 0.081,001 – 10,000 1,308 34.39 8,325,062 0.5510,001 – 1,000,000 1,303 34.25 83,787,659 5.581,000,001 & above 29 0.76 1,407,401,122 93.79TOTAL 3,804 100 1,500,667,440 100
SUBSTANTIAL SHAREHOLDERS
Name Direct Interest Deemed InterestNo. of shares % No. of shares %
Eighteen Tenth Nineteen Forty Four Inc. 361,048,720 (1) 24.06 - 0.00Dr. TC Pierre (Cayman Islands) Inc. - 0.00 402,681,220 (1) (2) 26.83T.C. Stone Limited 215,100,700 (3) 14.33 - 0.00J.J. Mibisa Holdings (BVI) Inc. - 0.00 215,100,700 (3) 14.33Dr Cheo Tong Choon @ Lee Tong Choon - 0.00 676,725,420 (5) 45.09Michelle Cheo Hui Ning 2,163,600 0.14 661,593,920 (6) 44.09Bianca Cheo Hui Hsin 2,460,100 0.16 663,119,920 (7) 44.19Sara Cheo Hui Yi - 0.00 661,593,920 (6) 44.09Cheo Jian Jia 312,500 0.02 661,593,920 (6) 44.09Cheo Seng Jin 181,697,300 (4) 12.11 - 0.00Ong Tuan Hong 82,351,220 5.49 - 0.00TOTAL 845,134,140 56.31
MEWAH INTERNATIONAL INC. 140
STATISTICS OF SHAREHOLDINGSas at 11 March 2019
(1) The shareholders of Eighteen Tenth Nineteen Forty Four Inc.(“1810”) include Dr. T.C. Pierre (Cayman Islands) Inc. (95.46%) which is wholly owned by SG Kleinwort Hambros Trust Company (Channel Islands) Limited as trustee of The TC Peter MD Settlement for its beneficiaries, including Michelle Cheo Hui Ning, Bianca Cheo Hui Hsin, Sara Cheo Hui Yi and Cheo Jian Jia. Dr Cheo Tong Choon @ Lee Tong Choon is the settlor of the Trust.
(2) Unity Investment Inc. (“Unity”) is wholly owned by Dr. T.C. Pierre (Cayman Islands) Inc. which in turn is wholly owned by SG Kleinwort Hambros Trust Company (Channel Islands) Limited as trustee of The TC Peter MD Settlement for its beneficiaries, including Michelle Cheo Hui Ning, Bianca Cheo Hui Hsin, Sara Cheo Hui Yi and Cheo Jian Jia. Dr Cheo Tong Choon @ Lee Tong Choon is the settlor of the Trust. Accordingly, Dr. T.C. Pierre (Cayman Islands) Inc. is deemed to have an interest in 41,632,500 shares held by Unity.
(3) T.C. Stone Limited.(“TCS”) is wholly owned by J.J. Mibisa Holdings (BVI) Inc. which in turn is wholly owned by SG Kleinwort Hambros Trust Company (Channel Islands) Limited as trustee of The TC Peter MD Settlement for its beneficiaries, including Michelle Cheo Hui Ning, Bianca Cheo Hui Hsin, Sara Cheo Hui Yi and Cheo Jian Jia. Dr Cheo Tong Choon @ Lee Tong Choon is the settlor of the Trust.
(4) Cheo Seng Jin has assigned voting rights of 43,812,000 shares to SG Kleinwort Hambros Trust Company (Channel Islands) Limited as trustee of The TC Peter MD Settlement for its beneficiaries, including Michelle Cheo Hui Ning, Bianca Cheo Hui Hsin, Sara Cheo Hui Yi and Cheo Jian Jia. Dr Cheo Tong Choon @ Lee Tong Choon is the settlor of the Trust.
(5) Deemed interest for Dr Cheo Tong Choon @ Lee Tong Choon arises from the shares held by his spouse; and shares held by 1810 (Note 1), Unity. (Note 2), TCS (Note 3) and Cheo Seng Jin (Note 4).
(6) Deemed interest for Michelle Cheo Hui Ning, Cheo Jian Jia and Sara Cheo Hui Yi arise from the shares held by 1810 (Note 1), Unity (Note 2), TCS (Note 3) and Cheo Seng Jin (Note 4).
(7) Deemed interest for Bianca Cheo Hui Ning arises from the shares held by her spouse and shares held by 1810 (Note 1), Unity (Note 2), TCS (Note 3) and Cheo Seng Jin (Note 4).
ANNUAL REPORT 2018 141
STATISTICS OF SHAREHOLDINGSas at 11 March 2019
TWENTY LARGEST SHAREHOLDERS AS AT 11 MARCH 2019
No. Name No. of shares %
1 Raffles Nominees (Pte) Limited 276,823,344 18.45
2 DBS Nominees (Private) Limited 228,922,241 15.25
3 T.C. Stone Limited 179,990,700 11.99
4 Citibank Nominees Singapore Pte Ltd 165,634,744 11.04
5 Eighteen Tenth Nineteen Forty Four Inc. 150,955,279 10.06
6 DB Nominees (Singapore) Pte Ltd 131,332,070 8.75
7 United Overseas Bank Nominees (Private) Limited 88,512,000 5.90
8 UOB Kay Hian Private Limited 48,897,900 3.26
9 Cheo Ming You (Shi Ming You) 37,955,500 2.53
10 Cheo Ming Xiang 18,991,062 1.27
11 BNP Paribas Nominees Singapore Pte. Ltd. 16,288,800 1.09
12 Chung Amy 14,914,500 0.99
13 Tsao Chin Mey Jimmy 11,100,000 0.74
14 Goh Seng Hui 7,666,000 0.51
15 Goi Bee Lan 4,372,400 0.29
16 Wong Wei Lan 3,558,000 0.24
17 Sukumaran S/O Ramasamy 3,000,000 0.20
18 Phillip Securities Pte Ltd 2,304,900 0.15
19 Michelle Cheo Hui Ning 2,163,600 0.14
20 Lim Poo Kin 2,100,000 0.14
TOTAL 1,395,483,040 92.99
SHAREHOLDING HELD BY THE PUBLIC
Based on the information available to the Company as at 11 March 2019, approximately 18.99% of the issued shares of the Company are held by the public. Accordingly, the Company has complied with the Rules 1207 and 723 of the Listing Manual of the Singapore Exchange Securities Trading Limited.
MEWAH INTERNATIONAL INC. 142
NOTICE OF ANNUAL GENERAL MEETING
NOTICE IS HEREBY GIVEN that the Annual General Meeting of MEWAH INTERNATIONAL INC. (“Company”) will be held at Genting 1 Ballroom, Level 1, Genting Hotel Jurong, 2 Town Hall Link, Singapore 608516 on 24 April 2019 at 10.30 a.m. for the following purposes:
AS ORDINARY BUSINESS
1. To receive and adopt the Directors’ Statement and the Audited Financial Statements of the Company and its subsidiaries for the financial year ended 31 December 2018 together with the Auditors’ Report thereon.
(Resolution 1)
2. To declare a Tax Exempt One-Tier Final Dividend of S$0.0045 per ordinary share for the financial year ended 31 December 2018. (Resolution 2)
3. To re-elect Ms Michelle Cheo Hui Ning, a Director retiring pursuant to Article 86(1) of the Company’s Memorandum and Articles of Association. [See Explanatory Note (i)] (Resolution 3)
4. To re-elect Ms Wong Lai Wan, a Director retiring pursuant to Article 86(1) of the Company’s Memorandum and Articles of Association. [See Explanatory Note (ii)] (Resolution 4)
5. To re-elect Tan Sri Datuk Dr Ong Soon Hock, a Director retiring pursuant to Article 86(1) of the Company’s Memorandum and Articles of Association. [See Explanatory Note (iii)] (Resolution 5)
6. To approve the payment of Directors’ Fees amounting to S$252,000 (2018: S$252,000) for the financial year ending 31 December 2019 to be paid at the end of each quarter during the financial year. (Resolution 6)
7. To re-appoint Messrs PricewaterhouseCoopers LLP as the Company’s Auditors and to authorise the Directors to fix their remuneration. (Resolution 7)
8. To transact any other ordinary business which may properly be transacted at an Annual General Meeting.
AS SPECIAL BUSINESS
To consider and, if thought fit, to pass the following resolutions as Ordinary Resolutions, with or without modifications:
9. GENERAL MANDATE TO ISSUE SHARES OR CONVERTIBLE SECURITIES
That pursuant to Rule 806 of the listing rules of the Singapore Exchange Securities Trading Limited (“SGX-ST”), authority be and is hereby given to the Directors of the Company to:
(1) (i) allot and issue shares in the capital of the Company (the “Shares”) (whether by way of rights, bonus or otherwise); and/or
(ii) make or grant offers, agreements or options (collectively, the “Instruments”) that may or would require Shares to be issued, including but not limited to the creation and issue of (as well as adjustments to) warrants, debentures or other instruments convertible into Shares,
(2) (notwithstanding that the authority conferred by paragraph 1 of this resolution may have ceased to be in force) issue Shares in pursuance of any Instrument made or granted by the Directors while this resolution was in force,
ANNUAL REPORT 2018 143
NOTICE OF ANNUAL GENERAL MEETING
at any time and from time to time upon such terms and conditions, whether for cash or otherwise, and for such purposes and to such persons as the Directors may think fit for the benefit of the Company, provided that:
a. the aggregate number of Shares to be issued pursuant to this resolution (including shares to be issued in pursuance of Instruments made or granted pursuant to this resolution) does not exceed fifty per cent. (50%) of the total number of issued Shares excluding subsidiary holdings (as defined in the Listing Manual of the SGX-ST) and treasury shares of the Company (as calculated in accordance with sub-paragraph b. below), of which the aggregate number of Shares to be offered other than on a pro-rata basis to shareholders of the Company (including Shares to be issued in pursuance of Instruments made or granted pursuant to this resolution) does not exceed twenty per cent. (20%) of the total number of issued Shares excluding subsidiary holdings (as defined in the Listing Manual of the SGX-ST) and treasury shares of the Company (as calculated in accordance with sub-paragraph b. below);
b. for the purpose of determining the aggregate number of Shares that may be issued under sub-paragraph a. above, the percentage of the total number of issued Shares excluding subsidiary holdings (as defined in the Listing Manual of the SGX-ST) and treasury shares shall be calculated based on the total number of issued Shares excluding subsidiary holdings (as defined in the Listing Manual of the SGX-ST) and treasury shares of the Company at the time of the passing of this resolution, after adjusting for:
(i) new Shares arising from the conversion or exercise of any convertible securities;
(ii) new Shares arising from exercise of share options or vesting of share awards outstanding or subsisting at the time of the passing of this resolution, provided the options or awards were granted in compliance with Part VIII of Chapter 8 of the Listing Manual of the SGX-ST; and
(iii) any subsequent bonus issue, consolidation or subdivision of Shares;
c. in exercising the authority conferred by this resolution, the Company shall comply with the provisions of the Listing Manual of the SGX-ST for the time being in force (unless such compliance has been waived by the SGX-ST) and the Memorandum of Association and Articles of Association for the time being of the Company; and
d. unless revoked or varied by the Company in general meeting, the authority conferred by this resolution shall continue in force until the conclusion of the next Annual General Meeting of the Company or the date by which the next Annual General Meeting of the Company is required to be held, whichever is the earlier, except that the Directors shall be authorised to allot and issue Shares pursuant to any Instrument made or granted by the Directors while this resolution was in force notwithstanding that such authority has ceased to be in force at the time of issue of such Shares.[See Explanatory Note (iv)].
(Resolution 8)
10. INTERESTED PERSON TRANSACTIONS
That for the purposes of Chapter 9 of the Listing Manual (“Chapter 9”) of the SGX-ST:
(1) approval be and is hereby given for the Company, its subsidiaries and associated companies that are considered to be “entities at risk” under Chapter 9, or any of them, to enter into any of the transactions falling within the types of interested person transactions described in the Appendix to the Annual Report for the financial year 2018 (the “Appendix”) with any party who is of the class of interested persons described in the Appendix, provided that such transactions are made on normal commercial terms and in accordance with the review procedures for such interested person transactions (the “Mandate”);
MEWAH INTERNATIONAL INC. 144
NOTICE OF ANNUAL GENERAL MEETING
(2) the approval given in paragraph (1) above shall, unless revoked or varied by the Company in general meeting, continue in force until the conclusion of the next Annual General Meeting of the Company; and
(3) the Directors of the Company be and are hereby authorised to complete and do all such acts and things (including executing all such documents as may be required) as they may consider expedient or necessary or in the interests of the Company to give effect to the Mandate and/or this Resolution. [See Explanatory Note (v)].
(Resolution 9)
11. RENEWAL OF SHARE PURCHASE MANDATE
(a) That for the purposes of the Listing Manual of the Singapore Exchange Securities Trading Limited (the “SGX-ST”) and subject to the Companies Law Chapter 22 (Law 3 of 1961, as consolidated and revised) of the Cayman Islands (the “Cayman Companies Law”), the Directors of the Company be and are hereby authorised to exercise all the powers of the Company to purchase or acquire issued ordinary shares fully paid in the capital of the Company (the “Shares”) not exceeding in aggregate the Prescribed Limit (as defined below), at such price or prices as may be determined by the Directors from time to time up to the Maximum Price (as defined below), whether by way of:
(i) market purchases on the SGX-ST, transacted through the ready market of the SGX-ST and through one or more duly licensed dealers appointed by the Company for that purpose (“Market Purchase”); and/or
(ii) off-market purchases (if effected otherwise than on the SGX-ST) in accordance with any equal access scheme(s) as may be determined or formulated by the Directors as they consider fit, which scheme(s) shall satisfy all the conditions prescribed by the Cayman Companies Law and the Listing Manual (“Off-Market Purchase”),
(the “Share Purchase Mandate”);
(b) unless varied or revoked by the Company in general meeting, the authority conferred on the Directors of the Company pursuant to the Share Purchase Mandate may be exercised by the Directors at any time and from time to time during the period commencing from the date of the passing of this Resolution and expiring on the earlier of:
(i) the conclusion of the next Annual General Meeting of the Company; or
(ii) the date on which the next Annual General Meeting is required to be held; or
(iii) the date on which such Share purchases or acquisitions are carried out to the full extent mandated; or
(iv) the date on which the authority conferred by the Share Purchase Mandate is revoked or varied by shareholders in a general meeting,
in this Resolution:
“Average Closing Price” means the average of the closing market prices of the Shares over the last five consecutive Market Days, on which transactions in the Shares were recorded, immediately preceding the date of the Market Purchase by the Company or, as the case may be, the date of the making of the offer pursuant to the Off-Market Purchase, and deemed to be adjusted for any corporate action that occurs after the relevant five consecutive Market Days;
ANNUAL REPORT 2018 145
NOTICE OF ANNUAL GENERAL MEETING
“date of the making of the offer” means the date on which the Company announces its intention to make an offer for the purchase or acquisition of the Shares to holders of Shares, stating the purchase price (which shall not be more than the Maximum Price determined on the foregoing basis) for each Share and the relevant terms of the equal access scheme for effecting the Off-Market Purchase;
“Maximum Price” in relation to a Share to be purchased, means the purchase price (excluding related expenses of the purchase) not exceeding:
(i) in the case of a Market Purchase, 105% of the Average Closing Price; and
(ii) in the case of an Off-Market Purchase, 120% of the Average Closing Price.
“Prescribed Limit” means in respect of the entire Relevant Period, such number of issued Shares which shall not exceed:
(i) within any period of (6) six months, 1.5% of the issued Shares of the Company; and
(ii) within the entire Relevant Period, 3% of the issued Shares of the Company,
as at the date of the passing of this Resolution at which the renewal of the Share Purchase Mandate is approved unless the Company has effected a reduction of its share capital in accordance with the applicable provisions of the Cayman Companies Law, at any time during the Relevant Period or within any one (1) financial year of the Company, whichever is the earlier, in which event the issued ordinary share capital of the Company shall be taken to be the amount of the issued ordinary share capital of the Company as altered. Any of the Company’s Shares which are held as treasury shares will be disregarded for purposes of computing the 3% limit; and
“Relevant Period” means the period commencing from the date of the Annual General Meeting (“AGM”) at which the renewal of the Share Purchase Mandate is approved up to (i) the conclusion of the next AGM of the Company; or (ii) the date on which the next AGM is required to be held; or (iii) the date on which such Share purchases or acquisitions are carried out to the full extent mandated; or the date on which the authority conferred by the Share Purchase Mandate is revoked or varied by shareholders in a general meeting, whichever is the earliest;
(c) in connection with the actions contemplated by the foregoing resolutions, any Director or any attorney or duly authorised signatory of the Company (any such person being an “Attorney” or “Authorised Signatory” respectively) be, and each hereby is, authorised, in the name and on behalf of the Company, to do such further acts and things as any Director or officer or such other person shall deem necessary or appropriate in connection with, or to carry out the actions contemplated by, the foregoing resolutions, including to do and perform (or cause to be done and performed), in the name and on behalf of the Company, all such acts and to make, execute, deliver, issue or file (or cause to be made, executed, delivered or filed) with any person including any governmental authority or agency, all such agreements, documents, instruments, certificates, consents and waivers, and all amendments to any such agreements, documents, instruments or certificates, and to pay, or cause to be paid, all such payments, as any of them may deem necessary or advisable to carry out the intent of the foregoing resolutions, the authority for the taking of any such action and the execution and delivery of such of the foregoing to be conclusively evidenced thereby;
(d) any and all actions of the Company, or of a Director or any Attorney or Authorised Signatory, taken in connection with the actions contemplated by the foregoing resolutions prior to the execution hereof be and hereby are ratified, confirmed, approved and adopted in all respects as fully as if such action(s) had been presented to for approval, and approved by, all the Directors prior to such action being taken; and
MEWAH INTERNATIONAL INC. 146
NOTICE OF ANNUAL GENERAL MEETING
(e) the Directors of the Company and/or any of them be and are hereby authorised to complete and do all such acts and things (including executing all such documents as may be required) as they and/or he may consider expedient or necessary or in the interests of the Company to give effect to the transactions contemplated and/or authorised by this Resolution. [See Explanatory Note (vi)].
(Resolution 10)
By Order of the Board
Abdul Jabbar Bin Karam DinCompany Secretary
Singapore, 9 April 2019
NOTICE OF BOOKS CLOSURE AND DATE OF PAYMENT OF FINAL DIVIDENDS
NOTICE IS HEREBY GIVEN that the Share Transfer Books and Register of Members of Mewah International Inc. (the “Company”) will be closed from 5.00 pm on 3 May 2019 for the purpose of determining members’ entitlements to the final dividends.
Duly completed registrable transfers (in respect of shares not registered in the name of The Central Depository (Pte) Ltd) together with all relevant documents of title thereto received not later than 5.00 pm on 3 May 2019 by the Company’s Singapore Share Transfer Agent, Boardroom Corporate & Advisory Services Pte. Ltd, 50 Raffles Place, #32-01 Singapore Land Tower, Singapore 048623 will be registered in accordance with the Bye-Laws of the Company to determine members’ entitlements to such dividends.
The proposed dividends, if approved at the Annual General Meeting to be held on 24 April 2019, will be paid on 10 May 2019.
Explanatory Notes:
(i) Ms Michelle Cheo Hui Ning, upon re-election as a Director of the Company, will remain as an Executive Director and a Chief Executive Officer.
(ii) Ms Wong Lai Wan, upon re-election as a Director of the Company will remain as an Executive Director.
(iii) Tan Sri Datuk Dr Ong Soon Hock, upon re-election as a Director of the Company will be the Member of the Audit, Remuneration and Nominating Committee. Tan Sri Datuk Dr Ong Soon Hock is an Independent Director.
(iv) The Ordinary Resolution 8 proposed in item 9 above, if passed, is to empower the Directors to allot and issue shares in the capital of the Company and/or instruments (as defined above). The aggregate number of shares to be issued pursuant to Resolution 8 (including shares to be issued in pursuance of instruments made or granted) shall not exceed fifty per cent. (50%) of the total number of issued shares excluding subsidiary holdings (as defined in the Listing Manual of the SGX-ST) and treasury shares of the Company, with a sub-
ANNUAL REPORT 2018 147
NOTICE OF ANNUAL GENERAL MEETING
limit of twenty per cent. (20%) for shares issued other than on a pro-rata basis (including shares to be issued in pursuance of instruments made or granted pursuant to this Resolution) to shareholders with registered addresses in Singapore. For the purpose of determining the aggregate number of shares that may be issued, the percentage of the total number of issued shares excluding subsidiary holdings (as defined in the Listing Manual of the SGX-ST) and treasury shares of the Company will be calculated based on the total number of issued shares excluding subsidiary holdings (as defined in the Listing Manual of the SGX-ST) and treasury shares of the Company at the time of the passing of Resolution 8, after adjusting for (i) new shares arising from the conversion or exercise of any convertible securities; (ii) new shares arising from exercise of share options or vesting of share awards outstanding or subsisting at the time of the passing of Resolution 8, provided the options or awards were granted in compliance with Part VIII of Chapter 8 of the Listing Manual of the SGX-ST; and (iii) any subsequent bonus issue, consolidation or subdivision of shares.
(v) The Ordinary Resolution 9 proposed in item 10 above, if passed, is to empower the Directors of the Company to continue to enter into interested person transactions, on the Group’s normal commercial terms and in accordance with the guidelines and procedures of the Company for interested person transactions as described in the Appendix to shareholders dated 9 April 2019. This authority will continue in force until the next Annual General Meeting.
(vi) The Ordinary Resolution 10 proposed in item 11 above, is to renew the Share Purchase Mandate, which was originally approved by the shareholders on 25 April 2013. Detailed information on the renewal of the Share Purchase Mandate is set out in the Appendix to shareholders dated 9 April 2019.
Notes:
1. If a shareholder being a Depositor whose name appears in the Depository Register wishes to attend and vote at the Annual General Meeting, then he/she should complete the Proxy Form and deposit the duly completed Proxy Form at the office of the Singapore Share Transfer Agent, Boardroom Corporate & Advisory Services Pte. Ltd., at 50 Raffles Place, Singapore Land Tower, #32-01 Singapore 048623, at least 48 hours before the time of the Annual General Meeting.
2. If a Depositor wishes to appoint a proxy(ies), then the Proxy Form must be deposited at the office of the Singapore Share Transfer Agent, Boardroom Corporate & Advisory Services Pte. Ltd., at 50 Raffles Place, Singapore Land Tower, #32-01 Singapore 048623, at least 48 hours before the time of the Annual General Meeting.
Personal data privacy:
By submitting an instrument appointing a proxy(ies) and/or representative(s) to attend, speak and vote at the Annual General Meeting and/or any adjournment thereof, a member of the Company: (i) consents to the collection, use and disclosure of the member’s personal data by the Company (or its agents) for the purpose of the processing and administration by the Company (or its agents) of proxies and representatives appointed for the Annual General Meeting (including any adjournment thereof) and the preparation and compilation of the attendance lists, minutes and other documents relating to the Annual General Meeting (including any adjournment thereof), and in order for the Company (or its agents) to comply with any applicable laws, listing rules, regulations and/or guidelines (collectively, the “Purposes”); (ii) warrants that where the member discloses the personal data of the member’s proxy(ies) and/or representative(s) to the Company (or its agents), the member has obtained the prior consent of such proxy(ies) and/or representative(s) for the collection, use and disclosure by the Company (or its agents) of the personal data of such proxy(ies) and/or representative(s) for the Purposes; and (iii) agrees that the member will indemnify the Company in respect of any penalties, liabilities, claims, demands, losses and damages as a result of the member’s breach of warranty.

This page has been intentionally left blank.

MEWAH INTERNATIONAL INC.5 International Business Park,
#05-00 Mewah Building
Singapore 609914
GENERAL LINETel : (65) 6829 5200
Fax : (65) 6829 5160
Email: [email protected]
INVESTOR RELATIONSTel : (65) 6829 5255
Email: [email protected]