metro altanta transit project delivery and cost … m... · metro atlanta transit project delivery...
TRANSCRIPT

Metro Atlanta Transit
Project Delivery Assessment and Cost Estimate Review
George M. Hitchcock III, PE, PMP, DBIA
Hatch Mott MacDonald
Atlanta, GA
ABSTRACT
Major public transit projects, including heavy rail,
light rail, bus rapid transit, and commuter rail represent a
significant capital investment by Federal, State, and local
governments. Major public transit projects have been
delivered late and over budget. Determining a project’s
ability to meet both schedule and budget is therefore a
difficult and important task. The development and/or
evaluation of project schedules, risk assessments, and cost
estimates during the concept/feasibility stage and the
inclusion of sufficient contingency remains critical to
establishing and maintaining the public’s trust. The first
questions that sponsors must answer are invariably how
much will the project cost and when will it be completed?
Introduction
The State of Georgia’s Transportation Investment
Act of 2010 (TIA) is used to refer to H.B. 277, legislation
which establishes a transportation sales tax referendum for
each of the twelve regions of the State of Georgia to be held
in the summer of 2012. The length of the sales tax
collection and distribution for each region, if approved,
will be 10 years.
A list of financially unconstrained projects was to
be developed for each region by Georgia Department of
Transportation’s (GDOT) Director of Planning. From that
list, elected officials from the region were to select the
projects to be placed on the financially constrained list for
voter consideration at the summer 2012 ballot referendum.
All the projects on the financially constrained list should
be constructible within the 10-year period of the sales tax.
The Georgia Regional Transportation Authority (GRTA)
and Atlanta Regional Commission (ARC) were tasked with
performing a delivery assessment, cost review, and
performance evaluation of the proposed transit projects
within the metropolitan Atlanta region.
The TIA allowed for funding of transit capital
projects and up to 20 years operating funds for those
projects, as prescribed by H.B. 277:
Any portion of a region’s revenues may be used
for transit capital and maintenance & operations (M&O)
(except for MARTA which may only pay for M&O of new
capital outlays made after January 1, 2011). Revenues may
be used to fund a 20-year reserve for a region’s transit
maintenance & operations.
With the significant growth in the Atlanta metro
region and the on-going congestion on the freeways,
transportation alternatives that can bypass that automobile
congestion, such as rail transit projects, are very appealing
to the region. Since very few new major capital transit
projects have been built in the past decade within the
Atlanta region, there is considerable interest by many
transit agencies in obtaining funding for new transit
projects and extensions of existing transit facilities.
There is also interest in getting funds to improve
existing transit systems and perform deferred maintenance
projects, known as State-of-Good-Repair projects. H.B.
277 allows for the funds raised through the sales tax to also
be used for M&O funds, which is a benefit to many transit
agencies suffering from the prolonged effects of the
difficult economic conditions since 2008 recession.
GRTA’s Role
TIA assigned GRTA the role of ensuring delivery of
public transit projects for the Atlanta region (on time and
on budget). As the list was developed by the GDOT
Director of Planning and the locally elected officials,
GRTA supported the effort by analyzing rail-transit capital
projects submitted within the Atlanta region for project
delivery during the ten-year time frame of TIA. The
Delivery Evaluation consisted primarily of an analysis of
schedule risk elements and the review/development of
sponsor’s project schedule.
Overview
The study was initially scoped as a deliverability
screening and assessment of the non-roadway projects for
the Atlanta region from the unconstrained list developed by
GDOT for the August 2012 TIA ballot measure.
Therefore, the first part of the study was termed the Project
Delivery Assessment. Midway through the study, the need
to review and validate the project sponsors capital and
operating costs estimates was added. This information,
along with other performance criteria data supplied by
ARC, was prepared to assist decision makers in
determining the project for the fiscally constrained list.
The evaluation began in March 2011 and was completed
by June 2011.

APTA 2014 Rail Conference
Metro Atlanta Transit
Project Delivery Assessment and Cost Estimate Review 2
GDOT received 62 funding requests for non-
roadway improvements from nine project sponsors. Table
1 provides a summary of the applications by mode.
PROJECT DELIVERY ASSESSMENT
The goal of the deliverability analysis was to help
provide a realistic expectation of the schedule for each
major capital public transit project and to assess potential
delays (risk) in order to ensure on–time delivery of the
selected projects within a ten year period, which includes
beginning of revenue service and operations. This portion
of the study focused on nineteen applications which
represented fifteen major capital rail projects, illustrated in
Figure 1, as all other public transit capital projects
submitted were expected to be completed within the 10
year period.
Process
During the scoping phase, GRTA determined that a
transparent process was needed that included significant
sponsor engagement to avoid public disagreements
regarding the assessments. A detailed process flowchart
and schedule was developed and shared with the sponsors.
Significant sponsor engagement was established in three
main phases: data collection, methodology /analysis, and
results.
The process started with a one-day Risk
Workshop where a group of national and local
professionals that comprised the project team, along with
GRTA, met to develop a risk worksheet and draft
methodology. Project sponsors were then requested to
prepare a presentation and to participate in an interview
where the project team had the opportunity to discuss the
sponsor’s projects. A draft methodology was distributed to
the project sponsors, prior to the presentation/interview.
After the sponsor’s presentation and receipt of comments
from both GRTA and the sponsors, the methodology was
completed. The project team then performed a draft risk
assessment of the 15 major capital projects. After the first
evaluation, the project team developed a list of clarification
questions for the sponsors and held a follow-up meeting
with each of the sponsors prior to developing the final risk
assessment. Parallel to this process was the development
of program schedules. The draft results of the risk
assessment and program schedules were presented
individually to each of the sponsors, and finalized prior to
the public presentation of final draft results to the Regional
Roundtable. Feedback was received from the project
sponsors and various outside stakeholders and incorporated
into the final results.
Risk Analysis
The project team and GRTA identified a
comprehensive list of evaluation criteria that were
incorporated into the draft methodology that was then
shared with project sponsors. The risk assessment
methodology used a typical risk matrix with both
likelihood and severity indices, as shown in Figure 2. The
final Risk Rating categories utilized the identical five tier
scale that FTA used for overall project ratings under
SAFETEA-LU for New Starts or Small Starts projects.
The risk assessment was performed
independently by five project team members whose draft
assessments were aggregated and evaluated to identify
major differences between evaluators. These areas of
discrepancy were discussed among the members, and then
a final evaluation was completed. The individual risk
criteria scores were categorized into one of six major
categories based upon the major phases:
Procurement | Agreements
Planning | Environmental
Engineering & Architectural Design
Right-of-Way Acquisition
Construction
Commissioning & Testing
Table 1. Transit Applications
Figure 1. Major Capital Projects Map

APTA 2014 Rail Conference
Metro Atlanta Transit
Project Delivery Assessment and Cost Estimate Review 3
An unweighted final composite risk score was
derived for each project and formed the basis for the
development of recommendations.
Program Schedule
CPM schedules were independently developed
for each project using Microsoft Project and utilized the
same major phases identified for the Risk Analysis. The
project procurement method was assumed to be Design-
Bid-Build to capture the longest anticipated delivery time
and the schedule risk assessment was performed using the
Program Evaluation and Review Technique (PERT)
Analysis
PERT Analysis
A sample of the PERT analysis is shown in Table
2. This illustrates the various task durations and the
derivation of standard deviation (Sigma) and calculation of
the project variance (Sigma times Confidence value). The
project variance is a schedule contingency to account for
variation in the durations of each task.
The final completion date was established by adding an
identified task identified and associated “Project Variance”
to the schedule. The duration of the individual tasks were
based upon the variability of the overall schedule using a
95% confidence interval. The Microsoft Project® (MSP)
input form for the calculation of the task duration utilizing
the PERT methodology was used. Table 3 and Figure 3
present the input table for the calculation of the task
duration, and the Gantt chart view of the resulting
schedule. Without the project variance task, the program
finish date would be December 2017. However, the
addition of the project variance task (8.8 months)
established an expected finish date of September 2018.
Monte Carlo Analysis
A subsequent Monte Carlo modeling was
performed for each project schedule utilizing Microsoft
Project and @Risk® software. The Monte Carlo modeling
was done to create a comparison baseline to confirm the
validity of the PERT models. The project completion
(finish) date results are displayed graphically in Figure 4 in
the form of a Histogram, S-curve and Tornado Diagram.
Figure 2. Risk Matrix
Table 2. PERT Worksheet
Table 3. MSP PERT Tool
Figure 3. MSP Schedule
Figure 4. Monte Carlo Output

APTA 2014 Rail Conference
Metro Atlanta Transit
Project Delivery Assessment and Cost Estimate Review 4
Schedule Duration Comparison
A comparison of the results of the PERT Analysis
and Monte Carlo simulation model indicate that the
duration of total project varied by less than 4% overall,
inclusive of the project variance task. Table 4 summarizes
the results for the above project finish dates and duration
by model.
Results
Each project was assigned a Project Delivery
Score. The Project Delivery Score was defined as the
product of the Risk Score and the remaining project
duration in years. The remaining project duration was
derived by subtracting the completion date based upon the
PERT analysis from the January 1, 2013 anticipated start
of the sales tax collection. The results of the analysis were
sorted based on the Project Delivery Score and presented
as shown in Figure 5. The figure included the key metrics
for Delivery, Schedule and Risk. A risk rating along with
the presence of a default risk was also provided.
Additionally a new term was identified, the Default Risk.
The Default Risk was added to account for risks that had
the potential being a fatal flaw or an unrecoverable risk that
would lead to project failure.
Table 4. Finish Date Comparison
Figure 5. Project Delivery Results

APTA 2014 Rail Conference
Metro Atlanta Transit
Project Delivery Assessment and Cost Estimate Review 5
COST ESTIMATE REVIEW
During the Program Delivery Assessment, it was
determined that the project sponsor cost information
provide in their applications did not provide sufficient
information for evaluation. GRTA initiated the Cost
Estimate Review phase in mid-May 2011 and was
completed by the end of July 2011.
The purpose of this study was to perform a review
the capital and operations cost estimates for transit projects
from the Atlanta region on the unconstrained projects’ list.
The primary goal of the assessment was to
evaluate the sponsor’s cost estimate to verify the
reasonableness of their budget requests utilizing following
three principals:
Completeness – estimate included a complete
scope of work.
Reasonableness – estimate fairly represented
reasonable costs.
Consistent – estimate utilized appropriate soft
cost factors.
Process
The process of evaluating the project sponsor cost
estimate began with a review of the documentation
provided during the Project Delivery Assessment. Noting
that there was not a consistent approach and/or format for
the estimates, the project team developed a set of cost
estimating guidelines for capital and operating costs based
on the FTA’s SCC methodology. The project team
prepared a capital and operating cost methodology. The
methodology addressed the development of capital cost
and operating cost models by mode (commuter rail, heavy
rail, light rail/streetcar, bus rapid transit). The
methodology included information from FTA’s Capital
Cost Database and National Transit Database (NTD)
information. The methodology and the FTA’s SCC for
capital projects workbook was provided to the sponsors so
that each sponsor could submit a standardized cost
proposal.
Concurrent with the sponsor’s estimating process;
the project team began an independent cost estimate for
each project.
Upon receipt of the project sponsors revised
estimates; the project team performed an evaluation of the
submittal to determine the completeness of the sponsor’s
estimate. A comparison was done between the project
sponsors’ estimates and the project team’s independent
estimates. This information was shared with each project
sponsor and meetings were held with each project sponsor
to reconcile and differences, either in unit costs and/or
scope. While there were differences between the estimates,
GRTA and the project sponsors were able to achieve
consensus on a single estimate of maximum probable cost
for utilization by the Regional Roundtable to develop the
fiscally constrained project list.
FTA SCC Unit Cost Development
The Capital Costs used in the independent
estimates were developed in the FTA SCC format using the
SCC 2010 Database. Similarly, the Operating costs were
based upon the 2009 NTD data. The analysis presented
here focuses solely on the capital cost analysis.
FTA SCC Database Unit Costs
Utilization of the FTA SCC database required the
application of engineering judgment and the use of other
data sources to validate the applicable unit cost. While the
database is based on as-built verified costs, the difference
between some of unit costs can be significant and not every
project includes all the various cost categories. The project
team analyzed each cost item in the SCC prior to
incorporating the average cost into the independent
estimates. The analysis indicated that the use of the raw
unfiltered averages caused erroneous estimates.
For some items the range (span) of values
reported was greater than the average cost, and the
associated standard deviation was often greater than the
average. The project team adjusted the data for each item.
Some data was culled based upon knowledge of specific
projects where items may have been reported in unusual
categories (parking decks reported as parking lots as an
example). Other items were adjusted by culling the
furthest outliers (both high and low) until the median an
average costs were within on standard deviation. Table 5
provide representative examples for some of the raw
database cost statistics and illustrate the variability of LRT
cost data. Similar issues existed with the HRT cost data,
and the process was repeated with the HRT data.
Final FTA SCC Unit Costs
After a thorough review and refinement of the raw
FTA SCC cost database values, a final unit cost table was
develop for both HRT and LRT. Table 6 provides the final
Table 5. SCC Unit Cost Variation

APTA 2014 Rail Conference
Metro Atlanta Transit
Project Delivery Assessment and Cost Estimate Review 6
unit costs that formed the basis of the development of cost
estimates for the 15 major capital projects.
Capital Cost Estimates
With a scrubbed SCC unit cost table for each
mode, the project team began review and evaluation of the
project sponsors cost estimates and the development of an
independent cost estimate. The process involved three
basic phases, the harmonization of sponsor data, the
computation of analogous system cost, and the independent
scope verification and estimate of maximum probable cost.
Harmonization of Sponsor Data
The project team requested that sponsors submit
their cost estimates in the FTA SCC format, but few of the
projects were submitted as requested. This required that
the project team harmonize the data to match the SCC
format based upon database average line item formats. The
process consisted to two steps, the first was the direct
conversion of line times, and the second was the expansion
of line items to match the SCC format. This process was
cost neutral, because the total sponsor’s cost remained
unchanged. An example of this expansion would be in
station costs. Sponsor’s typically had a single value for a
station, while section 20 has several line items. The station
cost broken down into the various subcategories using the
FTA SCC database average unit costs to determine the
distribution, and theoretical quantities were developed.
Additionally, none of the project sponsors included the
required 1% of construction cost for Arts in Transit.
Typical missing quantities were computed for obvious
missing items such as track without any costs for
guideway. Thirty percent contingency on construction cost
was added at the phase.
SCC Line Item Comparison of Analogous Systems
The project team took the harmonized data
(quantities) and applied the FTA SCC cost data to develop
a theoretical comparison cost between the sponsor’s
submission and a hypothetical “average” FTA project.
Also, quantities were added were missing. Table 7 is a
partial example of this analysis.
Independent Cost Estimate
The project team did independent scope
verification on each sponsor’s estimate. The team
developed/verified the quantity takeoff from the plans and
concepts documents submitted by the project sponsors.
These plans and documents varied considerably. The first
activity was a review of the project scope and verification
of the team’s data with the project sponsors. Project
sponsors were provide the above information regarding
their individual projects and given the opportunity to
provide additional information and/or clarifications.
Contingency Analysis
During the development of the capital cost
estimates, the subject of contingency was examined.
Project sponsors cost estimates included a range of
contingencies, both allocated and unallocated, in Table 8.
Statistic Allocated Unallocated Total
Minimum 0.0% 0.0% 16.1%
Average 15.1% 9.3% 24.4%
Maximum 20.0% 16.1% 30.7%
Table 8. Sponsor Contingency
Table 6. GRTA Unit Costs
Table 7. Analogous Costs

APTA 2014 Rail Conference
Metro Atlanta Transit
Project Delivery Assessment and Cost Estimate Review 7
All of the projects are in the early stages of project
development and to effectively evaluate projects, it was
necessary to establish a uniform approach to contingency.
During the project review process, the projects sponsor and
GRTA agreed to 30% unallocated contingency on SCC 10-
50 costs.
During a Regional Roundtable meeting, the
representative responsible for the selection of the fiscally
constrained project list were exploring the distribution of
region sales tax revenue between transit and highway,
observed that approximately $3 billion dollars would be
allocated to transit, and of that 30% or $1 billion dollars
would be allocated to project contingency. ARC, GRTA
and GDOT were asked to review the policy of contingency
and provide additional information and justification of that
value. As part of the additional analysis, both a statistical
analysis and a Monte Carlo simulation model was
developed utilizing the unit costs and standard deviation to
calculate the contingency. The result of the statistical
analysis was a range of contingencies based on project and
mode. The cost weighted average for all projects is 31.5%
while HRT was 35.4% and LRT was 28.6%. Finally, Table
9 provides an example of the statistical contingency cost
worksheet used to calculate the actual contingency % using
the standard deviation (σ) developed in the LRT SCC Unit
Cost analysis.
Statistical Unallocated Contingency
Rail Mode HRT LRT
Minimum 32.4% 24.3%
Median 35.5% 28.8%
Average 37.6% 29.0%
Maximum 45.8% 33.2%
Table 9. Unallocated Contingency
Monte Carlo Simulations
There were significant discussions regarding
contingency due to the magnitude of the dollars identified
as contingency, and the desire to develop as many projects
as fiscally possible. The project team used the results of
the independent costs estimates and performed a statistical
analysis and Monte Carlo model to establish a confidence
in the overall results. Figure 6 is a graphic example of the
results including a Histogram, S-Curve and Tornado
Diagram. Table 10 presents the results in a tabular format,
while Table 11 illustrates the actual @Risk model
worksheet.
A comparison of the results between the various
methodologies resulted in an insignificant variation
between the various methods, and confirmed the utilization
of 30% contingency for all capital projects. The various
results for the above example project are summarized in
Table 12.
Project 10: LRT NE I-85
Total Project Cost | Model Type Total Capital
Cost
Total Project Cost | 30% Contingency $1,227,865,079
Total Project Cost | Statistical Analysis 95% CL $1,220,300,389
Total Project Cost | Monte Carlo Model 85% $1,216,748,139
Table 12. Contingency by Model
Figure 6. Monte Carlo Output
Table 10. Tabular Results
Table 11. @Risk Model
APTA 2014 Rail Conference
Metro Atlanta Transit
Project Delivery Assessment and Cost Estimate Review 8
Year of Expenditure Forecast
Initially, it was intended to present the results of
both the capital costs and operational costs in year of
expenditure. However, after lengthy discussions, it was
decided not to present escalated costs or a net present value
analysis due to the concerns over selection of an effective
rate. Therefore, the results were presented only in present
(2011$) dollars. Cash flow diagrams were prepared for
each of the project utilizing the projects schedule
developed in the Program Delivery Assessment and
incorporating a 3% annual escalation and 20 year operating
period. While not presented to the Regional Roundtable,
they were included in the final documentation. Utilizing
the example project above, Figure 7 is an example of the
cash flow diagram depicting the planning, engineering, and
construction costs and operating costs. The left side of the
graph indicates expenditure by calendar year while the
right side of the graph is a cumulative project cost.
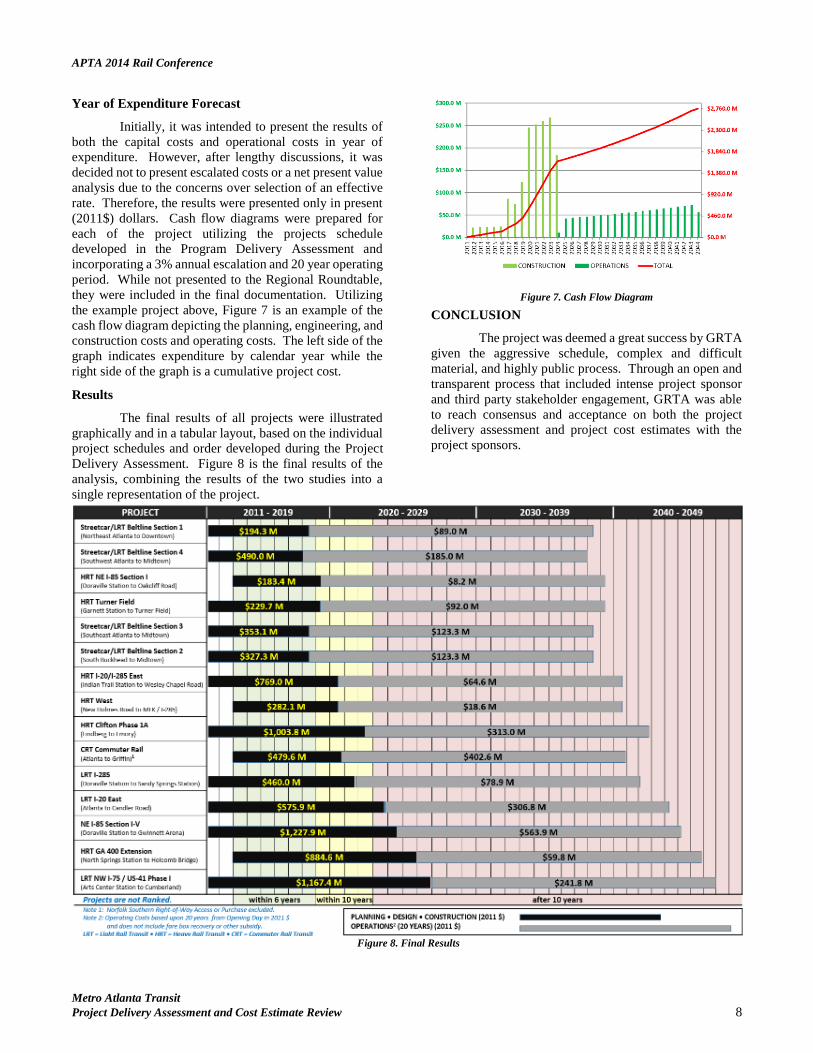
Results
The final results of all projects were illustrated
graphically and in a tabular layout, based on the individual
project schedules and order developed during the Project
Delivery Assessment. Figure 8 is the final results of the
analysis, combining the results of the two studies into a
single representation of the project.
CONCLUSION
The project was deemed a great success by GRTA
given the aggressive schedule, complex and difficult
material, and highly public process. Through an open and
transparent process that included intense project sponsor
and third party stakeholder engagement, GRTA was able
to reach consensus and acceptance on both the project
delivery assessment and project cost estimates with the
project sponsors.
Figure 7. Cash Flow Diagram
Figure 8. Final Results