2014 metro transit rider survey · 3 2014 metro transit rider survey overview background metro...
TRANSCRIPT
2014 Metro Transit Rider Survey
FINAL REPORT 2.15.2015
2
2014 Metro Transit Rider Survey
Table of Contents
Overview 3
Executive Summary 7
In-Depth Findings 20
Bus
Bus Trends
21
83
Light Rail
Light Rail Trends
115
173
Northstar 222
Survey Instruments 263
3
2014 Metro Transit Rider Survey
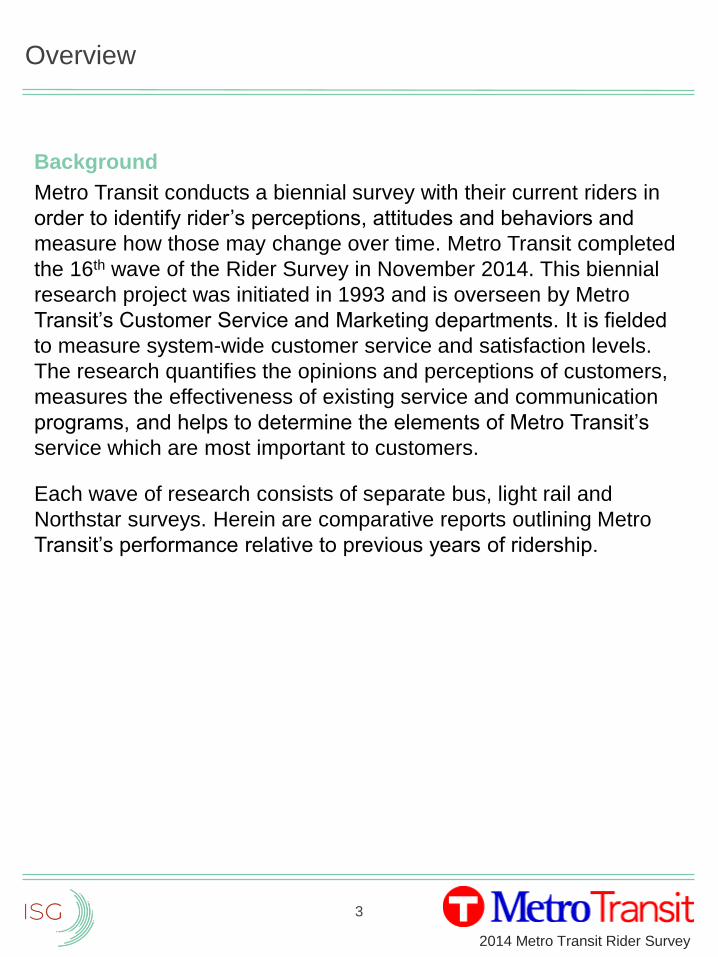
Overview
Background
Metro Transit conducts a biennial survey with their current riders in
order to identify rider’s perceptions, attitudes and behaviors and
measure how those may change over time. Metro Transit completed
the 16th wave of the Rider Survey in November 2014. This biennial
research project was initiated in 1993 and is overseen by Metro
Transit’s Customer Service and Marketing departments. It is fielded
to measure system-wide customer service and satisfaction levels.
The research quantifies the opinions and perceptions of customers,
measures the effectiveness of existing service and communication
programs, and helps to determine the elements of Metro Transit’s
service which are most important to customers.
Each wave of research consists of separate bus, light rail and
Northstar surveys. Herein are comparative reports outlining Metro
Transit’s performance relative to previous years of ridership.
4
2014 Metro Transit Rider Survey
Overview: Goals
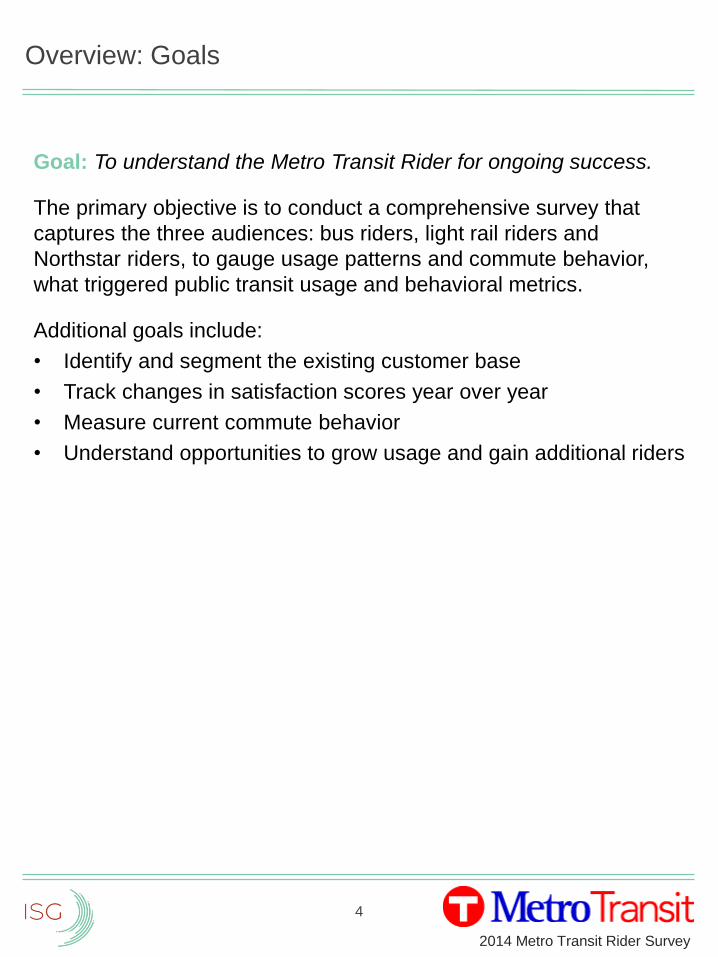
Goal: To understand the Metro Transit Rider for ongoing success.
The primary objective is to conduct a comprehensive survey that
captures the three audiences: bus riders, light rail riders and
Northstar riders, to gauge usage patterns and commute behavior,
what triggered public transit usage and behavioral metrics.
Additional goals include:
• Identify and segment the existing customer base
• Track changes in satisfaction scores year over year
• Measure current commute behavior
• Understand opportunities to grow usage and gain additional riders
5
2014 Metro Transit Rider Survey
Overview: Methodology
Methodology
Metro Transit and Clarity Coverdale Fury began the 2014 Rider
Survey process by reviewing the 2012 survey results and the current
state of Metro Transit services. The 2014 survey was then revised to
reflect the previous wave’s findings and current conditions to create
a survey that is relevant and still provides an opportunity for year-
over-year analysis.
Each survey was a 3-page 8½ X 11 booklet with a prepaid mail-back
option. Surveys were available online and web links were provided
on the printed surveys. Participation was limited to English versions
only.
Surveys were distributed on Wednesday, November 5th, Thursday,
November 6th and Sunday, November 9th, 2014 and the final
collection day was November 30th. Once collected, the surveys were
scanned and subsequently analyzed.
Number of surveys collected exceeded those from the 2012 Rider
Survey for bus and LRT but were lower for Northstar. These numbers
provide for excellent statistical reliability to compare wave to wave.
Return Rates:
Bus: 32% (Distributed 17,000, collected 5,461)
Light Rail: 46% (Distributed 12,100, collected 5,550)
Northstar: 38% (Distributed 1,300, collected 493)
6
2014 Metro Transit Rider Survey
Overview: Weighting
Weighting the bus sample
Weighting was conducted on the 2014 bus sample to account for
non-response bias that occurred during data collection. Specifically,
differential response rates among local vs. express and rush vs. non-
rush riders. This was done to ensure that sample proportions were
balanced with known population proportions. Similar non-response
bias has been identified in other bus surveys.
All 2014 bus findings included in this report are based on weighted
data. Additional documentation of the weighting process conducted
is provided later in this report.
The confidence level for statistical testing in this report is set to 0.05
(5%).
2014 Metro Transit Rider Survey
7
Executive Summary
8
2014 Metro Transit Rider Survey
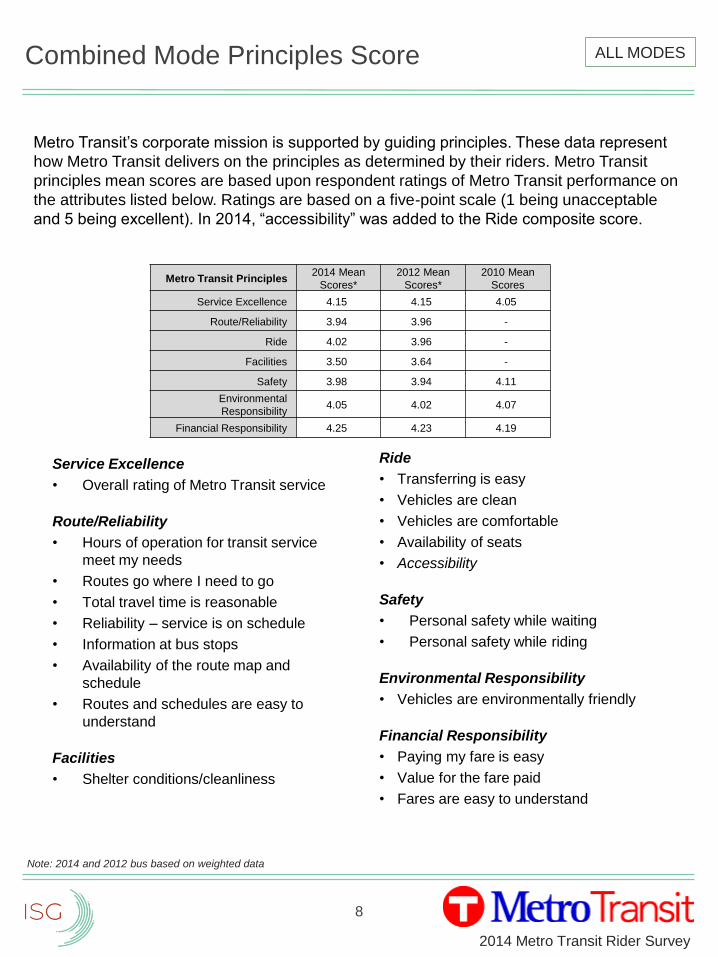
Combined Mode Principles Score ALL MODES
Metro Transit Principles2014 Mean
Scores*
2012 Mean
Scores*
2010 Mean
Scores
Service Excellence 4.15 4.15 4.05
Route/Reliability 3.94 3.96 -
Ride 4.02 3.96 -
Facilities 3.50 3.64 -
Safety 3.98 3.94 4.11
Environmental
Responsibility4.05 4.02 4.07
Financial Responsibility 4.25 4.23 4.19
Metro Transit’s corporate mission is supported by guiding principles. These data represent
how Metro Transit delivers on the principles as determined by their riders. Metro Transit
principles mean scores are based upon respondent ratings of Metro Transit performance on
the attributes listed below. Ratings are based on a five-point scale (1 being unacceptable
and 5 being excellent). In 2014, “accessibility” was added to the Ride composite score.
Service Excellence
• Overall rating of Metro Transit service
Route/Reliability
• Hours of operation for transit service
meet my needs
• Routes go where I need to go
• Total travel time is reasonable
• Reliability – service is on schedule
• Information at bus stops
• Availability of the route map and
schedule
• Routes and schedules are easy to
understand
Facilities
• Shelter conditions/cleanliness
Ride
• Transferring is easy
• Vehicles are clean
• Vehicles are comfortable
• Availability of seats
• Accessibility
Safety
• Personal safety while waiting
• Personal safety while riding
Environmental Responsibility
• Vehicles are environmentally friendly
Financial Responsibility
• Paying my fare is easy
• Value for the fare paid
• Fares are easy to understand
Note: 2014 and 2012 bus based on weighted data
9
2014 Metro Transit Rider Survey
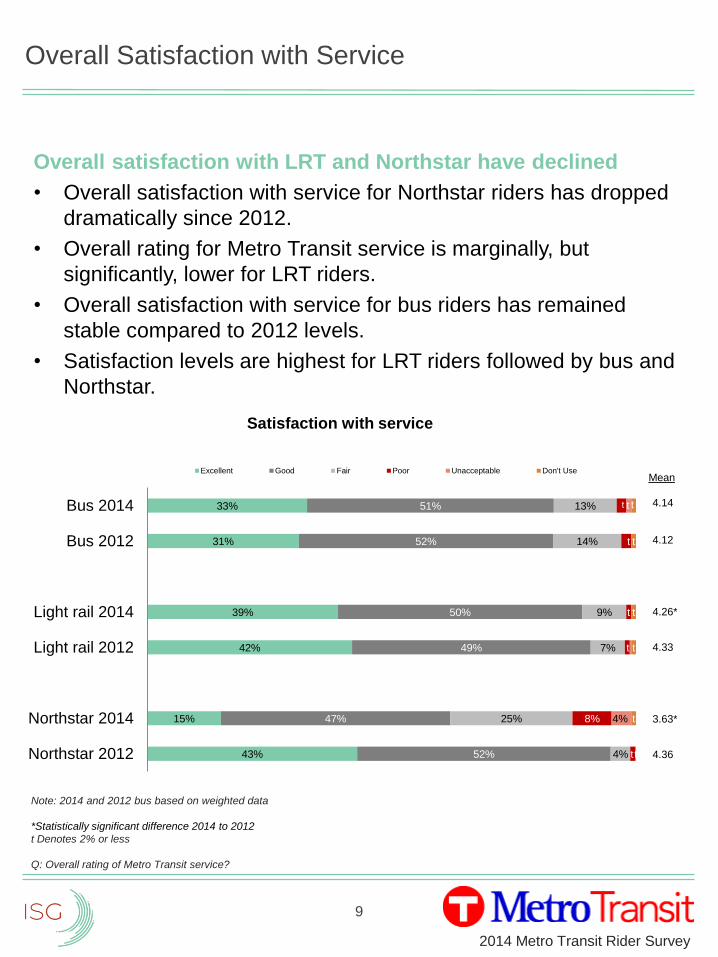
Overall Satisfaction with Service
Overall satisfaction with LRT and Northstar have declined
• Overall satisfaction with service for Northstar riders has dropped
dramatically since 2012.
• Overall rating for Metro Transit service is marginally, but
significantly, lower for LRT riders.
• Overall satisfaction with service for bus riders has remained
stable compared to 2012 levels.
• Satisfaction levels are highest for LRT riders followed by bus and
Northstar.
43%
15%
42%
39%
31%
33%
52%
47%
49%
50%
52%
51%
4%
25%
7%
9%
14%
13%
t
8%
t
4%
t
t
t
t
t
t
t
t
t
Northstar 2012
Northstar 2014
Light rail 2012
Light rail 2014
Bus 2012
Bus 2014
Satisfaction with service
Excellent Good Fair Poor Unacceptable Don't Use
t t
t 4.14
4.12
4.26*
4.33
3.63*
4.36
Mean
Note: 2014 and 2012 bus based on weighted data
*Statistically significant difference 2014 to 2012
t Denotes 2% or less
Q: Overall rating of Metro Transit service?
10
2014 Metro Transit Rider Survey
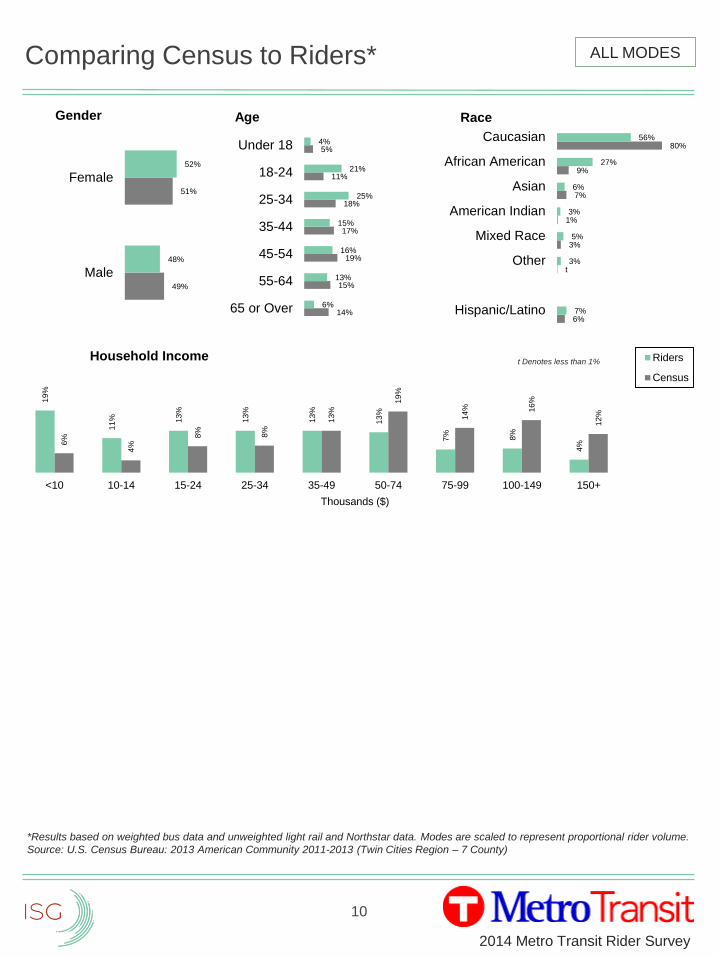
Comparing Census to Riders*
14%
15%
19%
17%
18%
11%
5%
6%
13%
16%
15%
25%
21%
4%
65 or Over
55-64
45-54
35-44
25-34
18-24
Under 18
Age
6%
t
3%
1%
7%
9%
80%
7%
3%
5%
3%
6%
27%
56%
Hispanic/Latino
Other
Mixed Race
American Indian
Asian
African American
Caucasian
Race
19
%
11
% 13
%
13
%
13
%
13
%
7% 8%
4%6
%
4%
8%
8%
13
%
19
%
14
% 16
%
12
%
<10 10-14 15-24 25-34 35-49 50-74 75-99 100-149 150+
Thousands ($)
Household Income Riders
Census
ALL MODES
49%
51%
48%
52%
Male
Female
Gender
*Results based on weighted bus data and unweighted light rail and Northstar data. Modes are scaled to represent proportional rider volume.
Source: U.S. Census Bureau: 2013 American Community 2011-2013 (Twin Cities Region – 7 County)
t Denotes less than 1%
11
2014 Metro Transit Rider Survey
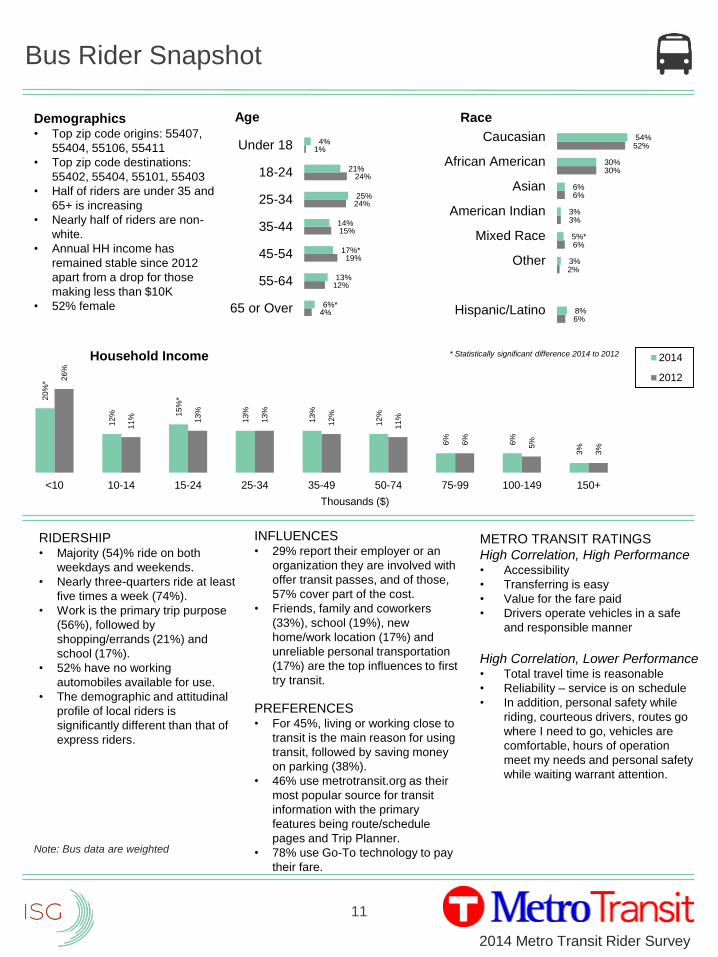
Bus Rider Snapshot
4%
12%
19%
15%
24%
24%
1%
6%*
13%
17%*
14%
25%
21%
4%
65 or Over
55-64
45-54
35-44
25-34
18-24
Under 18
Age
6%
2%
6%
3%
6%
30%
52%
8%
3%
5%*
3%
6%
30%
54%
Hispanic/Latino
Other
Mixed Race
American Indian
Asian
African American
Caucasian
Race
20
%*
12
% 15
%*
13
%
13
%
12
%
6%
6%
3%
26
%
11
% 13
%
13
%
12
%
11
%
6%
5%
3%
<10 10-14 15-24 25-34 35-49 50-74 75-99 100-149 150+
Thousands ($)
Household Income 2014
2012
Demographics• Top zip code origins: 55407,
55404, 55106, 55411
• Top zip code destinations:
55402, 55404, 55101, 55403
• Half of riders are under 35 and
65+ is increasing
• Nearly half of riders are non-
white.
• Annual HH income has
remained stable since 2012
apart from a drop for those
making less than $10K
• 52% female
Note: Bus data are weighted
* Statistically significant difference 2014 to 2012
RIDERSHIP• Majority (54)% ride on both
weekdays and weekends.
• Nearly three-quarters ride at least
five times a week (74%).
• Work is the primary trip purpose
(56%), followed by
shopping/errands (21%) and
school (17%).
• 52% have no working
automobiles available for use.
• The demographic and attitudinal
profile of local riders is
significantly different than that of
express riders.
INFLUENCES• 29% report their employer or an
organization they are involved with
offer transit passes, and of those,
57% cover part of the cost.
• Friends, family and coworkers
(33%), school (19%), new
home/work location (17%) and
unreliable personal transportation
(17%) are the top influences to first
try transit.
PREFERENCES• For 45%, living or working close to
transit is the main reason for using
transit, followed by saving money
on parking (38%).
• 46% use metrotransit.org as their
most popular source for transit
information with the primary
features being route/schedule
pages and Trip Planner.
• 78% use Go-To technology to pay
their fare.
METRO TRANSIT RATINGS
High Correlation, High Performance• Accessibility
• Transferring is easy
• Value for the fare paid
• Drivers operate vehicles in a safe
and responsible manner
High Correlation, Lower Performance• Total travel time is reasonable
• Reliability – service is on schedule
• In addition, personal safety while
riding, courteous drivers, routes go
where I need to go, vehicles are
comfortable, hours of operation
meet my needs and personal safety
while waiting warrant attention.

12
2014 Metro Transit Rider Survey
Light Rail Rider Snapshot
6%
14%
18%
16%
25%
20%
2%
4%*
12%*
14%*
15%
27%*
25%*
3%*
65 or Over
55-64
45-54
35-44
25-34
18-24
Under 18
Age
6%
3%
4%
2%
5%
14%
71%
6%
2%
5%
2%
7%*
19%*
65%*
Hispanic/Latino
Other
Mixed Race
American Indian
Asian
African American
Caucasian
Race
17
%
8% 9% 1
1%
11
%
15
%
11
%
11
%
7%
16
%
8% 1
0%
10
% 13
% 15
%
11
%
11
%
7%
<10 10-15 15-25 25-35 35-50 50-75 75-99 100-149 150+
Thousands ($)
Household Income 2014
2012
RIDERSHIP• 52% ride LRT on weekdays and
39% ride on both weekdays and
weekends.
• Most ride during rush hour (69%).
• Riding LRT five days a week is
most common (36%), 66% ride
four to seven days a week.
• Work is the primary trip purpose
(53%), followed by school (16%)
and shopping/errands (15%).
• 34% have no working
automobiles available for use.
• 13% use Park & Ride.
INFLUENCES• 38% report their employer or an
organization they are involved
with offer transit passes, and of
those, 59% cover part of the cost.
• Friends, family and coworkers
(25%), school (24%), and moved
locations (21%) are the top
influences to first try transit.
PREFERENCES• For over half (51%), living or
working close to transit is the
main reason for using transit,
followed by saving money on
parking (48%).
• Half (50%) use metrotransit.org
as their primary source for transit
information with the primary
features being trip planner and
route/schedule pages.
• 77% of riders use Go-To
technology to pay their fare.
METRO TRANSIT RATINGS
High Correlation, High Performance• Transferring is easy
• Value for fare paid
• Hours of operation for transit service
meet my needs
• Vehicles are environmentally friendly
High Correlation, Lower Performance• Total travel time is reasonable
• Reliability – service is on schedule
• In addition, personal safety while
waiting and vehicles are clean
warrant attention.
Demographics• Top zip code origins: 55406,
55417, 55407, 55404
• Top zip code destinations:
55402, 55401, 55425
• Increase in younger riders (18-
34) since 2012
• Number of non-white riders is
higher than 2012
• Annual HH incomes remain
stable since 2012
• 52% female
* Statistically significant difference 2014 to 2012
13
2014 Metro Transit Rider Survey
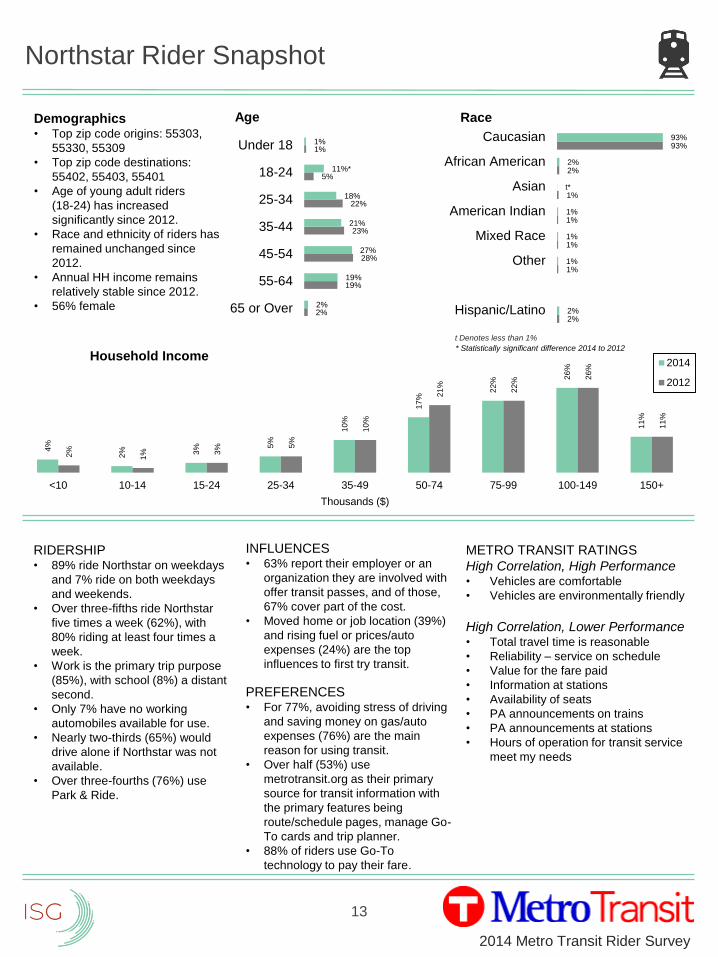
Northstar Rider Snapshot
2%
19%
28%
23%
22%
5%
1%
2%
19%
27%
21%
18%
11%*
1%
65 or Over
55-64
45-54
35-44
25-34
18-24
Under 18
Age
2%
1%
1%
1%
1%
2%
93%
2%
1%
1%
1%
t*
2%
93%
Hispanic/Latino
Other
Mixed Race
American Indian
Asian
African American
Caucasian
Race
4%
2% 3% 5
%
10
%
17
%
22
%
26
%
11
%
2%
1% 3
% 5%
10
%
21
%
22
%
26
%
11
%
<10 10-14 15-24 25-34 35-49 50-74 75-99 100-149 150+
Thousands ($)
Household Income2014
2012
RIDERSHIP• 89% ride Northstar on weekdays
and 7% ride on both weekdays
and weekends.
• Over three-fifths ride Northstar
five times a week (62%), with
80% riding at least four times a
week.
• Work is the primary trip purpose
(85%), with school (8%) a distant
second.
• Only 7% have no working
automobiles available for use.
• Nearly two-thirds (65%) would
drive alone if Northstar was not
available.
• Over three-fourths (76%) use
Park & Ride.
INFLUENCES• 63% report their employer or an
organization they are involved with
offer transit passes, and of those,
67% cover part of the cost.
• Moved home or job location (39%)
and rising fuel or prices/auto
expenses (24%) are the top
influences to first try transit.
PREFERENCES• For 77%, avoiding stress of driving
and saving money on gas/auto
expenses (76%) are the main
reason for using transit.
• Over half (53%) use
metrotransit.org as their primary
source for transit information with
the primary features being
route/schedule pages, manage Go-
To cards and trip planner.
• 88% of riders use Go-To
technology to pay their fare.
METRO TRANSIT RATINGS
High Correlation, High Performance• Vehicles are comfortable
• Vehicles are environmentally friendly
High Correlation, Lower Performance• Total travel time is reasonable
• Reliability – service on schedule
• Value for the fare paid
• Information at stations
• Availability of seats
• PA announcements on trains
• PA announcements at stations
• Hours of operation for transit service
meet my needs
Demographics• Top zip code origins: 55303,
55330, 55309
• Top zip code destinations:
55402, 55403, 55401
• Age of young adult riders
(18-24) has increased
significantly since 2012.
• Race and ethnicity of riders has
remained unchanged since
2012.
• Annual HH income remains
relatively stable since 2012.
• 56% female
* Statistically significant difference 2014 to 2012
t Denotes less than 1%
14
2014 Metro Transit Rider Survey
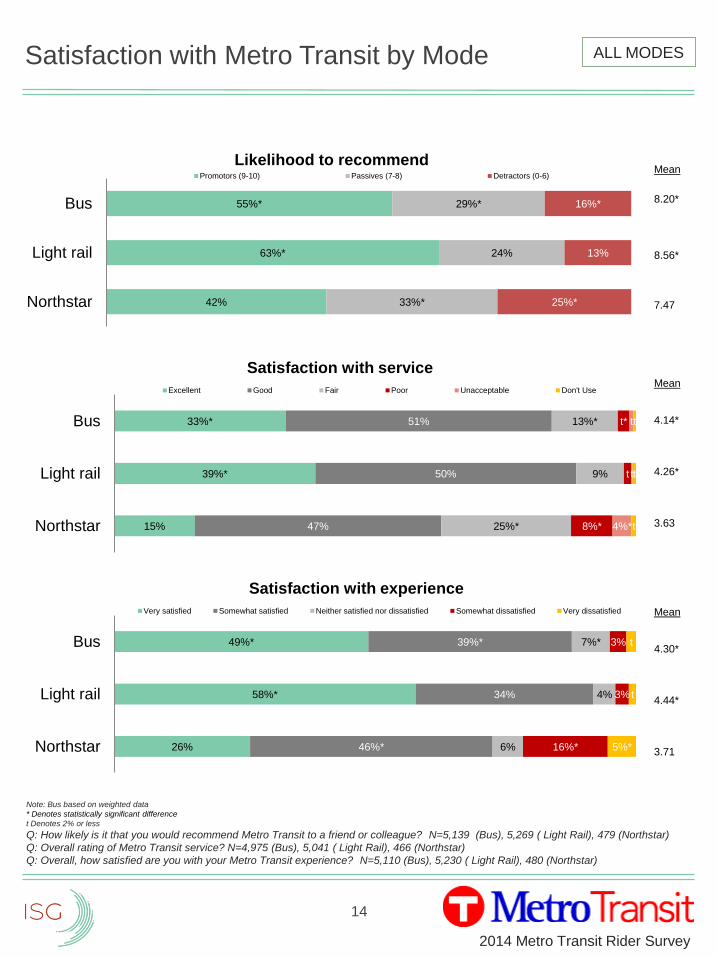
Mean
8.20*
8.56*
7.47
Satisfaction with Metro Transit by Mode
42%
63%*
55%*
33%*
24%
29%*
25%*
13%
16%*
Northstar
Light rail
Bus
Likelihood to recommendPromotors (9-10) Passives (7-8) Detractors (0-6)
Note: Bus based on weighted data
* Denotes statistically significant difference
t Denotes 2% or less
Q: How likely is it that you would recommend Metro Transit to a friend or colleague? N=5,139 (Bus), 5,269 ( Light Rail), 479 (Northstar)
Q: Overall rating of Metro Transit service? N=4,975 (Bus), 5,041 ( Light Rail), 466 (Northstar)
Q: Overall, how satisfied are you with your Metro Transit experience? N=5,110 (Bus), 5,230 ( Light Rail), 480 (Northstar)
ALL MODES
15%
39%*
33%*
47%
50%
51%
25%*
9%
13%*
8%*
t
t*
4%*
t
t
t
t
t
Northstar
Light rail
Bus
Satisfaction with service
Excellent Good Fair Poor Unacceptable Don't UseMean
4.14*
4.26*
3.63
26%
58%*
49%*
46%*
34%
39%*
6%
4%
7%*
16%*
3%
3%
5%*
t
t
Northstar
Light rail
Bus
Satisfaction with experience
Very satisfied Somewhat satisfied Neither satisfied nor dissatisfied Somewhat dissatisfied Very dissatisfied Mean
4.30*
4.44*
3.71
15
2014 Metro Transit Rider Survey
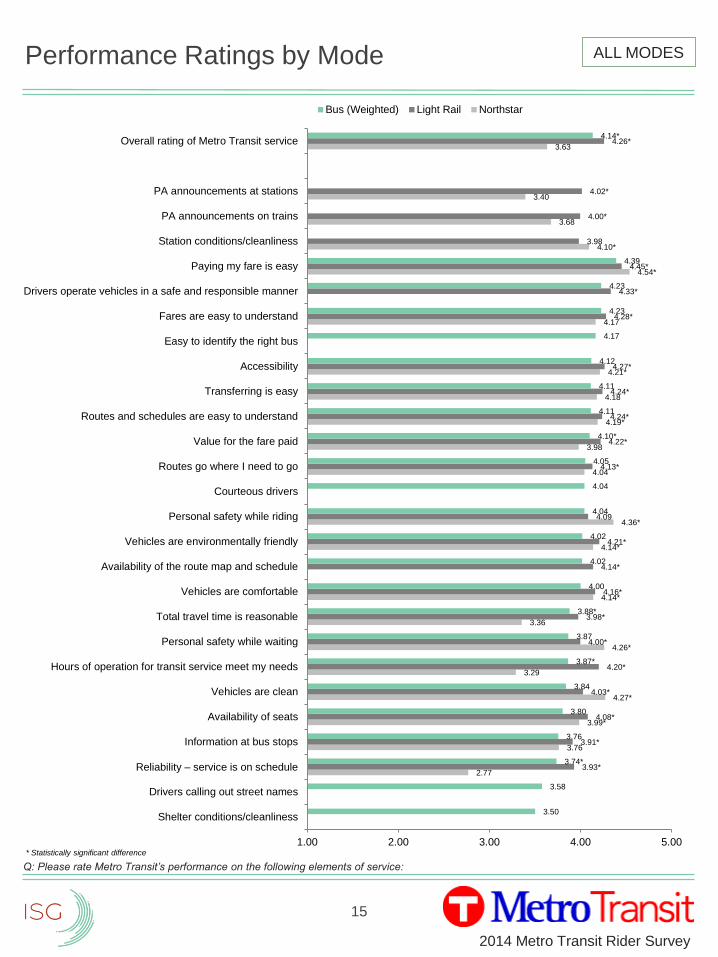
Performance Ratings by Mode
2.77
3.76
3.99*
4.27*
3.29
4.26*
3.36
4.14*
4.14*
4.36*
4.04
3.98
4.19*
4.18
4.21*
4.17
4.54*
4.10*
3.68
3.40
3.63
3.93*
3.91*
4.08*
4.03*
4.20*
4.00*
3.98*
4.16*
4.14*
4.21*
4.09
4.13*
4.22*
4.24*
4.24*
4.27*
4.28*
4.33*
4.45*
3.98
4.00*
4.02*
4.26*
3.50
3.58
3.74*
3.76
3.80
3.84
3.87*
3.87
3.88*
4.00
4.02
4.02
4.04
4.04
4.05
4.10*
4.11
4.11
4.12
4.17
4.23
4.23
4.39
4.14*
1.00 2.00 3.00 4.00 5.00
Shelter conditions/cleanliness
Drivers calling out street names
Reliability – service is on schedule
Information at bus stops
Availability of seats
Vehicles are clean
Hours of operation for transit service meet my needs
Personal safety while waiting
Total travel time is reasonable
Vehicles are comfortable
Availability of the route map and schedule
Vehicles are environmentally friendly
Personal safety while riding
Courteous drivers
Routes go where I need to go
Value for the fare paid
Routes and schedules are easy to understand
Transferring is easy
Accessibility
Easy to identify the right bus
Fares are easy to understand
Drivers operate vehicles in a safe and responsible manner
Paying my fare is easy
Station conditions/cleanliness
PA announcements on trains
PA announcements at stations
Overall rating of Metro Transit service
Bus (Weighted) Light Rail Northstar
ALL MODES
* Statistically significant difference
Q: Please rate Metro Transit’s performance on the following elements of service:
16
2014 Metro Transit Rider Survey
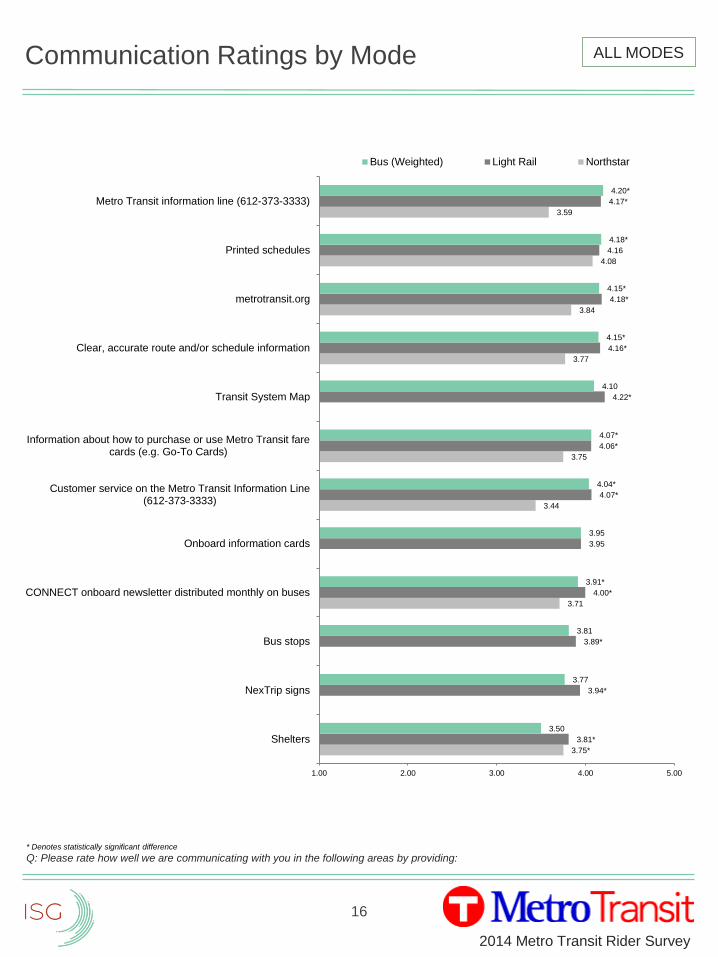
Communication Ratings by Mode
3.75*
3.71
3.44
3.75
3.77
3.84
4.08
3.59
3.81*
3.94*
3.89*
4.00*
3.95
4.07*
4.06*
4.22*
4.16*
4.18*
4.16
4.17*
3.50
3.77
3.81
3.91*
3.95
4.04*
4.07*
4.10
4.15*
4.15*
4.18*
4.20*
1.00 2.00 3.00 4.00 5.00
Shelters
NexTrip signs
Bus stops
CONNECT onboard newsletter distributed monthly on buses
Onboard information cards
Customer service on the Metro Transit Information Line(612-373-3333)
Information about how to purchase or use Metro Transit farecards (e.g. Go-To Cards)
Transit System Map
Clear, accurate route and/or schedule information
metrotransit.org
Printed schedules
Metro Transit information line (612-373-3333)
Bus (Weighted) Light Rail Northstar
ALL MODES
* Denotes statistically significant difference
Q: Please rate how well we are communicating with you in the following areas by providing:
17
2014 Metro Transit Rider Survey
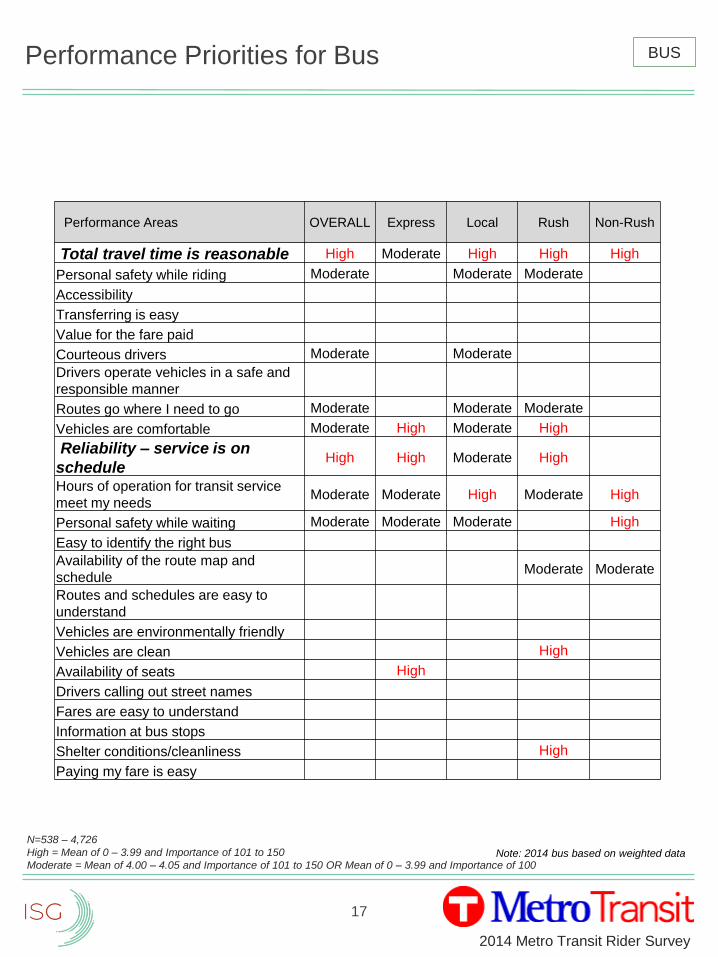
Performance Priorities for Bus
N=538 – 4,726
High = Mean of 0 – 3.99 and Importance of 101 to 150
Moderate = Mean of 4.00 – 4.05 and Importance of 101 to 150 OR Mean of 0 – 3.99 and Importance of 100
Performance Areas OVERALL Express Local Rush Non-Rush
Total travel time is reasonable High Moderate High High High
Personal safety while riding Moderate Moderate Moderate
Accessibility
Transferring is easy
Value for the fare paid
Courteous drivers Moderate Moderate
Drivers operate vehicles in a safe and
responsible manner
Routes go where I need to go Moderate Moderate Moderate
Vehicles are comfortable Moderate High Moderate High
Reliability – service is on
scheduleHigh High Moderate High
Hours of operation for transit service
meet my needsModerate Moderate High Moderate High
Personal safety while waiting Moderate Moderate Moderate High
Easy to identify the right bus
Availability of the route map and
scheduleModerate Moderate
Routes and schedules are easy to
understand
Vehicles are environmentally friendly
Vehicles are clean High
Availability of seats High
Drivers calling out street names
Fares are easy to understand
Information at bus stops
Shelter conditions/cleanliness High
Paying my fare is easy
BUS
Note: 2014 bus based on weighted data
18
2014 Metro Transit Rider Survey
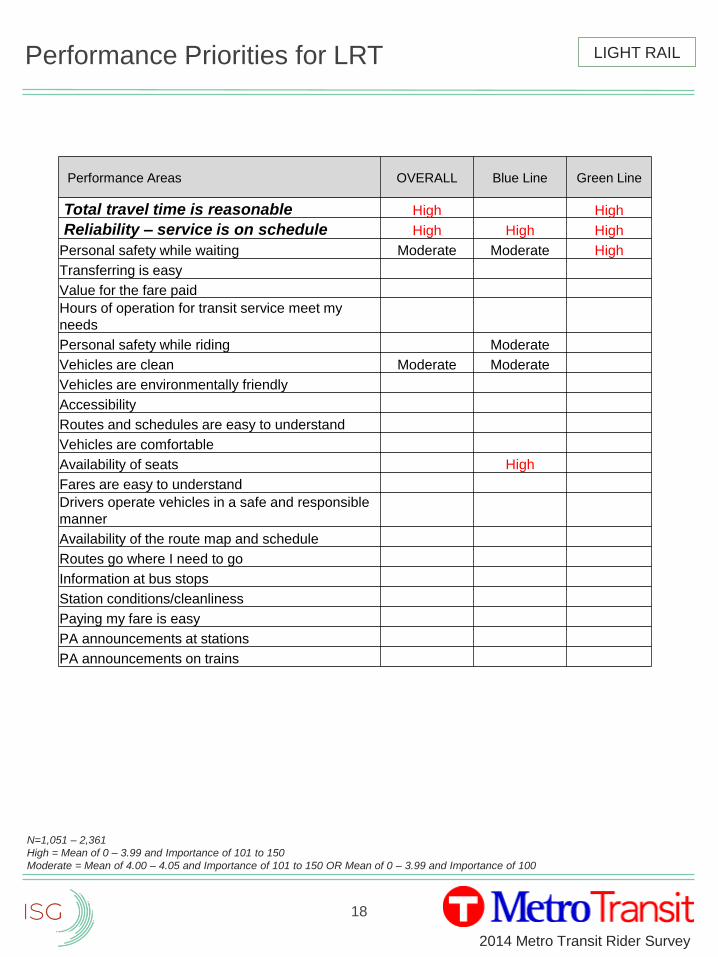
Performance Priorities for LRT
N=1,051 – 2,361
High = Mean of 0 – 3.99 and Importance of 101 to 150
Moderate = Mean of 4.00 – 4.05 and Importance of 101 to 150 OR Mean of 0 – 3.99 and Importance of 100
Performance Areas OVERALL Blue Line Green Line
Total travel time is reasonable High High
Reliability – service is on schedule High High High
Personal safety while waiting Moderate Moderate High
Transferring is easy
Value for the fare paid
Hours of operation for transit service meet my
needs
Personal safety while riding Moderate
Vehicles are clean Moderate Moderate
Vehicles are environmentally friendly
Accessibility
Routes and schedules are easy to understand
Vehicles are comfortable
Availability of seats High
Fares are easy to understand
Drivers operate vehicles in a safe and responsible
manner
Availability of the route map and schedule
Routes go where I need to go
Information at bus stops
Station conditions/cleanliness
Paying my fare is easy
PA announcements at stations
PA announcements on trains
LIGHT RAIL
19
2014 Metro Transit Rider Survey
Performance Priorities for Northstar
N=461-476
High = Mean of 0 – 3.99 and Importance of 101 to 150
Moderate = Mean of 4.00 – 4.05 and Importance of 101 to 150 OR Mean of 0 – 3.99 and Importance of 100
Performance Areas OVERALL
Total travel time is reasonable High
Reliability – service is on schedule High
Value for the fare paid High
Information at stations High
Vehicles are comfortable
Availability of seats High
Vehicles are environmentally friendly
PA announcements on trains High
PA announcements at stations High
Hours of operation for transit service meet my needs High
Personal safety while riding
Vehicles are clean
Transferring is easy
Routes go where I need to go
Routes and schedules are easy to understand
Station conditions/cleanliness
Accessibility
Fares are easy to understand
Personal safety while waiting
Paying my fare is easy
NORTHSTAR
2014 Metro Transit Rider Survey
20
In-Depth Findings
2014 Metro Transit Rider Survey
21
Bus
22
2014 Metro Transit Rider Survey
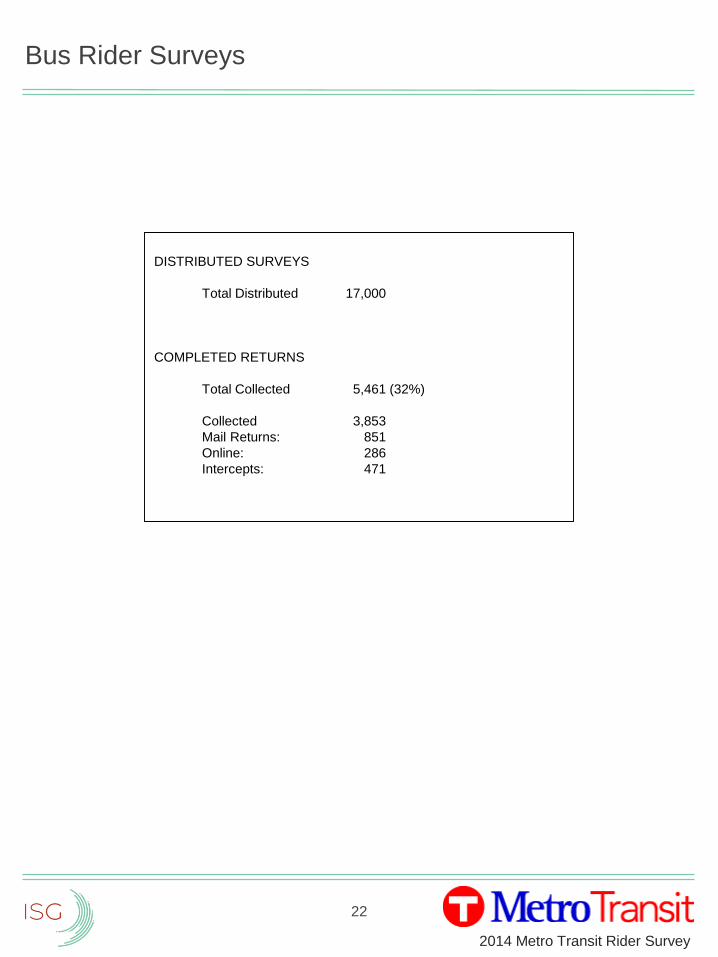
Bus Rider Surveys
DISTRIBUTED SURVEYS
Total Distributed 17,000
COMPLETED RETURNS
Total Collected 5,461 (32%)
Collected 3,853
Mail Returns: 851
Online: 286
Intercepts: 471
23
2014 Metro Transit Rider Survey
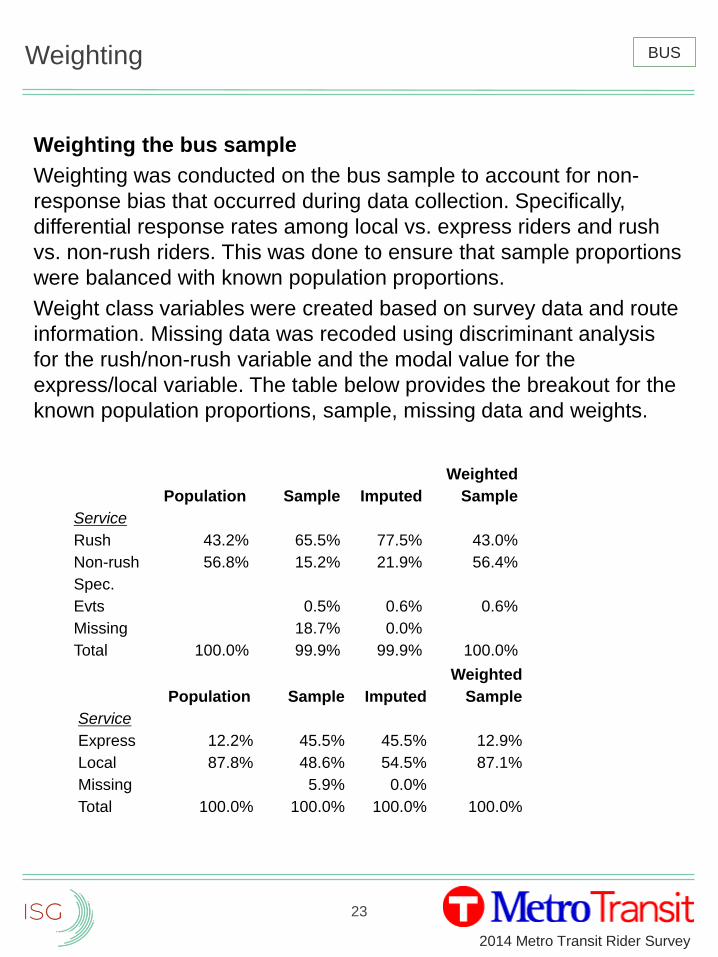
Weighting
Weighting the bus sample
Weighting was conducted on the bus sample to account for non-
response bias that occurred during data collection. Specifically,
differential response rates among local vs. express riders and rush
vs. non-rush riders. This was done to ensure that sample proportions
were balanced with known population proportions.
Weight class variables were created based on survey data and route
information. Missing data was recoded using discriminant analysis
for the rush/non-rush variable and the modal value for the
express/local variable. The table below provides the breakout for the
known population proportions, sample, missing data and weights.
Population Sample Imputed
Weighted
Sample
Service
Rush 43.2% 65.5% 77.5% 43.0%
Non-rush 56.8% 15.2% 21.9% 56.4%
Spec.
Evts 0.5% 0.6% 0.6%
Missing 18.7% 0.0%
Total 100.0% 99.9% 99.9% 100.0%
BUS
Population Sample Imputed
Weighted
Sample
Service
Express 12.2% 45.5% 45.5% 12.9%
Local 87.8% 48.6% 54.5% 87.1%
Missing 5.9% 0.0%
Total 100.0% 100.0% 100.0% 100.0%

24
2014 Metro Transit Rider Survey
Bus Rider Snapshot
4%
12%
19%
15%
24%
24%
1%
6%*
13%
17%*
14%
25%
21%
4%
65 or Over
55-64
45-54
35-44
25-34
18-24
Under 18
Age
6%
2%
6%
3%
6%
30%
52%
8%
3%
5%*
3%
6%
30%
54%
Hispanic/Latino
Other
Mixed Race
American Indian
Asian
African American
Caucasian
Race
20
%*
12
% 15
%*
13
%
13
%
12
%
6%
6%
3%
26
%
11
% 13
%
13
%
12
%
11
%
6%
5%
3%
<10 10-14 15-24 25-34 35-49 50-74 75-99 100-149 150+
Thousands ($)
Household Income 2014
2012
Demographics• Top zip code origins: 55407,
55404, 55106, 55411
• Top zip code destinations:
55402, 55404, 55101, 55403
• Half of riders are under 35 and
65+ is increasing
• Nearly half of riders are non-
white.
• Annual HH income has
remained stable since 2012
apart from a drop for those
making less than $10K
• 52% female
Note: Bus data are weighted
* Statistically significant difference 2014 to 2012
RIDERSHIP• Majority (54)% ride on both
weekdays and weekends.
• Nearly three-quarters ride at least
five times a week (74%).
• Work is the primary trip purpose
(56%), followed by
shopping/errands (21%) and
school (17%).
• 52% have no working
automobiles available for use.
• The demographic and attitudinal
profile of local riders is
significantly different than that of
express riders.
INFLUENCES• 29% report their employer or an
organization they are involved with
offer transit passes, and of those,
57% cover part of the cost.
• Friends, family and coworkers
(33%), school (19%), new
home/work location (17%) and
unreliable personal transportation
(17%) are the top influences to first
try transit.
PREFERENCES• For 45%, living or working close to
transit is the main reason for using
transit, followed by saving money
on parking (38%).
• 46% use metrotransit.org as their
most popular source for transit
information with the primary
features being route/schedule
pages and Trip Planner.
• 78% use Go-To technology to pay
their fare.
METRO TRANSIT RATINGS
High Correlation, High Performance• Accessibility
• Transferring is easy
• Value for the fare paid
• Drivers operate vehicles in a safe
and responsible manner
High Correlation, Lower Performance• Total travel time is reasonable
• Reliability – service is on schedule
• In addition, personal safety while
riding, courteous drivers, routes go
where I need to go, vehicles are
comfortable, hours of operation
meet my needs and personal safety
while waiting warrant attention.
25
2014 Metro Transit Rider Survey
Bus Rider Snapshot – Express/Local
6%
12%
15%
13%
26%
24%
4%
2%
19%
24%
19%
25%
9%
2%
6%
13%
17%
14%
25%
21%
4%
65 or Over
55-64
45-54
35-44
25-34
18-24
Under 18
Age
8%
3%
3%
5%
5%
33%
50%
3%
2%
1%
3%
6%
8%
80%
8%
3%
3%
5%
6%
30%
54%
Hispanic or Latino
Other
American Indian
Mixed Race
Asian
African American
CaucasianRace
20
%
12
% 15
%
13
%
13
%
12
%
6%
6%
3%
3%
2% 4
% 6%
13
%
20
%
18
%
23
%
11
%
23
%
13
% 16
%
15
%
13
%
11
%
4%
3%
2%
<10 10-14 15-24 25-34 35-49 50-74 75-99 100-149 150+
Thousands ($)
Household Income Total Express Local
SATISFACTIONOverall satisfaction is high among all
bus riders, however, express riders
report significantly higher scores
than local riders on the following
measures:
• Overall rating of Metro Transit
service,
• Overall satisfaction with Metro
Transit experience, and,
• Likelihood to recommend Metro
Transit to a friend or colleague.
COMMUNICATIONS• Across communication ratings,
express riders report significantly
higher ratings for printed schedules,
clear route information,
metrotransit.org, bus stops and
shelters.
• Local riders report significantly higher
ratings for the Metro Transit
information line and customer service
on the Metro Transit information line.
PERFORMANCE• Across performance ratings,
express riders report significantly
higher ratings for over half of the
twenty-four performance measures
evaluated.
• Local riders report a significantly
higher rating for hours of operation
meeting my transit service my
needs.
Demographics• Over one-quarter of local riders
are under 25 years of age
compared to approximately one-
ninth of express riders
• Half of local riders are non-white
compared to one-fifth of express
riders
• Over half of local riders have an
annual HH income under
$25,000
• Female: 59% express / 51% local
IMPORTANCE/PERFORMANCE
Express Priorities• Reliability – service is on schedule
• Availability of seats
• Vehicles are comfortable
• In addition, total travel time is
reasonable and hours of operation
meet my needs warrant attention.
Local Priorities• Total travel time is reasonable
• Hours of operation for transit service
meet my needs
• In addition, personal safety while
riding, courteous drivers, routes go
where I need to go, vehicles are
comfortable, reliability- service is on
schedule and personal safety while
waiting warrant attention.
BUS
Note: Bus data are weighted
26
2014 Metro Transit Rider Survey
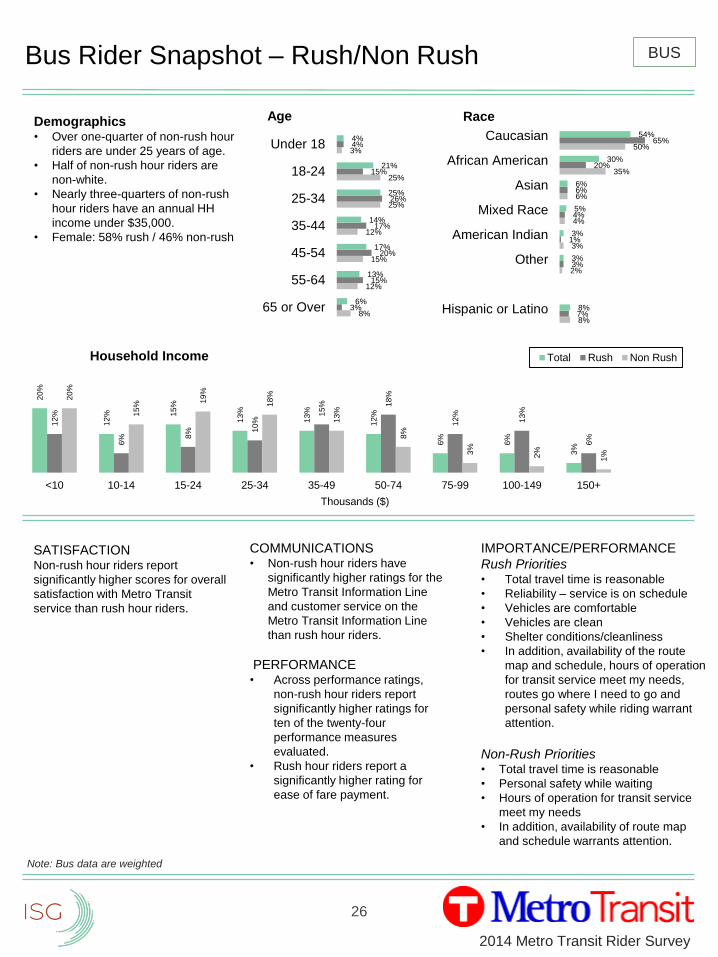
Bus Rider Snapshot – Rush/Non Rush
8%
12%
15%
12%
25%
25%
3%
3%
15%
20%
17%
26%
15%
4%
6%
13%
17%
14%
25%
21%
4%
65 or Over
55-64
45-54
35-44
25-34
18-24
Under 18
Age
8%
2%
3%
4%
6%
35%
50%
7%
3%
1%
4%
6%
20%
65%
8%
3%
3%
5%
6%
30%
54%
Hispanic or Latino
Other
American Indian
Mixed Race
Asian
African American
Caucasian
Race
20
%
12
% 15
%
13
%
13
%
12
%
6%
6%
3%
12
%
6% 8
% 10
%
15
% 18
%
12
%
13
%
6%
20
%
15
%
19
%
18
%
13
%
8%
3%
2%
1%
<10 10-14 15-24 25-34 35-49 50-74 75-99 100-149 150+
Thousands ($)
Household Income Total Rush Non Rush
Demographics• Over one-quarter of non-rush hour
riders are under 25 years of age.
• Half of non-rush hour riders are
non-white.
• Nearly three-quarters of non-rush
hour riders have an annual HH
income under $35,000.
• Female: 58% rush / 46% non-rush
SATISFACTIONNon-rush hour riders report
significantly higher scores for overall
satisfaction with Metro Transit
service than rush hour riders.
COMMUNICATIONS• Non-rush hour riders have
significantly higher ratings for the
Metro Transit Information Line
and customer service on the
Metro Transit Information Line
than rush hour riders.
PERFORMANCE• Across performance ratings,
non-rush hour riders report
significantly higher ratings for
ten of the twenty-four
performance measures
evaluated.
• Rush hour riders report a
significantly higher rating for
ease of fare payment.
BUS
Note: Bus data are weighted
IMPORTANCE/PERFORMANCE
Rush Priorities• Total travel time is reasonable
• Reliability – service is on schedule
• Vehicles are comfortable
• Vehicles are clean
• Shelter conditions/cleanliness
• In addition, availability of the route
map and schedule, hours of operation
for transit service meet my needs,
routes go where I need to go and
personal safety while riding warrant
attention.
Non-Rush Priorities• Total travel time is reasonable
• Personal safety while waiting
• Hours of operation for transit service
meet my needs
• In addition, availability of route map
and schedule warrants attention.
27
2014 Metro Transit Rider Survey
Demographics
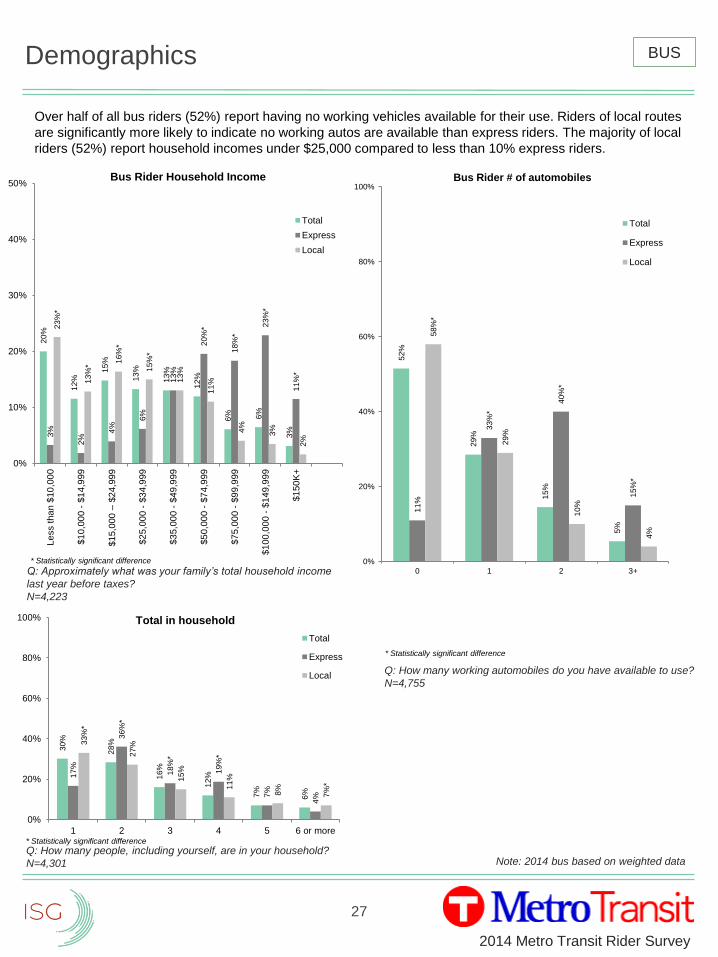
Over half of all bus riders (52%) report having no working vehicles available for their use. Riders of local routes
are significantly more likely to indicate no working autos are available than express riders. The majority of local
riders (52%) report household incomes under $25,000 compared to less than 10% express riders.
Q: Approximately what was your family’s total household income
last year before taxes?
N=4,223
Q: How many working automobiles do you have available to use?
N=4,755
20
%
12
%
15
%
13
%
13
%
12
%
6% 6%
3%3%
2%
4%
6%
13
%
20
%*
18
%*
23
%*
11
%*
23
%*
13
%*
16
%*
15
%*
13
%
11
%
4%
3%
2%
0%
10%
20%
30%
40%
50%
Le
ss t
ha
n $
10
,00
0
$1
0,0
00 -
$1
4,9
99
$15,0
00 –
$24,9
99
$2
5,0
00 -
$3
4,9
99
$3
5,0
00 -
$4
9,9
99
$5
0,0
00 -
$7
4,9
99
$7
5,0
00 -
$9
9,9
99
$1
00
,000 -
$14
9,9
99
$1
50
K+
Bus Rider Household Income
Total
Express
Local
52
%
29
%
15
%
5%
11
%
33
%*
40
%*
15
%*
58
%*
29
%
10
%
4%
0%
20%
40%
60%
80%
100%
0 1 2 3+
Bus Rider # of automobiles
Total
Express
Local
30
%
28
%
16
%
12
%
7%
6%
17
%
36
%*
18
%*
19
%*
7%
4%
33
%*
27
%
15
%
11
%
8%
7%
*
0%
20%
40%
60%
80%
100%
1 2 3 4 5 6 or more
Total in household
Total
Express
Local
Q: How many people, including yourself, are in your household?
N=4,301
* Statistically significant difference
* Statistically significant difference
* Statistically significant difference
BUS
Note: 2014 bus based on weighted data
28
2014 Metro Transit Rider Survey
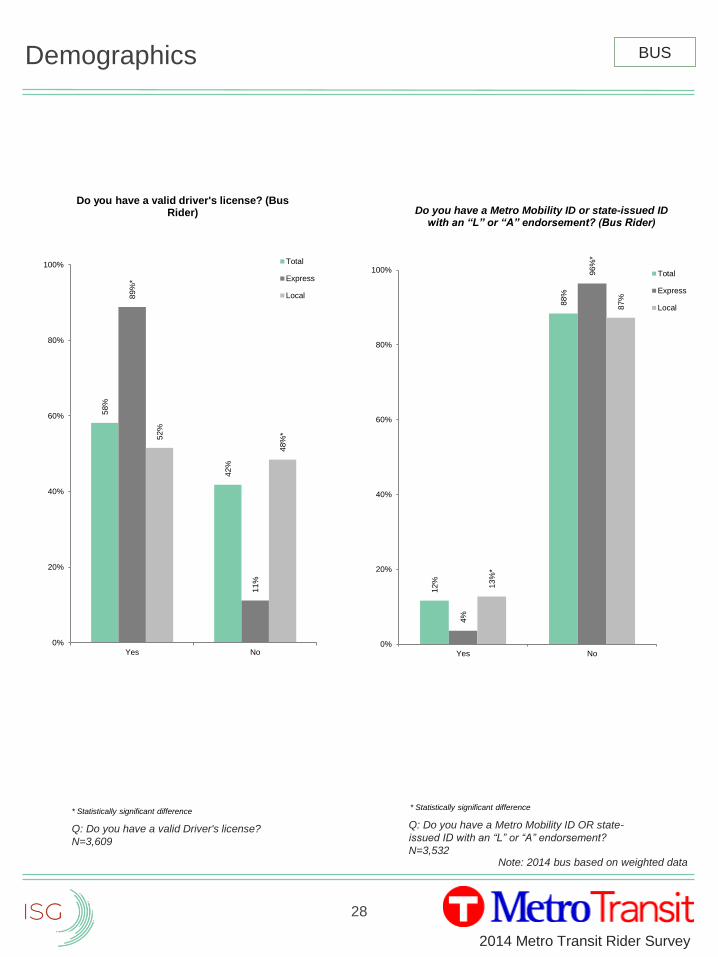
Demographics BUS
Q: Do you have a valid Driver's license?
N=3,609
Q: Do you have a Metro Mobility ID OR state-
issued ID with an “L” or “A” endorsement?
N=3,532
58
%
42
%
89
%*
11
%
52
%
48
%*
0%
20%
40%
60%
80%
100%
Yes No
Do you have a valid driver's license? (Bus Rider)
Total
Express
Local
12
%
88
%
4%
96
%*
13
%*
87
%
0%
20%
40%
60%
80%
100%
Yes No
Do you have a Metro Mobility ID or state-issued ID with an “L” or “A” endorsement? (Bus Rider)
Total
Express
Local
* Statistically significant difference* Statistically significant difference
Note: 2014 bus based on weighted data
29
2014 Metro Transit Rider Survey
1%
1%
1%
1%
2%
2%
2%
2%
2%
2%
2%
2%
4%
4%
4%
5%
5%
6%
7%
8%
0% 5% 10%
Route 9
Route 11
Route 515
Route 2
Route 3
Route 4
Route 84
Route 17
Route 54
Route 14
Route 22
Route 63
Route 64
Route 68
Route 10
Route 18
Route 74
Route 21
Route 6
Route 5
Top bus routes
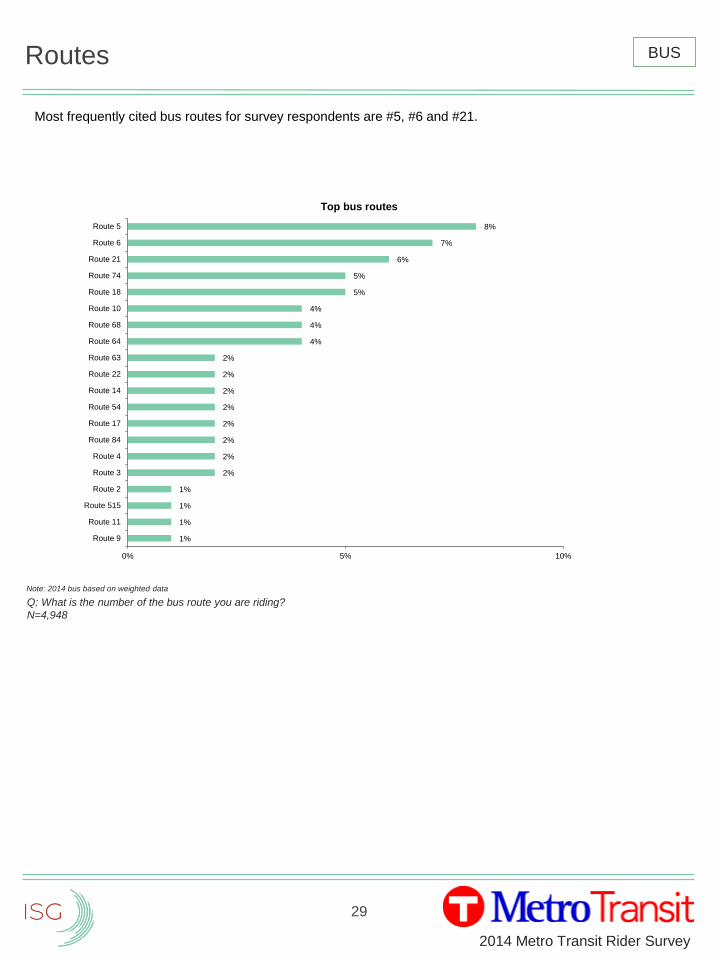
Routes
Q: What is the number of the bus route you are riding?
N=4,948
BUS
Note: 2014 bus based on weighted data
Most frequently cited bus routes for survey respondents are #5, #6 and #21.
30
2014 Metro Transit Rider Survey
31%*
13%*
29%
12%
8%*
4%*
2%*
2%*
4%
3%
71%*
12%
5%
2%
t
1%
27%
12%
35%
12%
7%
4%
1%
1%
0% 50% 100%
Seven
Six
Five
Four
Three
Two
One
Less than once perweek
How many days per week do you usually ride the bus?
Total
Express
Local
Usage
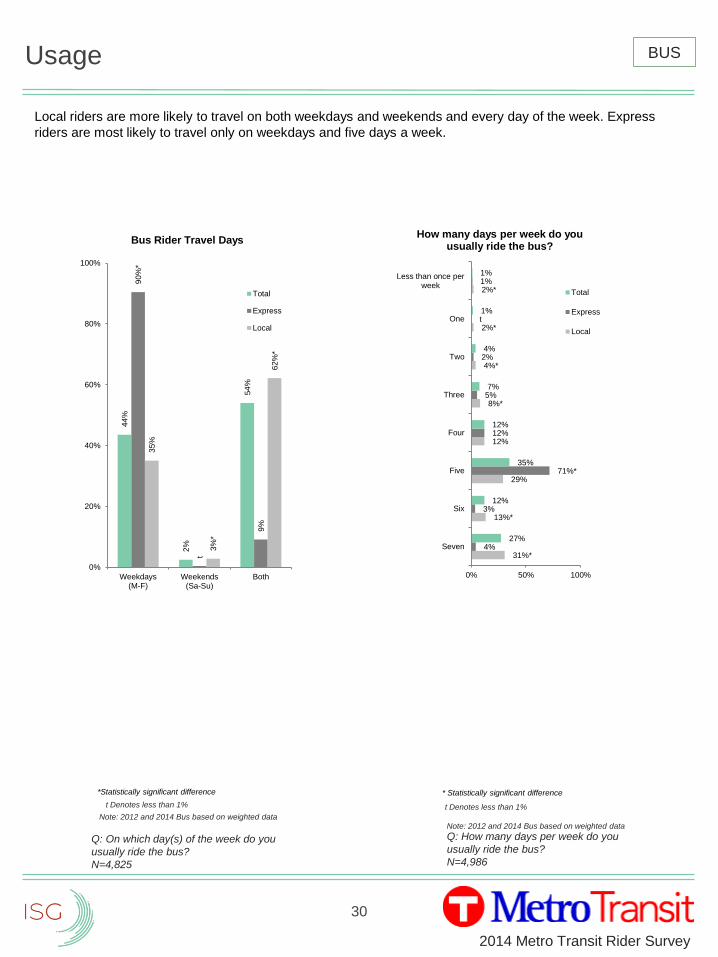
Local riders are more likely to travel on both weekdays and weekends and every day of the week. Express
riders are most likely to travel only on weekdays and five days a week.
Q: On which day(s) of the week do you
usually ride the bus?
N=4,825
Q: How many days per week do you
usually ride the bus?
N=4,986
44
%
2%
54
%
90
%*
t
9%
35
%
3%
*
62
%*
0%
20%
40%
60%
80%
100%
Weekdays(M-F)
Weekends(Sa-Su)
Both
Bus Rider Travel Days
Total
Express
Local
*Statistically significant difference * Statistically significant difference
BUS
t Denotes less than 1%t Denotes less than 1%
Note: 2012 and 2014 Bus based on weighted dataNote: 2012 and 2014 Bus based on weighted data
31
2014 Metro Transit Rider Survey
Ridership History
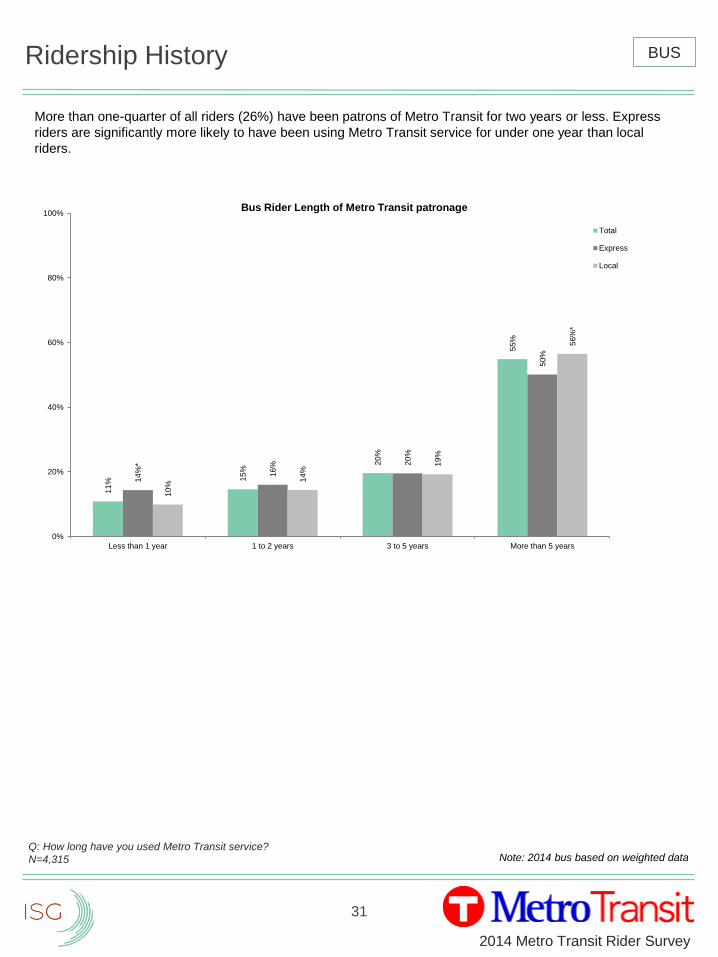
More than one-quarter of all riders (26%) have been patrons of Metro Transit for two years or less. Express
riders are significantly more likely to have been using Metro Transit service for under one year than local
riders.
Q: How long have you used Metro Transit service?
N=4,315
11
% 15
%
20
%
55
%
14
%*
16
% 20
%
50
%
10
%
14
%
19
%
56
%*
0%
20%
40%
60%
80%
100%
Less than 1 year 1 to 2 years 3 to 5 years More than 5 years
Bus Rider Length of Metro Transit patronage
Total
Express
Local
BUS
Note: 2014 bus based on weighted data
32
2014 Metro Transit Rider Survey
Fares
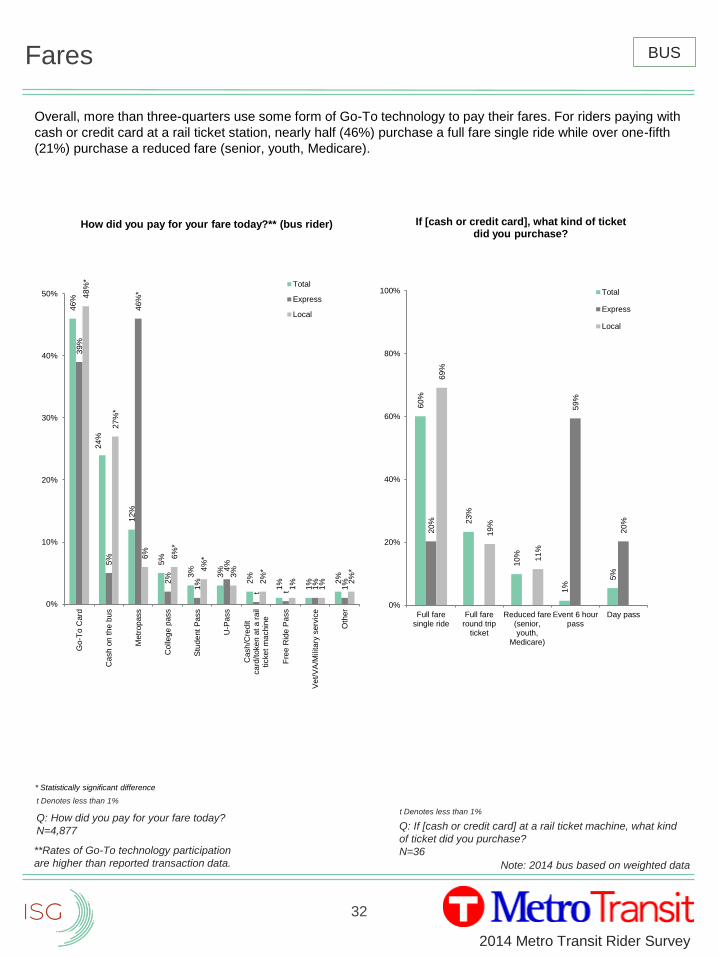
Overall, more than three-quarters use some form of Go-To technology to pay their fares. For riders paying with
cash or credit card at a rail ticket station, nearly half (46%) purchase a full fare single ride while over one-fifth
(21%) purchase a reduced fare (senior, youth, Medicare).
Q: How did you pay for your fare today?
N=4,877
46
%
24
%
12
%
5%
3%
3%
2%
1%
1% 2
%
39
%
5%
46
%*
2%
1%
4%
t t 1%
1%
48
%*
27
%*
6%
6%
*
4%
*
3%
2%
*
1%
1% 2
%*
0%
10%
20%
30%
40%
50%
Go
-To
Card
Cash
on
th
e b
us
Metr
op
ass
Colle
ge
pa
ss
Stu
de
nt
Pa
ss
U-P
ass
Cash
/Cre
dit
ca
rd/t
oke
n a
t a
ra
ilticke
t m
ach
ine
Fre
e R
ide
Pa
ss
Ve
t/V
A/M
ilita
ry s
erv
ice
Oth
er
How did you pay for your fare today?** (bus rider)
Total
Express
Local
BUS
Note: 2014 bus based on weighted data
**Rates of Go-To technology participation
are higher than reported transaction data.
60
%
23
%
10
%
1%
5%
20
%
59
%
20
%
69
%
19
%
11
%
0%
20%
40%
60%
80%
100%
Full faresingle ride
Full fareround trip
ticket
Reduced fare(senior,youth,
Medicare)
Event 6 hourpass
Day pass
If [cash or credit card], what kind of ticket did you purchase?
Total
Express
Local
t Denotes less than 1%
Q: If [cash or credit card] at a rail ticket machine, what kind
of ticket did you purchase?
N=36
t Denotes less than 1%
* Statistically significant difference
33
2014 Metro Transit Rider Survey
Fares
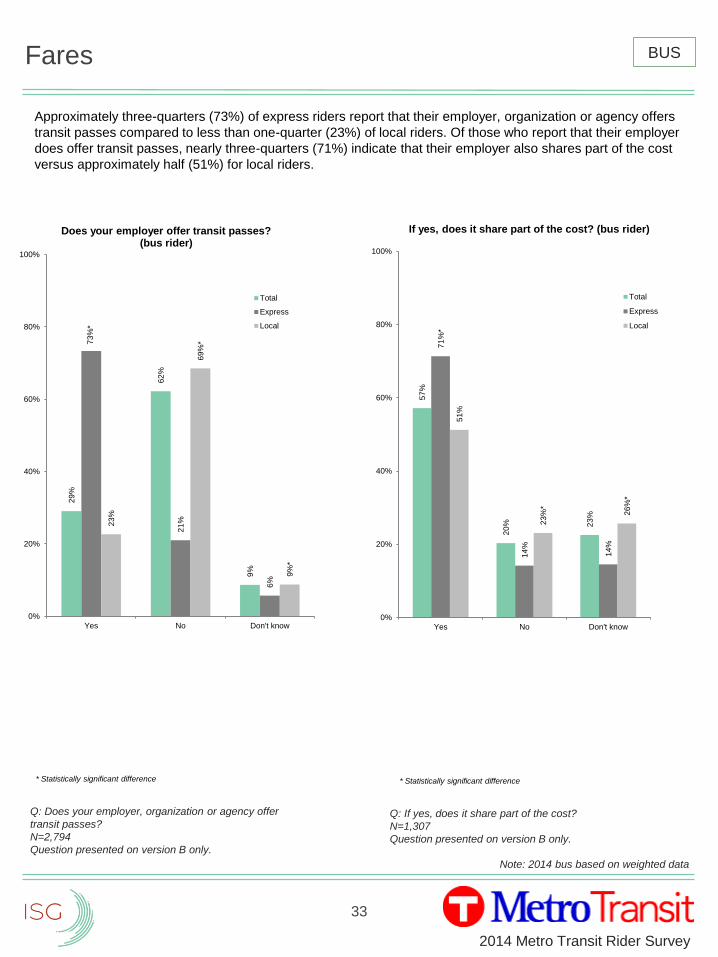
Approximately three-quarters (73%) of express riders report that their employer, organization or agency offers
transit passes compared to less than one-quarter (23%) of local riders. Of those who report that their employer
does offer transit passes, nearly three-quarters (71%) indicate that their employer also shares part of the cost
versus approximately half (51%) for local riders.
Q: Does your employer, organization or agency offer
transit passes?
N=2,794
Question presented on version B only.
Q: If yes, does it share part of the cost?
N=1,307
Question presented on version B only.
29
%
62
%
9%
73
%*
21
%
6%
23
%
69
%*
9%
*
0%
20%
40%
60%
80%
100%
Yes No Don't know
Does your employer offer transit passes? (bus rider)
Total
Express
Local
57
%
20
% 23
%
71
%*
14
%
14
%
51
%
23
%*
26
%*
0%
20%
40%
60%
80%
100%
Yes No Don't know
If yes, does it share part of the cost? (bus rider)
Total
Express
Local
* Statistically significant difference * Statistically significant difference
BUS
Note: 2014 bus based on weighted data
34
2014 Metro Transit Rider Survey
Primary Purpose for Use
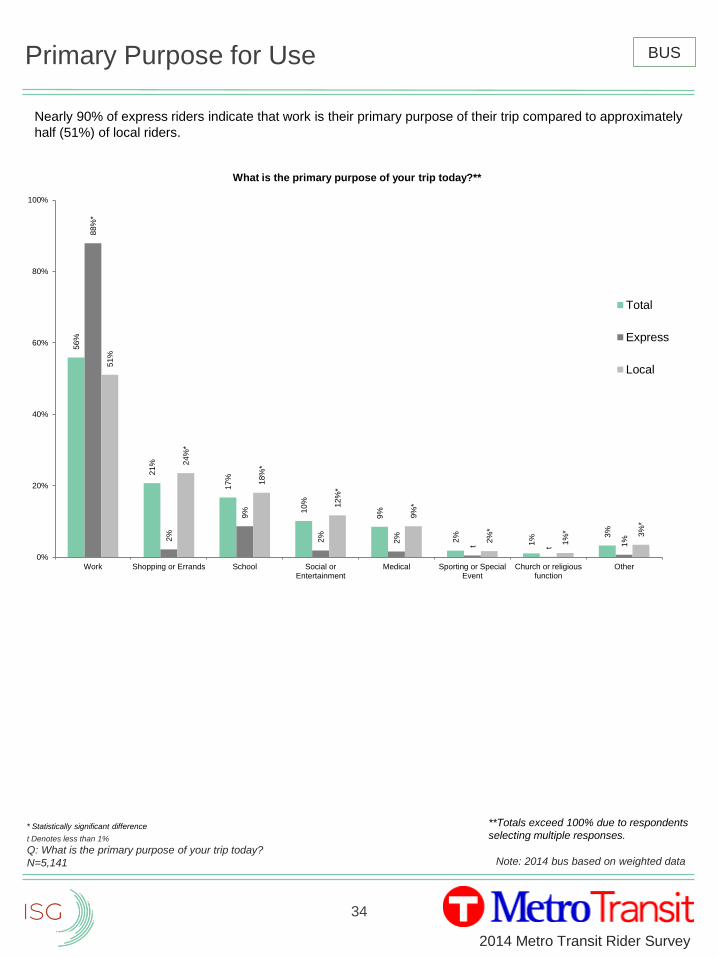
Nearly 90% of express riders indicate that work is their primary purpose of their trip compared to approximately
half (51%) of local riders.
t Denotes less than 1%
Q: What is the primary purpose of your trip today?
N=5,141
56
%
21
%
17
%
10
%
9%
2%
1% 3
%
88
%*
2%
9%
2%
2%
t t 1%
51
%
24
%*
18
%*
12
%*
9%
*
2%
*
1%
* 3%
*
0%
20%
40%
60%
80%
100%
Work Shopping or Errands School Social orEntertainment
Medical Sporting or SpecialEvent
Church or religiousfunction
Other
What is the primary purpose of your trip today?**
Total
Express
Local
* Statistically significant difference
BUS
Note: 2014 bus based on weighted data
**Totals exceed 100% due to respondents
selecting multiple responses.
35
2014 Metro Transit Rider Survey
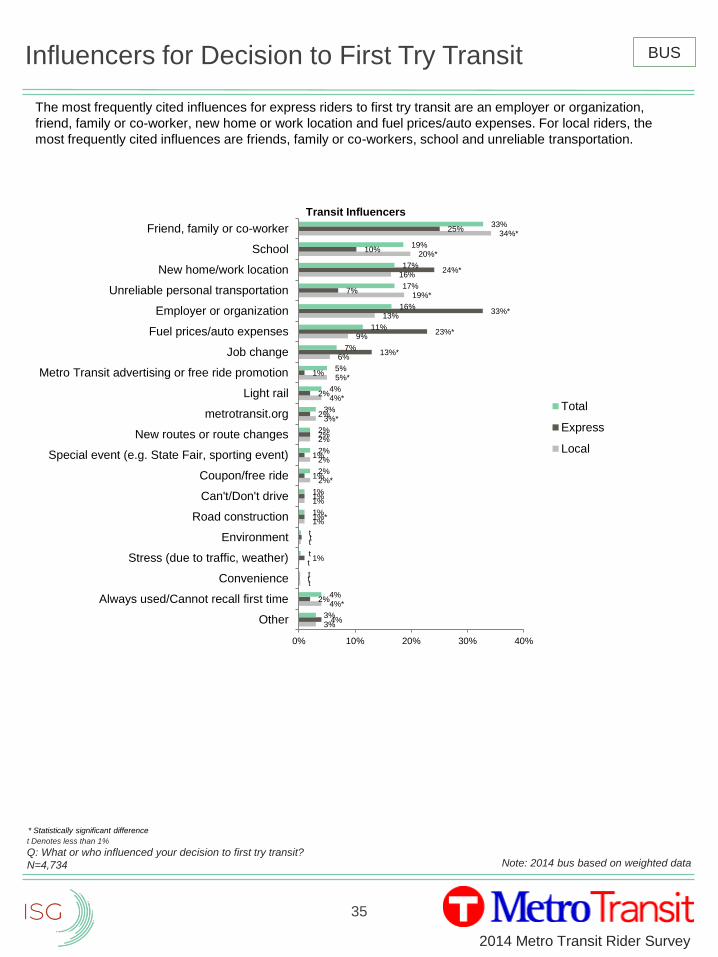
Influencers for Decision to First Try Transit
The most frequently cited influences for express riders to first try transit are an employer or organization,
friend, family or co-worker, new home or work location and fuel prices/auto expenses. For local riders, the
most frequently cited influences are friends, family or co-workers, school and unreliable transportation.
t Denotes less than 1%
Q: What or who influenced your decision to first try transit?
N=4,734
* Statistically significant difference
3%
4%*
t
t
t
1%
1%
2%*
2%
2%
3%*
4%*
5%*
6%
9%
13%
19%*
16%
20%*
34%*
4%
2%
t
1%
t
1%*
1%
1%
1%
2%
2%
2%
1%
13%*
23%*
33%*
7%
24%*
10%
25%
3%
4%
t
t
t
1%
1%
2%
2%
2%
3%
4%
5%
7%
11%
16%
17%
17%
19%
33%
0% 10% 20% 30% 40%
Other
Always used/Cannot recall first time
Convenience
Stress (due to traffic, weather)
Environment
Road construction
Can't/Don't drive
Coupon/free ride
Special event (e.g. State Fair, sporting event)
New routes or route changes
metrotransit.org
Light rail
Metro Transit advertising or free ride promotion
Job change
Fuel prices/auto expenses
Employer or organization
Unreliable personal transportation
New home/work location
School
Friend, family or co-worker
Transit Influencers
Total
Express
Local
BUS
Note: 2014 bus based on weighted data
36
2014 Metro Transit Rider Survey
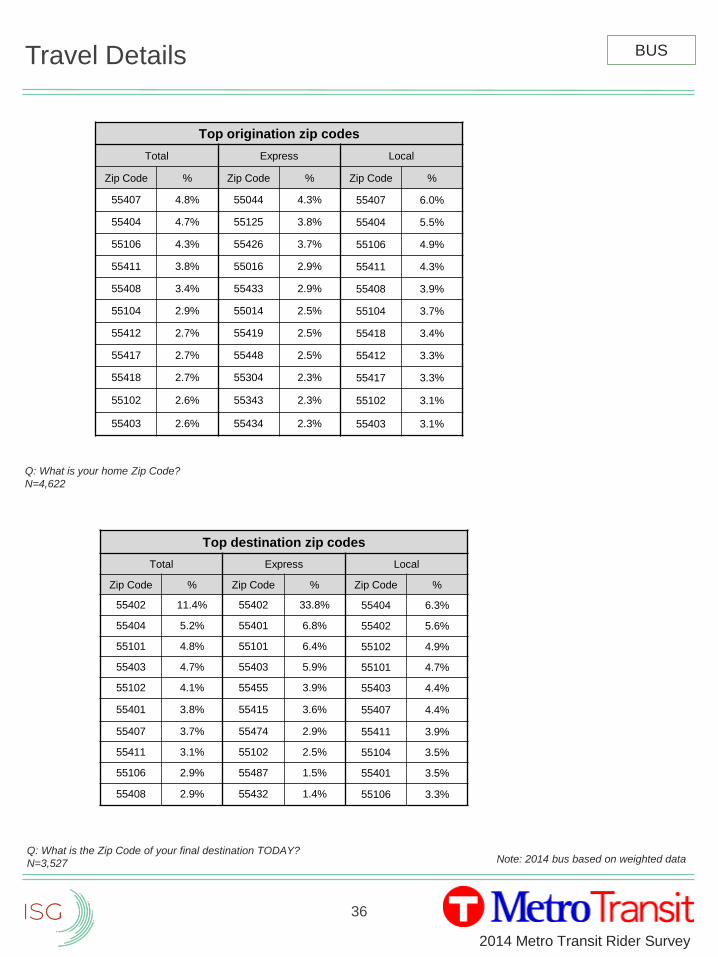
Travel Details
Q: What is your home Zip Code?
N=4,622
Q: What is the Zip Code of your final destination TODAY?
N=3,527
BUS
Top origination zip codes
Total Express Local
Zip Code % Zip Code % Zip Code %
55407 4.8% 55044 4.3% 55407 6.0%
55404 4.7% 55125 3.8% 55404 5.5%
55106 4.3% 55426 3.7% 55106 4.9%
55411 3.8% 55016 2.9% 55411 4.3%
55408 3.4% 55433 2.9% 55408 3.9%
55104 2.9% 55014 2.5% 55104 3.7%
55412 2.7% 55419 2.5% 55418 3.4%
55417 2.7% 55448 2.5% 55412 3.3%
55418 2.7% 55304 2.3% 55417 3.3%
55102 2.6% 55343 2.3% 55102 3.1%
55403 2.6% 55434 2.3% 55403 3.1%
Top destination zip codes
Total Express Local
Zip Code % Zip Code % Zip Code %
55402 11.4% 55402 33.8% 55404 6.3%
55404 5.2% 55401 6.8% 55402 5.6%
55101 4.8% 55101 6.4% 55102 4.9%
55403 4.7% 55403 5.9% 55101 4.7%
55102 4.1% 55455 3.9% 55403 4.4%
55401 3.8% 55415 3.6% 55407 4.4%
55407 3.7% 55474 2.9% 55411 3.9%
55411 3.1% 55102 2.5% 55104 3.5%
55106 2.9% 55487 1.5% 55401 3.5%
55408 2.9% 55432 1.4% 55106 3.3%
Note: 2014 bus based on weighted data
37
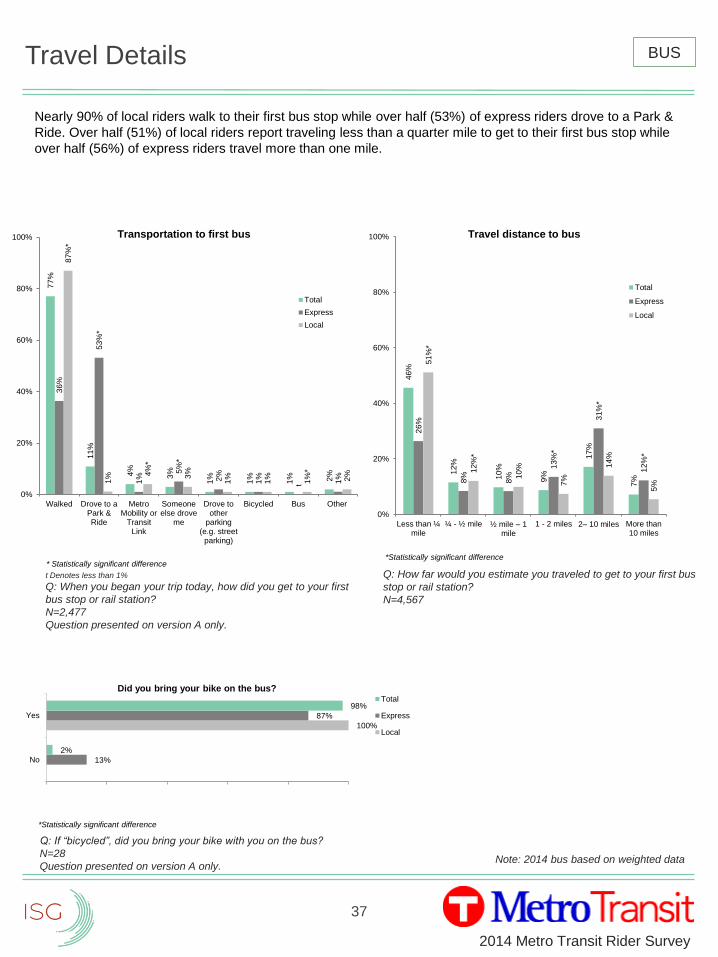
2014 Metro Transit Rider Survey
Travel Details
Nearly 90% of local riders walk to their first bus stop while over half (53%) of express riders drove to a Park &
Ride. Over half (51%) of local riders report traveling less than a quarter mile to get to their first bus stop while
over half (56%) of express riders travel more than one mile.
t Denotes less than 1%
Q: When you began your trip today, how did you get to your first
bus stop or rail station?
N=2,477
Question presented on version A only.
Q: How far would you estimate you traveled to get to your first bus
stop or rail station?
N=4,567
Q: If “bicycled”, did you bring your bike with you on the bus?
N=28
Question presented on version A only.
77
%
11
%
4%
3%
1%
1%
1% 2%
36
%
53
%*
1%
5%
*
2%
1%
t 1%
87
%*
1% 4
%*
3%
1%
1%
1%
*
2%
0%
20%
40%
60%
80%
100%
Walked Drove to aPark &Ride
MetroMobility or
TransitLink
Someoneelse drove
me
Drove toother
parking(e.g. street
parking)
Bicycled Bus Other
Transportation to first bus
Total
Express
Local
46
%
12
%
10
%
9%
17
%
7%
26
%
8%
8%
13
%*
31
%*
12
%*
51
%*
12
%*
10
%
7%
14
%
5%
0%
20%
40%
60%
80%
100%
Less than ¼mile
¼ - ½ mile ½ mile – 1 mile
1 - 2 miles 2– 10 miles More than10 miles
Travel distance to bus
Total
Express
Local
100%
13%
87%
2%
98%
No
Yes
Did you bring your bike on the bus?Total
Express
Local
* Statistically significant difference
*Statistically significant difference
*Statistically significant difference
BUS
Note: 2014 bus based on weighted data
38
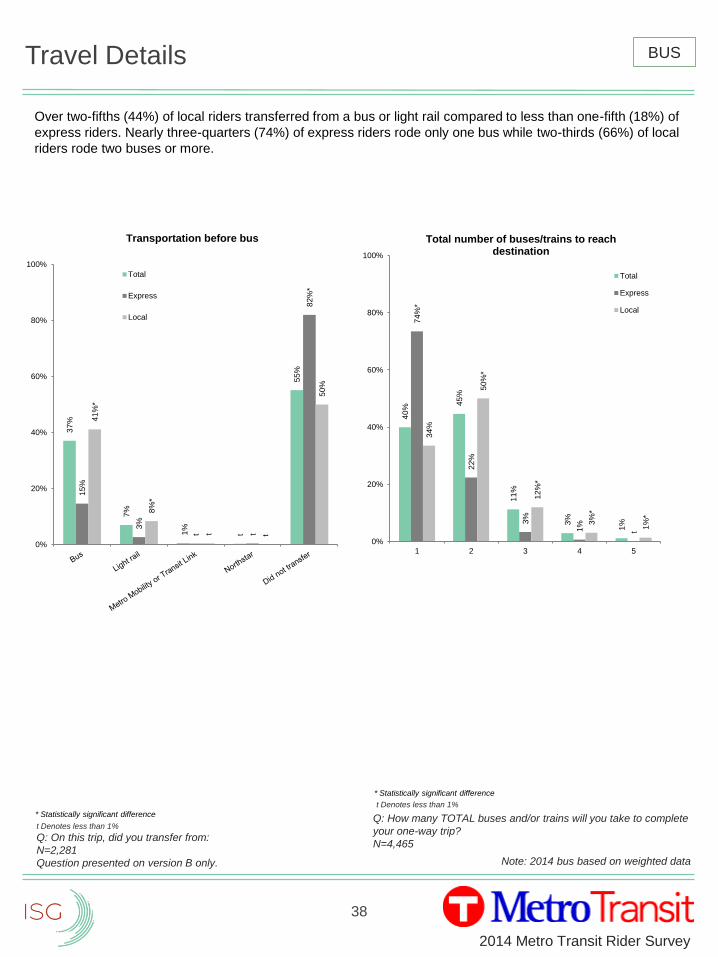
2014 Metro Transit Rider Survey
Travel Details
Over two-fifths (44%) of local riders transferred from a bus or light rail compared to less than one-fifth (18%) of
express riders. Nearly three-quarters (74%) of express riders rode only one bus while two-thirds (66%) of local
riders rode two buses or more.
Q: How many TOTAL buses and/or trains will you take to complete
your one-way trip?
N=4,465
t Denotes less than 1%
Q: On this trip, did you transfer from:
N=2,281
Question presented on version B only.
37
%
7%
1%
t
55
%
15
%
3%
t t
82
%*
41
%*
8%
*
t t
50
%
0%
20%
40%
60%
80%
100%
Transportation before bus
Total
Express
Local
40
%
45
%
11
%
3%
1%
74
%*
22
%
3%
1%
t
34
%
50
%*
12
%*
3%
*
1%
*
0%
20%
40%
60%
80%
100%
1 2 3 4 5
Total number of buses/trains to reach destination
Total
Express
Local
* Statistically significant difference
* Statistically significant difference
BUS
Note: 2014 bus based on weighted data
t Denotes less than 1%
39
2014 Metro Transit Rider Survey
Travel Details
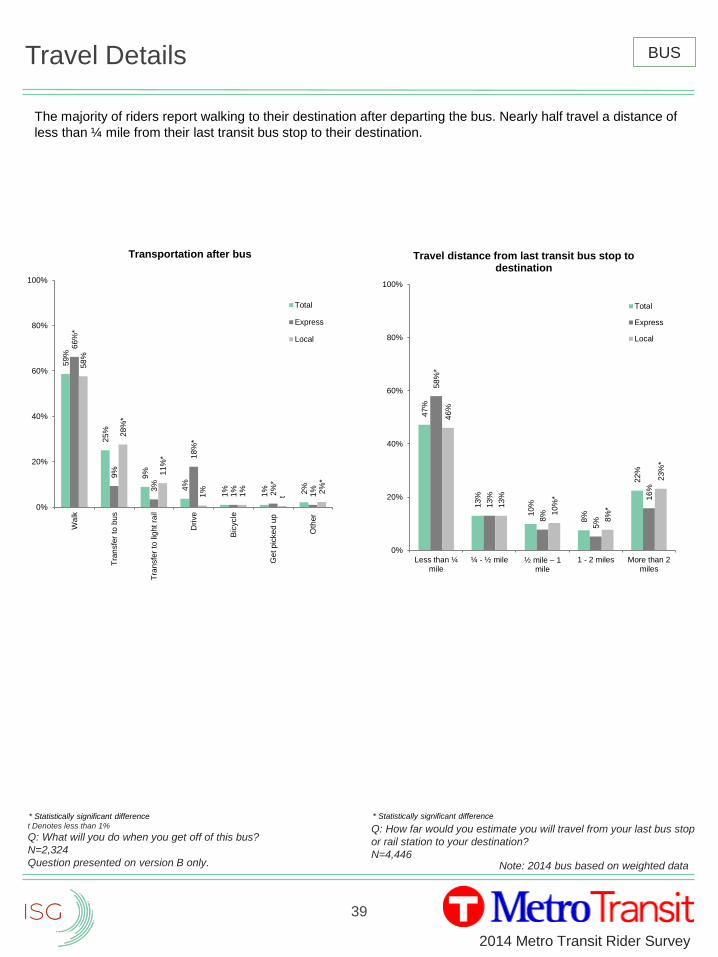
The majority of riders report walking to their destination after departing the bus. Nearly half travel a distance of
less than ¼ mile from their last transit bus stop to their destination.
Q: How far would you estimate you will travel from your last bus stop
or rail station to your destination?
N=4,446
t Denotes less than 1%
Q: What will you do when you get off of this bus?
N=2,324
Question presented on version B only.
59
%
25
%
9%
4%
1%
1% 2%
66
%*
9%
3%
18
%*
1% 2%
*
1%
58
%
28
%*
11
%*
1%
1%
t
2%
*
0%
20%
40%
60%
80%
100%
Wa
lk
Tra
nsfe
r to
bu
s
Tra
nsfe
r to
lig
ht
rail
Dri
ve
Bic
ycle
Ge
t p
icked
up
Oth
er
Transportation after bus
Total
Express
Local
47
%
13
%
10
%
8%
22
%
58
%*
13
%
8%
5%
16
%
46
%
13
%
10
%*
8%
*
23
%*
0%
20%
40%
60%
80%
100%
Less than ¼mile
¼ - ½ mile ½ mile – 1 mile
1 - 2 miles More than 2miles
Travel distance from last transit bus stop to destination
Total
Express
Local
* Statistically significant difference * Statistically significant difference
BUS
Note: 2014 bus based on weighted data
40
2014 Metro Transit Rider Survey
Travel Details
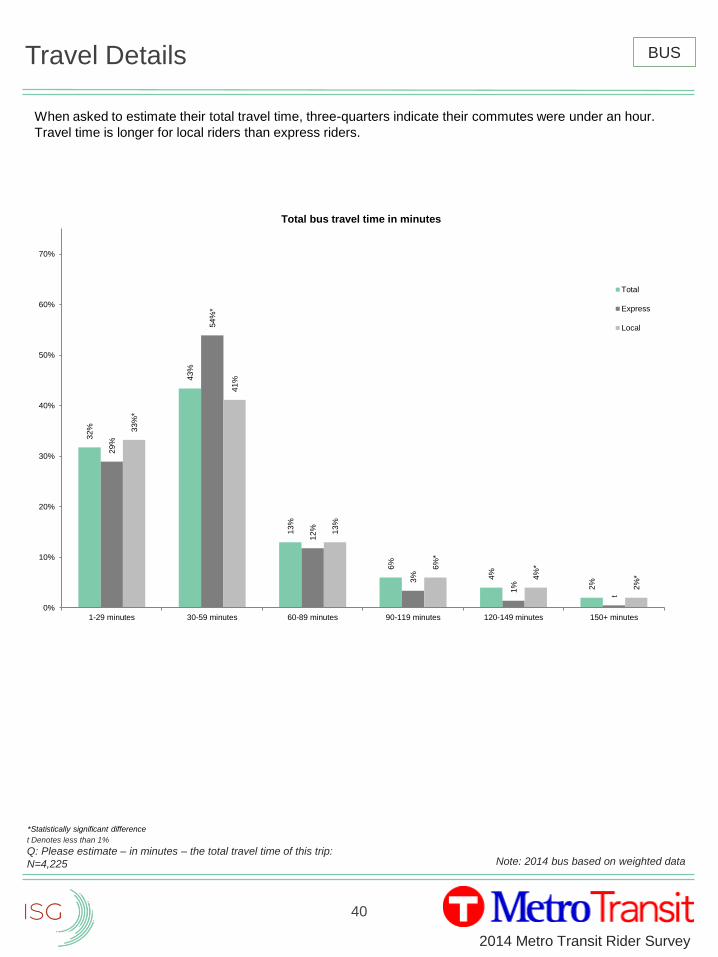
When asked to estimate their total travel time, three-quarters indicate their commutes were under an hour.
Travel time is longer for local riders than express riders.
t Denotes less than 1%
Q: Please estimate – in minutes – the total travel time of this trip:
N=4,225
32
%
43
%
13
%
6%
4%
2%
29
%
54
%*
12
%
3%
1%
t
33
%*
41
%
13
%
6%
*
4%
*
2%
*
0%
10%
20%
30%
40%
50%
60%
70%
1-29 minutes 30-59 minutes 60-89 minutes 90-119 minutes 120-149 minutes 150+ minutes
Total bus travel time in minutes
Total
Express
Local
*Statistically significant difference
BUS
Note: 2014 bus based on weighted data
41
2014 Metro Transit Rider Survey
Travel Details
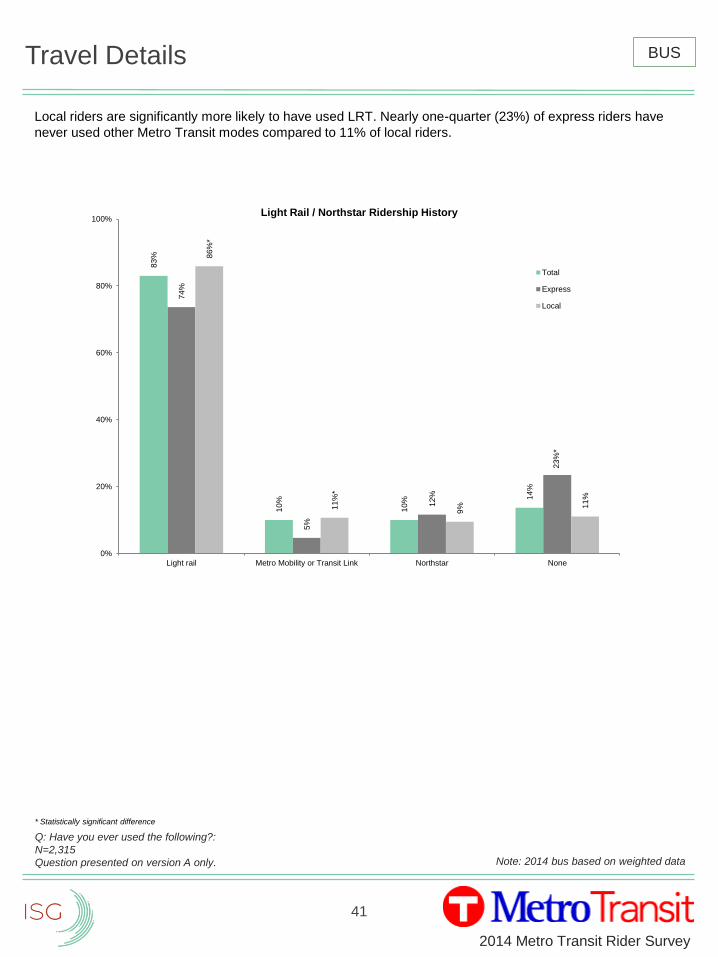
Local riders are significantly more likely to have used LRT. Nearly one-quarter (23%) of express riders have
never used other Metro Transit modes compared to 11% of local riders.
Q: Have you ever used the following?:
N=2,315
Question presented on version A only.
83
%
10
%
10
% 14
%
74
%
5%
12
%
23
%*
86
%*
11
%*
9% 1
1%
0%
20%
40%
60%
80%
100%
Light rail Metro Mobility or Transit Link Northstar None
Light Rail / Northstar Ridership History
Total
Express
Local
* Statistically significant difference
BUS
Note: 2014 bus based on weighted data
42
2014 Metro Transit Rider Survey
Travel Details
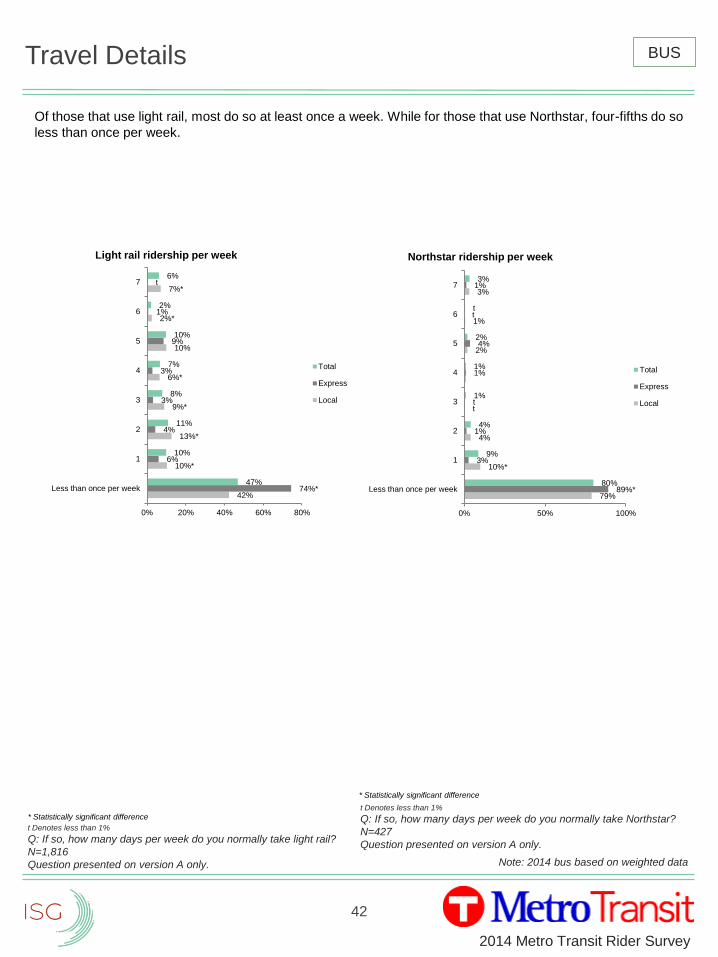
Of those that use light rail, most do so at least once a week. While for those that use Northstar, four-fifths do so
less than once per week.
t Denotes less than 1%
Q: If so, how many days per week do you normally take light rail?
N=1,816
Question presented on version A only.
42%
10%*
13%*
9%*
6%*
10%
2%*
7%*
74%*
6%
4%
3%
3%
9%
1%
t
47%
10%
11%
8%
7%
10%
2%
6%
0% 20% 40% 60% 80%
Less than once per week
1
2
3
4
5
6
7
Light rail ridership per week
Total
Express
Local
79%
10%*
4%
t
2%
1%
3%
89%*
3%
1%
t
1%
4%
t
1%
80%
9%
4%
1%
1%
2%
t
3%
0% 50% 100%
Less than once per week
1
2
3
4
5
6
7
Northstar ridership per week
Total
Express
Local
t Denotes less than 1%
Q: If so, how many days per week do you normally take Northstar?
N=427
Question presented on version A only.
* Statistically significant difference
* Statistically significant difference
BUS
Note: 2014 bus based on weighted data
43
2014 Metro Transit Rider Survey
Travel Details
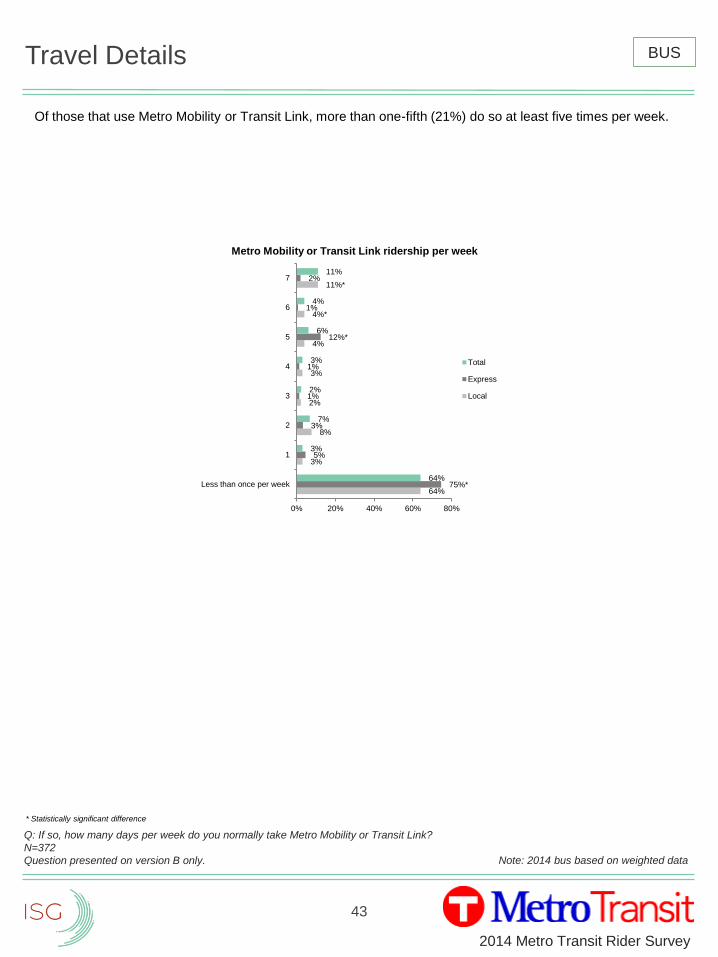
Of those that use Metro Mobility or Transit Link, more than one-fifth (21%) do so at least five times per week.
Q: If so, how many days per week do you normally take Metro Mobility or Transit Link?
N=372
Question presented on version B only.
64%
3%
8%
2%
3%
4%
4%*
11%*
75%*
5%
3%
1%
1%
12%*
1%
2%
64%
3%
7%
2%
3%
6%
4%
11%
0% 20% 40% 60% 80%
Less than once per week
1
2
3
4
5
6
7
Metro Mobility or Transit Link ridership per week
Total
Express
Local
* Statistically significant difference
BUS
Note: 2014 bus based on weighted data
44
2014 Metro Transit Rider Survey
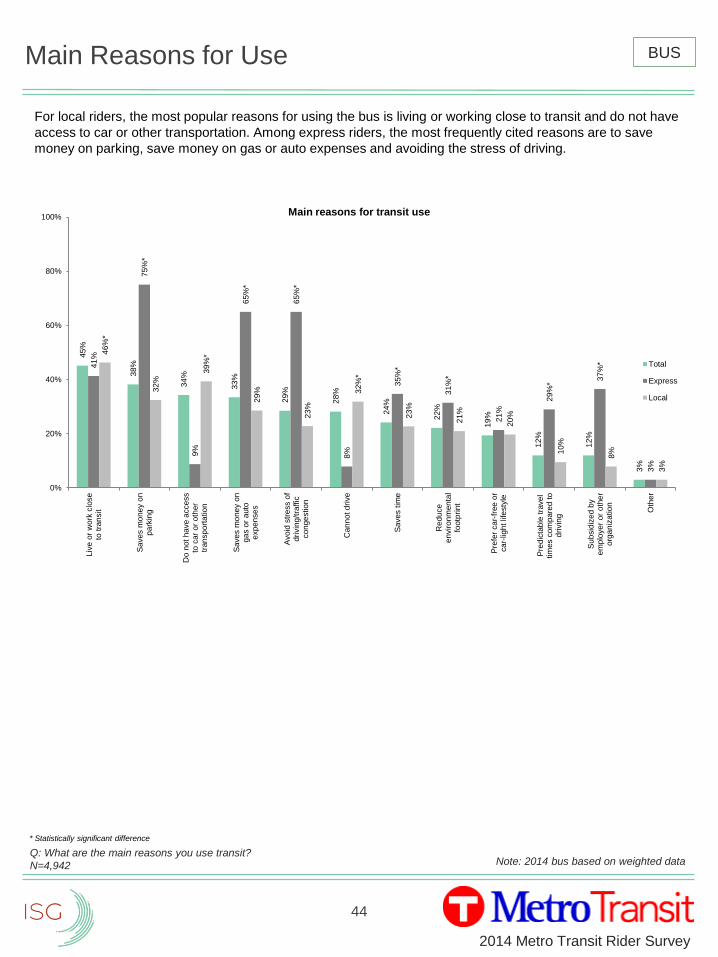
Main Reasons for Use
For local riders, the most popular reasons for using the bus is living or working close to transit and do not have
access to car or other transportation. Among express riders, the most frequently cited reasons are to save
money on parking, save money on gas or auto expenses and avoiding the stress of driving.
Q: What are the main reasons you use transit?
N=4,942
45
%
38
%
34
%
33
%
29
%
28
%
24
%
22
%
19
%
12
%
12
%
3%
41
%
75
%*
9%
65
%*
65
%*
8%
35
%*
31
%*
21
%
29
%*
37
%*
3%
46
%*
32
%
39
%*
29
%
23
%
32
%*
23
%
21
%
20
%
10
%
8%
3%
0%
20%
40%
60%
80%
100%
Liv
e o
r w
ork
clo
se
to tra
nsit
Sa
ve
s m
on
ey o
np
ark
ing
Do n
ot
ha
ve
acce
ss
to c
ar
or
oth
er
tran
sp
ort
atio
n
Sa
ve
s m
on
ey o
ng
as o
r a
uto
exp
en
se
s
Avo
id s
tre
ss o
fd
rivin
g/t
raffic
co
nge
stio
n
Can
not
dri
ve
Sa
ve
s t
ime
Red
uce
en
viro
nm
en
tal
footp
rint
Pre
fer
ca
r-fr
ee
or
ca
r-lig
ht
life
sty
le
Pre
dic
tab
le t
rave
ltim
es c
om
pare
d to
dri
vin
g
Su
bsid
ize
d b
ye
mp
loye
r or
oth
er
org
an
ization
Oth
er
Main reasons for transit use
Total
Express
Local
* Statistically significant difference
BUS
Note: 2014 bus based on weighted data
45
2014 Metro Transit Rider Survey
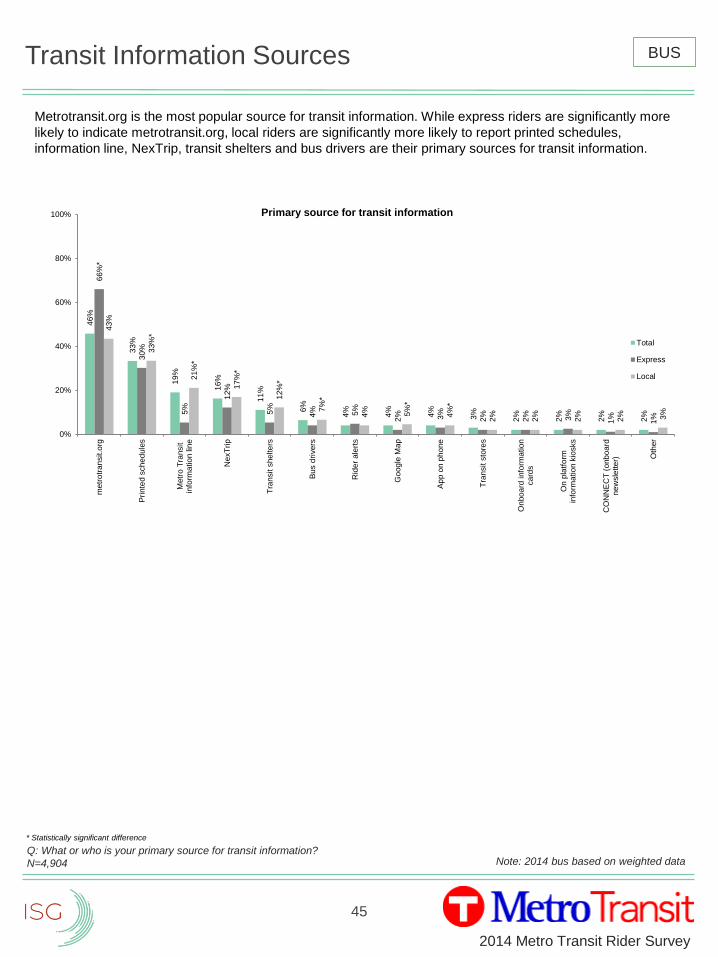
Transit Information Sources
Metrotransit.org is the most popular source for transit information. While express riders are significantly more
likely to indicate metrotransit.org, local riders are significantly more likely to report printed schedules,
information line, NexTrip, transit shelters and bus drivers are their primary sources for transit information.
Q: What or who is your primary source for transit information?
N=4,904
46
%
33
%
19
%
16
%
11
%
6%
4%
4%
4%
3%
2%
2%
2%
2%
66
%*
30
%
5%
12
%
5%
4% 5%
2% 3%
2%
2% 3%
1%
1%
43
%
33
%*
21
%*
17
%*
12
%*
7%
*
4% 5%
*
4%
*
2%
2%
2%
2% 3%
0%
20%
40%
60%
80%
100%
metr
otr
an
sit.o
rg
Pri
nte
d s
ch
ed
ule
s
Metr
o T
ransit
info
rma
tio
n lin
e
NexT
rip
Tra
nsit s
he
lte
rs
Bu
s d
rivers
Rid
er
ale
rts
Go
og
le M
ap
Ap
p o
n p
ho
ne
Tra
nsit s
tore
s
On
bo
ard
info
rma
tio
nca
rds
On
pla
tfo
rmin
form
atio
n k
iosks
CO
NN
EC
T (
onb
oa
rdn
ew
sle
tte
r) Oth
er
Primary source for transit information
Total
Express
Local
* Statistically significant difference
BUS
Note: 2014 bus based on weighted data
46
2014 Metro Transit Rider Survey
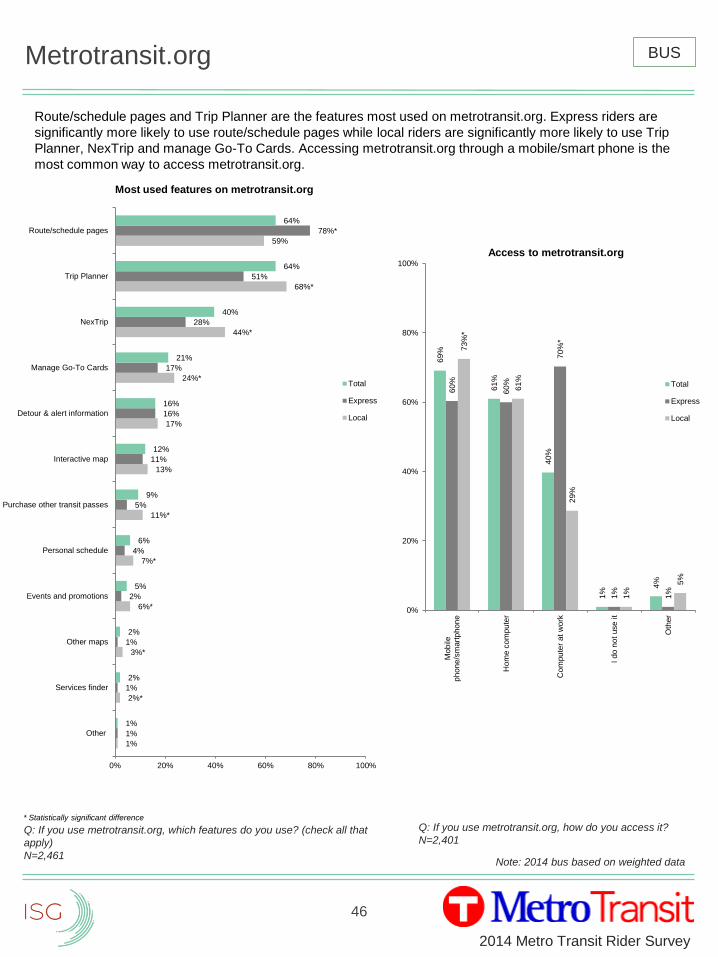
Metrotransit.org
Route/schedule pages and Trip Planner are the features most used on metrotransit.org. Express riders are
significantly more likely to use route/schedule pages while local riders are significantly more likely to use Trip
Planner, NexTrip and manage Go-To Cards. Accessing metrotransit.org through a mobile/smart phone is the
most common way to access metrotransit.org.
Q: If you use metrotransit.org, which features do you use? (check all that
apply)
N=2,461
1%
2%*
3%*
6%*
7%*
11%*
13%
17%
24%*
44%*
68%*
59%
1%
1%
1%
2%
4%
5%
11%
16%
17%
28%
51%
78%*
1%
2%
2%
5%
6%
9%
12%
16%
21%
40%
64%
64%
0% 20% 40% 60% 80% 100%
Other
Services finder
Other maps
Events and promotions
Personal schedule
Purchase other transit passes
Interactive map
Detour & alert information
Manage Go-To Cards
NexTrip
Trip Planner
Route/schedule pages
Most used features on metrotransit.org
Total
Express
Local
* Statistically significant difference
BUS
Note: 2014 bus based on weighted data
69
%
61
%
40
%
1%
4%
60
%
60
%
70
%*
1%
1%
73
%*
61
%
29
%
1%
5%
0%
20%
40%
60%
80%
100%
Mob
ilep
hon
e/s
mart
pho
ne
Hom
e c
om
pute
r
Com
pu
ter
at
work
I d
o n
ot
use
it
Oth
er
Access to metrotransit.org
Total
Express
Local
Q: If you use metrotransit.org, how do you access it?
N=2,401
47
2014 Metro Transit Rider Survey
Metrotransit.org
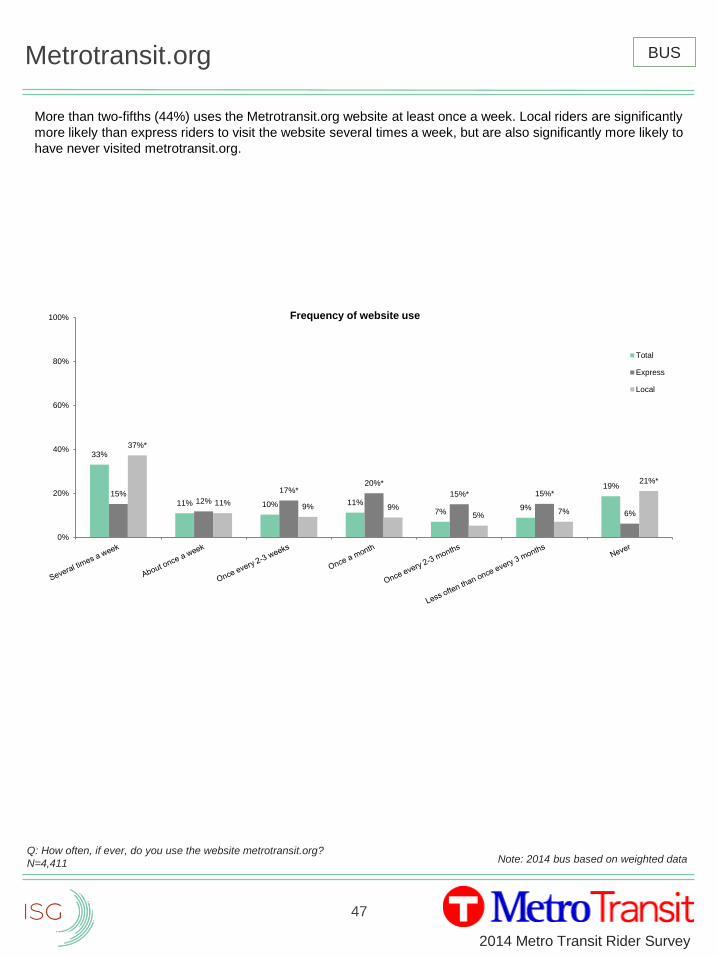
More than two-fifths (44%) uses the Metrotransit.org website at least once a week. Local riders are significantly
more likely than express riders to visit the website several times a week, but are also significantly more likely to
have never visited metrotransit.org.
Q: How often, if ever, do you use the website metrotransit.org?
N=4,411
33%
11% 10% 11%7%
9%
19%15%
12%
17%*20%*
15%* 15%*
6%
37%*
11% 9% 9%5%
7%
21%*
0%
20%
40%
60%
80%
100% Frequency of website use
Total
Express
Local
Note: 2014 bus based on weighted data
BUS
48
2014 Metro Transit Rider Survey
Transport If Bus Was Not Available
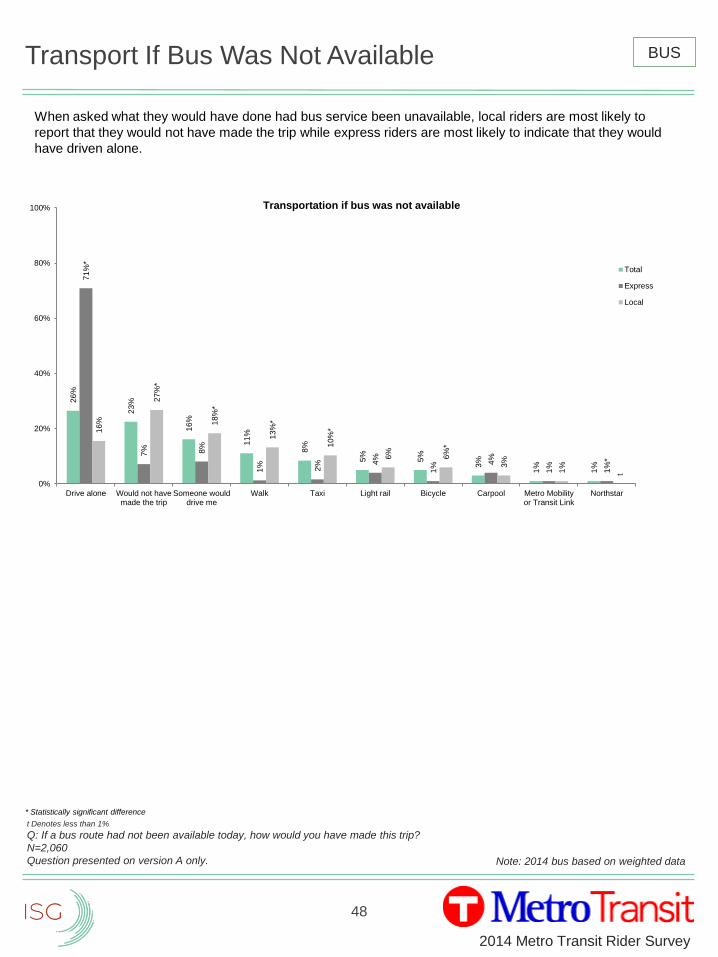
When asked what they would have done had bus service been unavailable, local riders are most likely to
report that they would not have made the trip while express riders are most likely to indicate that they would
have driven alone.
t Denotes less than 1%
Q: If a bus route had not been available today, how would you have made this trip?
N=2,060
Question presented on version A only.
26
%
23
%
16
%
11
%
8%
5%
5%
3%
1%
1%
71
%*
7% 8%
1% 2% 4
%
1%
4%
1%
1%
*
16
%
27
%*
18
%*
13
%*
10
%*
6%
6%
*
3%
1%
t
0%
20%
40%
60%
80%
100%
Drive alone Would not havemade the trip
Someone woulddrive me
Walk Taxi Light rail Bicycle Carpool Metro Mobilityor Transit Link
Northstar
Transportation if bus was not available
Total
Express
Local
* Statistically significant difference
BUS
Note: 2014 bus based on weighted data
49
2014 Metro Transit Rider Survey
Interest in WIFI
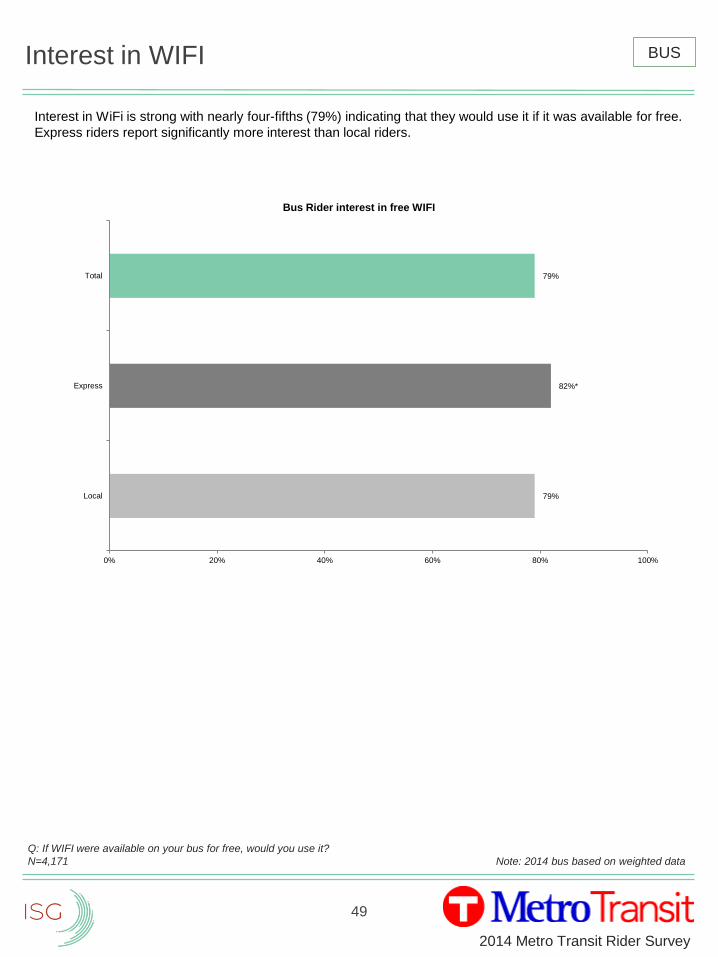
Interest in WiFi is strong with nearly four-fifths (79%) indicating that they would use it if it was available for free.
Express riders report significantly more interest than local riders.
Q: If WIFI were available on your bus for free, would you use it?
N=4,171
79%
82%*
79%
0% 20% 40% 60% 80% 100%
Local
Express
Total
Bus Rider interest in free WIFI
BUS
Note: 2014 bus based on weighted data
50
2014 Metro Transit Rider Survey
Likely to Recommend Metro Transit
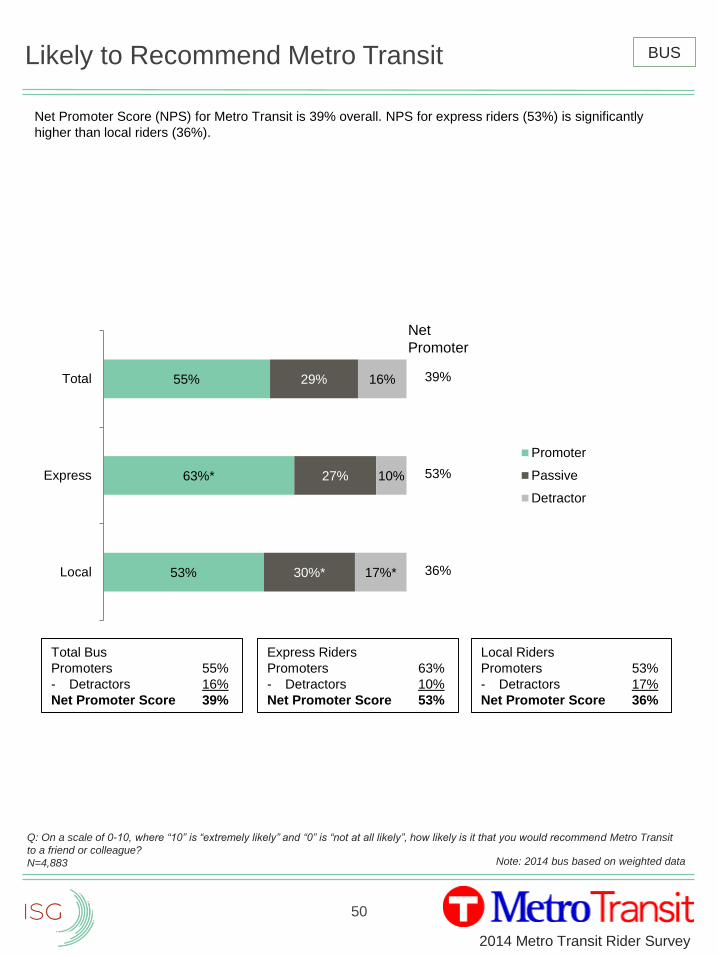
Net Promoter Score (NPS) for Metro Transit is 39% overall. NPS for express riders (53%) is significantly
higher than local riders (36%).
Q: On a scale of 0-10, where “10” is “extremely likely” and “0” is “not at all likely”, how likely is it that you would recommend Metro Transit
to a friend or colleague?
N=4,883
53%
63%*
55%
30%*
27%
29%
17%*
10%
16%
Local
Express
Total
Promoter
Passive
Detractor
Net
Promoter
39%
36%
53%
BUS
Note: 2014 bus based on weighted data
Express Riders
Promoters 63%
- Detractors 10%
Net Promoter Score 53%
Local Riders
Promoters 53%
- Detractors 17%
Net Promoter Score 36%
Total Bus
Promoters 55%
- Detractors 16%
Net Promoter Score 39%
51
2014 Metro Transit Rider Survey
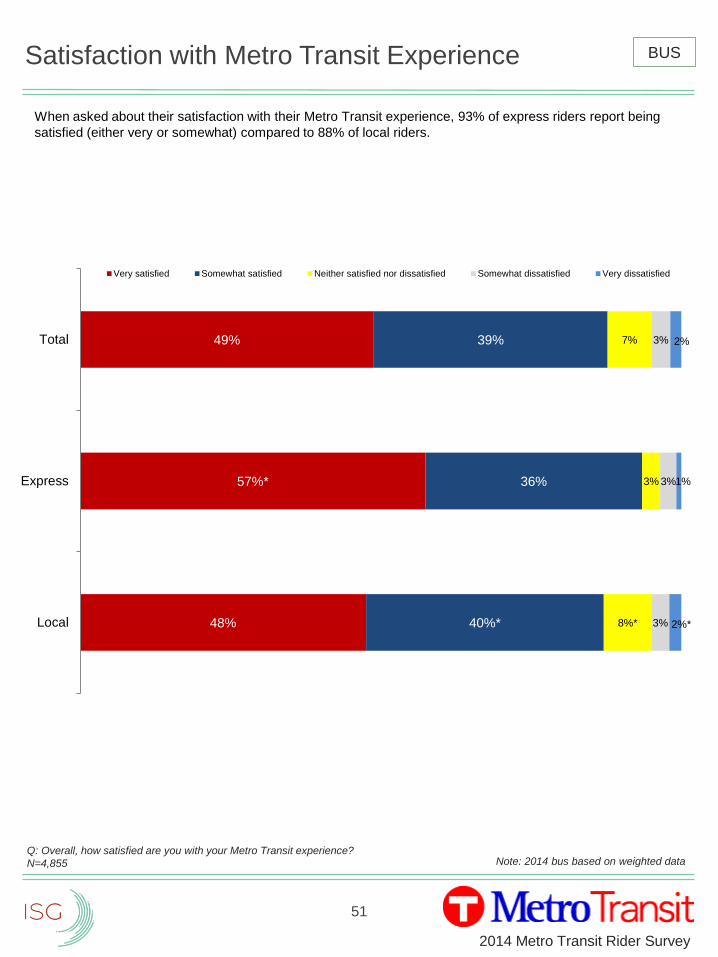
Satisfaction with Metro Transit Experience
When asked about their satisfaction with their Metro Transit experience, 93% of express riders report being
satisfied (either very or somewhat) compared to 88% of local riders.
Q: Overall, how satisfied are you with your Metro Transit experience?
N=4,855
48%
57%*
49%
40%*
36%
39%
8%*
3%
7%
3%
3%
3%
2%*
1%
2%
Local
Express
Total
Very satisfied Somewhat satisfied Neither satisfied nor dissatisfied Somewhat dissatisfied Very dissatisfied
BUS
Note: 2014 bus based on weighted data
52
2014 Metro Transit Rider Survey
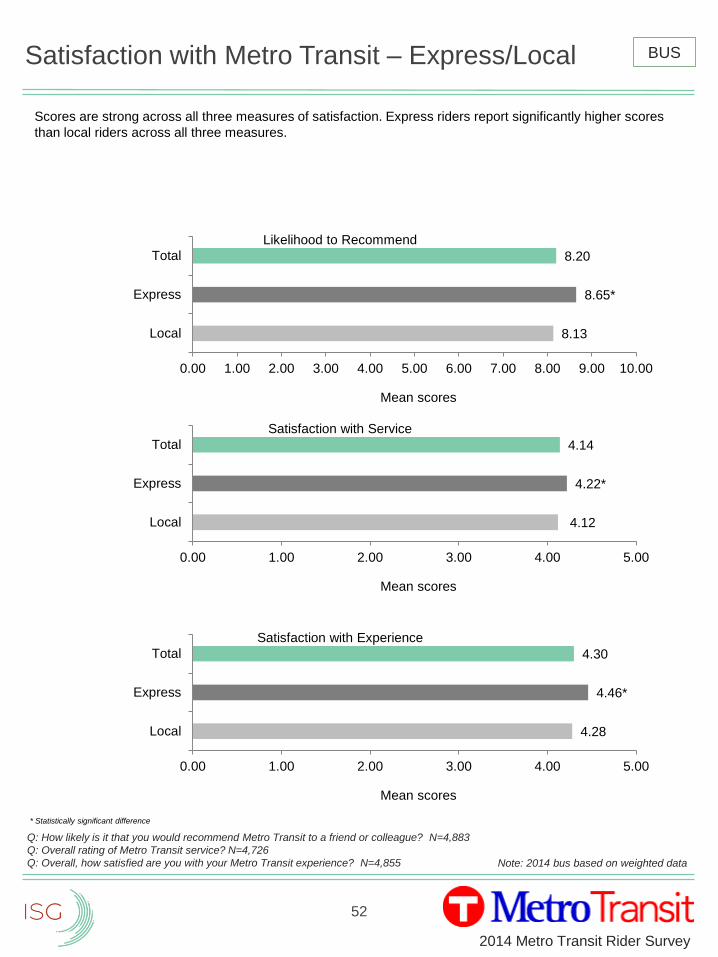
Satisfaction with Metro Transit – Express/Local
8.13
8.65*
8.20
0.00 1.00 2.00 3.00 4.00 5.00 6.00 7.00 8.00 9.00 10.00
Local
Express
Total
Mean scores
Likelihood to Recommend
Scores are strong across all three measures of satisfaction. Express riders report significantly higher scores
than local riders across all three measures.
Q: How likely is it that you would recommend Metro Transit to a friend or colleague? N=4,883
Q: Overall rating of Metro Transit service? N=4,726
Q: Overall, how satisfied are you with your Metro Transit experience? N=4,855
4.12
4.22*
4.14
0.00 1.00 2.00 3.00 4.00 5.00
Local
Express
Total
Mean scores
Satisfaction with Service
4.28
4.46*
4.30
0.00 1.00 2.00 3.00 4.00 5.00
Local
Express
Total
Mean scores
Satisfaction with Experience
* Statistically significant difference
BUS
Note: 2014 bus based on weighted data
53
2014 Metro Transit Rider Survey
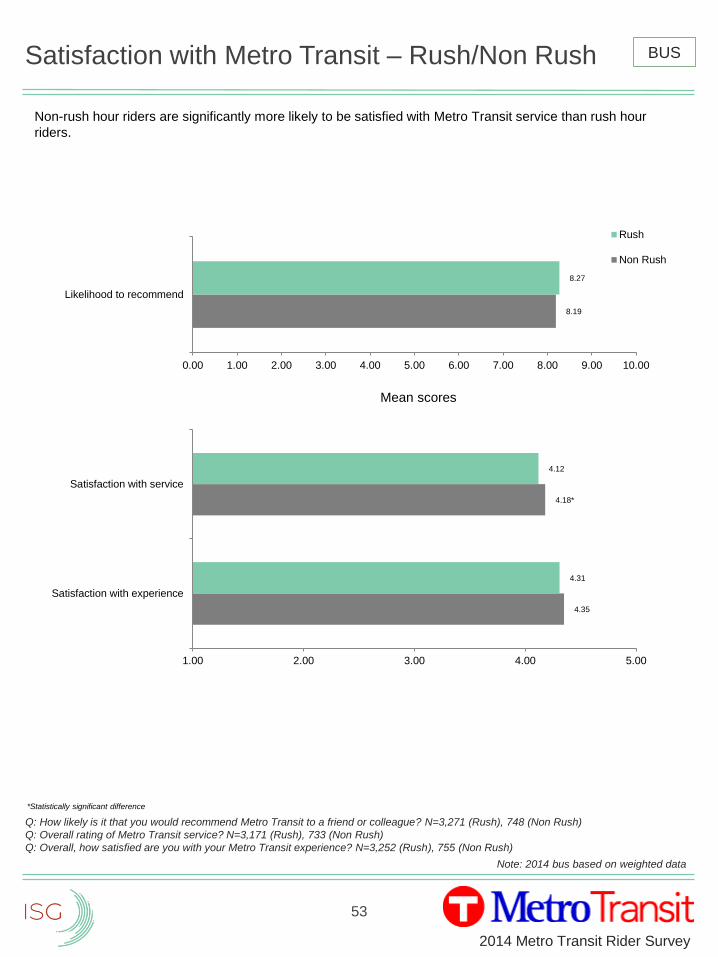
Satisfaction with Metro Transit – Rush/Non Rush
4.35
4.18*
4.31
4.12
1.00 2.00 3.00 4.00 5.00
Satisfaction with experience
Satisfaction with service
8.19
8.27
0.00 1.00 2.00 3.00 4.00 5.00 6.00 7.00 8.00 9.00 10.00
Likelihood to recommend
Mean scores
Rush
Non Rush
Non-rush hour riders are significantly more likely to be satisfied with Metro Transit service than rush hour
riders.
Q: How likely is it that you would recommend Metro Transit to a friend or colleague? N=3,271 (Rush), 748 (Non Rush)
Q: Overall rating of Metro Transit service? N=3,171 (Rush), 733 (Non Rush)
Q: Overall, how satisfied are you with your Metro Transit experience? N=3,252 (Rush), 755 (Non Rush)
*Statistically significant difference
BUS
Note: 2014 bus based on weighted data
54
2014 Metro Transit Rider Survey
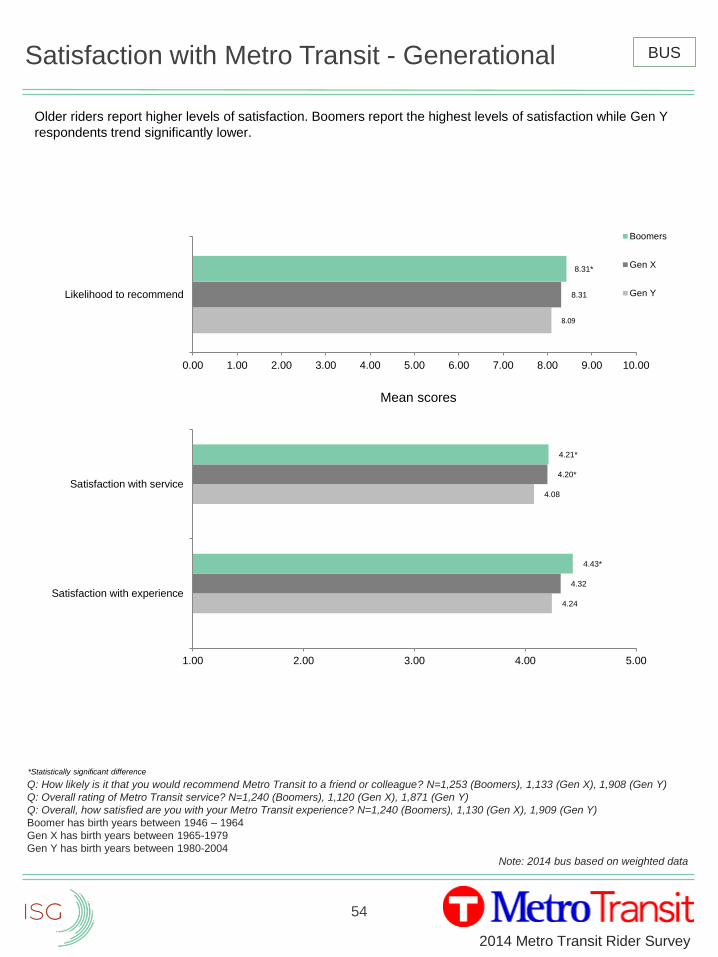
Satisfaction with Metro Transit - Generational
4.24
4.08
4.32
4.20*
4.43*
4.21*
1.00 2.00 3.00 4.00 5.00
Satisfaction with experience
Satisfaction with service
8.09
8.31
8.31*
0.00 1.00 2.00 3.00 4.00 5.00 6.00 7.00 8.00 9.00 10.00
Likelihood to recommend
Mean scores
Boomers
Gen X
Gen Y
Older riders report higher levels of satisfaction. Boomers report the highest levels of satisfaction while Gen Y
respondents trend significantly lower.
Q: How likely is it that you would recommend Metro Transit to a friend or colleague? N=1,253 (Boomers), 1,133 (Gen X), 1,908 (Gen Y)
Q: Overall rating of Metro Transit service? N=1,240 (Boomers), 1,120 (Gen X), 1,871 (Gen Y)
Q: Overall, how satisfied are you with your Metro Transit experience? N=1,240 (Boomers), 1,130 (Gen X), 1,909 (Gen Y)
Boomer has birth years between 1946 – 1964
Gen X has birth years between 1965-1979
Gen Y has birth years between 1980-2004
*Statistically significant difference
BUS
Note: 2014 bus based on weighted data
55
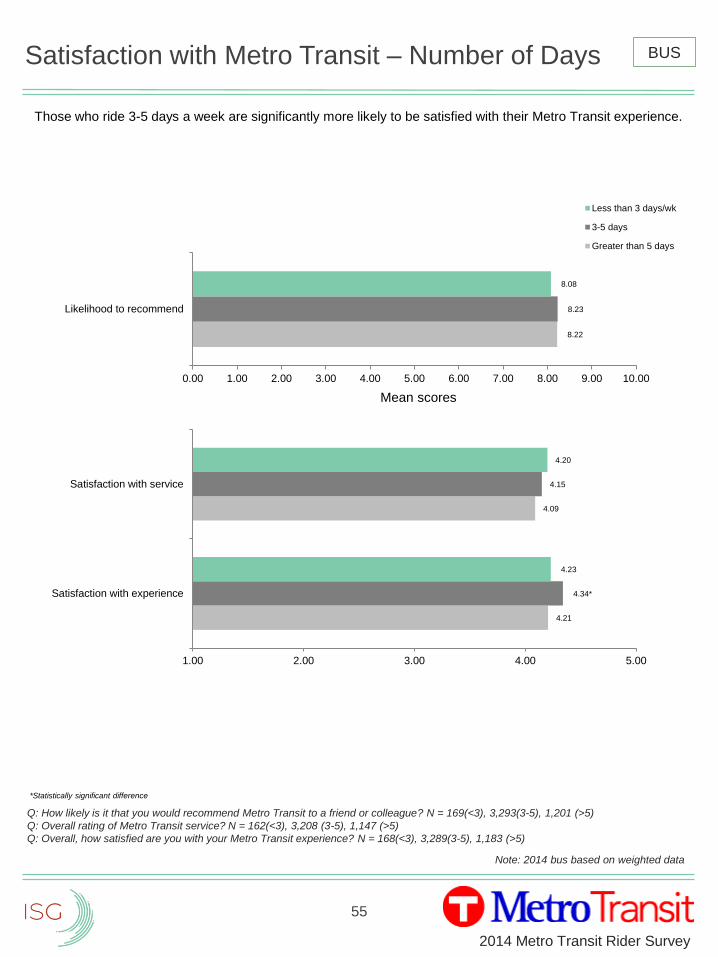
2014 Metro Transit Rider Survey
Satisfaction with Metro Transit – Number of Days
4.21
4.09
4.34*
4.15
4.23
4.20
1.00 2.00 3.00 4.00 5.00
Satisfaction with experience
Satisfaction with service
8.22
8.23
8.08
0.00 1.00 2.00 3.00 4.00 5.00 6.00 7.00 8.00 9.00 10.00
Likelihood to recommend
Mean scores
Less than 3 days/wk
3-5 days
Greater than 5 days
Those who ride 3-5 days a week are significantly more likely to be satisfied with their Metro Transit experience.
Q: How likely is it that you would recommend Metro Transit to a friend or colleague? N = 169(<3), 3,293(3-5), 1,201 (>5)
Q: Overall rating of Metro Transit service? N = 162(<3), 3,208 (3-5), 1,147 (>5)
Q: Overall, how satisfied are you with your Metro Transit experience? N = 168(<3), 3,289(3-5), 1,183 (>5)
*Statistically significant difference
BUS
Note: 2014 bus based on weighted data
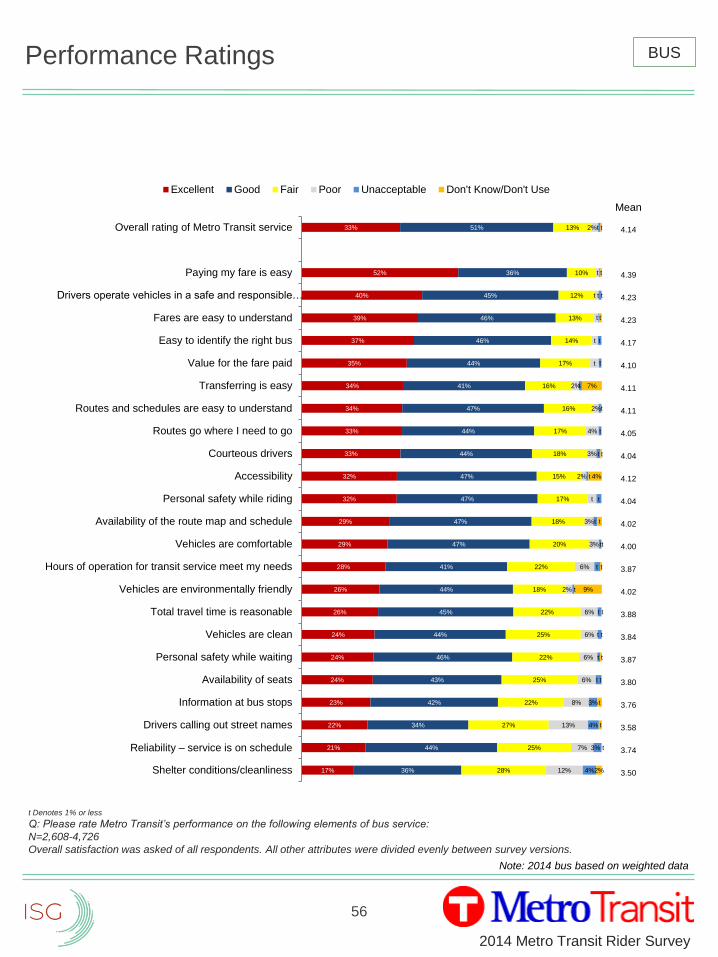
56
2014 Metro Transit Rider Survey
Mean
4.14
4.39
4.23
4.23
4.17
4.10
4.11
4.11
4.05
4.04
4.12
4.04
4.02
4.00
3.87
4.02
3.88
3.84
3.87
3.80
3.76
3.58
3.74
3.50
Performance Ratings
t Denotes 1% or less
Q: Please rate Metro Transit’s performance on the following elements of bus service:
N=2,608-4,726
Overall satisfaction was asked of all respondents. All other attributes were divided evenly between survey versions.
17%
21%
22%
23%
24%
24%
24%
26%
26%
28%
29%
29%
32%
32%
33%
33%
34%
34%
35%
37%
39%
40%
52%
33%
36%
44%
34%
42%
43%
46%
44%
45%
44%
41%
47%
47%
47%
47%
44%
44%
47%
41%
44%
46%
46%
45%
36%
51%
28%
25%
27%
22%
25%
22%
25%
22%
18%
22%
20%
18%
17%
15%
18%
17%
16%
16%
17%
14%
13%
12%
10%
13%
12%
7%
13%
8%
6%
6%
6%
6%
2% t
6%
3%
3%
t
2% t
3%
4%
2%
2%
t
t
t t t
t
2%t t
4%
3% t
4%
3%
t t
t t
t t
2%
9%
tt
4%
7%
t
Shelter conditions/cleanliness
Reliability – service is on schedule
Drivers calling out street names
Information at bus stops
Availability of seats
Personal safety while waiting
Vehicles are clean
Total travel time is reasonable
Vehicles are environmentally friendly
Hours of operation for transit service meet my needs
Vehicles are comfortable
Availability of the route map and schedule
Personal safety while riding
Accessibility
Courteous drivers
Routes go where I need to go
Routes and schedules are easy to understand
Transferring is easy
Value for the fare paid
Easy to identify the right bus
Fares are easy to understand
Drivers operate vehicles in a safe and responsible…
Paying my fare is easy
Overall rating of Metro Transit service
Excellent Good Fair Poor Unacceptable Don't Know/Don't Use
BUS
Note: 2014 bus based on weighted data
tt
t
t
t
t
t
t t
t
t t
t t
t t
t
t
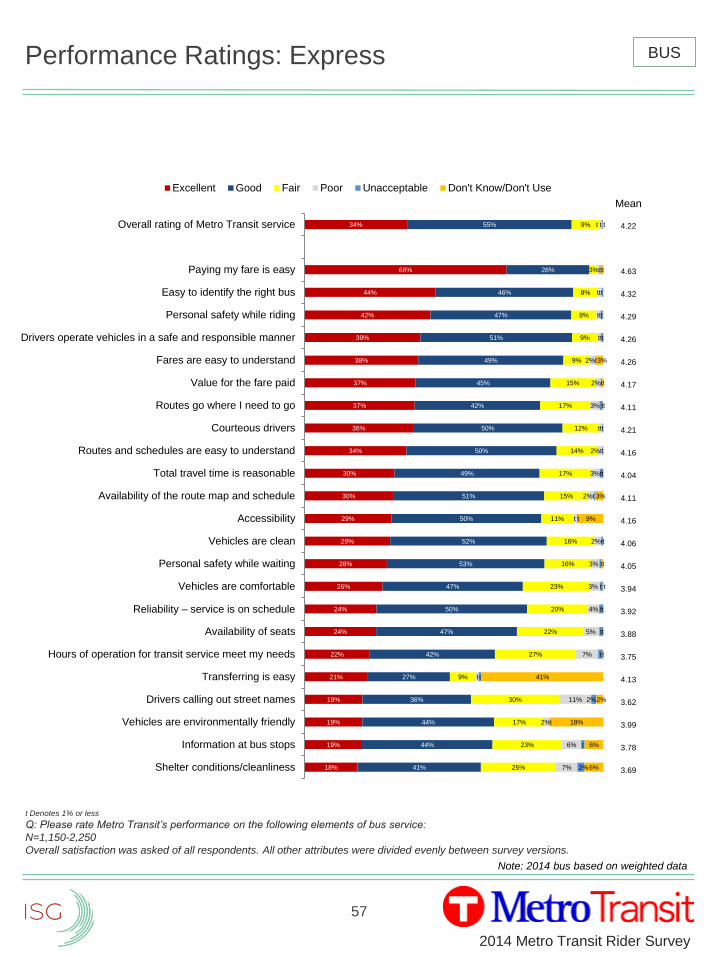
57
2014 Metro Transit Rider Survey
Mean
4.22
4.63
4.32
4.29
4.26
4.26
4.17
4.11
4.21
4.16
4.04
4.11
4.16
4.06
4.05
3.94
3.92
3.88
3.75
4.13
3.62
3.99
3.78
3.69
Performance Ratings: Express
t Denotes 1% or less
Q: Please rate Metro Transit’s performance on the following elements of bus service:
N=1,150-2,250
Overall satisfaction was asked of all respondents. All other attributes were divided evenly between survey versions.
18%
19%
19%
19%
21%
22%
24%
24%
26%
28%
29%
29%
30%
30%
34%
36%
37%
37%
38%
39%
42%
44%
68%
34%
41%
44%
44%
36%
27%
42%
47%
50%
47%
53%
52%
50%
51%
49%
50%
50%
42%
45%
49%
51%
47%
46%
28%
55%
25%
23%
17%
30%
9%
27%
22%
20%
23%
16%
16%
11%
15%
17%
14%
12%
17%
15%
9%
9%
8%
8%
3%
9%
7%
6%
2%
11%
t
7%
5%
4%
3% t t
3% tt
2%tt
t t
2%t
3%tt
2%tt
ttt
3%
2%tt
2%t
ttt
ttt
ttt
t t t
2%
t
t
2%
t
t
ttt
6%
6%
18%
2%
41%
t
tt
tt
9%
3%
tt
3%
Shelter conditions/cleanliness
Information at bus stops
Vehicles are environmentally friendly
Drivers calling out street names
Transferring is easy
Hours of operation for transit service meet my needs
Availability of seats
Reliability – service is on schedule
Vehicles are comfortable
Personal safety while waiting
Vehicles are clean
Accessibility
Availability of the route map and schedule
Total travel time is reasonable
Routes and schedules are easy to understand
Courteous drivers
Routes go where I need to go
Value for the fare paid
Fares are easy to understand
Drivers operate vehicles in a safe and responsible manner
Personal safety while riding
Easy to identify the right bus
Paying my fare is easy
Overall rating of Metro Transit service
Excellent Good Fair Poor Unacceptable Don't Know/Don't Use
BUS
Note: 2014 bus based on weighted data
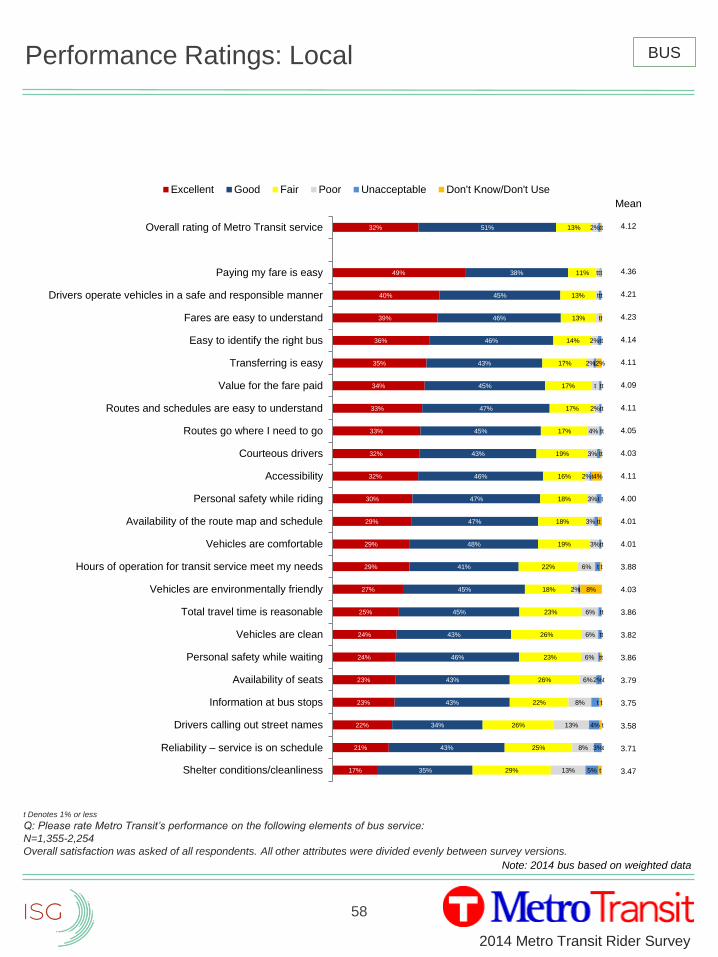
58
2014 Metro Transit Rider Survey
Mean
4.12
4.36
4.21
4.23
4.14
4.11
4.09
4.11
4.05
4.03
4.11
4.00
4.01
4.01
3.88
4.03
3.86
3.82
3.86
3.79
3.75
3.58
3.71
3.47
Performance Ratings: Local
t Denotes 1% or less
Q: Please rate Metro Transit’s performance on the following elements of bus service:
N=1,355-2,254
Overall satisfaction was asked of all respondents. All other attributes were divided evenly between survey versions.
17%
21%
22%
23%
23%
24%
24%
25%
27%
29%
29%
29%
30%
32%
32%
33%
33%
34%
35%
36%
39%
40%
49%
32%
35%
43%
34%
43%
43%
46%
43%
45%
45%
41%
48%
47%
47%
46%
43%
45%
47%
45%
43%
46%
46%
45%
38%
51%
29%
25%
26%
22%
26%
23%
26%
23%
18%
22%
19%
18%
18%
16%
19%
17%
17%
17%
17%
14%
13%
13%
11%
13%
13%
8%
13%
8%
6%
6%
6%
6%
2%
6%
3%
3%
3%
2%t
3% tt
4% tt
2%tt
t
2%
2%tt
tt
ttt
tt
2%
5%
3%
4% t
t t
2%t
tt
t
t
t
tt
tt
8%
t t
tt
tt
t t
4%
tt
t2%
t
tt
Shelter conditions/cleanliness
Reliability – service is on schedule
Drivers calling out street names
Information at bus stops
Availability of seats
Personal safety while waiting
Vehicles are clean
Total travel time is reasonable
Vehicles are environmentally friendly
Hours of operation for transit service meet my needs
Vehicles are comfortable
Availability of the route map and schedule
Personal safety while riding
Accessibility
Courteous drivers
Routes go where I need to go
Routes and schedules are easy to understand
Value for the fare paid
Transferring is easy
Easy to identify the right bus
Fares are easy to understand
Drivers operate vehicles in a safe and responsible manner
Paying my fare is easy
Overall rating of Metro Transit service
Excellent Good Fair Poor Unacceptable Don't Know/Don't Use
BUS
Note: 2014 bus based on weighted data
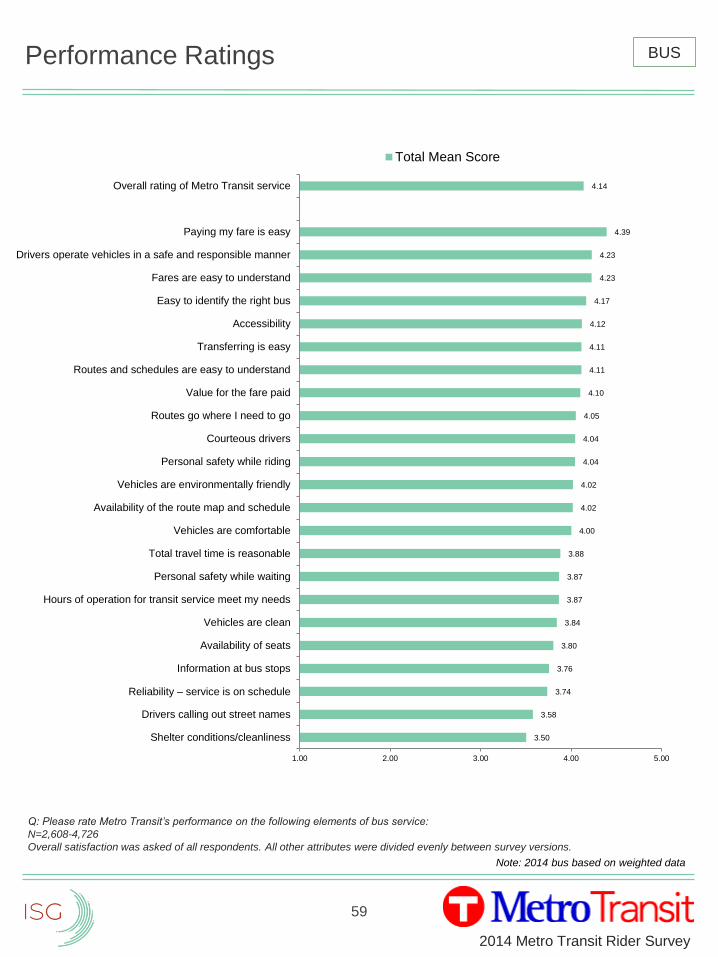
59
2014 Metro Transit Rider Survey
3.50
3.58
3.74
3.76
3.80
3.84
3.87
3.87
3.88
4.00
4.02
4.02
4.04
4.04
4.05
4.10
4.11
4.11
4.12
4.17
4.23
4.23
4.39
4.14
1.00 2.00 3.00 4.00 5.00
Shelter conditions/cleanliness
Drivers calling out street names
Reliability – service is on schedule
Information at bus stops
Availability of seats
Vehicles are clean
Hours of operation for transit service meet my needs
Personal safety while waiting
Total travel time is reasonable
Vehicles are comfortable
Availability of the route map and schedule
Vehicles are environmentally friendly
Personal safety while riding
Courteous drivers
Routes go where I need to go
Value for the fare paid
Routes and schedules are easy to understand
Transferring is easy
Accessibility
Easy to identify the right bus
Fares are easy to understand
Drivers operate vehicles in a safe and responsible manner
Paying my fare is easy
Overall rating of Metro Transit service
Total Mean Score
Performance Ratings
Q: Please rate Metro Transit’s performance on the following elements of bus service:
N=2,608-4,726
Overall satisfaction was asked of all respondents. All other attributes were divided evenly between survey versions.
BUS
Note: 2014 bus based on weighted data
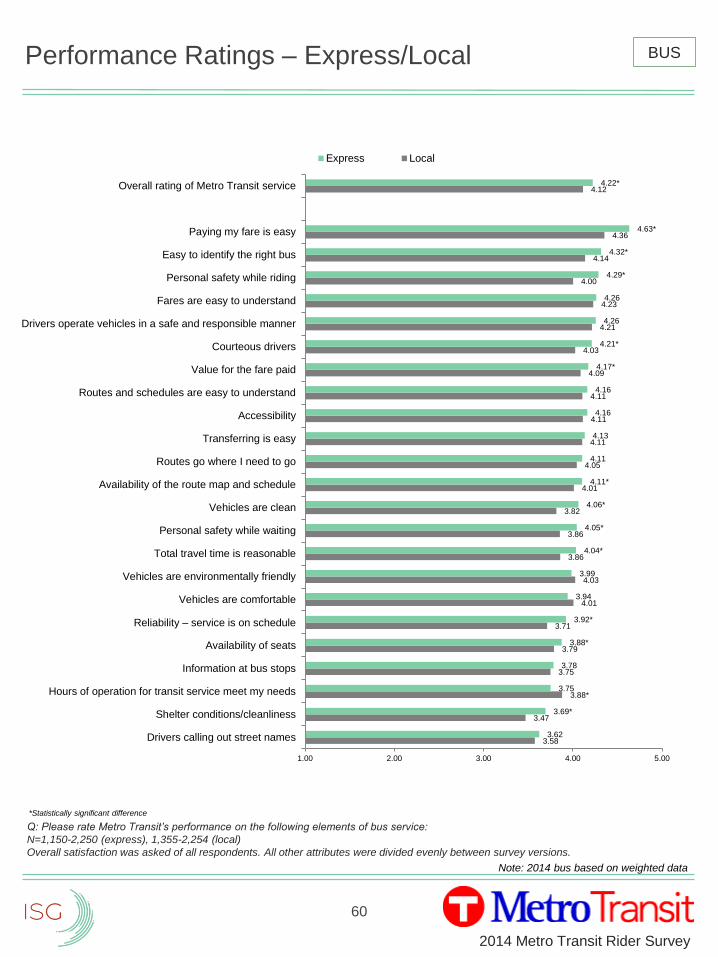
60
2014 Metro Transit Rider Survey
3.58
3.47
3.88*
3.75
3.79
3.71
4.01
4.03
3.86
3.86
3.82
4.01
4.05
4.11
4.11
4.11
4.09
4.03
4.21
4.23
4.00
4.14
4.36
4.12
3.62
3.69*
3.75
3.78
3.88*
3.92*
3.94
3.99
4.04*
4.05*
4.06*
4.11*
4.11
4.13
4.16
4.16
4.17*
4.21*
4.26
4.26
4.29*
4.32*
4.63*
4.22*
1.00 2.00 3.00 4.00 5.00
Drivers calling out street names
Shelter conditions/cleanliness
Hours of operation for transit service meet my needs
Information at bus stops
Availability of seats
Reliability – service is on schedule
Vehicles are comfortable
Vehicles are environmentally friendly
Total travel time is reasonable
Personal safety while waiting
Vehicles are clean
Availability of the route map and schedule
Routes go where I need to go
Transferring is easy
Accessibility
Routes and schedules are easy to understand
Value for the fare paid
Courteous drivers
Drivers operate vehicles in a safe and responsible manner
Fares are easy to understand
Personal safety while riding
Easy to identify the right bus
Paying my fare is easy
Overall rating of Metro Transit service
Express Local
Performance Ratings – Express/Local
Q: Please rate Metro Transit’s performance on the following elements of bus service:
N=1,150-2,250 (express), 1,355-2,254 (local)
Overall satisfaction was asked of all respondents. All other attributes were divided evenly between survey versions.
*Statistically significant difference
BUS
Note: 2014 bus based on weighted data
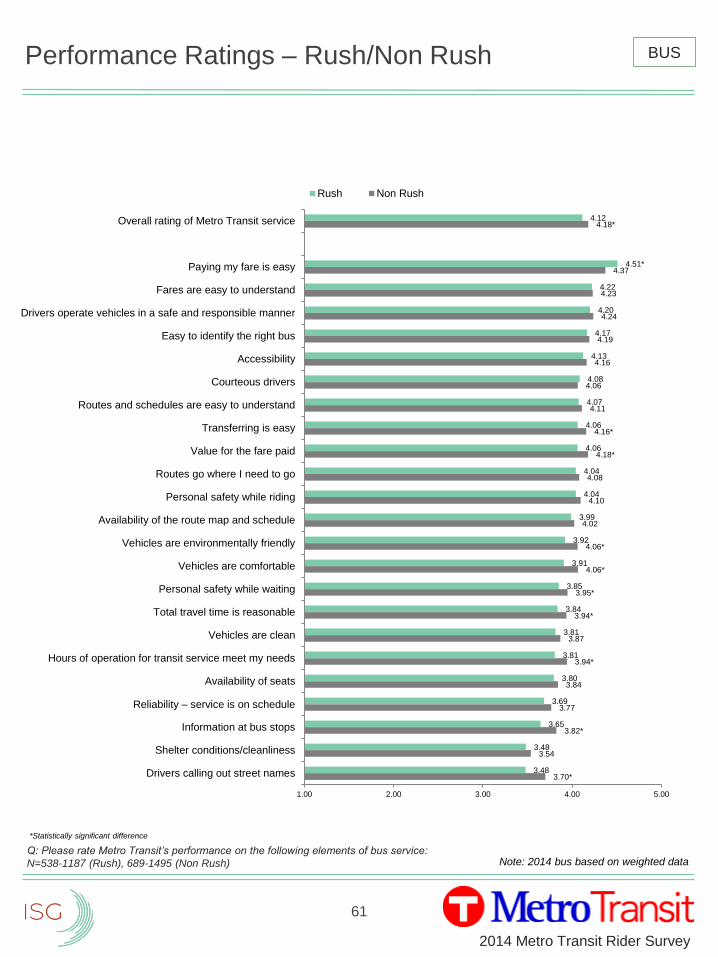
61
2014 Metro Transit Rider Survey
Performance Ratings – Rush/Non Rush
3.70*
3.54
3.82*
3.77
3.84
3.94*
3.87
3.94*
3.95*
4.06*
4.06*
4.02
4.10
4.08
4.18*
4.16*
4.11
4.06
4.16
4.19
4.24
4.23
4.37
4.18*
3.48
3.48
3.65
3.69
3.80
3.81
3.81
3.84
3.85
3.91
3.92
3.99
4.04
4.04
4.06
4.06
4.07
4.08
4.13
4.17
4.20
4.22
4.51*
4.12
1.00 2.00 3.00 4.00 5.00
Drivers calling out street names
Shelter conditions/cleanliness
Information at bus stops
Reliability – service is on schedule
Availability of seats
Hours of operation for transit service meet my needs
Vehicles are clean
Total travel time is reasonable
Personal safety while waiting
Vehicles are comfortable
Vehicles are environmentally friendly
Availability of the route map and schedule
Personal safety while riding
Routes go where I need to go
Value for the fare paid
Transferring is easy
Routes and schedules are easy to understand
Courteous drivers
Accessibility
Easy to identify the right bus
Drivers operate vehicles in a safe and responsible manner
Fares are easy to understand
Paying my fare is easy
Overall rating of Metro Transit service
Rush Non Rush
Q: Please rate Metro Transit’s performance on the following elements of bus service:
N=538-1187 (Rush), 689-1495 (Non Rush)
*Statistically significant difference
BUS
Note: 2014 bus based on weighted data
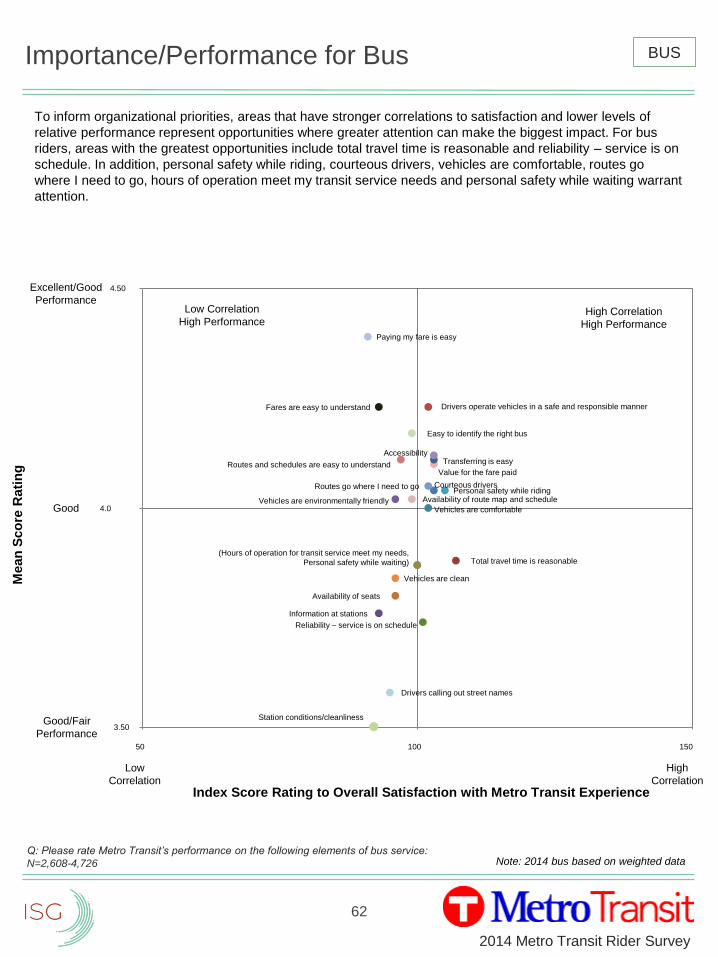
62
2014 Metro Transit Rider Survey
Importance/Performance for Bus
To inform organizational priorities, areas that have stronger correlations to satisfaction and lower levels of
relative performance represent opportunities where greater attention can make the biggest impact. For bus
riders, areas with the greatest opportunities include total travel time is reasonable and reliability – service is on
schedule. In addition, personal safety while riding, courteous drivers, vehicles are comfortable, routes go
where I need to go, hours of operation meet my transit service needs and personal safety while waiting warrant
attention.
Q: Please rate Metro Transit’s performance on the following elements of bus service:
N=2,608-4,726
BUS
Note: 2014 bus based on weighted data
Total travel time is reasonable
Reliability – service is on schedule
Value for the fare paid
Information at stations
Vehicles are comfortable
Availability of seats
Courteous drivers
Vehicles are environmentally friendly
Personal safety while riding
Vehicles are clean
Transferring is easy
Routes go where I need to go
Station conditions/cleanliness
Accessibility
Fares are easy to understand
Paying my fare is easy
Easy to identify the right bus
Drivers calling out street names
Mean
Sco
re R
ati
ng
Index Score Rating to Overall Satisfaction with Metro Transit Experience
Excellent/Good
Performance
Good
Good/Fair
Performance
High
Correlation
Low
Correlation
4.50
3.50
4.0
Low Correlation
High PerformanceHigh Correlation
High Performance
50 100 150
Routes and schedules are easy to understand
(Hours of operation for transit service meet my needs,
Personal safety while waiting)
Drivers operate vehicles in a safe and responsible manner
Availability of route map and schedule
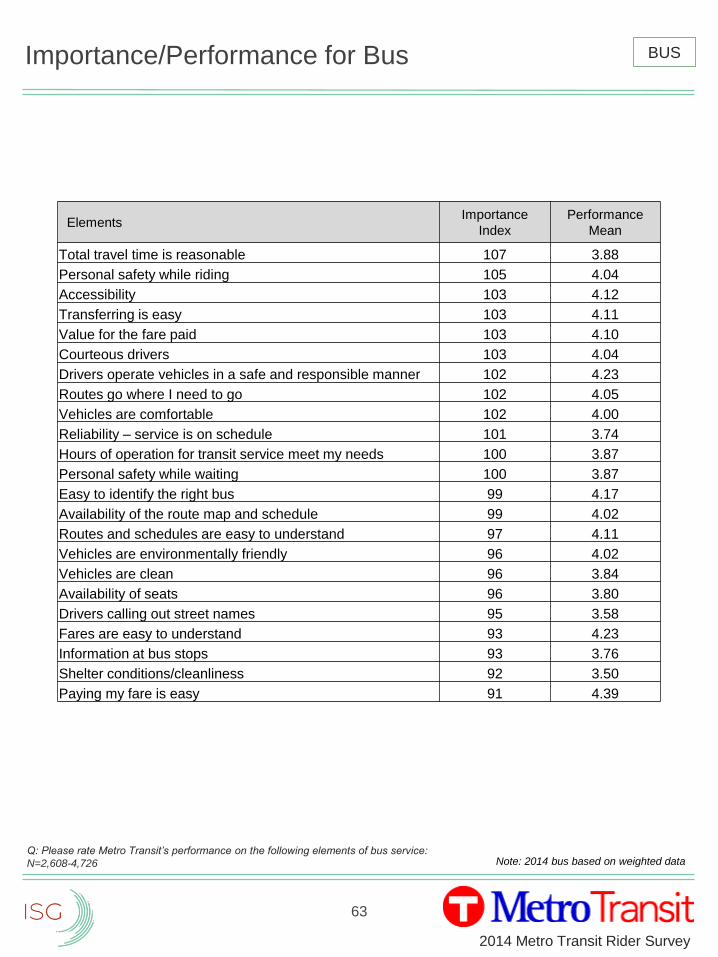
63
2014 Metro Transit Rider Survey
Importance/Performance for Bus
Q: Please rate Metro Transit’s performance on the following elements of bus service:
N=2,608-4,726
ElementsImportance
Index
Performance
Mean
Total travel time is reasonable 107 3.88
Personal safety while riding 105 4.04
Accessibility 103 4.12
Transferring is easy 103 4.11
Value for the fare paid 103 4.10
Courteous drivers 103 4.04
Drivers operate vehicles in a safe and responsible manner 102 4.23
Routes go where I need to go 102 4.05
Vehicles are comfortable 102 4.00
Reliability – service is on schedule 101 3.74
Hours of operation for transit service meet my needs 100 3.87
Personal safety while waiting 100 3.87
Easy to identify the right bus 99 4.17
Availability of the route map and schedule 99 4.02
Routes and schedules are easy to understand 97 4.11
Vehicles are environmentally friendly 96 4.02
Vehicles are clean 96 3.84
Availability of seats 96 3.80
Drivers calling out street names 95 3.58
Fares are easy to understand 93 4.23
Information at bus stops 93 3.76
Shelter conditions/cleanliness 92 3.50
Paying my fare is easy 91 4.39
BUS
Note: 2014 bus based on weighted data
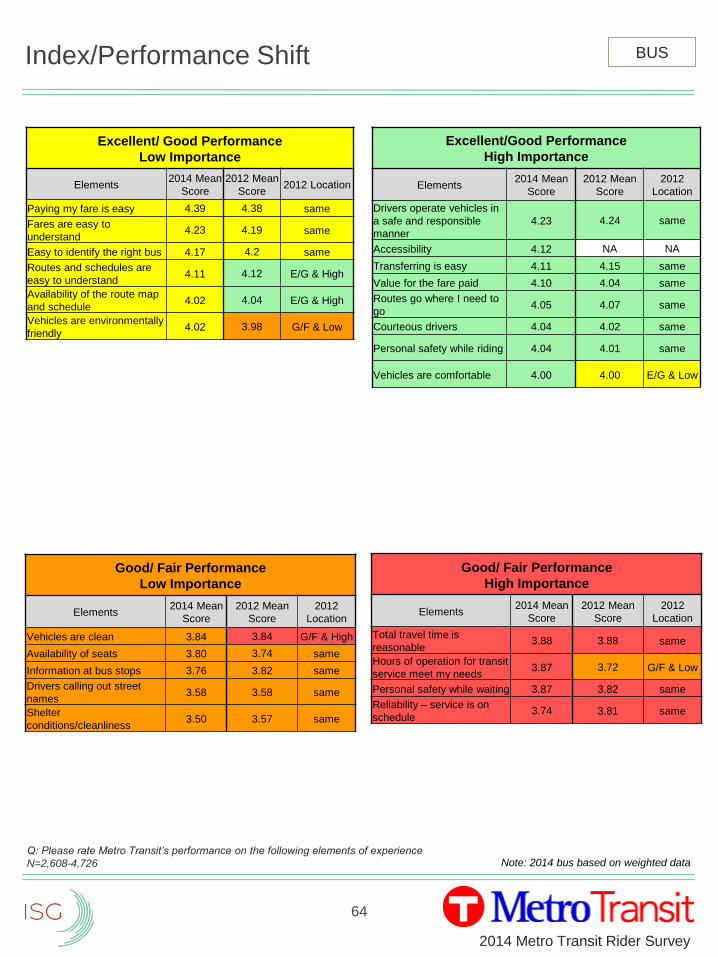
64
2014 Metro Transit Rider Survey
Index/Performance Shift
Q: Please rate Metro Transit’s performance on the following elements of experience
N=2,608-4,726
Excellent/ Good Performance
Low Importance
Elements2014 Mean
Score
2012 Mean
Score2012 Location
Paying my fare is easy 4.39 4.38 same
Fares are easy to
understand4.23 4.19 same
Easy to identify the right bus 4.17 4.2 same
Routes and schedules are
easy to understand4.11 4.12 E/G & High
Availability of the route map
and schedule4.02 4.04 E/G & High
Vehicles are environmentally
friendly4.02 3.98 G/F & Low
BUS
Good/ Fair Performance
High Importance
Elements2014 Mean
Score
2012 Mean
Score
2012
Location
Total travel time is
reasonable3.88 3.88 same
Hours of operation for transit
service meet my needs 3.87 3.72 G/F & Low
Personal safety while waiting 3.87 3.82 same
Reliability – service is on
schedule3.74 3.81 same
Excellent/Good Performance
High Importance
Elements2014 Mean
Score
2012 Mean
Score
2012
Location
Drivers operate vehicles in
a safe and responsible
manner
4.23 4.24 same
Accessibility 4.12 NA NA
Transferring is easy 4.11 4.15 same
Value for the fare paid 4.10 4.04 same
Routes go where I need to
go4.05 4.07 same
Courteous drivers 4.04 4.02 same
Personal safety while riding 4.04 4.01 same
Vehicles are comfortable 4.00 4.00 E/G & Low
Good/ Fair Performance
Low Importance
Elements2014 Mean
Score
2012 Mean
Score
2012
Location
Vehicles are clean 3.84 3.84 G/F & High
Availability of seats 3.80 3.74 same
Information at bus stops 3.76 3.82 same
Drivers calling out street
names3.58 3.58 same
Shelter
conditions/cleanliness3.50 3.57 same
Note: 2014 bus based on weighted data
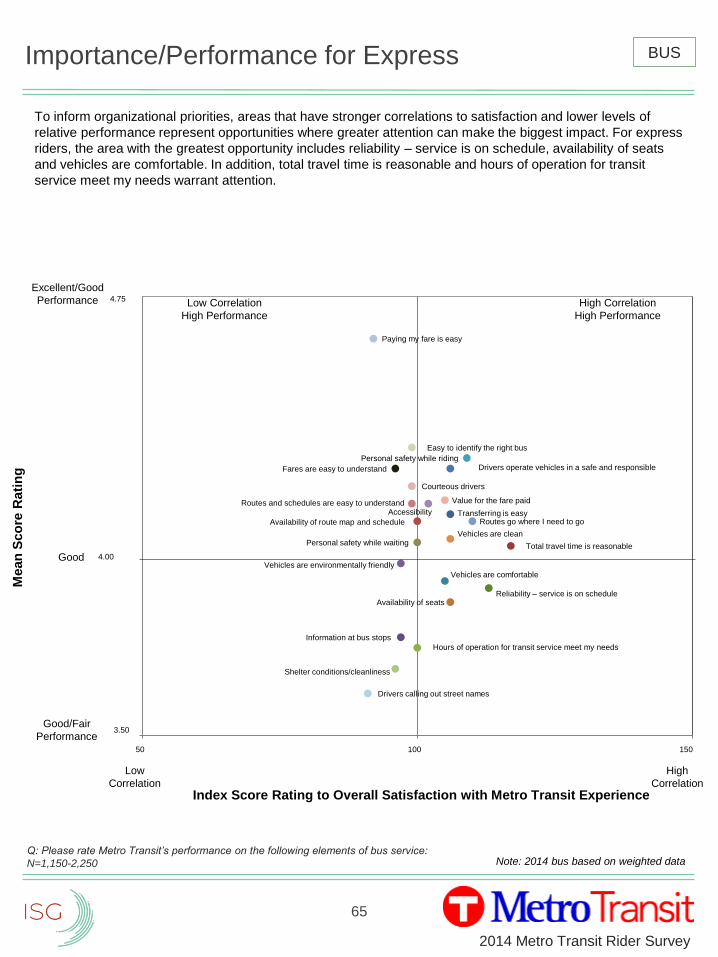
65
2014 Metro Transit Rider Survey
Importance/Performance for Express
To inform organizational priorities, areas that have stronger correlations to satisfaction and lower levels of
relative performance represent opportunities where greater attention can make the biggest impact. For express
riders, the area with the greatest opportunity includes reliability – service is on schedule, availability of seats
and vehicles are comfortable. In addition, total travel time is reasonable and hours of operation for transit
service meet my needs warrant attention.
Q: Please rate Metro Transit’s performance on the following elements of bus service:
N=1,150-2,250
BUS
Note: 2014 bus based on weighted data
Total travel time is reasonable
Reliability – service is on schedule
Value for the fare paid
Information at bus stops
Vehicles are comfortable
Availability of seats
Vehicles are environmentally friendly
Personal safety while riding
Vehicles are clean
Transferring is easyRoutes go where I need to go
Shelter conditions/cleanliness
Accessibility
Fares are easy to understand
Personal safety while waiting
Paying my fare is easy
Courteous drivers
Easy to identify the right bus
Drivers calling out street names
Mean
Sco
re R
ati
ng
Index Score Rating to Overall Satisfaction with Metro Transit Experience
Excellent/Good
Performance
Good
Good/Fair
Performance
High
Correlation
Low
Correlation
4.75
3.50
4.00
Low Correlation
High Performance
High Correlation
High Performance
50 100 150
Routes and schedules are easy to understand
Hours of operation for transit service meet my needs
Availability of route map and schedule
Drivers operate vehicles in a safe and responsible
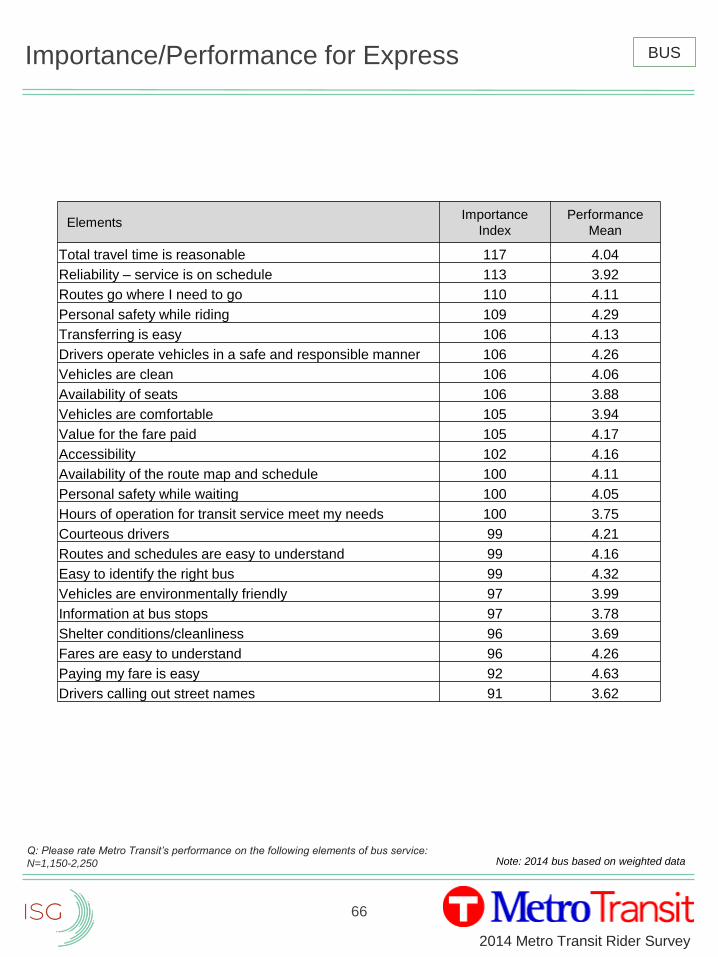
66
2014 Metro Transit Rider Survey
Importance/Performance for Express
Q: Please rate Metro Transit’s performance on the following elements of bus service:
N=1,150-2,250
ElementsImportance
Index
Performance
Mean
Total travel time is reasonable 117 4.04
Reliability – service is on schedule 113 3.92
Routes go where I need to go 110 4.11
Personal safety while riding 109 4.29
Transferring is easy 106 4.13
Drivers operate vehicles in a safe and responsible manner 106 4.26
Vehicles are clean 106 4.06
Availability of seats 106 3.88
Vehicles are comfortable 105 3.94
Value for the fare paid 105 4.17
Accessibility 102 4.16
Availability of the route map and schedule 100 4.11
Personal safety while waiting 100 4.05
Hours of operation for transit service meet my needs 100 3.75
Courteous drivers 99 4.21
Routes and schedules are easy to understand 99 4.16
Easy to identify the right bus 99 4.32
Vehicles are environmentally friendly 97 3.99
Information at bus stops 97 3.78
Shelter conditions/cleanliness 96 3.69
Fares are easy to understand 96 4.26
Paying my fare is easy 92 4.63
Drivers calling out street names 91 3.62
BUS
Note: 2014 bus based on weighted data
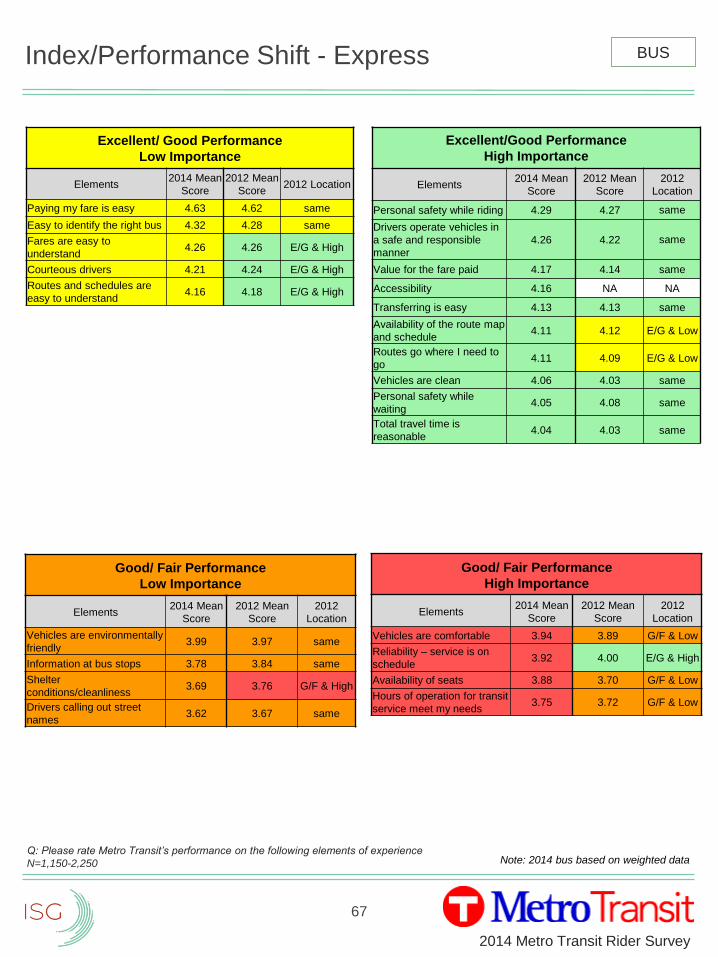
67
2014 Metro Transit Rider Survey
Index/Performance Shift - Express
Q: Please rate Metro Transit’s performance on the following elements of experience
N=1,150-2,250
Excellent/ Good Performance
Low Importance
Elements2014 Mean
Score
2012 Mean
Score2012 Location
Paying my fare is easy 4.63 4.62 same
Easy to identify the right bus 4.32 4.28 same
Fares are easy to
understand4.26 4.26 E/G & High
Courteous drivers 4.21 4.24 E/G & High
Routes and schedules are
easy to understand4.16 4.18 E/G & High
BUS
Good/ Fair Performance
High Importance
Elements2014 Mean
Score
2012 Mean
Score
2012
Location
Vehicles are comfortable 3.94 3.89 G/F & Low
Reliability – service is on
schedule3.92 4.00 E/G & High
Availability of seats 3.88 3.70 G/F & Low
Hours of operation for transit
service meet my needs3.75 3.72 G/F & Low
Excellent/Good Performance
High Importance
Elements2014 Mean
Score
2012 Mean
Score
2012
Location
Personal safety while riding 4.29 4.27 same
Drivers operate vehicles in
a safe and responsible
manner
4.26 4.22 same
Value for the fare paid 4.17 4.14 same
Accessibility 4.16 NA NA
Transferring is easy 4.13 4.13 same
Availability of the route map
and schedule4.11 4.12 E/G & Low
Routes go where I need to
go4.11 4.09 E/G & Low
Vehicles are clean 4.06 4.03 same
Personal safety while
waiting4.05 4.08 same
Total travel time is
reasonable4.04 4.03 same
Good/ Fair Performance
Low Importance
Elements2014 Mean
Score
2012 Mean
Score
2012
Location
Vehicles are environmentally
friendly3.99 3.97 same
Information at bus stops 3.78 3.84 same
Shelter
conditions/cleanliness3.69 3.76 G/F & High
Drivers calling out street
names3.62 3.67 same
Note: 2014 bus based on weighted data
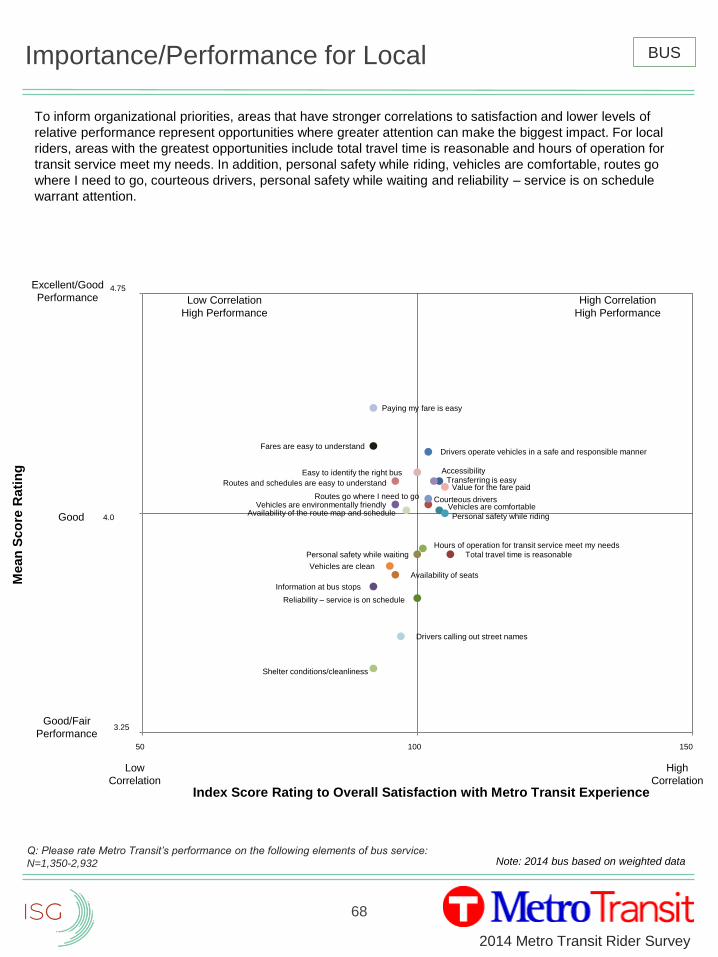
68
2014 Metro Transit Rider Survey
Importance/Performance for Local
To inform organizational priorities, areas that have stronger correlations to satisfaction and lower levels of
relative performance represent opportunities where greater attention can make the biggest impact. For local
riders, areas with the greatest opportunities include total travel time is reasonable and hours of operation for
transit service meet my needs. In addition, personal safety while riding, vehicles are comfortable, routes go
where I need to go, courteous drivers, personal safety while waiting and reliability – service is on schedule
warrant attention.
Q: Please rate Metro Transit’s performance on the following elements of bus service:
N=1,350-2,932
BUS
Note: 2014 bus based on weighted data
Total travel time is reasonable
Reliability – service is on schedule
Value for the fare paid
Information at bus stops
Vehicles are comfortable
Availability of seats
Courteous driversVehicles are environmentally friendly
Personal safety while riding
Vehicles are clean
Transferring is easy
Routes go where I need to go
Shelter conditions/cleanliness
Accessibility
Fares are easy to understand
Personal safety while waiting
Paying my fare is easy
Easy to identify the right bus
Drivers calling out street names
Mean
Sco
re R
ati
ng
Index Score Rating to Overall Satisfaction with Metro Transit Experience
Excellent/Good
Performance
Good
Good/Fair
Performance
High
Correlation
Low
Correlation
4.75
3.25
4.0
Low Correlation
High Performance
High Correlation
High Performance
50 100 150
Routes and schedules are easy to understand
Drivers operate vehicles in a safe and responsible manner
Availability of the route map and schedule
Hours of operation for transit service meet my needs
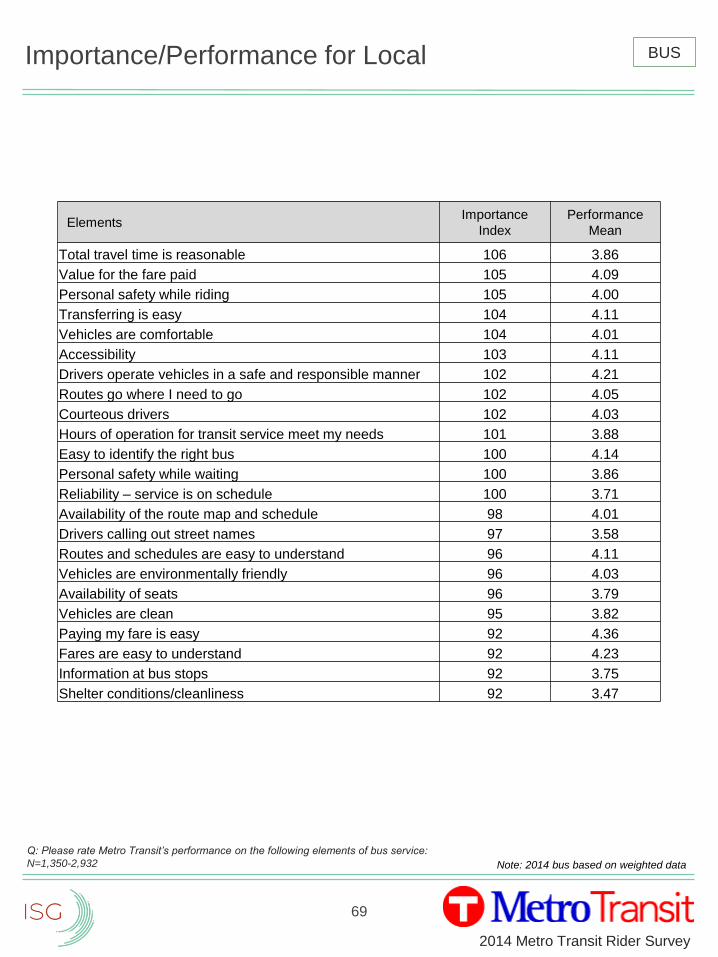
69
2014 Metro Transit Rider Survey
Importance/Performance for Local
Q: Please rate Metro Transit’s performance on the following elements of bus service:
N=1,350-2,932
ElementsImportance
Index
Performance
Mean
Total travel time is reasonable 106 3.86
Value for the fare paid 105 4.09
Personal safety while riding 105 4.00
Transferring is easy 104 4.11
Vehicles are comfortable 104 4.01
Accessibility 103 4.11
Drivers operate vehicles in a safe and responsible manner 102 4.21
Routes go where I need to go 102 4.05
Courteous drivers 102 4.03
Hours of operation for transit service meet my needs 101 3.88
Easy to identify the right bus 100 4.14
Personal safety while waiting 100 3.86
Reliability – service is on schedule 100 3.71
Availability of the route map and schedule 98 4.01
Drivers calling out street names 97 3.58
Routes and schedules are easy to understand 96 4.11
Vehicles are environmentally friendly 96 4.03
Availability of seats 96 3.79
Vehicles are clean 95 3.82
Paying my fare is easy 92 4.36
Fares are easy to understand 92 4.23
Information at bus stops 92 3.75
Shelter conditions/cleanliness 92 3.47
BUS
Note: 2014 bus based on weighted data
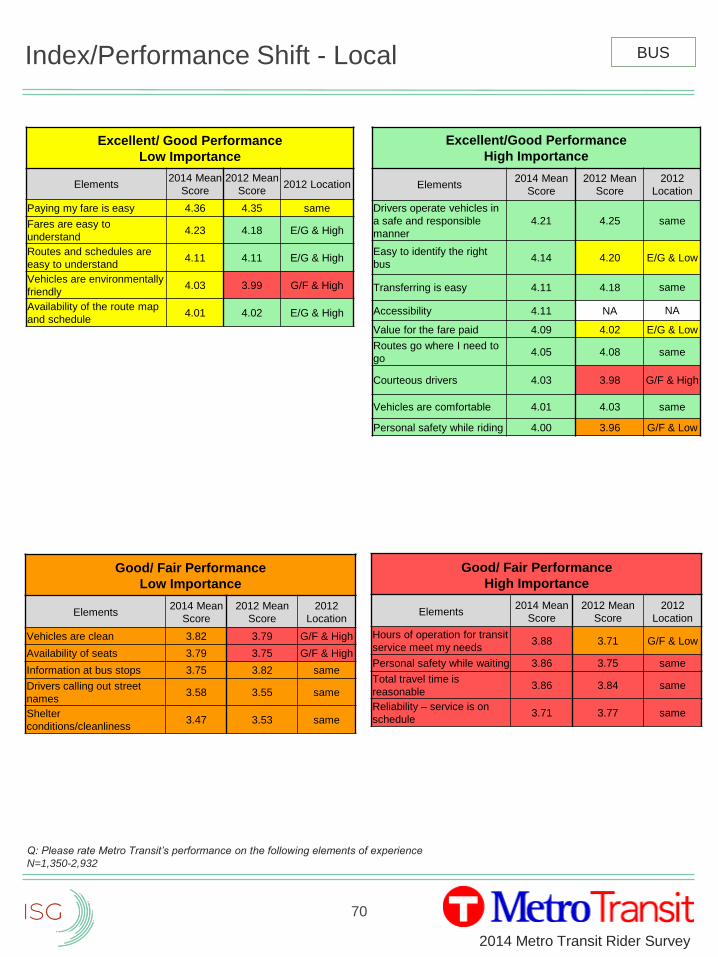
70
2014 Metro Transit Rider Survey
Index/Performance Shift - Local
Q: Please rate Metro Transit’s performance on the following elements of experience
N=1,350-2,932
Excellent/ Good Performance
Low Importance
Elements2014 Mean
Score
2012 Mean
Score2012 Location
Paying my fare is easy 4.36 4.35 same
Fares are easy to
understand4.23 4.18 E/G & High
Routes and schedules are
easy to understand4.11 4.11 E/G & High
Vehicles are environmentally
friendly4.03 3.99 G/F & High
Availability of the route map
and schedule4.01 4.02 E/G & High
BUS
Good/ Fair Performance
High Importance
Elements2014 Mean
Score
2012 Mean
Score
2012
Location
Hours of operation for transit
service meet my needs3.88 3.71 G/F & Low
Personal safety while waiting 3.86 3.75 same
Total travel time is
reasonable3.86 3.84 same
Reliability – service is on
schedule3.71 3.77 same
Excellent/Good Performance
High Importance
Elements2014 Mean
Score
2012 Mean
Score
2012
Location
Drivers operate vehicles in
a safe and responsible
manner
4.21 4.25 same
Easy to identify the right
bus4.14 4.20 E/G & Low
Transferring is easy 4.11 4.18 same
Accessibility 4.11 NA NA
Value for the fare paid 4.09 4.02 E/G & Low
Routes go where I need to
go4.05 4.08 same
Courteous drivers 4.03 3.98 G/F & High
Vehicles are comfortable 4.01 4.03 same
Personal safety while riding 4.00 3.96 G/F & Low
Good/ Fair Performance
Low Importance
Elements2014 Mean
Score
2012 Mean
Score
2012
Location
Vehicles are clean 3.82 3.79 G/F & High
Availability of seats 3.79 3.75 G/F & High
Information at bus stops 3.75 3.82 same
Drivers calling out street
names3.58 3.55 same
Shelter
conditions/cleanliness3.47 3.53 same

71
2014 Metro Transit Rider Survey
Importance/Performance for Rush
Q: Please rate Metro Transit’s performance on the following elements of bus service:
N=538-1,187
To inform organizational priorities, areas that have stronger correlations to satisfaction and lower levels of
relative performance represent opportunities where greater attention can make the biggest impact. For rush
hour riders, areas with the greatest opportunities include reliability – service is on schedule, total travel time is
reasonable, vehicles are comfortable, vehicles are clean and shelter conditions/cleanliness. In addition,
personal safety while riding, routes go where I need to go, availability of the route map and schedule and hours
of operation for transit service meet my needs warrant attention.
BUS
Note: 2014 bus based on weighted data
Total travel time is reasonable
Reliability – service is on schedule
Value for the fare paid
Information at bus stops
Vehicles are comfortable
Availability of seats
Easy to identify the right bus
Vehicles are environmentally friendly
Personal safety while riding
Vehicles are clean
Transferring is easy
Routes go where I need to go
Shelter conditions/cleanliness
Accessibility
Fares are easy to understand
Personal safety while waiting
Paying my fare is easy
Courteous drivers
Drivers calling out street names
Mean
Sco
re R
ati
ng
Index Score Rating to Overall Satisfaction with Metro Transit Experience
Excellent/Good
Performance
Good
Good/Fair
Performance
High
Correlation
Low
Correlation
4.75
3.25
4.0
Low Correlation
High Performance
High Correlation
High Performance
50 100 150
Routes and schedules are easy to understand
Drivers operate vehicles in a safe and responsible manner
Hours of operation for transit service meet my needs
Availability of the route map and schedule
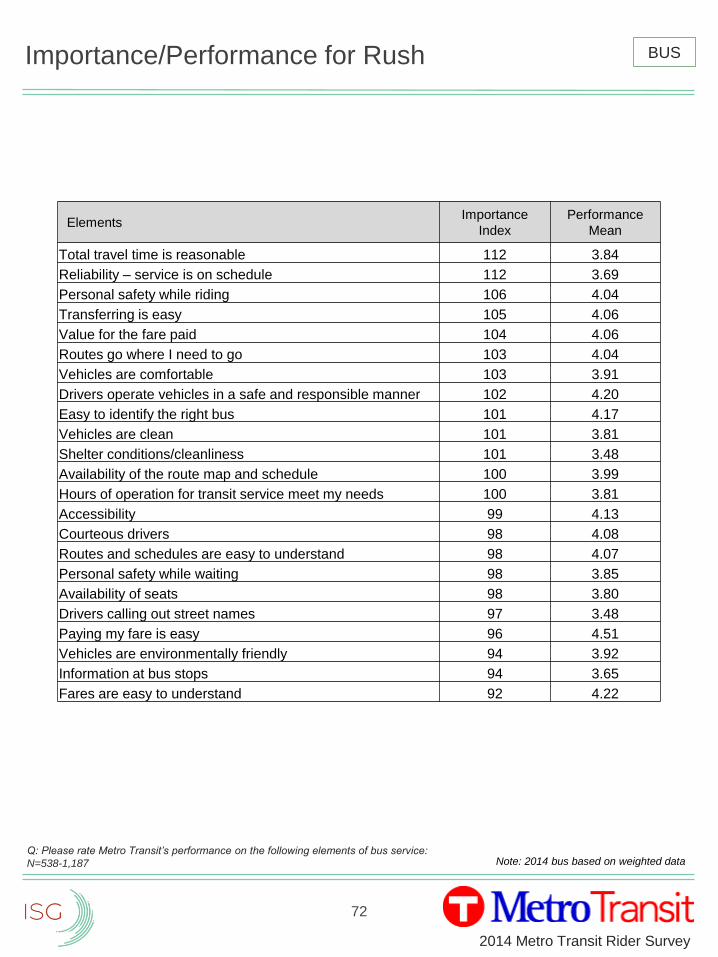
72
2014 Metro Transit Rider Survey
Importance/Performance for Rush
Q: Please rate Metro Transit’s performance on the following elements of bus service:
N=538-1,187
ElementsImportance
Index
Performance
Mean
Total travel time is reasonable 112 3.84
Reliability – service is on schedule 112 3.69
Personal safety while riding 106 4.04
Transferring is easy 105 4.06
Value for the fare paid 104 4.06
Routes go where I need to go 103 4.04
Vehicles are comfortable 103 3.91
Drivers operate vehicles in a safe and responsible manner 102 4.20
Easy to identify the right bus 101 4.17
Vehicles are clean 101 3.81
Shelter conditions/cleanliness 101 3.48
Availability of the route map and schedule 100 3.99
Hours of operation for transit service meet my needs 100 3.81
Accessibility 99 4.13
Courteous drivers 98 4.08
Routes and schedules are easy to understand 98 4.07
Personal safety while waiting 98 3.85
Availability of seats 98 3.80
Drivers calling out street names 97 3.48
Paying my fare is easy 96 4.51
Vehicles are environmentally friendly 94 3.92
Information at bus stops 94 3.65
Fares are easy to understand 92 4.22
BUS
Note: 2014 bus based on weighted data
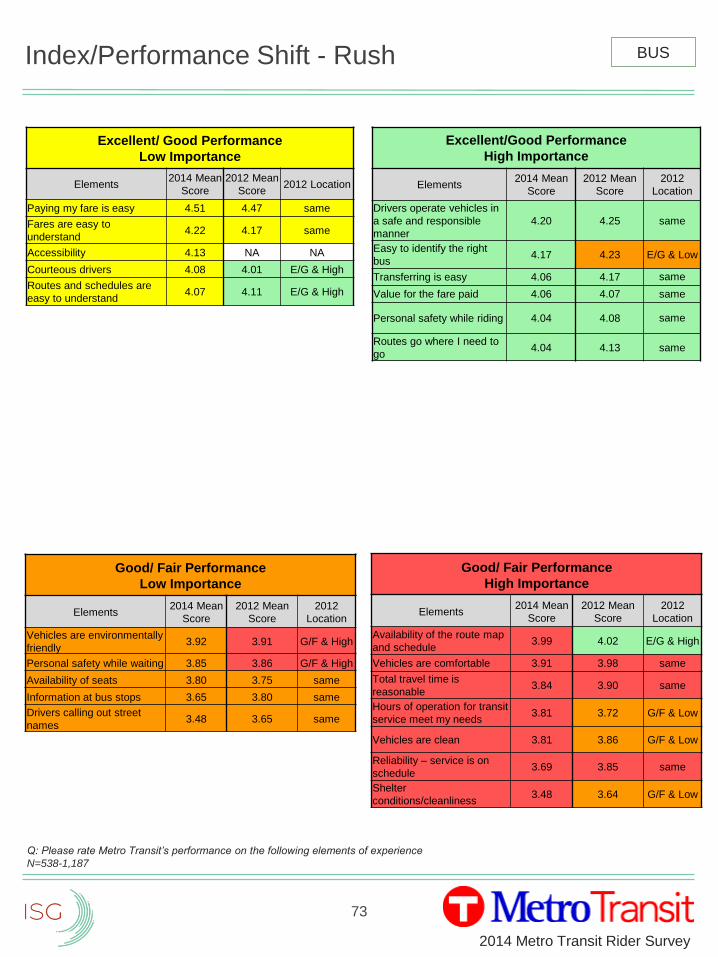
73
2014 Metro Transit Rider Survey
Index/Performance Shift - Rush
Q: Please rate Metro Transit’s performance on the following elements of experience
N=538-1,187
Excellent/ Good Performance
Low Importance
Elements2014 Mean
Score
2012 Mean
Score2012 Location
Paying my fare is easy 4.51 4.47 same
Fares are easy to
understand4.22 4.17 same
Accessibility 4.13 NA NA
Courteous drivers 4.08 4.01 E/G & High
Routes and schedules are
easy to understand4.07 4.11 E/G & High
BUS
Good/ Fair Performance
High Importance
Elements2014 Mean
Score
2012 Mean
Score
2012
Location
Availability of the route map
and schedule3.99 4.02 E/G & High
Vehicles are comfortable 3.91 3.98 same
Total travel time is
reasonable3.84 3.90 same
Hours of operation for transit
service meet my needs3.81 3.72 G/F & Low
Vehicles are clean 3.81 3.86 G/F & Low
Reliability – service is on
schedule3.69 3.85 same
Shelter
conditions/cleanliness3.48 3.64 G/F & Low
Excellent/Good Performance
High Importance
Elements2014 Mean
Score
2012 Mean
Score
2012
Location
Drivers operate vehicles in
a safe and responsible
manner
4.20 4.25 same
Easy to identify the right
bus4.17 4.23 E/G & Low
Transferring is easy 4.06 4.17 same
Value for the fare paid 4.06 4.07 same
Personal safety while riding 4.04 4.08 same
Routes go where I need to
go4.04 4.13 same
Good/ Fair Performance
Low Importance
Elements2014 Mean
Score
2012 Mean
Score
2012
Location
Vehicles are environmentally
friendly3.92 3.91 G/F & High
Personal safety while waiting 3.85 3.86 G/F & High
Availability of seats 3.80 3.75 same
Information at bus stops 3.65 3.80 same
Drivers calling out street
names3.48 3.65 same
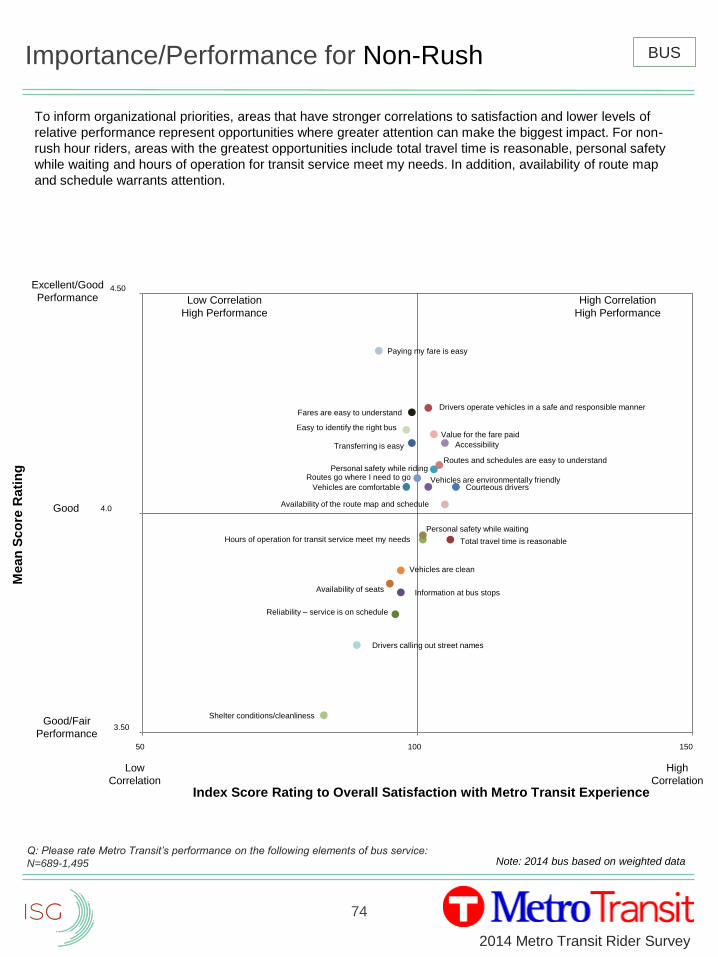
74
2014 Metro Transit Rider Survey
Importance/Performance for Non-Rush
Q: Please rate Metro Transit’s performance on the following elements of bus service:
N=689-1,495
To inform organizational priorities, areas that have stronger correlations to satisfaction and lower levels of
relative performance represent opportunities where greater attention can make the biggest impact. For non-
rush hour riders, areas with the greatest opportunities include total travel time is reasonable, personal safety
while waiting and hours of operation for transit service meet my needs. In addition, availability of route map
and schedule warrants attention.
BUS
Note: 2014 bus based on weighted data
Total travel time is reasonable
Reliability – service is on schedule
Value for the fare paid
Information at bus stops
Vehicles are comfortable
Availability of seats
Courteous driversVehicles are environmentally friendly
Personal safety while riding
Vehicles are clean
Transferring is easy
Routes go where I need to go
Shelter conditions/cleanliness
Accessibility
Fares are easy to understand
Personal safety while waiting
Paying my fare is easy
Easy to identify the right bus
Drivers calling out street names
Mean
Sco
re R
ati
ng
Index Score Rating to Overall Satisfaction with Metro Transit Experience
Excellent/Good
Performance
Good
Good/Fair
Performance
High
Correlation
Low
Correlation
4.50
3.50
4.0
Low Correlation
High Performance
High Correlation
High Performance
50 100 150
Routes and schedules are easy to understand
Hours of operation for transit service meet my needs
Drivers operate vehicles in a safe and responsible manner
Availability of the route map and schedule
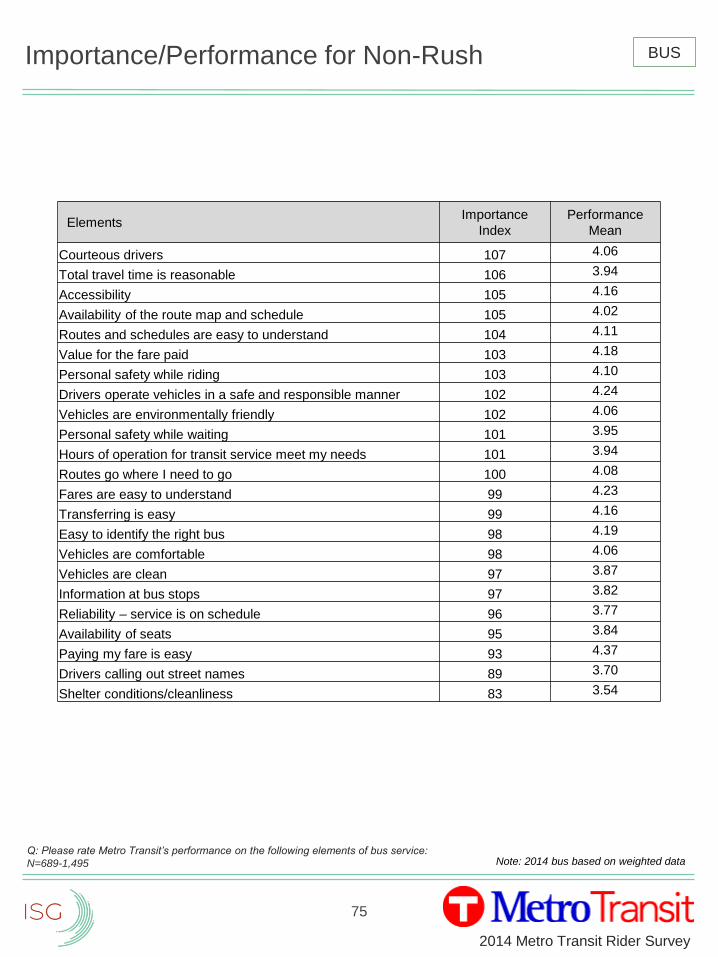
75
2014 Metro Transit Rider Survey
Importance/Performance for Non-Rush
Q: Please rate Metro Transit’s performance on the following elements of bus service:
N=689-1,495
ElementsImportance
Index
Performance
Mean
Courteous drivers 107 4.06
Total travel time is reasonable 106 3.94
Accessibility 105 4.16
Availability of the route map and schedule 105 4.02
Routes and schedules are easy to understand 104 4.11
Value for the fare paid 103 4.18
Personal safety while riding 103 4.10
Drivers operate vehicles in a safe and responsible manner 102 4.24
Vehicles are environmentally friendly 102 4.06
Personal safety while waiting 101 3.95
Hours of operation for transit service meet my needs 101 3.94
Routes go where I need to go 100 4.08
Fares are easy to understand 99 4.23
Transferring is easy 99 4.16
Easy to identify the right bus 98 4.19
Vehicles are comfortable 98 4.06
Vehicles are clean 97 3.87
Information at bus stops 97 3.82
Reliability – service is on schedule 96 3.77
Availability of seats 95 3.84
Paying my fare is easy 93 4.37
Drivers calling out street names 89 3.70
Shelter conditions/cleanliness 83 3.54
BUS
Note: 2014 bus based on weighted data
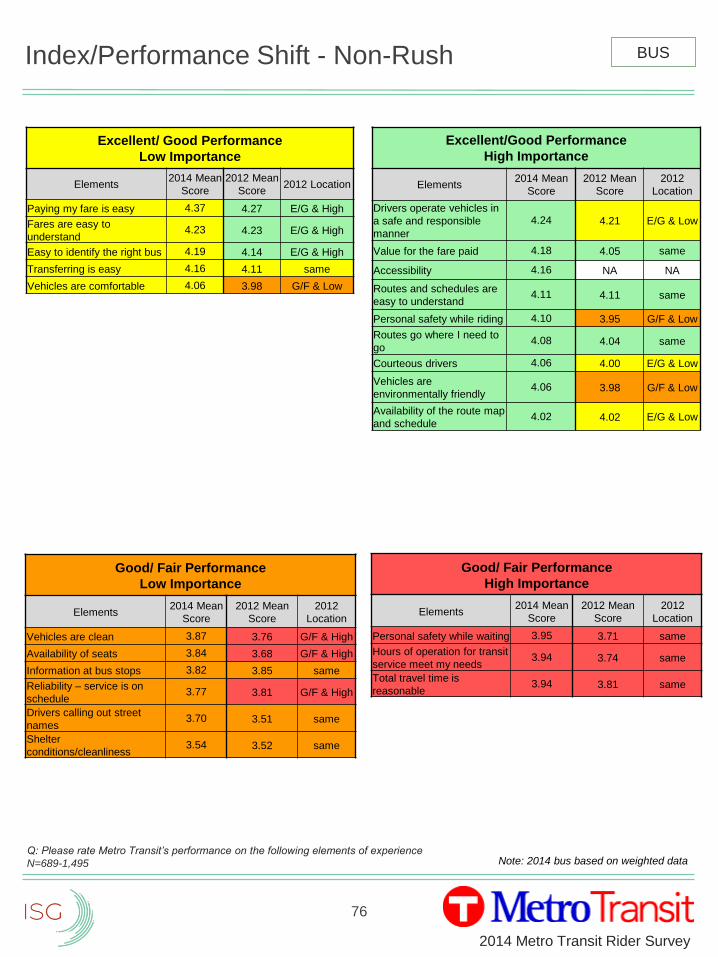
76
2014 Metro Transit Rider Survey
Index/Performance Shift - Non-Rush
Q: Please rate Metro Transit’s performance on the following elements of experience
N=689-1,495
Excellent/ Good Performance
Low Importance
Elements2014 Mean
Score
2012 Mean
Score2012 Location
Paying my fare is easy 4.37 4.27 E/G & High
Fares are easy to
understand4.23 4.23 E/G & High
Easy to identify the right bus 4.19 4.14 E/G & High
Transferring is easy 4.16 4.11 same
Vehicles are comfortable 4.06 3.98 G/F & Low
BUS
Good/ Fair Performance
High Importance
Elements2014 Mean
Score
2012 Mean
Score
2012
Location
Personal safety while waiting 3.95 3.71 same
Hours of operation for transit
service meet my needs3.94 3.74 same
Total travel time is
reasonable3.94 3.81 same
Excellent/Good Performance
High Importance
Elements2014 Mean
Score
2012 Mean
Score
2012
Location
Drivers operate vehicles in
a safe and responsible
manner
4.24 4.21 E/G & Low
Value for the fare paid 4.18 4.05 same
Accessibility 4.16 NA NA
Routes and schedules are
easy to understand4.11 4.11 same
Personal safety while riding 4.10 3.95 G/F & Low
Routes go where I need to
go4.08 4.04 same
Courteous drivers 4.06 4.00 E/G & Low
Vehicles are
environmentally friendly4.06 3.98 G/F & Low
Availability of the route map
and schedule4.02 4.02 E/G & Low
Good/ Fair Performance
Low Importance
Elements2014 Mean
Score
2012 Mean
Score
2012
Location
Vehicles are clean 3.87 3.76 G/F & High
Availability of seats 3.84 3.68 G/F & High
Information at bus stops 3.82 3.85 same
Reliability – service is on
schedule3.77 3.81 G/F & High
Drivers calling out street
names3.70 3.51 same
Shelter
conditions/cleanliness3.54 3.52 same
Note: 2014 bus based on weighted data

77
2014 Metro Transit Rider Survey
Performance Priorities for Bus
N=538 – 4,726
High = Mean of 0 – 3.99 and Importance of 101 to 150
Moderate = Mean of 4.00 – 4.05 and Importance of 101 to 150 OR Mean of 0 – 3.99 and Importance of 100
Performance Areas OVERALL Express Local Rush Non-Rush
Total travel time is reasonable High Moderate High High High
Personal safety while riding Moderate Moderate Moderate
Accessibility
Transferring is easy
Value for the fare paid
Courteous drivers Moderate Moderate
Drivers operate vehicles in a safe and
responsible manner
Routes go where I need to go Moderate Moderate Moderate
Vehicles are comfortable Moderate High Moderate High
Reliability – service is on
scheduleHigh High Moderate High
Hours of operation for transit service
meet my needsModerate Moderate High Moderate High
Personal safety while waiting Moderate Moderate Moderate High
Easy to identify the right bus
Availability of the route map and
scheduleModerate Moderate
Routes and schedules are easy to
understand
Vehicles are environmentally friendly
Vehicles are clean High
Availability of seats High
Drivers calling out street names
Fares are easy to understand
Information at bus stops
Shelter conditions/cleanliness High
Paying my fare is easy
BUS
Note: 2014 bus based on weighted data
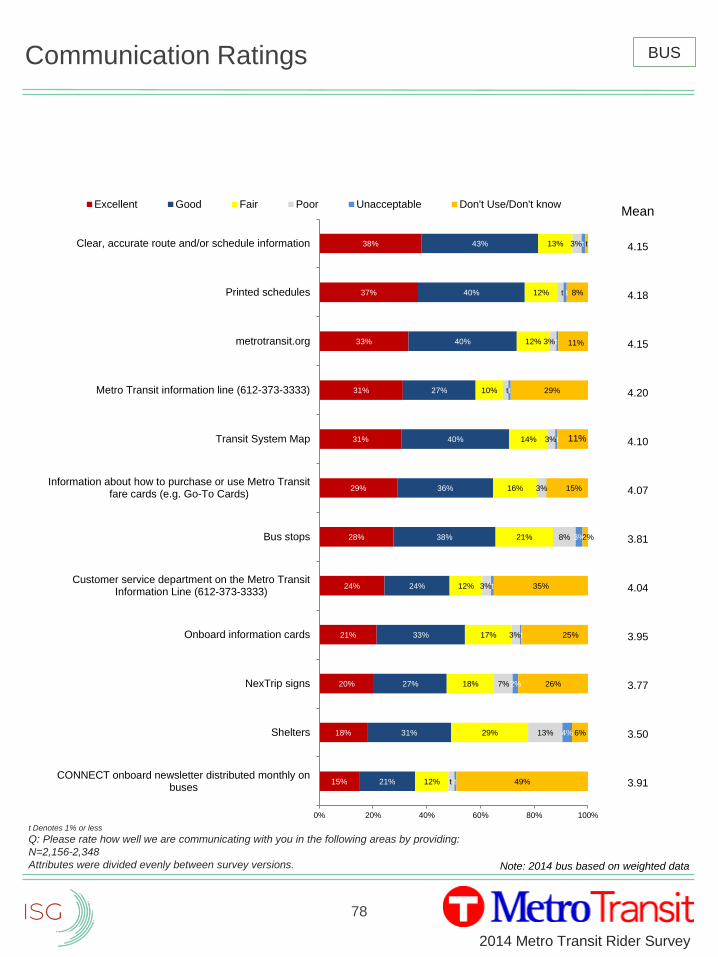
78
2014 Metro Transit Rider Survey
Communication Ratings
t Denotes 1% or less
Q: Please rate how well we are communicating with you in the following areas by providing:
N=2,156-2,348
Attributes were divided evenly between survey versions.
15%
18%
20%
21%
24%
28%
29%
31%
31%
33%
37%
38%
21%
31%
27%
33%
24%
38%
36%
40%
27%
40%
40%
43%
12%
29%
18%
17%
12%
21%
16%
14%
10%
12%
12%
13%
t t
13%
7%
3%t
3%t
8%
3%
3%t
tt
3%t
t t
3%t
4%
2%
3%
49%
6%
26%
25%
35%
2%
15%
29%
11%
8%
t
0% 20% 40% 60% 80% 100%
CONNECT onboard newsletter distributed monthly onbuses
Shelters
NexTrip signs
Onboard information cards
Customer service department on the Metro TransitInformation Line (612-373-3333)
Bus stops
Information about how to purchase or use Metro Transitfare cards (e.g. Go-To Cards)
Transit System Map
Metro Transit information line (612-373-3333)
metrotransit.org
Printed schedules
Clear, accurate route and/or schedule information
Excellent Good Fair Poor Unacceptable Don't Use/Don't knowMean
4.15
4.18
4.15
4.20
4.10
4.07
3.81
4.04
3.95
3.77
3.50
3.91
11%
BUS
Note: 2014 bus based on weighted data
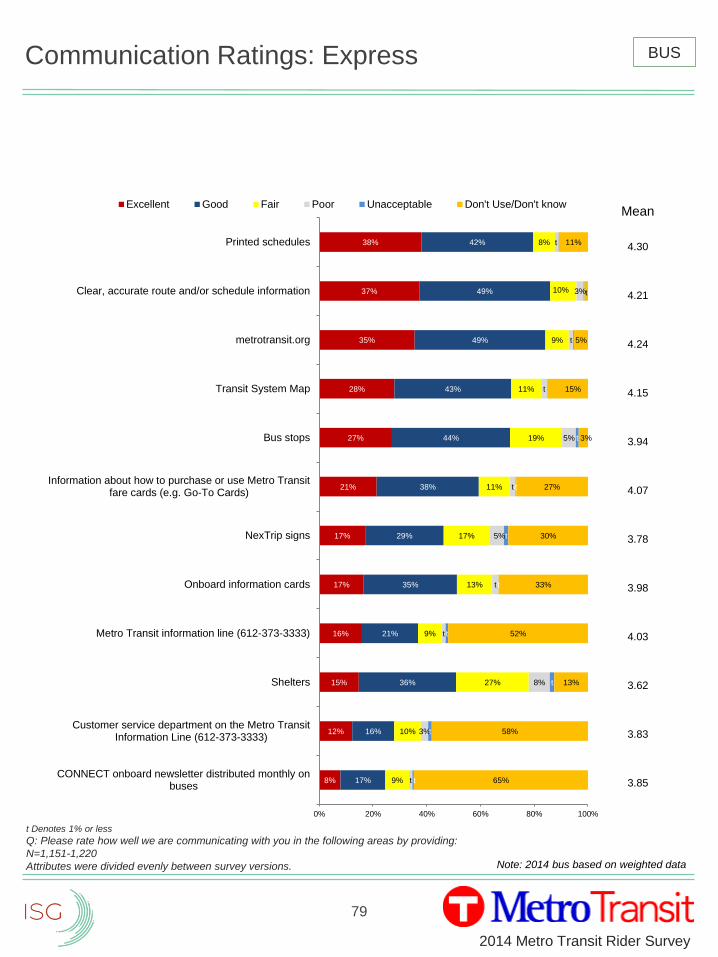
79
2014 Metro Transit Rider Survey
Communication Ratings: Express
t Denotes 1% or less
Q: Please rate how well we are communicating with you in the following areas by providing:
N=1,151-1,220
Attributes were divided evenly between survey versions.
8%
12%
15%
16%
17%
17%
21%
27%
28%
35%
37%
38%
17%
16%
36%
21%
35%
29%
38%
44%
43%
49%
49%
42%
9%
10%
27%
9%
13%
17%
11%
19%
11%
9%
10%
8%
t
3%
8%
t
t
5%
t
5%
t
3%
t
t
t
t
t
t
t
t
t
t
65%
58%
13%
52%
33%
30%
27%
3%
15%
5%
t
11%
0% 20% 40% 60% 80% 100%
CONNECT onboard newsletter distributed monthly onbuses
Customer service department on the Metro TransitInformation Line (612-373-3333)
Shelters
Metro Transit information line (612-373-3333)
Onboard information cards
NexTrip signs
Information about how to purchase or use Metro Transitfare cards (e.g. Go-To Cards)
Bus stops
Transit System Map
metrotransit.org
Clear, accurate route and/or schedule information
Printed schedules
Excellent Good Fair Poor Unacceptable Don't Use/Don't knowMean
4.30
4.21
4.24
4.15
3.94
4.07
3.78
3.98
4.03
3.62
3.83
3.85
BUS
Note: 2014 bus based on weighted data
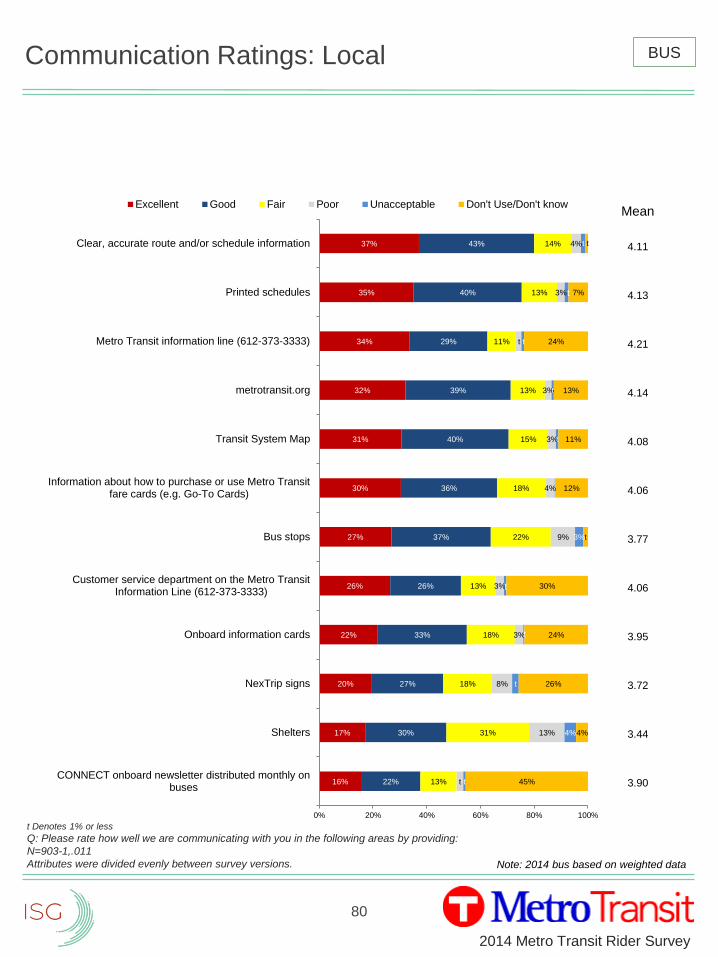
80
2014 Metro Transit Rider Survey
Communication Ratings: Local
t Denotes 1% or less
Q: Please rate how well we are communicating with you in the following areas by providing:
N=903-1,.011
Attributes were divided evenly between survey versions.
16%
17%
20%
22%
26%
27%
30%
31%
32%
34%
35%
37%
22%
30%
27%
33%
26%
37%
36%
40%
39%
29%
40%
43%
13%
31%
18%
18%
13%
22%
18%
15%
13%
11%
13%
14%
t
13%
8%
3%
3%
9%
4%
3%
3%
t t
3%
4%
t
4%
t
3%
t
t
45%
4%
26%
24%
30%
t
12%
11%
13%
24%
7%
0% 20% 40% 60% 80% 100%
CONNECT onboard newsletter distributed monthly onbuses
Shelters
NexTrip signs
Onboard information cards
Customer service department on the Metro TransitInformation Line (612-373-3333)
Bus stops
Information about how to purchase or use Metro Transitfare cards (e.g. Go-To Cards)
Transit System Map
metrotransit.org
Metro Transit information line (612-373-3333)
Printed schedules
Clear, accurate route and/or schedule information
Excellent Good Fair Poor Unacceptable Don't Use/Don't knowMean
4.11
4.13
4.21
4.14
4.08
4.06
3.77
4.06
3.95
3.72
3.44
3.90
t
t
t
BUS
Note: 2014 bus based on weighted data
t t

81
2014 Metro Transit Rider Survey
Communication Ratings – Express/Local
Q: Please rate how well we are communicating with you in the following areas by providing:
N=903-2,348
Attributes were divided evenly between survey versions.
3.44
3.72
3.77
3.90
3.95
4.06*
4.06
4.08
4.14
4.11
4.13
4.21*
3.62*
3.78
3.94*
3.85
3.98
3.83
4.07
4.15
4.24*
4.21*
4.30*
4.03
3.50
3.77
3.81
3.91
3.95
4.04
4.07
4.10
4.15
4.15
4.18
4.20
1.00 2.00 3.00 4.00 5.00
Shelters
NexTrip signs
Bus stops
CONNECT onboard newsletter distributed monthly on buses
Onboard information cards
Customer service on the Metro Transit Information Line(612-373-3333)
Information about how to purchase or use Metro Transit farecards (e.g. Go-To Cards)
Transit System Map
metrotransit.org
Clear, accurate route and/or schedule information
Printed schedules
Metro Transit information line (612-373-3333)
Total Express Local
*Statistically significant difference
BUS
Note: 2014 bus based on weighted data
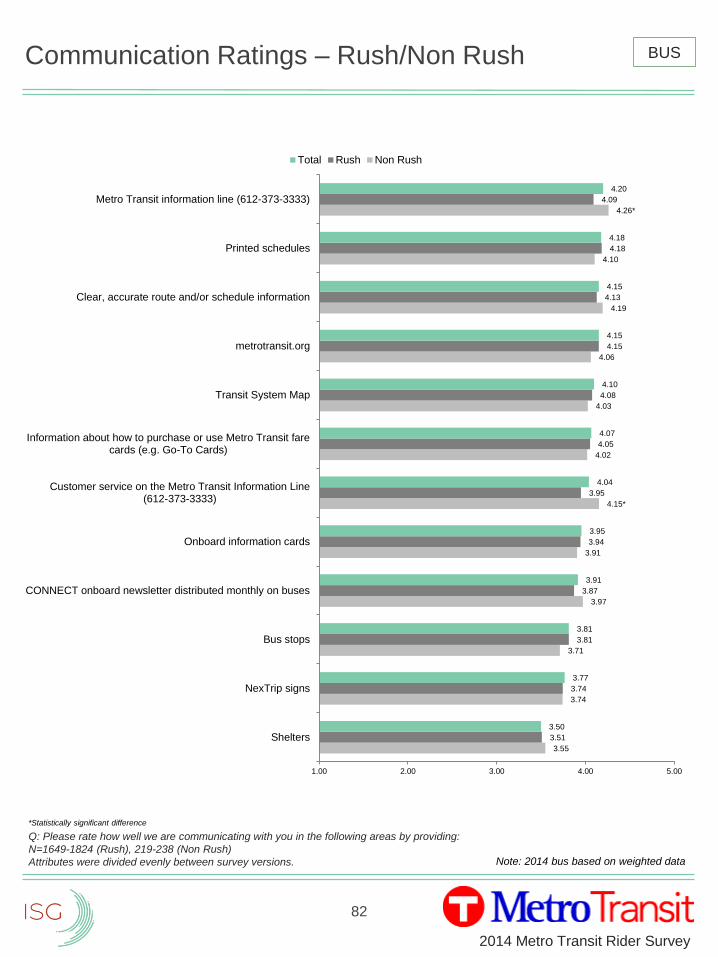
82
2014 Metro Transit Rider Survey
Communication Ratings – Rush/Non Rush
Q: Please rate how well we are communicating with you in the following areas by providing:
N=1649-1824 (Rush), 219-238 (Non Rush)
Attributes were divided evenly between survey versions.
*Statistically significant difference
BUS
Note: 2014 bus based on weighted data
3.55
3.74
3.71
3.97
3.91
4.15*
4.02
4.03
4.06
4.19
4.10
4.26*
3.51
3.74
3.81
3.87
3.94
3.95
4.05
4.08
4.15
4.13
4.18
4.09
3.50
3.77
3.81
3.91
3.95
4.04
4.07
4.10
4.15
4.15
4.18
4.20
1.00 2.00 3.00 4.00 5.00
Shelters
NexTrip signs
Bus stops
CONNECT onboard newsletter distributed monthly on buses
Onboard information cards
Customer service on the Metro Transit Information Line(612-373-3333)
Information about how to purchase or use Metro Transit farecards (e.g. Go-To Cards)
Transit System Map
metrotransit.org
Clear, accurate route and/or schedule information
Printed schedules
Metro Transit information line (612-373-3333)
Total Rush Non Rush
2014 Metro Transit Rider Survey
83
Bus Trend Data

84
2014 Metro Transit Rider Survey
Bus Rider Surveys
DISTRIBUTED SURVEYS
Total Distributed 17,000
COMPLETED RETURNS
Total Collected 5,461 (32%)
Collected 3,853
Mail Returns: 851
Online: 286
Intercepts: 471

85
2014 Metro Transit Rider Survey
Bus Rider Snapshot
4%
12%
19%
15%
24%
24%
1%
6%*
13%
17%*
14%
25%
21%
4%
65 or Over
55-64
45-54
35-44
25-34
18-24
Under 18
Age
6%
2%
6%
3%
6%
30%
52%
8%
3%
5%*
3%
6%
30%
54%
Hispanic/Latino
Other
Mixed Race
American Indian
Asian
African American
Caucasian
Race
20
%*
12
% 15
%*
13
%
13
%
12
%
6%
6%
3%
26
%
11
% 13
%
13
%
12
%
11
%
6%
5%
3%
<10 10-14 15-24 25-34 35-49 50-74 75-99 100-149 150+
Thousands ($)
Household Income 2014
2012
Demographics• Top zip code origins: 55407,
55404, 55106, 55411
• Top zip code destinations:
55402, 55404, 55101, 55403
• Half of riders are under 35 and
65+ is increasing
• Nearly half of riders are non-
white.
• Annual HH income has
remained stable since 2012
apart from a drop for those
making less than $10K
• 52% female
Note: Bus data are weighted
* Statistically significant difference 2014 to 2012
RIDERSHIP• Majority (54)% ride on both
weekdays and weekends.
• Nearly three-quarters ride at least
five times a week (74%).
• Work is the primary trip purpose
(56%), followed by
shopping/errands (21%) and
school (17%).
• 52% have no working
automobiles available for use.
• The demographic and attitudinal
profile of local riders is
significantly different than that of
express riders.
INFLUENCES• 29% report their employer or an
organization they are involved with
offer transit passes, and of those,
57% cover part of the cost.
• Friends, family and coworkers
(33%), school (19%), new
home/work location (17%) and
unreliable personal transportation
(17%) are the top influences to first
try transit.
PREFERENCES• For 45%, living or working close to
transit is the main reason for using
transit, followed by saving money
on parking (38%).
• 46% use metrotransit.org as their
most popular source for transit
information with the primary
features being route/schedule
pages and Trip Planner.
• 78% use Go-To technology to pay
their fare.
METRO TRANSIT RATINGS
High Correlation, High Performance• Accessibility
• Transferring is easy
• Value for the fare paid
• Drivers operate vehicles in a safe
and responsible manner
High Correlation, Lower Performance• Total travel time is reasonable
• Reliability – service is on schedule
• In addition, personal safety while
riding, courteous drivers, routes go
where I need to go, vehicles are
comfortable, hours of operation
meet my needs and personal safety
while waiting warrant attention.
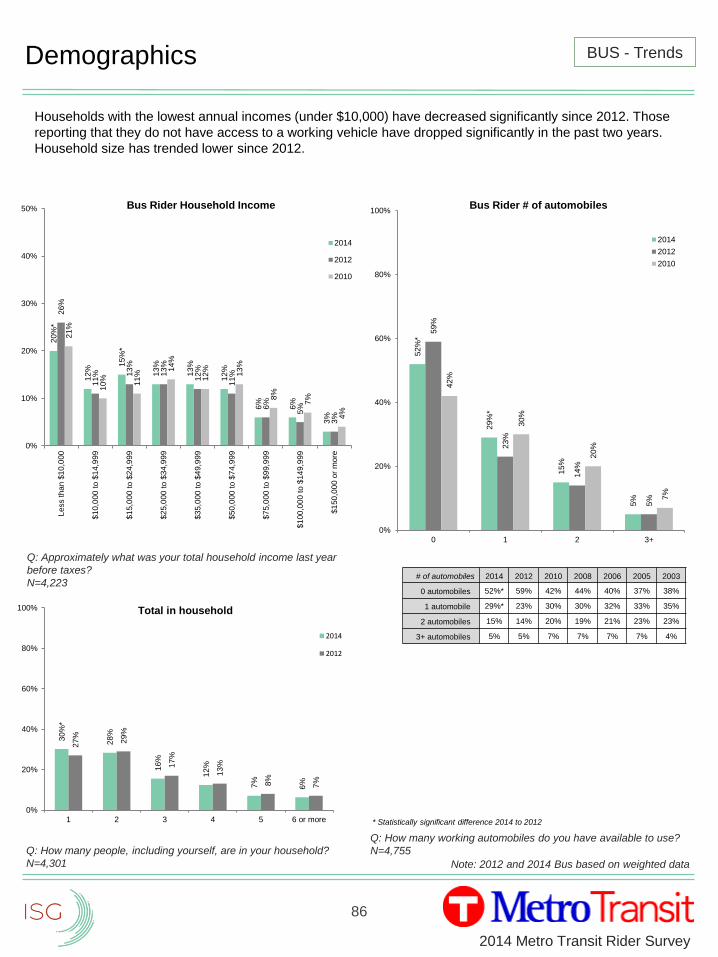
86
2014 Metro Transit Rider Survey
Demographics
Q: Approximately what was your total household income last year
before taxes?
N=4,223
Q: How many working automobiles do you have available to use?
N=4,755
20
%*
12
%
15
%*
13
%
13
%
12
%
6%
6%
3%
26
%
11
% 13
%
13
%
12
%
11
%
6%
5%
3%
21
%
10
%
11
%
14
%
12
%
13
%
8%
7%
4%
0%
10%
20%
30%
40%
50%
Le
ss th
an
$1
0,0
00
$1
0,0
00
to
$1
4,9
99
$1
5,0
00
to
$2
4,9
99
$2
5,0
00
to
$3
4,9
99
$3
5,0
00
to
$4
9,9
99
$5
0,0
00
to
$7
4,9
99
$7
5,0
00
to
$9
9,9
99
$1
00
,00
0 t
o $
14
9,9
99
$1
50
,00
0 o
r m
ore
Bus Rider Household Income
2014
2012
2010
52
%*
29
%*
15
%
5%
59
%
23
%
14
%
5%
42
%
30
%
20
%
7%
0%
20%
40%
60%
80%
100%
0 1 2 3+
Bus Rider # of automobiles
2014
2012
2010
# of automobiles 2014 2012 2010 2008 2006 2005 2003
0 automobiles 52%* 59% 42% 44% 40% 37% 38%
1 automobile 29%* 23% 30% 30% 32% 33% 35%
2 automobiles 15% 14% 20% 19% 21% 23% 23%
3+ automobiles 5% 5% 7% 7% 7% 7% 4%
30
%*
28
%
16
%
12
%
7%
6%
27
%
29
%
17
%
13
%
8%
7%
0%
20%
40%
60%
80%
100%
1 2 3 4 5 6 or more
Total in household
2014
2012
Q: How many people, including yourself, are in your household?
N=4,301 Note: 2012 and 2014 Bus based on weighted data
BUS - Trends
* Statistically significant difference 2014 to 2012
Households with the lowest annual incomes (under $10,000) have decreased significantly since 2012. Those
reporting that they do not have access to a working vehicle have dropped significantly in the past two years.
Household size has trended lower since 2012.
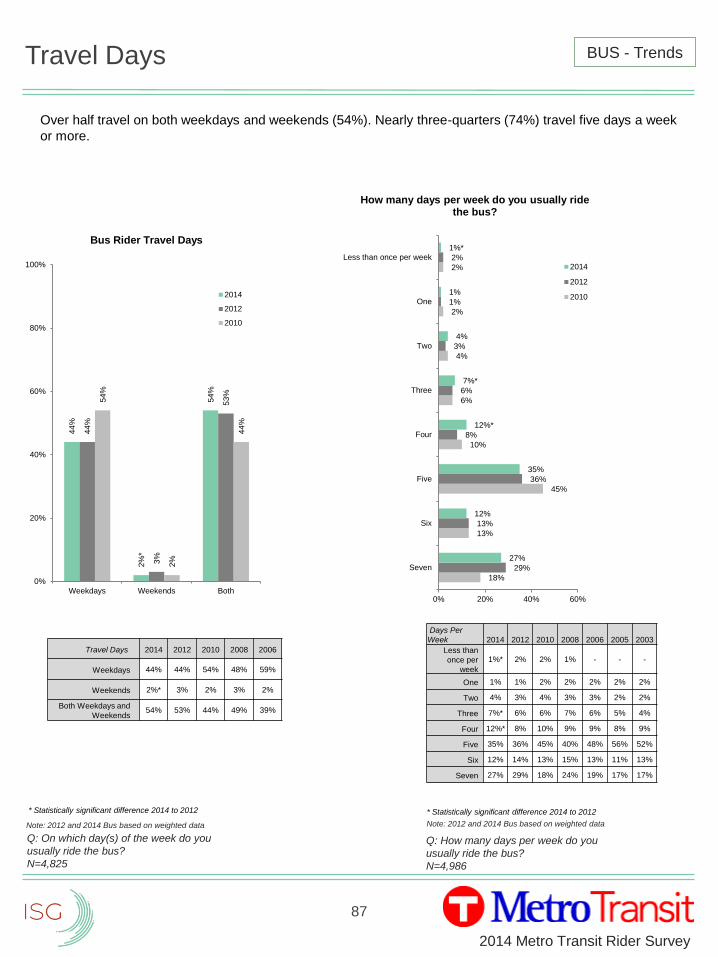
87
2014 Metro Transit Rider Survey
Travel Days
Q: On which day(s) of the week do you
usually ride the bus?
N=4,825
Q: How many days per week do you
usually ride the bus?
N=4,986
44
%
2%
*
54
%
44
%
3%
53
%
54
%
2%
44
%
0%
20%
40%
60%
80%
100%
Weekdays Weekends Both
Bus Rider Travel Days
2014
2012
2010
18%
13%
45%
10%
6%
4%
2%
2%
29%
13%
36%
8%
6%
3%
1%
2%
27%
12%
35%
12%*
7%*
4%
1%
1%*
0% 20% 40% 60%
Seven
Six
Five
Four
Three
Two
One
Less than once per week
How many days per week do you usually ride the bus?
2014
2012
2010
Days Per
Week 2014 2012 2010 2008 2006 2005 2003
Less than
once per
week
1%* 2% 2% 1% - - -
One 1% 1% 2% 2% 2% 2% 2%
Two 4% 3% 4% 3% 3% 2% 2%
Three 7%* 6% 6% 7% 6% 5% 4%
Four 12%* 8% 10% 9% 9% 8% 9%
Five 35% 36% 45% 40% 48% 56% 52%
Six 12% 14% 13% 15% 13% 11% 13%
Seven 27% 29% 18% 24% 19% 17% 17%
Travel Days 2014 2012 2010 2008 2006
Weekdays 44% 44% 54% 48% 59%
Weekends 2%* 3% 2% 3% 2%
Both Weekdays and
Weekends54% 53% 44% 49% 39%
Note: 2012 and 2014 Bus based on weighted data Note: 2012 and 2014 Bus based on weighted data
BUS - Trends
* Statistically significant difference 2014 to 2012* Statistically significant difference 2014 to 2012
Over half travel on both weekdays and weekends (54%). Nearly three-quarters (74%) travel five days a week
or more.
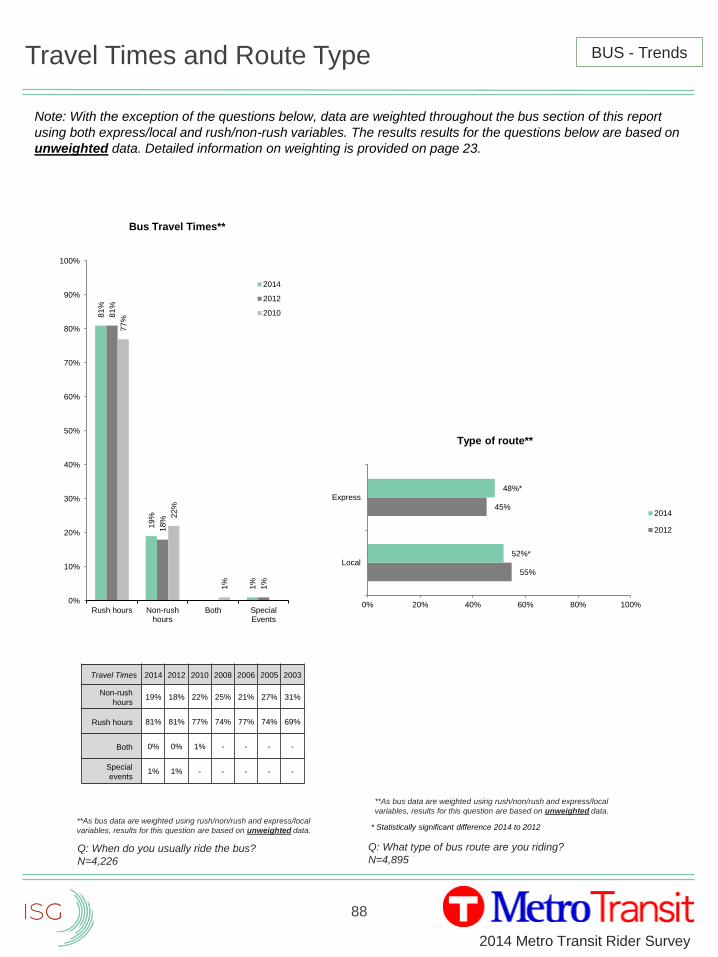
88
2014 Metro Transit Rider Survey
Travel Times and Route Type
55%
45%
52%*
48%*
0% 20% 40% 60% 80% 100%
Local
Express
Type of route**
2014
2012
Q: What type of bus route are you riding?
N=4,895
BUS - Trends
81
%
19
%
1%
81
%
18
%
1%
77
%
22
%
1%
0%
10%
20%
30%
40%
50%
60%
70%
80%
90%
100%
Rush hours Non-rushhours
Both SpecialEvents
Bus Travel Times**
2014
2012
2010
Travel Times 2014 2012 2010 2008 2006 2005 2003
Non-rush
hours19% 18% 22% 25% 21% 27% 31%
Rush hours 81% 81% 77% 74% 77% 74% 69%
Both 0% 0% 1% - - - -
Special
events1% 1% - - - - -
Q: When do you usually ride the bus?
N=4,226
* Statistically significant difference 2014 to 2012
Note: With the exception of the questions below, data are weighted throughout the bus section of this report
using both express/local and rush/non-rush variables. The results results for the questions below are based on
unweighted data. Detailed information on weighting is provided on page 23.
**As bus data are weighted using rush/non/rush and express/local
variables, results for this question are based on unweighted data.
**As bus data are weighted using rush/non/rush and express/local
variables, results for this question are based on unweighted data.
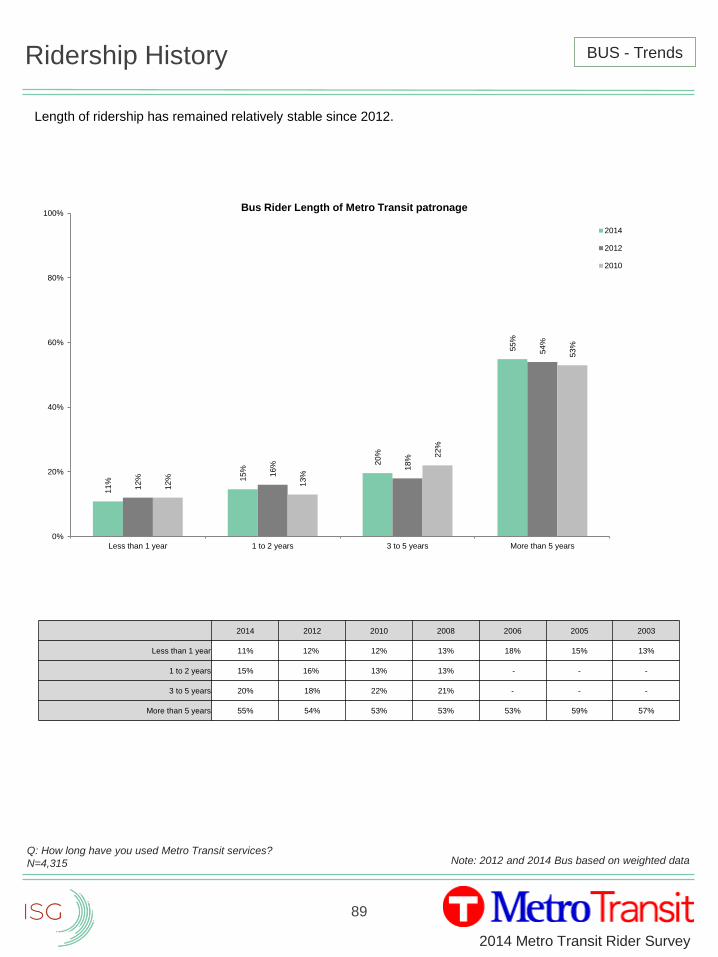
89
2014 Metro Transit Rider Survey
Ridership History
Q: How long have you used Metro Transit services?
N=4,315
11
% 15
%
20
%
55
%
12
%
16
% 18
%
54
%
12
%
13
%
22
%
53
%
0%
20%
40%
60%
80%
100%
Less than 1 year 1 to 2 years 3 to 5 years More than 5 years
Bus Rider Length of Metro Transit patronage
2014
2012
2010
2014 2012 2010 2008 2006 2005 2003
Less than 1 year 11% 12% 12% 13% 18% 15% 13%
1 to 2 years 15% 16% 13% 13% - - -
3 to 5 years 20% 18% 22% 21% - - -
More than 5 years 55% 54% 53% 53% 53% 59% 57%
Note: 2012 and 2014 Bus based on weighted data
BUS - Trends
Length of ridership has remained relatively stable since 2012.
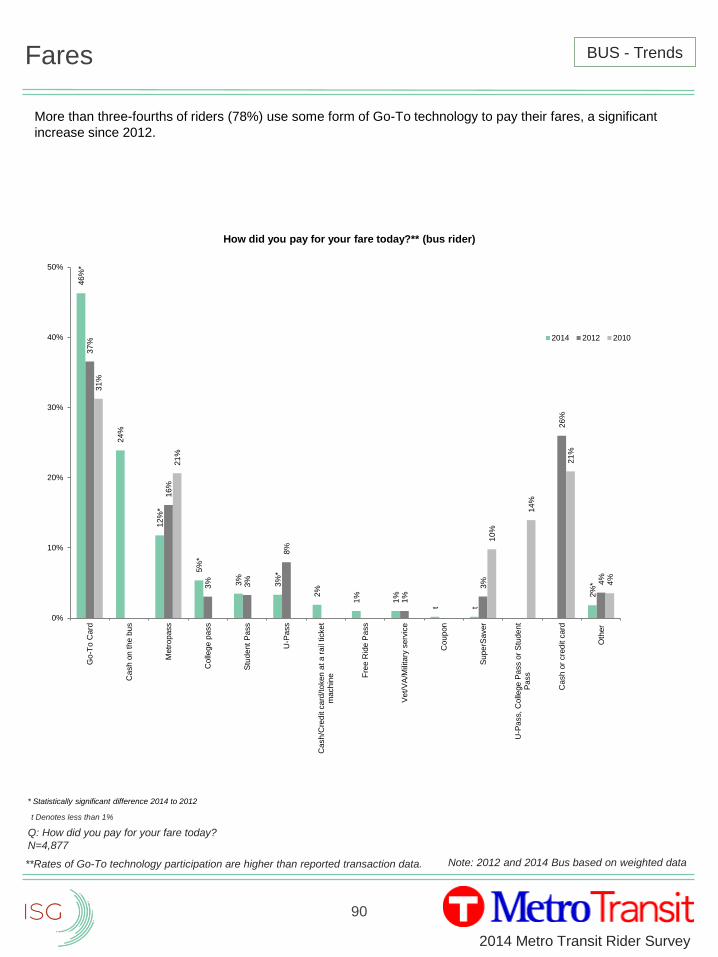
90
2014 Metro Transit Rider Survey
Fares
Q: How did you pay for your fare today?
N=4,877
46
%*
24
%
12
%*
5%
*
3%
3%
*
2%
1%
1%
t t
2%
*
37
%
16
%
3% 3%
8%
1%
3%
26
%
4%
31
%
21
%
10
%
14
%
21
%
4%
0%
10%
20%
30%
40%
50%
Go
-To
Card
Cash
on
th
e b
us
Metr
op
ass
Colle
ge
pa
ss
Stu
de
nt
Pa
ss
U-P
ass
Cash
/Cre
dit c
ard
/to
ken
at
a r
ail
ticket
mach
ine F
ree
Rid
e P
ass
Ve
t/V
A/M
ilita
ry s
erv
ice
Cou
pon
Su
pe
rSa
ver
U-P
ass,
Colle
ge
Pa
ss o
r S
tud
en
tP
ass
Cash
or
cre
dit c
ard
Oth
er
How did you pay for your fare today?** (bus rider)
2014 2012 2010
Note: 2012 and 2014 Bus based on weighted data
BUS - Trends
**Rates of Go-To technology participation are higher than reported transaction data.
t Denotes less than 1%
More than three-fourths of riders (78%) use some form of Go-To technology to pay their fares, a significant
increase since 2012.
* Statistically significant difference 2014 to 2012
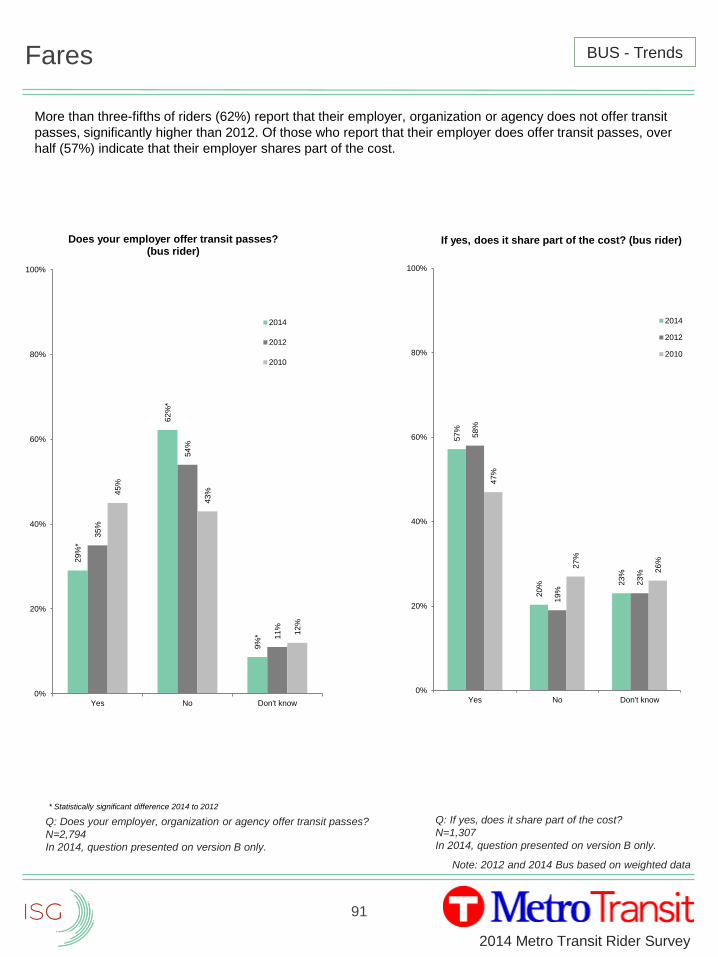
91
2014 Metro Transit Rider Survey
Fares
Q: Does your employer, organization or agency offer transit passes?
N=2,794
In 2014, question presented on version B only.
Q: If yes, does it share part of the cost?
N=1,307
In 2014, question presented on version B only.
29
%*
62
%*
9%
*
35
%
54
%
11
%
45
%
43
%
12
%
0%
20%
40%
60%
80%
100%
Yes No Don't know
Does your employer offer transit passes? (bus rider)
2014
2012
2010
57
%
20
% 23
%
58
%
19
%
23
%
47
%
27
%
26
%
0%
20%
40%
60%
80%
100%
Yes No Don't know
If yes, does it share part of the cost? (bus rider)
2014
2012
2010
Note: 2012 and 2014 Bus based on weighted data
BUS - Trends
* Statistically significant difference 2014 to 2012
More than three-fifths of riders (62%) report that their employer, organization or agency does not offer transit
passes, significantly higher than 2012. Of those who report that their employer does offer transit passes, over
half (57%) indicate that their employer shares part of the cost.
92
2014 Metro Transit Rider Survey
Primary Purpose for Use
Q: What is the primary purpose of your trip today?
N=5,141
56
%
21
%*
17
%
10
%*
9%
*
2%
* 5%
*
58
%
17
%
15
%
14
%
5%
3%
7%
65
%
12
%
17
%
9%
5%
2%
6%
0%
20%
40%
60%
80%
100%
Work Shopping/Errands School Social/Entertainment Medical Sporting or SpecialEvent
Other
What is the primary purpose of your bus trip today?**
2014
2012
2010
Primary purpose 2014 2012 2010 2008 2006 2005 2003
Work 56% 58% 65% 62% 65% 78% 75%
Shopping/Errands 21%* 17% 12% 12% 6% 4% 6%
School 17% 15% 17% 15% 14% 4% 8%
Social/Entertainment 10%* 14% 9% 16% 7% 6% 6%
Medical 9%* 5% 5% 5% 2% 2% 2%
Sporting or Special Event 2%* 3% 2% - - - -
Other 5%* 7% 6% 8% 5% 5% 4%
Note: 2012 and 2014 Bus based on weighted data
BUS - Trends
**Totals exceed 100% due to respondents selecting multiple responses.
* Statistically significant difference 2014 to 2012
Work remains the primary purpose of bus trips. Trips for shopping/errands and medical reasons have
increased significantly while social/entertainment trips have dropped significantly since 2012.
93
2014 Metro Transit Rider Survey
Influencers for Decision to First Try Transit
Q: What or who influenced your decision to first try transit?
N=4,734
15%
3%
2%
2%
2%
2%
10%
15%
17%
12%
15%
24%
8%
1%
1%
3%
1%
2%
2%
2%
3%
6%
10%
15%
19%
16%
21%
28%
12%*
1%*
2%
2%
2%
3%*
4%*
7%
11%
16%
17%*
17%
19%*
33%*
0% 10% 20% 30% 40% 50%
Other
Road construction
Metro Transit advertising or free ride promotion
Can't/Don't drive
Coupon/Free ride
Special events (e.g. State Fair, sporting events)
New routes or route changes
metrotransit.org
Light rail
Job change
Fuel prices/auto expenses
Employer or organization
Unreliable personal transportation
New home/work location
School
Friend, family or coworker
Transit Influencers
2014
2012
2010
Influencers 2014 2012 2010 2008 2006 2005 2003
Friend, family or coworker 33%* 28% 24% 29% 21% 11% 9%
School 19%* 21% 15% 20% 13% - -
New home /work location 17% 16% 12% - - - -
Unreliable personal transportation 17%* 19% 17% - - - -
Employer or organization 16% 15% 15% 21% 13% 12% 12%
Fuel prices/auto expenses 11% 10% - - - - -
Job change 7% 6% 10% - - - -
Light rail 4%* 3% - - - - -
metrotransit.org 3%* 2% 2% 3% 1% 1% 1%
New routes or route changes 2% 2% 2% - - - -
Special events (e.g. State Fair, sporting events) 2% 2% 2% 3% 1% 1% 1%
Coupon/Free ride 2% 1% 2% - - - -
Can’t/Don’t drive 1%* 3% - - - - -
Road construction 0% 1% - - - - -
Metro Transit advertising or information 0% 1% 3% 6% 2% - -
Other 12%* 8% 15% 27% 8% 11% 7%
Note: 2012 and 2014 Bus based on weighted data
BUS - Trends
* Statistically significant difference 2014 to 2012
Friend, family or coworker is the most frequently cited influence in a rider’s decision to first try transit. Those
indicating that school and unreliable personal transportation is the influence to first try transit decreased
significantly since 2012.
94
2014 Metro Transit Rider Survey
Travel Details
Q: What is your home Zip Code?
N=4,622
Q: What is the Zip Code of your final destination TODAY?
N=3,527
BUS - Trends
Top origination zip codes
2014 2012 2010 2008 2006
Zip Code % Zip Code % Zip Code % Zip Code % Zip Code %
55407 4.8% 55411 5.7% 55408 4.8% 55414 4.5% 55407 4.2%
55404 4.7% 55414 4.5% 55411 3.5% 55411 4.2% 55106 4.1%
55106 4.3% 55106 4.4% 55404 3.4% 55404 4.1% 55408 4.1%
55411 3.8% 55404 4.3% 55403 3.0% 55407 4.0% 55414 3.9%
55408 3.4% 55104 4.2% 55406 3.0% 55408 3.8% 55411 3.4%
55104 2.9% 55408 3.1% 55107 2.8% 55418 3.1% 55404 3.1%
55412 2.7% 55412 3.1% 55414 2.7% 55412 3.0% 55104 2.9%
55417 2.7% 55403 2.8% 55104 2.6% 55104 2.9% 55403 2.6%
55418 2.7% 55105 2.5% 55419 2.2% 55106 2.9% 55406 2.4%
55102 2.6% 55407 2.5% 55405 2.1% 55403 2.9% 55102 2.3%
55403 2.6% 55102 2.4%
Top destination zip codes
2014 2012 2010 2008 2006
Zip Code % Zip Code % Zip Code % Zip Code % Zip Code %
55402 11.4% 55402 11.5% 55402 17.0% 55402 14.6% 55402 16.4%
55404 5.2% 55455 5.2% 55455 7.6% 55455 6.1% 55455 6.8%
55101 4.8% 55101 4.4% 55101 4.7% 55403 5.4% 55101 5.3%
55403 4.7% 55411 4.4% 55401 4.5% 55101 3.9% 55401 4.6%
55102 4.1% 55104 4.2% 55403 4.1% 55401 3.8% 55403 4.5%
55401 3.8% 55401 3.9% 55404 3.6% 55414 3.6% 55102 3.6%
55407 3.7% 55403 3.7% 55102 3.2% 55411 3.5% 55414 3.5%
55411 3.1% 55102 3.4% 55411 3.1% 55404 3.4% 55404 3.3%
55106 2.9% 55414 3.3% 55114 3.1% 55102 3.3% 55104 3.0%
55408 2.9% 55404 3.2% 55407 2.6% 55408 3.2% 55411 3.0%
55104 2.8% 55407 2.9%
Note: 2012 and 2014 Bus based on weighted data
95
2014 Metro Transit Rider Survey
Travel Details
Q: When you began your trip today, how did you get to your first
bus stop or rail station?
N=2,477
In 2014, question presented on version A only. Q: How far would you estimate you traveled to get to your first bus
stop or rail station?
N=4,567Q: If “bicycled”, did you bring your bike with you on the bus?
N=28
In 2014, question presented on version A only.
77
%*
11
%
3%
1%
1%
6%
*
83
%
9%
4%
2%
1%
1%
74
%
17
%
4%
2%
2%
2%
0%
20%
40%
60%
80%
100%
Walked Drove to Park& Ride
Someone elsedrove me
Bicycled Drove to otherparking (e.g.
street parking)
Other
Transportation to first bus
2014
2012
2010
46
%*
12
%
10
%
9%
24
%
50
%
10
%
9%
8%
23
%
54
%
9%
7% 9
%
21
%
0%
20%
40%
60%
80%
100%
Less than 1/4mile
1/4 to 1/2 mile 1/2 to 1 mile 1 to 2 miles More than 2miles
Travel distance to bus
2014
2012
2010
21%
79%
21%
79%
2%
98%
No
Yes
Did you bring your bike on the bus?
2014
2012
2010
Note: 2012 and 2014 Bus based on weighted data
BUS - Trends
* Statistically significant difference 2014 to 2012
Over three-quarters (77%) of riders walk to their first bus stop, a significant decline since 2012. Nearly half
(46%) of riders report traveling less than a quarter mile to get to their first bus stop, also a significant decline
since 2012.
* Statistically significant difference 2014 to 2012
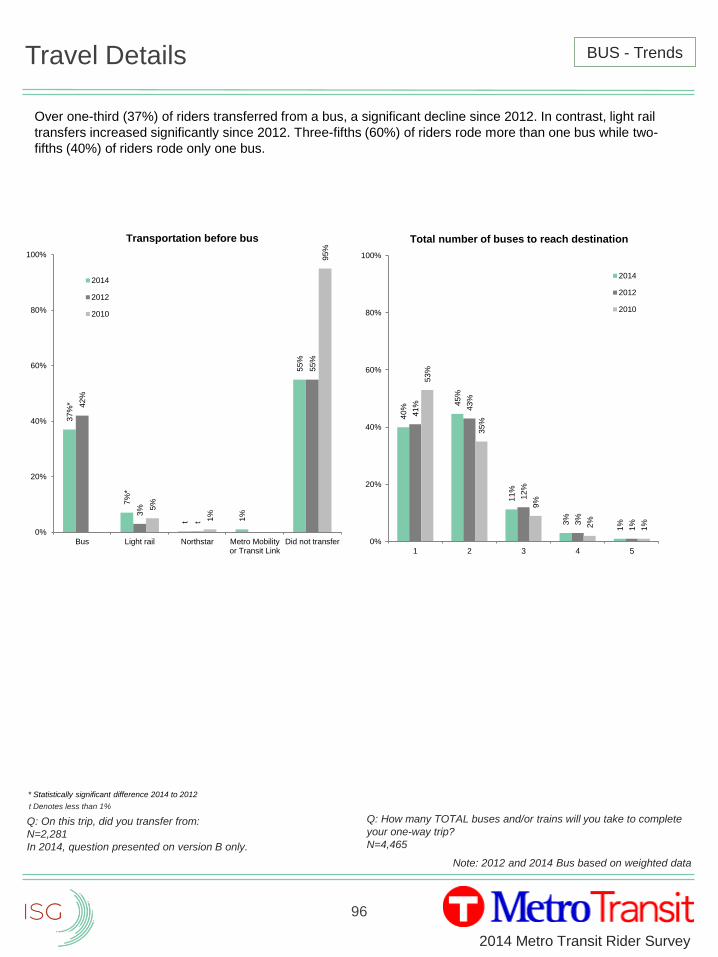
96
2014 Metro Transit Rider Survey
Travel Details
Q: How many TOTAL buses and/or trains will you take to complete
your one-way trip?
N=4,465
Q: On this trip, did you transfer from:
N=2,281
In 2014, question presented on version B only.
37
%*
7%
*
t 1%
55
%
42
%
3%
t
55
%
5%
1%
95
%
0%
20%
40%
60%
80%
100%
Bus Light rail Northstar Metro Mobilityor Transit Link
Did not transfer
Transportation before bus
2014
2012
2010
40
%
45
%
11
%
3%
1%
41
% 43
%
12
%
3%
1%
53
%
35
%
9%
2%
1%
0%
20%
40%
60%
80%
100%
1 2 3 4 5
Total number of buses to reach destination
2014
2012
2010
Note: 2012 and 2014 Bus based on weighted data
BUS - Trends
* Statistically significant difference 2014 to 2012
t Denotes less than 1%
Over one-third (37%) of riders transferred from a bus, a significant decline since 2012. In contrast, light rail
transfers increased significantly since 2012. Three-fifths (60%) of riders rode more than one bus while two-
fifths (40%) of riders rode only one bus.
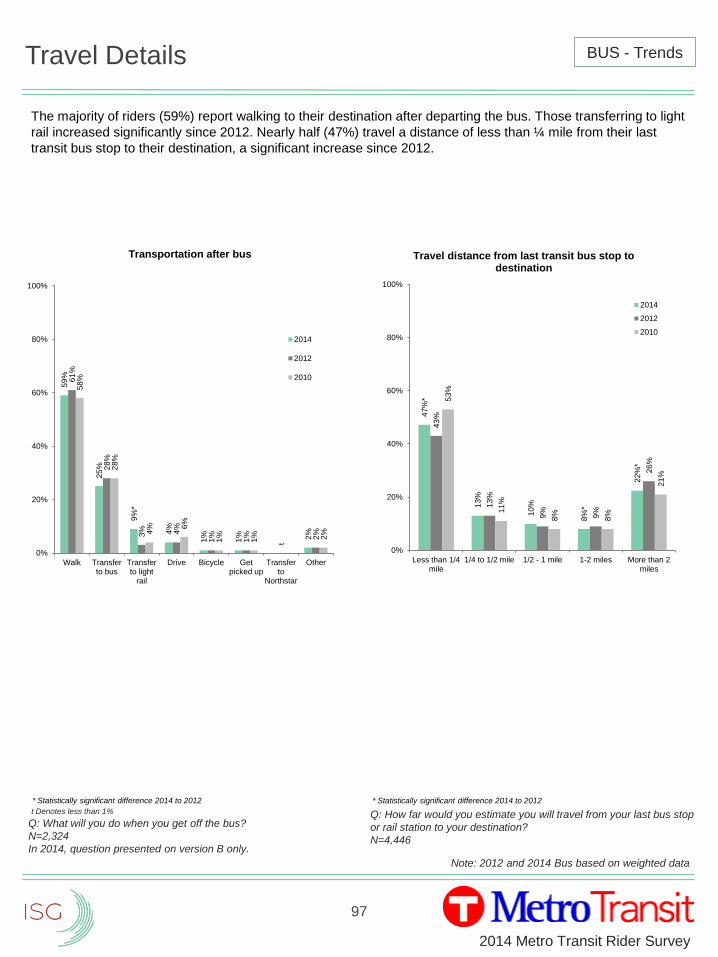
97
2014 Metro Transit Rider Survey
Travel Details
Q: How far would you estimate you will travel from your last bus stop
or rail station to your destination?
N=4,446
Q: What will you do when you get off the bus?
N=2,324
In 2014, question presented on version B only.
59
%
25
%
9%
*
4%
1%
1% 2%
61
%
28
%
3% 4%
1%
1%
t
2%
58
%
28
%
4% 6
%
1%
1% 2%
0%
20%
40%
60%
80%
100%
Walk Transferto bus
Transferto light
rail
Drive Bicycle Getpicked up
Transferto
Northstar
Other
Transportation after bus
2014
2012
2010
47
%*
13
%
10
%
8%
*
22
%*
43
%
13
%
9%
9%
26
%
53
%
11
%
8%
8%
21
%
0%
20%
40%
60%
80%
100%
Less than 1/4mile
1/4 to 1/2 mile 1/2 - 1 mile 1-2 miles More than 2miles
Travel distance from last transit bus stop to destination
2014
2012
2010
Note: 2012 and 2014 Bus based on weighted data
BUS - Trends
* Statistically significant difference 2014 to 2012
t Denotes less than 1%
* Statistically significant difference 2014 to 2012
The majority of riders (59%) report walking to their destination after departing the bus. Those transferring to light
rail increased significantly since 2012. Nearly half (47%) travel a distance of less than ¼ mile from their last
transit bus stop to their destination, a significant increase since 2012.

98
2014 Metro Transit Rider Survey
Travel Details
Q: Please estimate – in minutes – the total travel time of this trip.
N=4,225
Restated 2010 results to exclude blank responses
32
%*
43
%
13
%
6%
4%
*
2%
*
35
%
42
%
13
%
6%
3%
1%
36
%
42
%
14
%
5%
2%
1%
0%
10%
20%
30%
40%
50%
1-29 minutes 30-59 minutes 60-89 minutes 90-119 minutes 120-149 minutes 150+ minutes
Total bus travel time in minutes
2014
2012
2010
Note: 2012 and 2014 Bus based on weighted data
BUS - Trends
* Statistically significant difference 2014 to 2012
When asked to estimate their total travel time, approximately one-third (32%) indicate their commutes were
under thirty minutes, significantly lower than 2012. Riders reporting that their total travel time is longer than two
hours is increasing significantly since 2012.
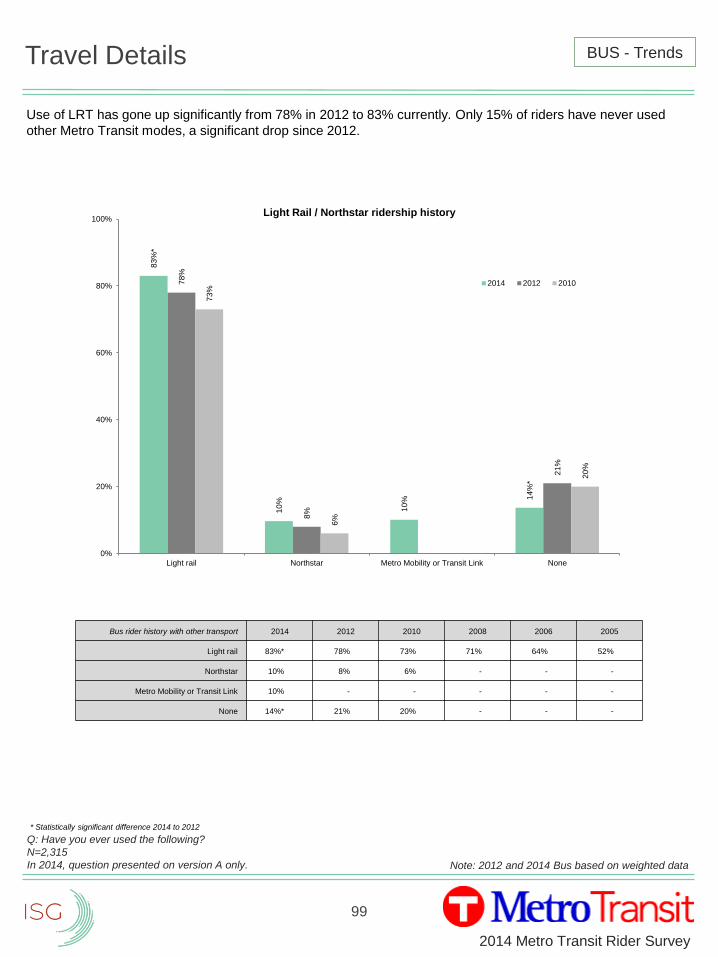
99
2014 Metro Transit Rider Survey
Travel Details
Q: Have you ever used the following?
N=2,315
In 2014, question presented on version A only.
83
%*
10
%
10
% 14
%*
78
%
8%
21
%
73
%
6%
20
%
0%
20%
40%
60%
80%
100%
Light rail Northstar Metro Mobility or Transit Link None
Light Rail / Northstar ridership history
2014 2012 2010
Bus rider history with other transport 2014 2012 2010 2008 2006 2005
Light rail 83%* 78% 73% 71% 64% 52%
Northstar 10% 8% 6% - - -
Metro Mobility or Transit Link 10% - - - - -
None 14%* 21% 20% - - -
Note: 2012 and 2014 Bus based on weighted data
BUS - Trends
* Statistically significant difference 2014 to 2012
Use of LRT has gone up significantly from 78% in 2012 to 83% currently. Only 15% of riders have never used
other Metro Transit modes, a significant drop since 2012.
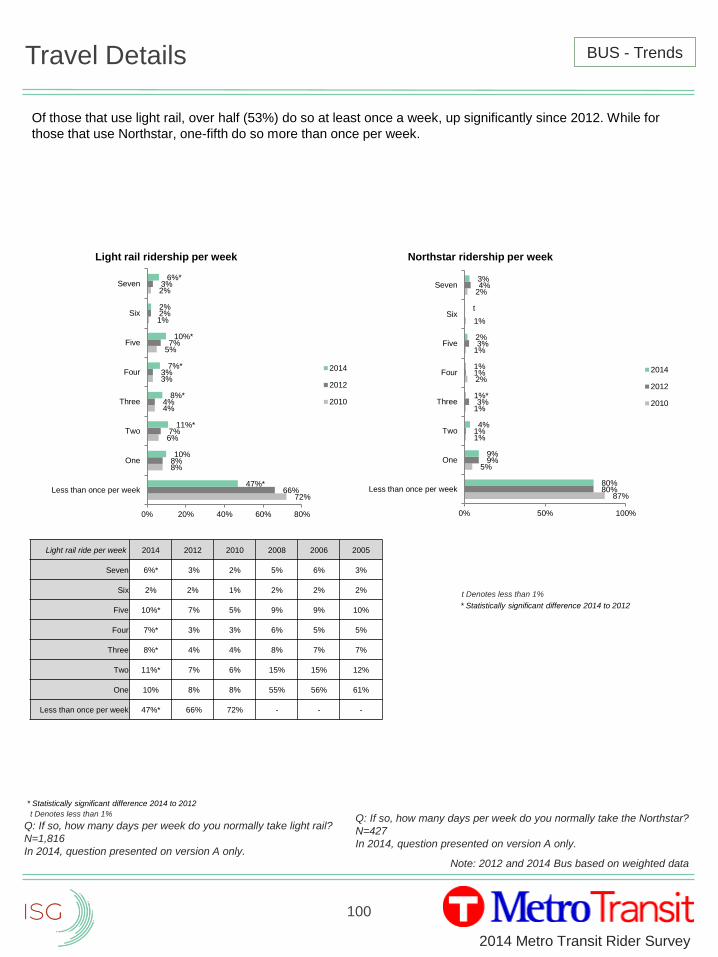
100
2014 Metro Transit Rider Survey
Travel Details
Q: If so, how many days per week do you normally take light rail?
N=1,816
In 2014, question presented on version A only.
72%
8%
6%
4%
3%
5%
1%
2%
66%
8%
7%
4%
3%
7%
2%
3%
47%*
10%
11%*
8%*
7%*
10%*
2%
6%*
0% 20% 40% 60% 80%
Less than once per week
One
Two
Three
Four
Five
Six
Seven
Light rail ridership per week
2014
2012
2010
87%
5%
1%
1%
2%
1%
1%
2%
80%
9%
1%
3%
1%
3%
4%
80%
9%
4%
1%*
1%
2%
t
3%
0% 50% 100%
Less than once per week
One
Two
Three
Four
Five
Six
Seven
Northstar ridership per week
2014
2012
2010
Light rail ride per week 2014 2012 2010 2008 2006 2005
Seven 6%* 3% 2% 5% 6% 3%
Six 2% 2% 1% 2% 2% 2%
Five 10%* 7% 5% 9% 9% 10%
Four 7%* 3% 3% 6% 5% 5%
Three 8%* 4% 4% 8% 7% 7%
Two 11%* 7% 6% 15% 15% 12%
One 10% 8% 8% 55% 56% 61%
Less than once per week 47%* 66% 72% - - -
Q: If so, how many days per week do you normally take the Northstar?
N=427
In 2014, question presented on version A only.
Note: 2012 and 2014 Bus based on weighted data
BUS - Trends
* Statistically significant difference 2014 to 2012
t Denotes less than 1%
Of those that use light rail, over half (53%) do so at least once a week, up significantly since 2012. While for
those that use Northstar, one-fifth do so more than once per week.
* Statistically significant difference 2014 to 2012
t Denotes less than 1%
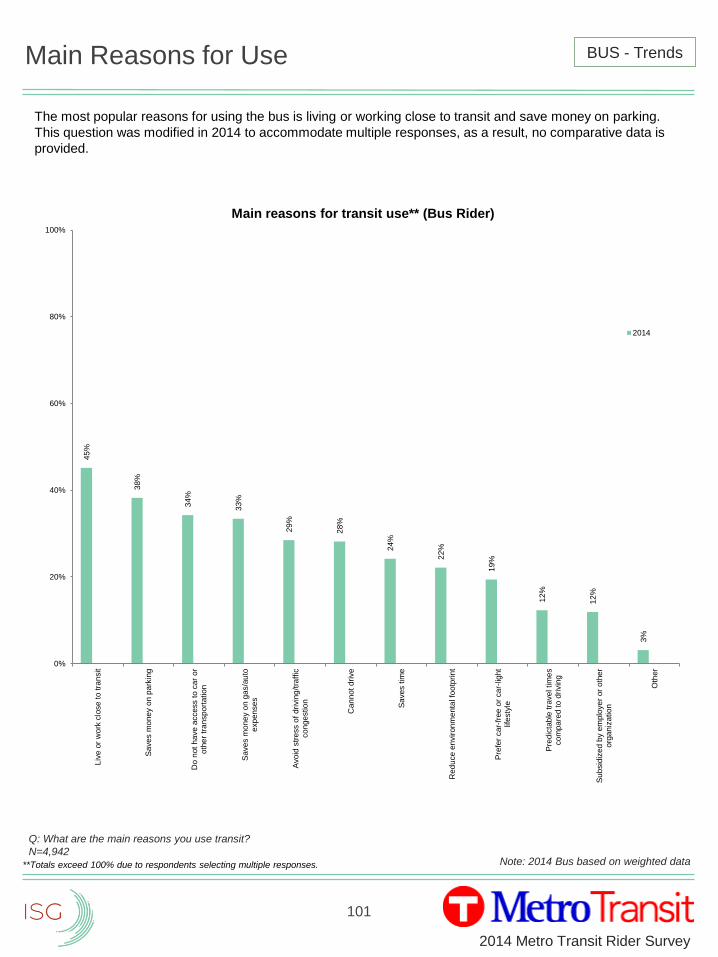
101
2014 Metro Transit Rider Survey
Main Reasons for Use
Q: What are the main reasons you use transit?
N=4,942
45
%
38
%
34
%
33
%
29
%
28
%
24
%
22
%
19
%
12
%
12
%
3%
0%
20%
40%
60%
80%
100%
Liv
e o
r w
ork
clo
se
to
tra
nsit
Sa
ve
s m
on
ey o
n p
ark
ing
Do n
ot
ha
ve
acce
ss t
o c
ar
or
oth
er
tra
nsp
ort
atio
n
Sa
ve
s m
on
ey o
n g
as/a
uto
exp
en
se
s
Avo
id s
tre
ss o
f dri
vin
g/t
raff
icco
nge
stio
n
Can
not
dri
ve
Sa
ve
s t
ime
Red
uce e
nvir
on
me
nta
l fo
otp
rint
Pre
fer
ca
r-fr
ee
or
ca
r-lig
ht
life
sty
le
Pre
dic
tab
le t
rave
l tim
es
co
mp
are
d t
o d
rivin
g
Su
bsid
ize
d b
y e
mplo
ye
r or
oth
er
org
an
ization
Oth
er
Main reasons for transit use** (Bus Rider)
2014
**Totals exceed 100% due to respondents selecting multiple responses.
BUS - Trends
Note: 2014 Bus based on weighted data
The most popular reasons for using the bus is living or working close to transit and save money on parking.
This question was modified in 2014 to accommodate multiple responses, as a result, no comparative data is
provided.
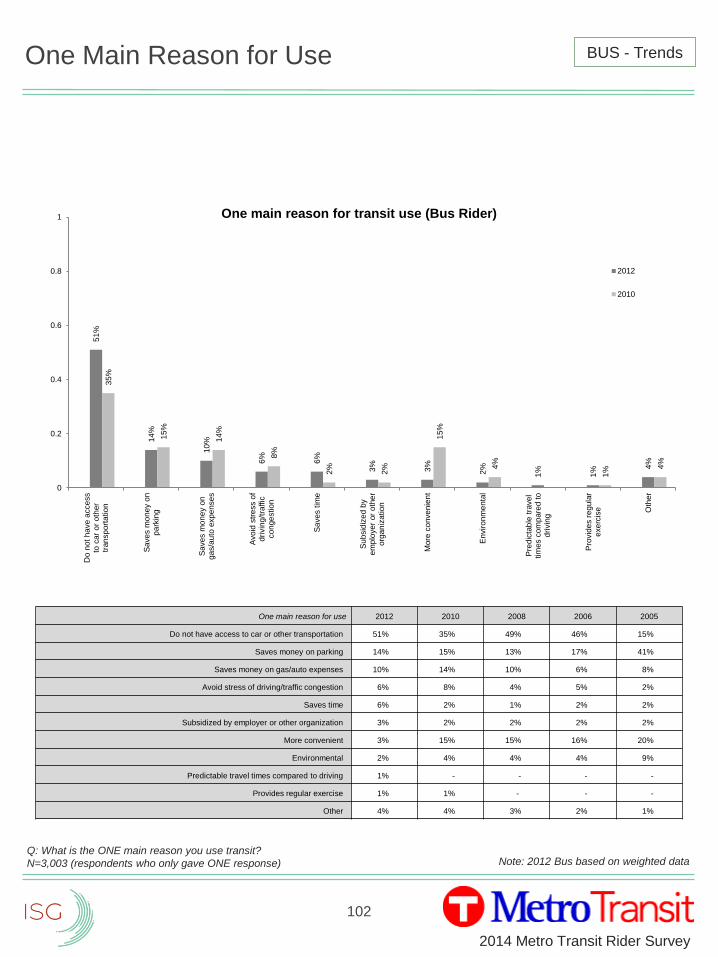
102
2014 Metro Transit Rider Survey
One Main Reason for Use
Q: What is the ONE main reason you use transit?
N=3,003 (respondents who only gave ONE response)
51
%
14
%
10
%
6%
6%
3%
3%
2%
1%
1% 4
%
35
%
15
%
14
%
8%
2%
2%
15
%
4%
1% 4
%
0
0.2
0.4
0.6
0.8
1
Do n
ot
ha
ve
acce
ss
to c
ar
or
oth
er
tran
sp
ort
atio
n
Sa
ve
s m
on
ey o
np
ark
ing
Sa
ve
s m
on
ey o
ng
as/a
uto
exp
en
se
s
Avo
id s
tre
ss o
fd
rivin
g/t
raffic
co
nge
stio
n
Sa
ve
s t
ime
Su
bsid
ize
d b
ye
mp
loye
r or
oth
er
org
an
ization
More
co
nve
nie
nt
En
vir
on
me
nta
l
Pre
dic
tab
le t
rave
ltim
es c
om
pare
d to
dri
vin
g
Pro
vid
es r
eg
ula
re
xe
rcis
e Oth
er
One main reason for transit use (Bus Rider)
2012
2010
One main reason for use 2012 2010 2008 2006 2005
Do not have access to car or other transportation 51% 35% 49% 46% 15%
Saves money on parking 14% 15% 13% 17% 41%
Saves money on gas/auto expenses 10% 14% 10% 6% 8%
Avoid stress of driving/traffic congestion 6% 8% 4% 5% 2%
Saves time 6% 2% 1% 2% 2%
Subsidized by employer or other organization 3% 2% 2% 2% 2%
More convenient 3% 15% 15% 16% 20%
Environmental 2% 4% 4% 4% 9%
Predictable travel times compared to driving 1% - - - -
Provides regular exercise 1% 1% - - -
Other 4% 4% 3% 2% 1%
Note: 2012 Bus based on weighted data
BUS - Trends
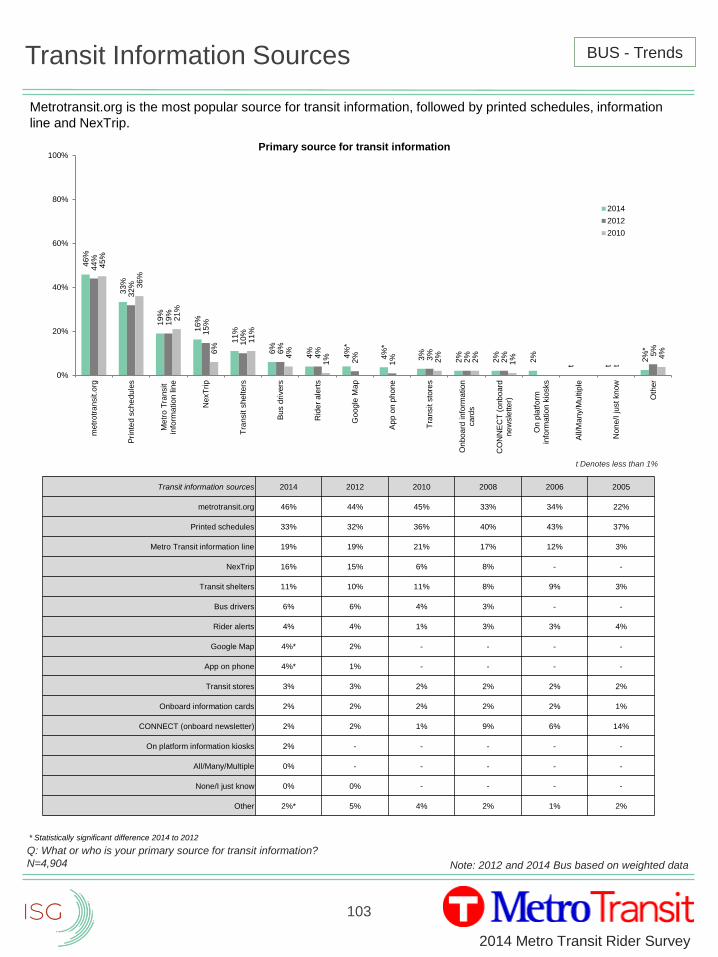
103
2014 Metro Transit Rider Survey
Transit Information Sources
Q: What or who is your primary source for transit information?
N=4,904
46
%
33
%
19
%
16
%
11
%
6%
4%
4%
*
4%
*
3%
2%
2%
2%
t t
2%
*
44
%
32
%
19
%
15
%
10
%
6%
4%
2%
1% 3
%
2%
2%
t
5%
45
%
36
%
21
%
6%
11
%
4%
1% 2%
2%
1% 4
%
0%
20%
40%
60%
80%
100%
metr
otr
an
sit.o
rg
Pri
nte
d s
ch
ed
ule
s
Metr
o T
ransit
info
rma
tio
n lin
e
NexT
rip
Tra
nsit s
he
lte
rs
Bu
s d
rivers
Rid
er
ale
rts
Go
og
le M
ap
Ap
p o
n p
ho
ne
Tra
nsit s
tore
s
On
bo
ard
info
rma
tio
nca
rds
CO
NN
EC
T (
onb
oa
rdn
ew
sle
tte
r)
On
pla
tfo
rmin
form
atio
n k
iosks
All/
Ma
ny/M
ultip
le
Non
e/I just
kn
ow
Oth
er
Primary source for transit information
2014
2012
2010
Transit information sources 2014 2012 2010 2008 2006 2005
metrotransit.org 46% 44% 45% 33% 34% 22%
Printed schedules 33% 32% 36% 40% 43% 37%
Metro Transit information line 19% 19% 21% 17% 12% 3%
NexTrip 16% 15% 6% 8% - -
Transit shelters 11% 10% 11% 8% 9% 3%
Bus drivers 6% 6% 4% 3% - -
Rider alerts 4% 4% 1% 3% 3% 4%
Google Map 4%* 2% - - - -
App on phone 4%* 1% - - - -
Transit stores 3% 3% 2% 2% 2% 2%
Onboard information cards 2% 2% 2% 2% 2% 1%
CONNECT (onboard newsletter) 2% 2% 1% 9% 6% 14%
On platform information kiosks 2% - - - - -
All/Many/Multiple 0% - - - - -
None/I just know 0% 0% - - - -
Other 2%* 5% 4% 2% 1% 2%
Note: 2012 and 2014 Bus based on weighted data
BUS - Trends
* Statistically significant difference 2014 to 2012
t Denotes less than 1%
Metrotransit.org is the most popular source for transit information, followed by printed schedules, information
line and NexTrip.
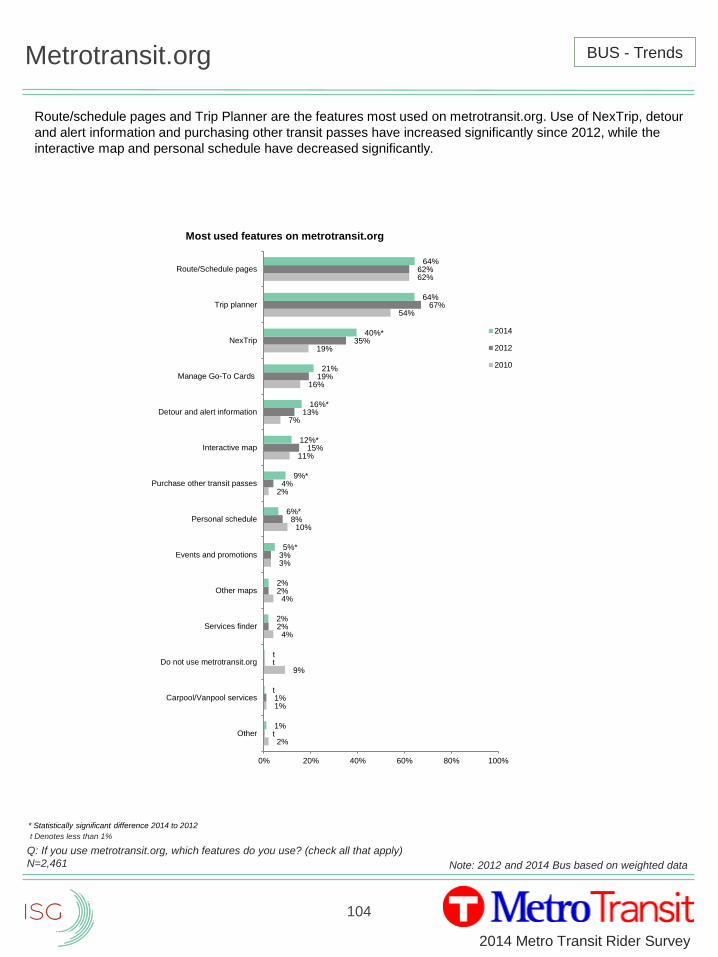
104
2014 Metro Transit Rider Survey
Metrotransit.org
Q: If you use metrotransit.org, which features do you use? (check all that apply)
N=2,461
2%
1%
9%
4%
4%
3%
10%
2%
11%
7%
16%
19%
54%
62%
t
1%
t
2%
2%
3%
8%
4%
15%
13%
19%
35%
67%
62%
1%
t
t
2%
2%
5%*
6%*
9%*
12%*
16%*
21%
40%*
64%
64%
0% 20% 40% 60% 80% 100%
Other
Carpool/Vanpool services
Do not use metrotransit.org
Services finder
Other maps
Events and promotions
Personal schedule
Purchase other transit passes
Interactive map
Detour and alert information
Manage Go-To Cards
NexTrip
Trip planner
Route/Schedule pages
Most used features on metrotransit.org
2014
2012
2010
Note: 2012 and 2014 Bus based on weighted data
BUS - Trends
* Statistically significant difference 2014 to 2012
t Denotes less than 1%
Route/schedule pages and Trip Planner are the features most used on metrotransit.org. Use of NexTrip, detour
and alert information and purchasing other transit passes have increased significantly since 2012, while the
interactive map and personal schedule have decreased significantly.
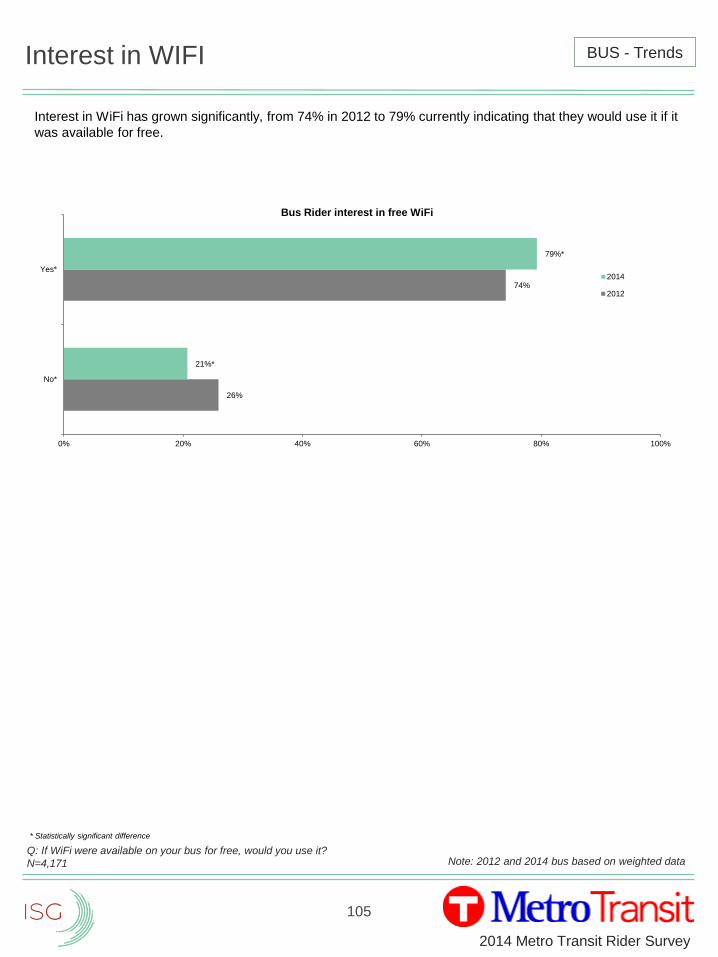
105
2014 Metro Transit Rider Survey
Interest in WIFI
Q: If WiFi were available on your bus for free, would you use it?
N=4,171
26%
74%
21%*
79%*
0% 20% 40% 60% 80% 100%
No*
Yes*
Bus Rider interest in free WiFi
2014
2012
* Statistically significant difference
Note: 2012 and 2014 bus based on weighted data
BUS - Trends
Interest in WiFi has grown significantly, from 74% in 2012 to 79% currently indicating that they would use it if it
was available for free.
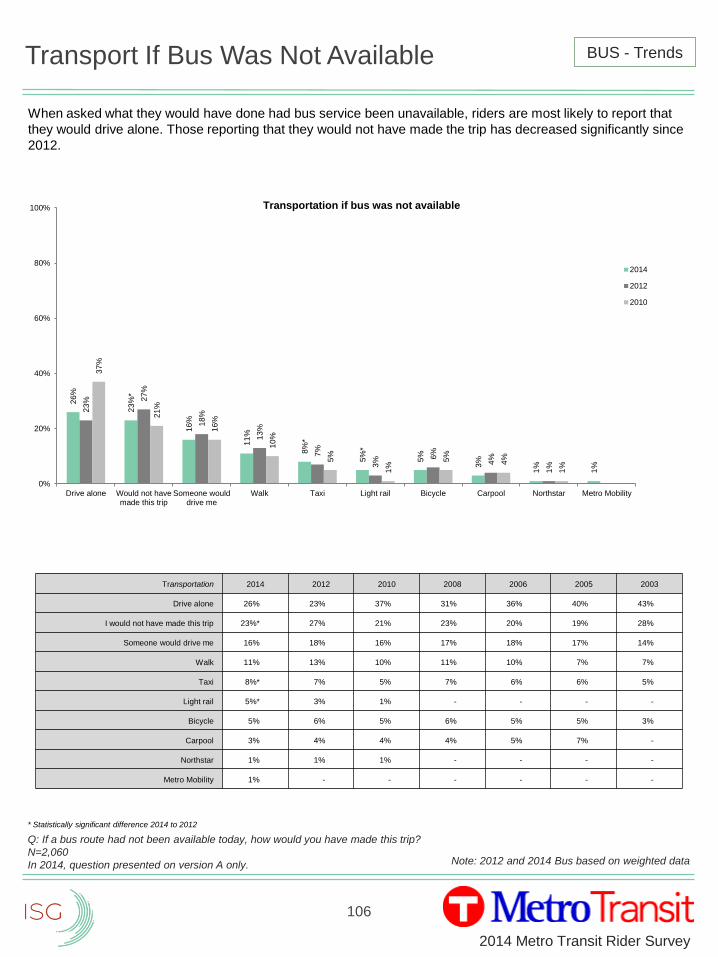
106
2014 Metro Transit Rider Survey
Transport If Bus Was Not Available
Q: If a bus route had not been available today, how would you have made this trip?
N=2,060
In 2014, question presented on version A only.
26
%
23
%*
16
%
11
%
8%
*
5%
*
5%
3%
1%
1%
23
% 27
%
18
%
13
%
7%
3%
6%
4%
1%
37
%
21
%
16
%
10
%
5%
1%
5%
4%
1%
0%
20%
40%
60%
80%
100%
Drive alone Would not havemade this trip
Someone woulddrive me
Walk Taxi Light rail Bicycle Carpool Northstar Metro Mobility
Transportation if bus was not available
2014
2012
2010
Transportation 2014 2012 2010 2008 2006 2005 2003
Drive alone 26% 23% 37% 31% 36% 40% 43%
I would not have made this trip 23%* 27% 21% 23% 20% 19% 28%
Someone would drive me 16% 18% 16% 17% 18% 17% 14%
Walk 11% 13% 10% 11% 10% 7% 7%
Taxi 8%* 7% 5% 7% 6% 6% 5%
Light rail 5%* 3% 1% - - - -
Bicycle 5% 6% 5% 6% 5% 5% 3%
Carpool 3% 4% 4% 4% 5% 7% -
Northstar 1% 1% 1% - - - -
Metro Mobility 1% - - - - - -
Note: 2012 and 2014 Bus based on weighted data
BUS - Trends
* Statistically significant difference 2014 to 2012
When asked what they would have done had bus service been unavailable, riders are most likely to report that
they would drive alone. Those reporting that they would not have made the trip has decreased significantly since
2012.
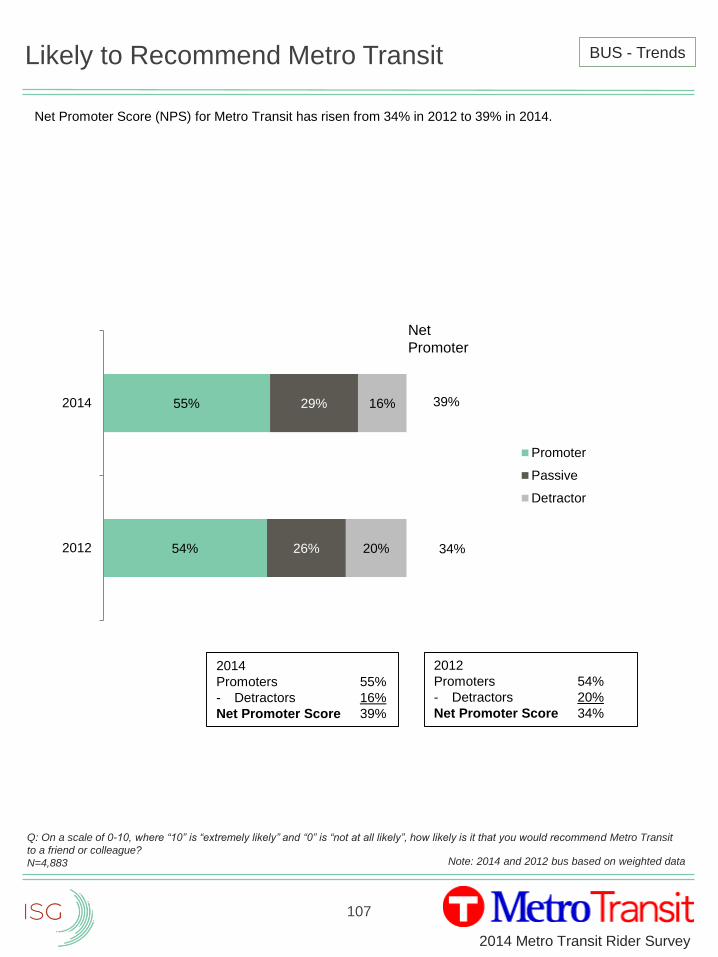
107
2014 Metro Transit Rider Survey
Likely to Recommend Metro Transit
Net Promoter Score (NPS) for Metro Transit has risen from 34% in 2012 to 39% in 2014.
Q: On a scale of 0-10, where “10” is “extremely likely” and “0” is “not at all likely”, how likely is it that you would recommend Metro Transit
to a friend or colleague?
N=4,883
54%
55%
26%
29%
20%
16%
2012
2014
Promoter
Passive
Detractor
Net
Promoter
39%
34%
BUS - Trends
Note: 2014 and 2012 bus based on weighted data
2014
Promoters 55%
- Detractors 16%
Net Promoter Score 39%
2012
Promoters 54%
- Detractors 20%
Net Promoter Score 34%
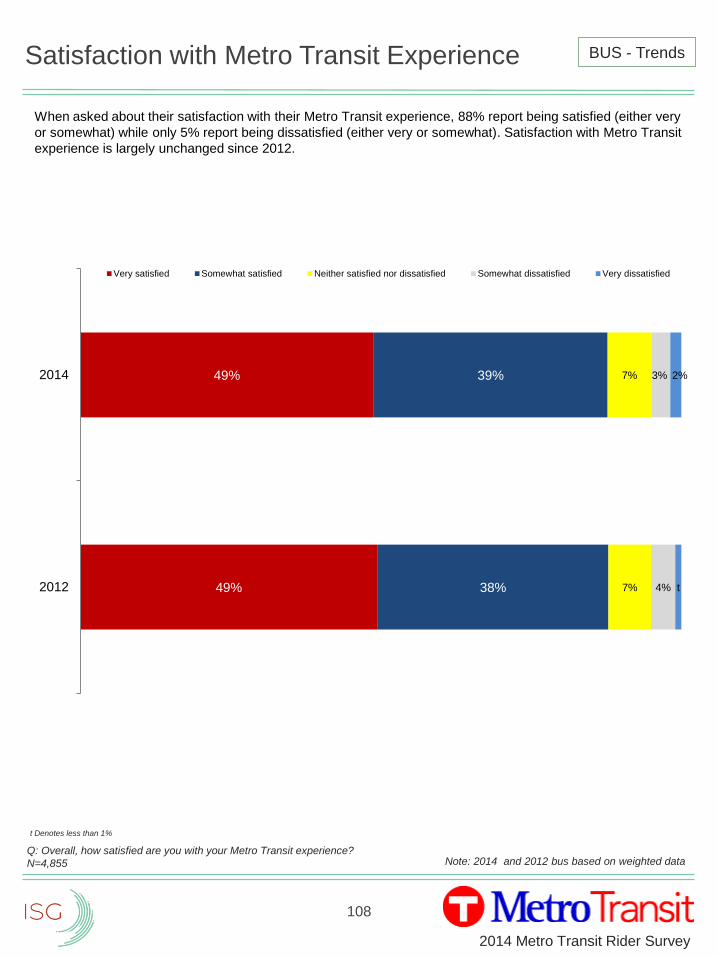
108
2014 Metro Transit Rider Survey
Satisfaction with Metro Transit Experience
When asked about their satisfaction with their Metro Transit experience, 88% report being satisfied (either very
or somewhat) while only 5% report being dissatisfied (either very or somewhat). Satisfaction with Metro Transit
experience is largely unchanged since 2012.
Q: Overall, how satisfied are you with your Metro Transit experience?
N=4,855
49%
49%
38%
39%
7%
7%
4%
3%
t
2%
2012
2014
Very satisfied Somewhat satisfied Neither satisfied nor dissatisfied Somewhat dissatisfied Very dissatisfied
BUS - Trends
Note: 2014 and 2012 bus based on weighted data
t Denotes less than 1%
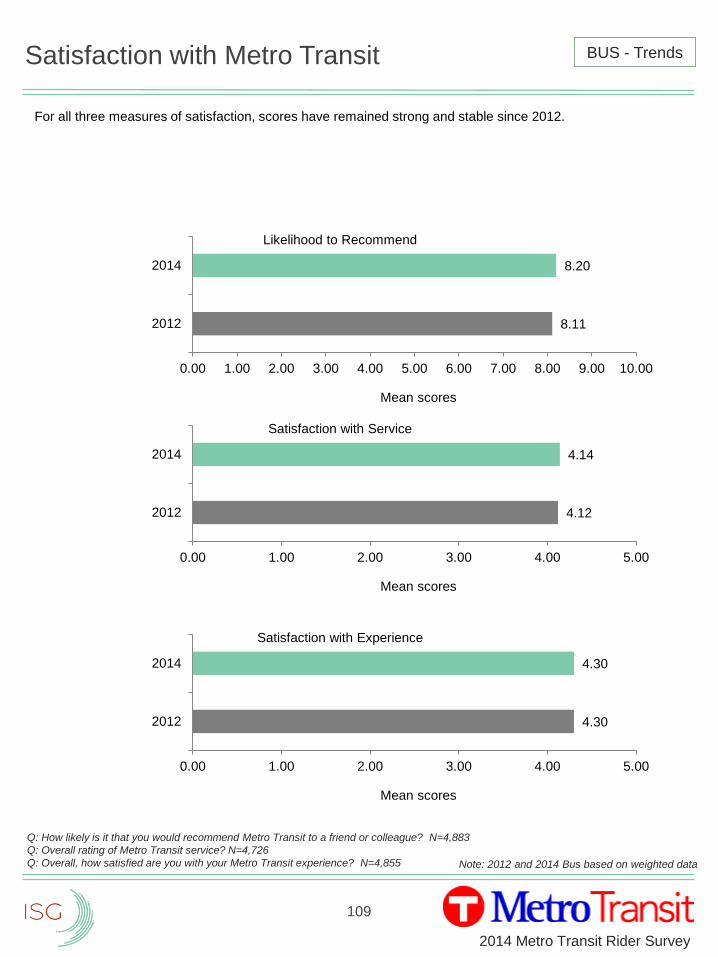
109
2014 Metro Transit Rider Survey
Satisfaction with Metro Transit
8.11
8.20
0.00 1.00 2.00 3.00 4.00 5.00 6.00 7.00 8.00 9.00 10.00
2012
2014
Mean scores
Likelihood to Recommend
For all three measures of satisfaction, scores have remained strong and stable since 2012.
Q: How likely is it that you would recommend Metro Transit to a friend or colleague? N=4,883
Q: Overall rating of Metro Transit service? N=4,726
Q: Overall, how satisfied are you with your Metro Transit experience? N=4,855
4.12
4.14
0.00 1.00 2.00 3.00 4.00 5.00
2012
2014
Mean scores
Satisfaction with Service
4.30
4.30
0.00 1.00 2.00 3.00 4.00 5.00
2012
2014
Mean scores
Satisfaction with Experience
BUS - Trends
Note: 2012 and 2014 Bus based on weighted data
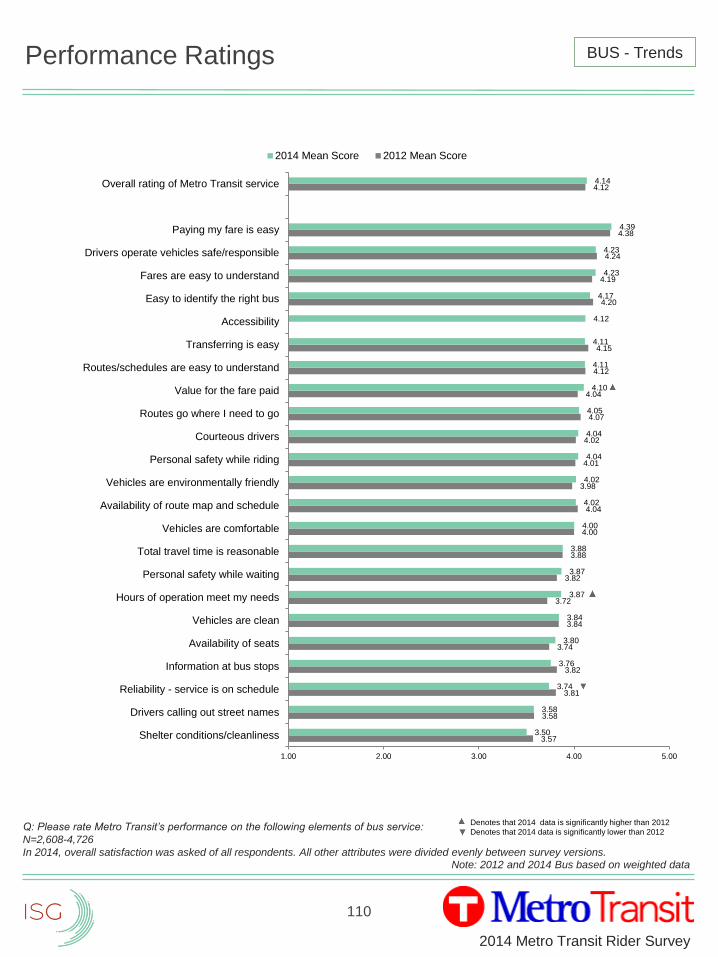
110
2014 Metro Transit Rider Survey
3.57
3.58
3.81
3.82
3.74
3.84
3.72
3.82
3.88
4.00
4.04
3.98
4.01
4.02
4.07
4.04
4.12
4.15
4.20
4.19
4.24
4.38
4.12
3.50
3.58
3.74
3.76
3.80
3.84
3.87
3.87
3.88
4.00
4.02
4.02
4.04
4.04
4.05
4.10
4.11
4.11
4.12
4.17
4.23
4.23
4.39
4.14
1.00 2.00 3.00 4.00 5.00
Shelter conditions/cleanliness
Drivers calling out street names
Reliability - service is on schedule
Information at bus stops
Availability of seats
Vehicles are clean
Hours of operation meet my needs
Personal safety while waiting
Total travel time is reasonable
Vehicles are comfortable
Availability of route map and schedule
Vehicles are environmentally friendly
Personal safety while riding
Courteous drivers
Routes go where I need to go
Value for the fare paid
Routes/schedules are easy to understand
Transferring is easy
Accessibility
Easy to identify the right bus
Fares are easy to understand
Drivers operate vehicles safe/responsible
Paying my fare is easy
Overall rating of Metro Transit service
2014 Mean Score 2012 Mean Score
Performance Ratings
Q: Please rate Metro Transit’s performance on the following elements of bus service:
N=2,608-4,726
In 2014, overall satisfaction was asked of all respondents. All other attributes were divided evenly between survey versions.Note: 2012 and 2014 Bus based on weighted data
BUS - Trends
Denotes that 2014 data is significantly higher than 2012
Denotes that 2014 data is significantly lower than 2012
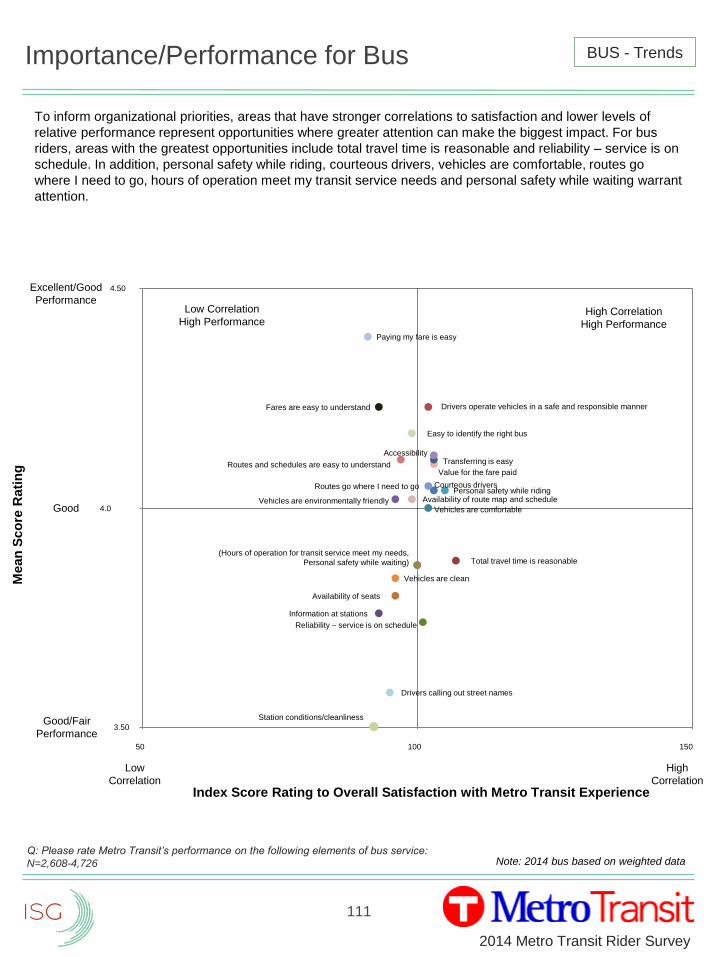
111
2014 Metro Transit Rider Survey
Importance/Performance for Bus
To inform organizational priorities, areas that have stronger correlations to satisfaction and lower levels of
relative performance represent opportunities where greater attention can make the biggest impact. For bus
riders, areas with the greatest opportunities include total travel time is reasonable and reliability – service is on
schedule. In addition, personal safety while riding, courteous drivers, vehicles are comfortable, routes go
where I need to go, hours of operation meet my transit service needs and personal safety while waiting warrant
attention.
Q: Please rate Metro Transit’s performance on the following elements of bus service:
N=2,608-4,726 Note: 2014 bus based on weighted data
Total travel time is reasonable
Reliability – service is on schedule
Value for the fare paid
Information at stations
Vehicles are comfortable
Availability of seats
Courteous drivers
Vehicles are environmentally friendly
Personal safety while riding
Vehicles are clean
Transferring is easy
Routes go where I need to go
Station conditions/cleanliness
Accessibility
Fares are easy to understand
Paying my fare is easy
Easy to identify the right bus
Drivers calling out street names
Mean
Sco
re R
ati
ng
Index Score Rating to Overall Satisfaction with Metro Transit Experience
Excellent/Good
Performance
Good
Good/Fair
Performance
High
Correlation
Low
Correlation
4.50
3.50
4.0
Low Correlation
High PerformanceHigh Correlation
High Performance
50 100 150
Routes and schedules are easy to understand
(Hours of operation for transit service meet my needs,
Personal safety while waiting)
Drivers operate vehicles in a safe and responsible manner
Availability of route map and schedule
BUS - Trends
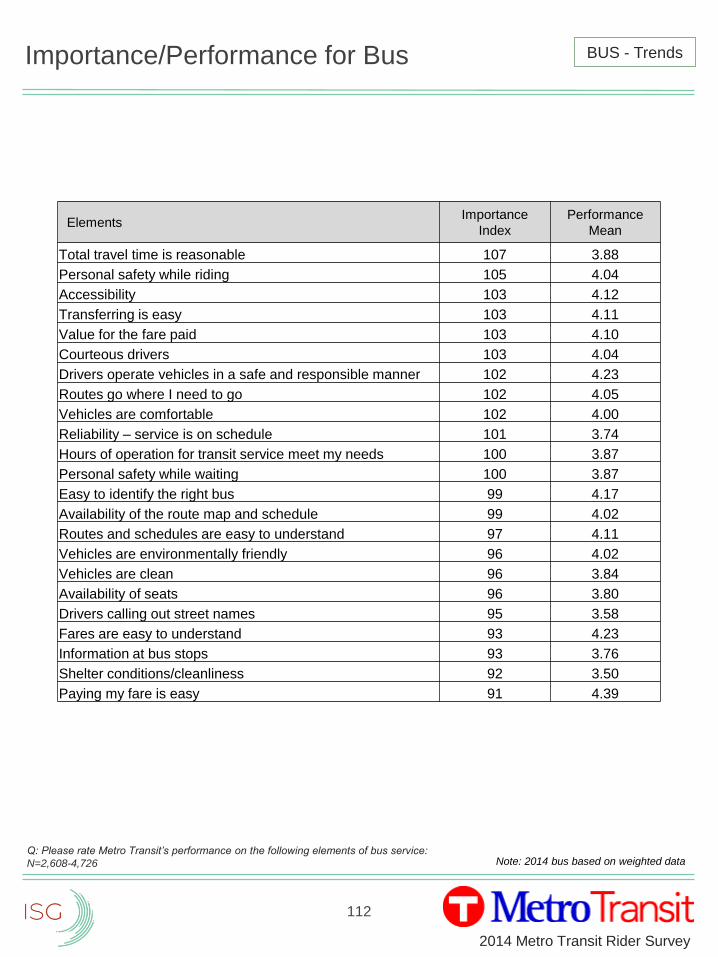
112
2014 Metro Transit Rider Survey
Importance/Performance for Bus
Q: Please rate Metro Transit’s performance on the following elements of bus service:
N=2,608-4,726
ElementsImportance
Index
Performance
Mean
Total travel time is reasonable 107 3.88
Personal safety while riding 105 4.04
Accessibility 103 4.12
Transferring is easy 103 4.11
Value for the fare paid 103 4.10
Courteous drivers 103 4.04
Drivers operate vehicles in a safe and responsible manner 102 4.23
Routes go where I need to go 102 4.05
Vehicles are comfortable 102 4.00
Reliability – service is on schedule 101 3.74
Hours of operation for transit service meet my needs 100 3.87
Personal safety while waiting 100 3.87
Easy to identify the right bus 99 4.17
Availability of the route map and schedule 99 4.02
Routes and schedules are easy to understand 97 4.11
Vehicles are environmentally friendly 96 4.02
Vehicles are clean 96 3.84
Availability of seats 96 3.80
Drivers calling out street names 95 3.58
Fares are easy to understand 93 4.23
Information at bus stops 93 3.76
Shelter conditions/cleanliness 92 3.50
Paying my fare is easy 91 4.39
Note: 2014 bus based on weighted data
BUS - Trends
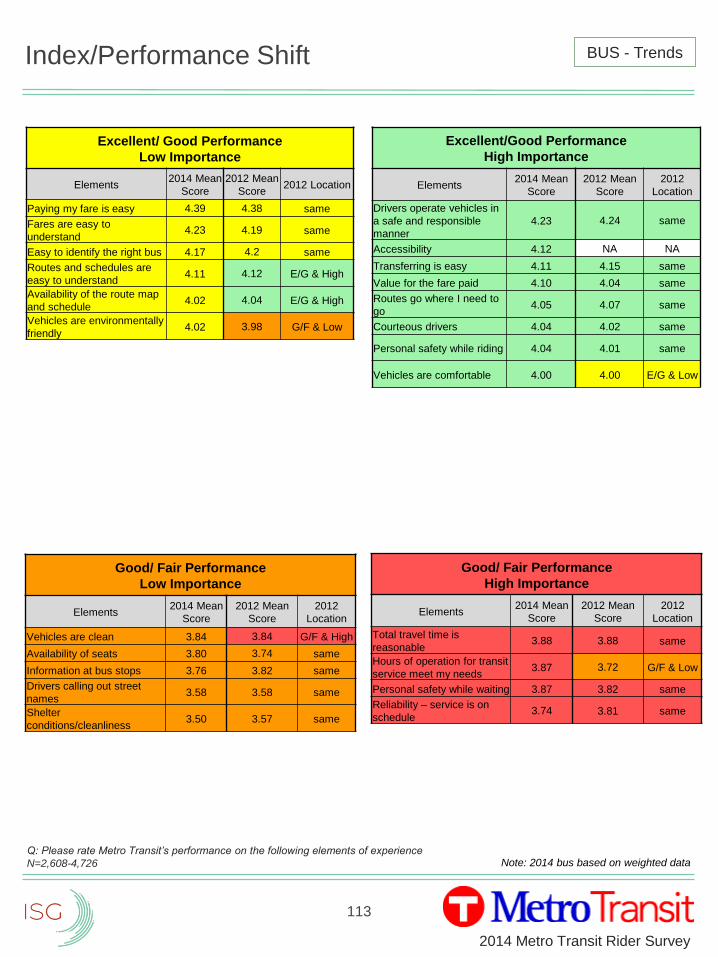
113
2014 Metro Transit Rider Survey
Index/Performance Shift
Q: Please rate Metro Transit’s performance on the following elements of experience
N=2,608-4,726
Excellent/ Good Performance
Low Importance
Elements2014 Mean
Score
2012 Mean
Score2012 Location
Paying my fare is easy 4.39 4.38 same
Fares are easy to
understand4.23 4.19 same
Easy to identify the right bus 4.17 4.2 same
Routes and schedules are
easy to understand4.11 4.12 E/G & High
Availability of the route map
and schedule4.02 4.04 E/G & High
Vehicles are environmentally
friendly4.02 3.98 G/F & Low
Good/ Fair Performance
High Importance
Elements2014 Mean
Score
2012 Mean
Score
2012
Location
Total travel time is
reasonable3.88 3.88 same
Hours of operation for transit
service meet my needs 3.87 3.72 G/F & Low
Personal safety while waiting 3.87 3.82 same
Reliability – service is on
schedule3.74 3.81 same
Excellent/Good Performance
High Importance
Elements2014 Mean
Score
2012 Mean
Score
2012
Location
Drivers operate vehicles in
a safe and responsible
manner
4.23 4.24 same
Accessibility 4.12 NA NA
Transferring is easy 4.11 4.15 same
Value for the fare paid 4.10 4.04 same
Routes go where I need to
go4.05 4.07 same
Courteous drivers 4.04 4.02 same
Personal safety while riding 4.04 4.01 same
Vehicles are comfortable 4.00 4.00 E/G & Low
Good/ Fair Performance
Low Importance
Elements2014 Mean
Score
2012 Mean
Score
2012
Location
Vehicles are clean 3.84 3.84 G/F & High
Availability of seats 3.80 3.74 same
Information at bus stops 3.76 3.82 same
Drivers calling out street
names3.58 3.58 same
Shelter
conditions/cleanliness3.50 3.57 same
Note: 2014 bus based on weighted data
BUS - Trends
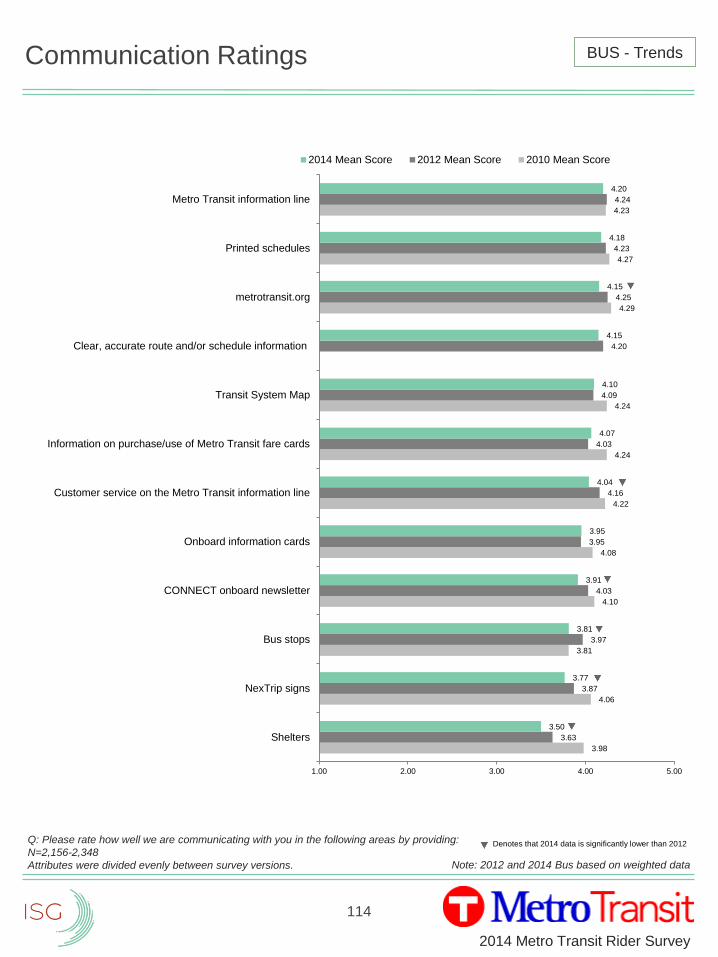
114
2014 Metro Transit Rider Survey
Communication Ratings
Q: Please rate how well we are communicating with you in the following areas by providing:
N=2,156-2,348
Attributes were divided evenly between survey versions.
3.98
4.06
3.81
4.10
4.08
4.22
4.24
4.24
4.29
4.27
4.23
3.63
3.87
3.97
4.03
3.95
4.16
4.03
4.09
4.20
4.25
4.23
4.24
3.50
3.77
3.81
3.91
3.95
4.04
4.07
4.10
4.15
4.15
4.18
4.20
1.00 2.00 3.00 4.00 5.00
Shelters
NexTrip signs
Bus stops
CONNECT onboard newsletter
Onboard information cards
Customer service on the Metro Transit information line
Information on purchase/use of Metro Transit fare cards
Transit System Map
Clear, accurate route and/or schedule information
metrotransit.org
Printed schedules
Metro Transit information line
2014 Mean Score 2012 Mean Score 2010 Mean Score
Note: 2012 and 2014 Bus based on weighted data
BUS - Trends
Denotes that 2014 data is significantly lower than 2012
2014 Metro Transit Rider Survey
115
Light Rail
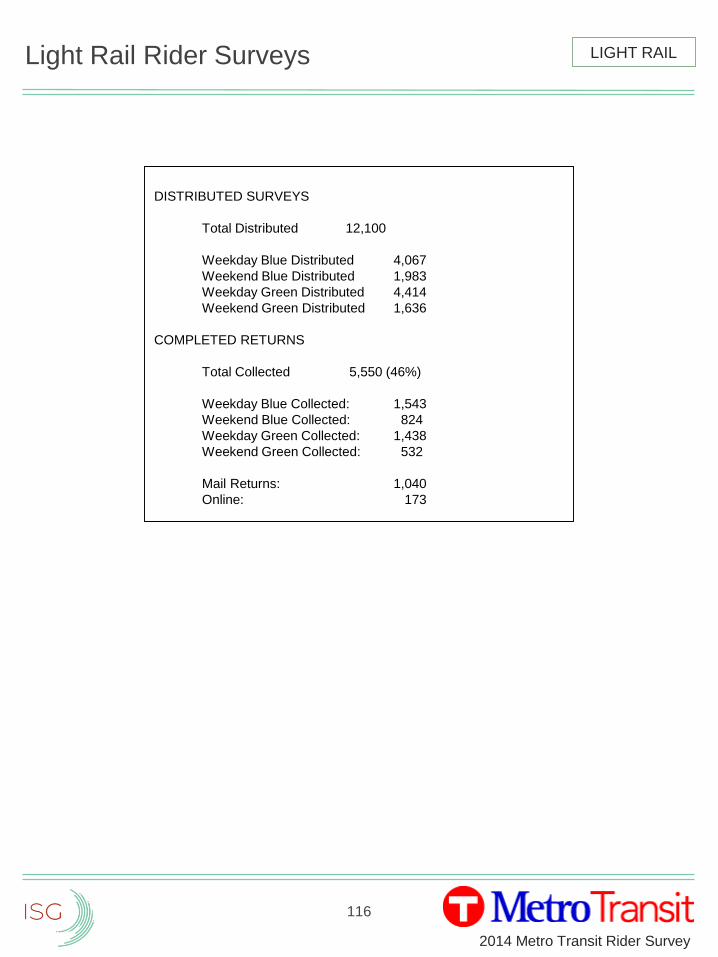
116
2014 Metro Transit Rider Survey
Light Rail Rider Surveys
DISTRIBUTED SURVEYS
Total Distributed 12,100
Weekday Blue Distributed 4,067
Weekend Blue Distributed 1,983
Weekday Green Distributed 4,414
Weekend Green Distributed 1,636
COMPLETED RETURNS
Total Collected 5,550 (46%)
Weekday Blue Collected: 1,543
Weekend Blue Collected: 824
Weekday Green Collected: 1,438
Weekend Green Collected: 532
Mail Returns: 1,040
Online: 173
LIGHT RAIL
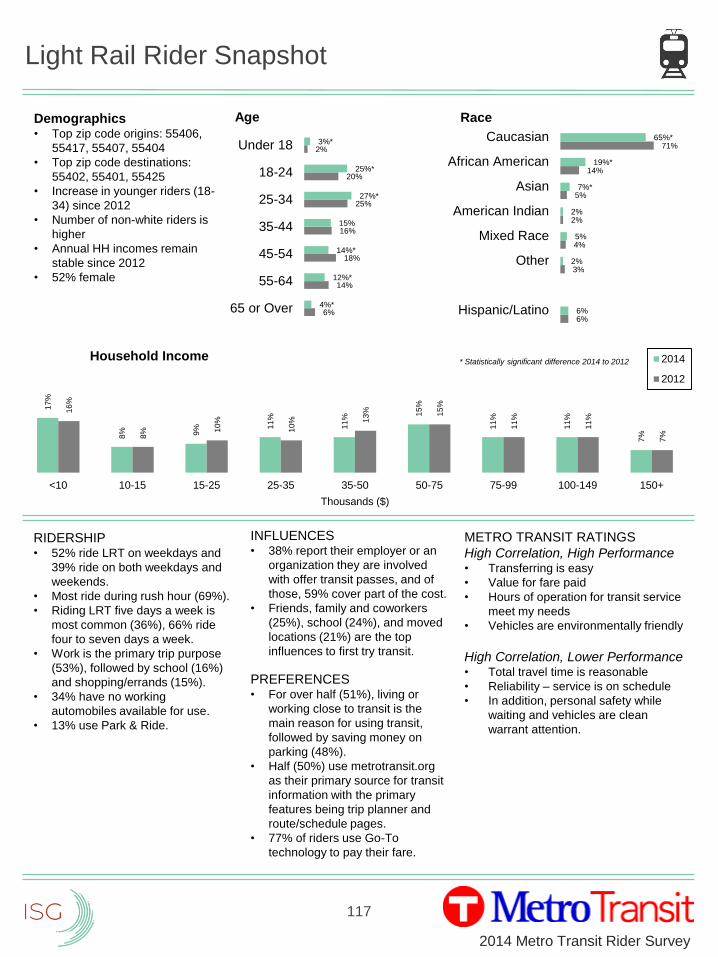
117
2014 Metro Transit Rider Survey
Light Rail Rider Snapshot
6%
14%
18%
16%
25%
20%
2%
4%*
12%*
14%*
15%
27%*
25%*
3%*
65 or Over
55-64
45-54
35-44
25-34
18-24
Under 18
Age
6%
3%
4%
2%
5%
14%
71%
6%
2%
5%
2%
7%*
19%*
65%*
Hispanic/Latino
Other
Mixed Race
American Indian
Asian
African American
Caucasian
Race
17
%
8% 9% 1
1%
11
%
15
%
11
%
11
%
7%
16
%
8% 1
0%
10
% 13
% 15
%
11
%
11
%
7%
<10 10-15 15-25 25-35 35-50 50-75 75-99 100-149 150+
Thousands ($)
Household Income 2014
2012
RIDERSHIP• 52% ride LRT on weekdays and
39% ride on both weekdays and
weekends.
• Most ride during rush hour (69%).
• Riding LRT five days a week is
most common (36%), 66% ride
four to seven days a week.
• Work is the primary trip purpose
(53%), followed by school (16%)
and shopping/errands (15%).
• 34% have no working
automobiles available for use.
• 13% use Park & Ride.
INFLUENCES• 38% report their employer or an
organization they are involved
with offer transit passes, and of
those, 59% cover part of the cost.
• Friends, family and coworkers
(25%), school (24%), and moved
locations (21%) are the top
influences to first try transit.
PREFERENCES• For over half (51%), living or
working close to transit is the
main reason for using transit,
followed by saving money on
parking (48%).
• Half (50%) use metrotransit.org
as their primary source for transit
information with the primary
features being trip planner and
route/schedule pages.
• 77% of riders use Go-To
technology to pay their fare.
METRO TRANSIT RATINGS
High Correlation, High Performance• Transferring is easy
• Value for fare paid
• Hours of operation for transit service
meet my needs
• Vehicles are environmentally friendly
High Correlation, Lower Performance• Total travel time is reasonable
• Reliability – service is on schedule
• In addition, personal safety while
waiting and vehicles are clean
warrant attention.
Demographics• Top zip code origins: 55406,
55417, 55407, 55404
• Top zip code destinations:
55402, 55401, 55425
• Increase in younger riders (18-
34) since 2012
• Number of non-white riders is
higher
• Annual HH incomes remain
stable since 2012
• 52% female
* Statistically significant difference 2014 to 2012
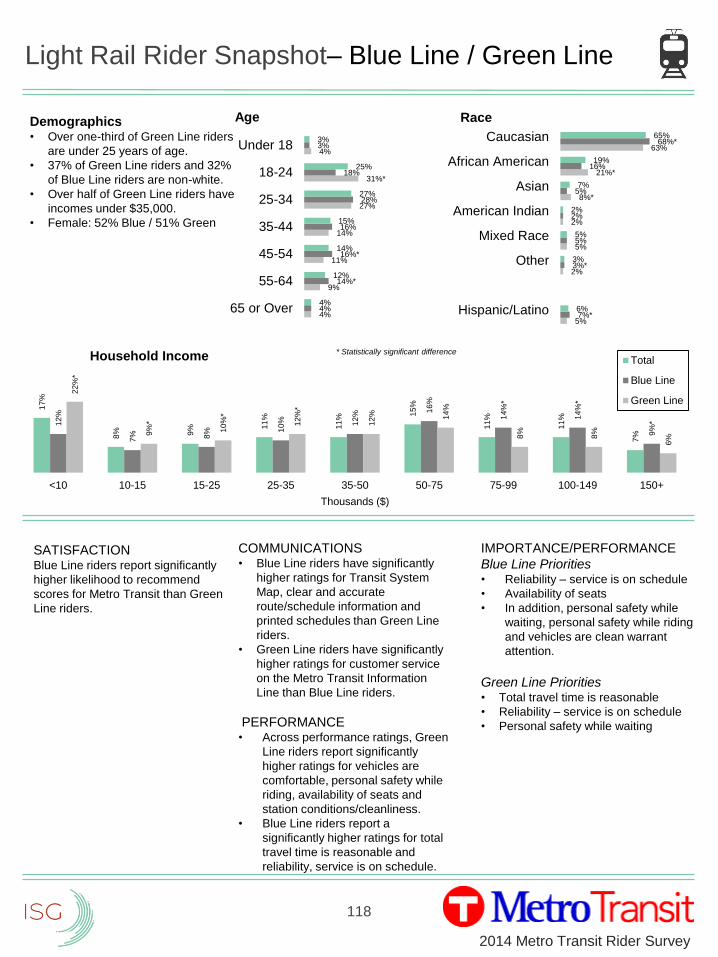
118
2014 Metro Transit Rider Survey
Light Rail Rider Snapshot– Blue Line / Green Line
4%
9%
11%
14%
27%
31%*
4%
4%
14%*
16%*
16%
28%
18%
3%
4%
12%
14%
15%
27%
25%
3%
65 or Over
55-64
45-54
35-44
25-34
18-24
Under 18
Age
5%
2%
5%
2%
8%*
21%*
63%
7%*
3%*
5%
2%
5%
16%
68%*
6%
3%
5%
2%
7%
19%
65%
Hispanic/Latino
Other
Mixed Race
American Indian
Asian
African American
Caucasian
Race
17
%
8% 9% 1
1%
11
%
15
%
11
%
11
%
7%
12
%
7% 8% 1
0% 12
%
16
%
14
%*
14
%*
9%
*
22
%*
9%
*
10
%*
12
%*
12
% 14
%
8%
8%
6%
<10 10-15 15-25 25-35 35-50 50-75 75-99 100-149 150+
Thousands ($)
Household Income Total
Blue Line
Green Line
* Statistically significant difference
Demographics• Over one-third of Green Line riders
are under 25 years of age.
• 37% of Green Line riders and 32%
of Blue Line riders are non-white.
• Over half of Green Line riders have
incomes under $35,000.
• Female: 52% Blue / 51% Green
SATISFACTIONBlue Line riders report significantly
higher likelihood to recommend
scores for Metro Transit than Green
Line riders.
COMMUNICATIONS• Blue Line riders have significantly
higher ratings for Transit System
Map, clear and accurate
route/schedule information and
printed schedules than Green Line
riders.
• Green Line riders have significantly
higher ratings for customer service
on the Metro Transit Information
Line than Blue Line riders.
PERFORMANCE• Across performance ratings, Green
Line riders report significantly
higher ratings for vehicles are
comfortable, personal safety while
riding, availability of seats and
station conditions/cleanliness.
• Blue Line riders report a
significantly higher ratings for total
travel time is reasonable and
reliability, service is on schedule.
IMPORTANCE/PERFORMANCE
Blue Line Priorities• Reliability – service is on schedule
• Availability of seats
• In addition, personal safety while
waiting, personal safety while riding
and vehicles are clean warrant
attention.
Green Line Priorities• Total travel time is reasonable
• Reliability – service is on schedule
• Personal safety while waiting
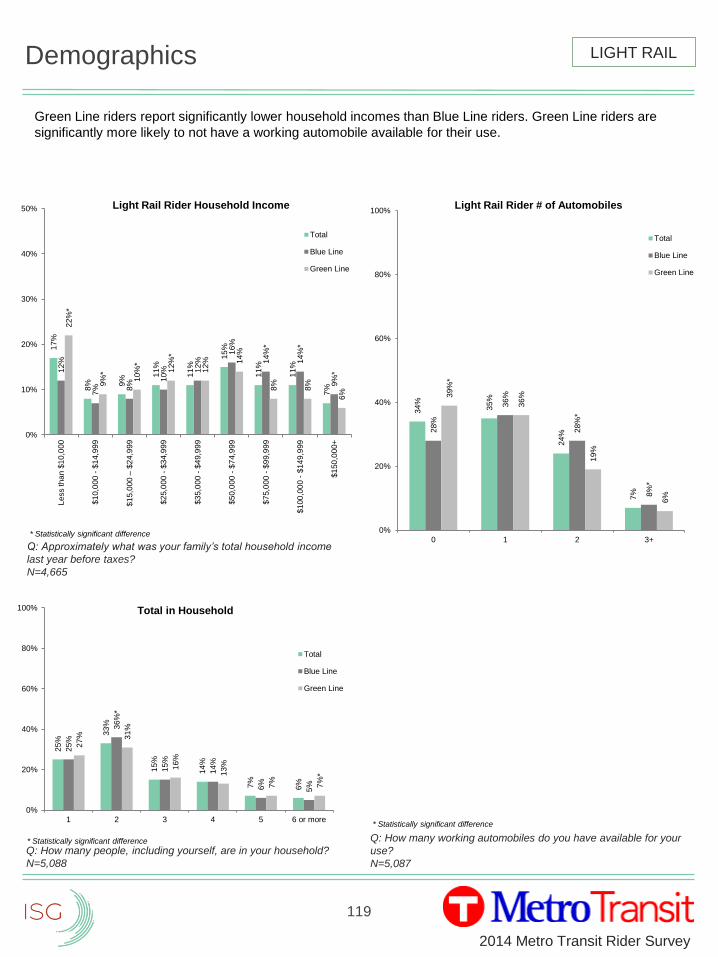
119
2014 Metro Transit Rider Survey
Demographics
Green Line riders report significantly lower household incomes than Blue Line riders. Green Line riders are
significantly more likely to not have a working automobile available for their use.
Q: Approximately what was your family’s total household income
last year before taxes?
N=4,665
Q: How many working automobiles do you have available for your
use?
N=5,087
17
%
8% 9
%
11
%
11
%
15
%
11
%
11
%
7%
12
%
7% 8
%
10
% 12
%
16
%
14
%*
14
%*
9%
*
22
%*
9%
*
10
%*
12
%*
12
% 14
%
8%
8%
6%
0%
10%
20%
30%
40%
50%
Le
ss th
an
$1
0,0
00
$1
0,0
00
- $
14,9
99
$1
5,0
00
–$
24
,99
9
$2
5,0
00
- $
34,9
99
$3
5,0
00
- $
49,9
99
$5
0,0
00
- $
74,9
99
$7
5,0
00
- $
99,9
99
$1
00
,00
0 -
$14
9,9
99
$1
50
,00
0+
Light Rail Rider Household Income
Total
Blue Line
Green Line
34
%
35
%
24
%
7%
28
%
36
%
28
%*
8%
*
39
%*
36
%
19
%
6%
0%
20%
40%
60%
80%
100%
0 1 2 3+
Light Rail Rider # of Automobiles
Total
Blue Line
Green Line
25
%
33
%
15
%
14
%
7%
6%
25
%
36
%*
15
%
14
%
6%
5%
27
% 31
%
16
%
13
%
7%
7%
*
0%
20%
40%
60%
80%
100%
1 2 3 4 5 6 or more
Total in Household
Total
Blue Line
Green Line
Q: How many people, including yourself, are in your household?
N=5,088
LIGHT RAIL
* Statistically significant difference
* Statistically significant difference
* Statistically significant difference
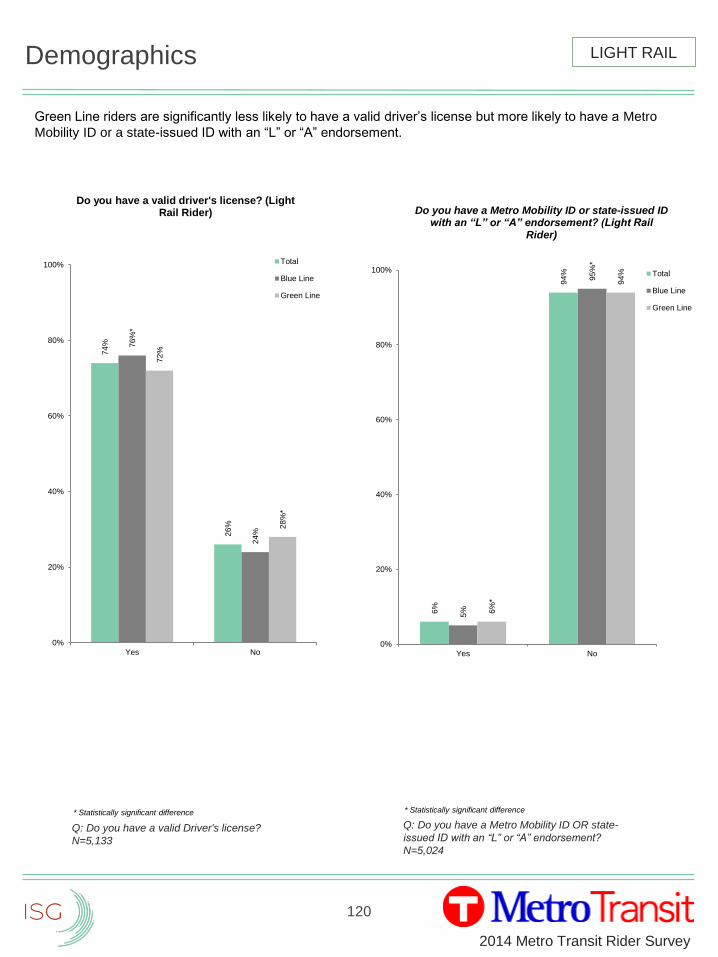
120
2014 Metro Transit Rider Survey
Demographics
Green Line riders are significantly less likely to have a valid driver’s license but more likely to have a Metro
Mobility ID or a state-issued ID with an “L” or “A” endorsement.
LIGHT RAIL
Q: Do you have a valid Driver's license?
N=5,133
Q: Do you have a Metro Mobility ID OR state-
issued ID with an “L” or “A” endorsement?
N=5,024
74
%
26
%
76
%*
24
%
72
%
28
%*
0%
20%
40%
60%
80%
100%
Yes No
Do you have a valid driver's license? (Light Rail Rider)
Total
Blue Line
Green Line
6%
94
%
5%
95
%*
6%
*
94
%
0%
20%
40%
60%
80%
100%
Yes No
Do you have a Metro Mobility ID or state-issued ID with an “L” or “A” endorsement? (Light Rail
Rider)
Total
Blue Line
Green Line
* Statistically significant difference * Statistically significant difference
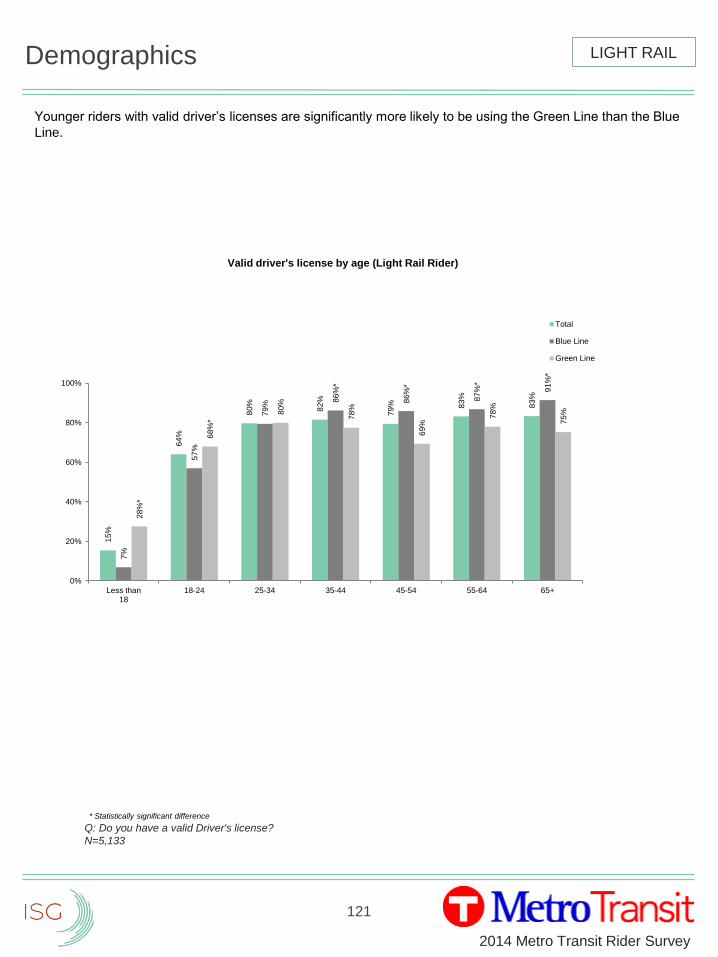
121
2014 Metro Transit Rider Survey
15
%
64
%
80
%
82
%
79
% 83
%
83
%
7%
57
%
79
%
86
%*
86
%*
87
%*
91
%*
28
%*
68
%*
80
%
78
%
69
%
78
%
75
%
0%
20%
40%
60%
80%
100%
Less than18
18-24 25-34 35-44 45-54 55-64 65+
Valid driver's license by age (Light Rail Rider)
Total
Blue Line
Green Line
Demographics
Younger riders with valid driver’s licenses are significantly more likely to be using the Green Line than the Blue
Line.
LIGHT RAIL
Q: Do you have a valid Driver's license?
N=5,133
* Statistically significant difference
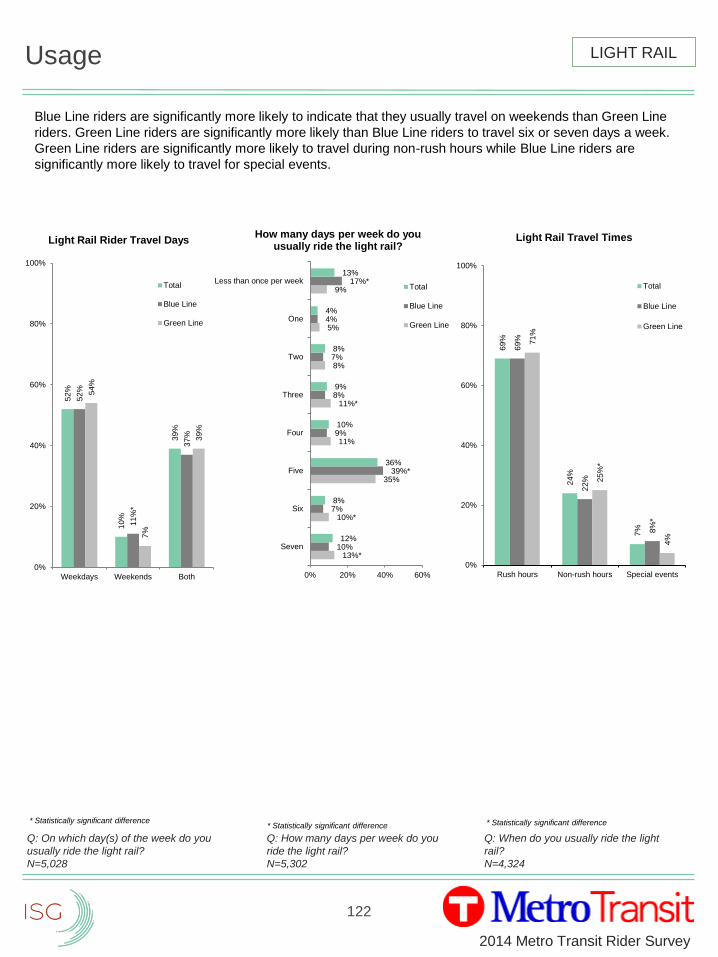
122
2014 Metro Transit Rider Survey
Usage
Blue Line riders are significantly more likely to indicate that they usually travel on weekends than Green Line
riders. Green Line riders are significantly more likely than Blue Line riders to travel six or seven days a week.
Green Line riders are significantly more likely to travel during non-rush hours while Blue Line riders are
significantly more likely to travel for special events.
Q: On which day(s) of the week do you
usually ride the light rail?
N=5,028
Q: How many days per week do you
ride the light rail?
N=5,302
52
%
10
%
39
%
52
%
11
%*
37
%
54
%
7%
39
%
0%
20%
40%
60%
80%
100%
Weekdays Weekends Both
Light Rail Rider Travel Days
Total
Blue Line
Green Line
13%*
10%*
35%
11%
11%*
8%
5%
9%
10%
7%
39%*
9%
8%
7%
4%
17%*
12%
8%
36%
10%
9%
8%
4%
13%
0% 20% 40% 60%
Seven
Six
Five
Four
Three
Two
One
Less than once per week
How many days per week do you usually ride the light rail?
Total
Blue Line
Green Line
69
%
24
%
7%
69
%
22
%
8%
*
71
%
25
%*
4%
0%
20%
40%
60%
80%
100%
Rush hours Non-rush hours Special events
Light Rail Travel Times
Total
Blue Line
Green Line
Q: When do you usually ride the light
rail?
N=4,324
LIGHT RAIL
* Statistically significant difference * Statistically significant difference * Statistically significant difference
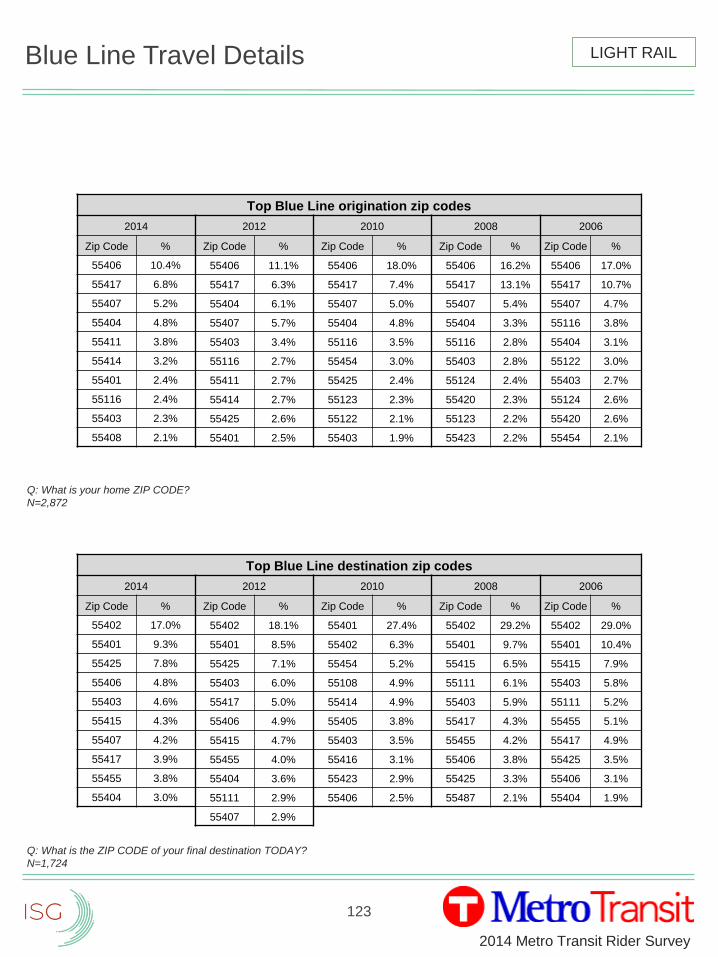
123
2014 Metro Transit Rider Survey
Blue Line Travel Details
Q: What is your home ZIP CODE?
N=2,872
Q: What is the ZIP CODE of your final destination TODAY?
N=1,724
Top Blue Line origination zip codes
2014 2012 2010 2008 2006
Zip Code % Zip Code % Zip Code % Zip Code % Zip Code %
55406 10.4% 55406 11.1% 55406 18.0% 55406 16.2% 55406 17.0%
55417 6.8% 55417 6.3% 55417 7.4% 55417 13.1% 55417 10.7%
55407 5.2% 55404 6.1% 55407 5.0% 55407 5.4% 55407 4.7%
55404 4.8% 55407 5.7% 55404 4.8% 55404 3.3% 55116 3.8%
55411 3.8% 55403 3.4% 55116 3.5% 55116 2.8% 55404 3.1%
55414 3.2% 55116 2.7% 55454 3.0% 55403 2.8% 55122 3.0%
55401 2.4% 55411 2.7% 55425 2.4% 55124 2.4% 55403 2.7%
55116 2.4% 55414 2.7% 55123 2.3% 55420 2.3% 55124 2.6%
55403 2.3% 55425 2.6% 55122 2.1% 55123 2.2% 55420 2.6%
55408 2.1% 55401 2.5% 55403 1.9% 55423 2.2% 55454 2.1%
Top Blue Line destination zip codes
2014 2012 2010 2008 2006
Zip Code % Zip Code % Zip Code % Zip Code % Zip Code %
55402 17.0% 55402 18.1% 55401 27.4% 55402 29.2% 55402 29.0%
55401 9.3% 55401 8.5% 55402 6.3% 55401 9.7% 55401 10.4%
55425 7.8% 55425 7.1% 55454 5.2% 55415 6.5% 55415 7.9%
55406 4.8% 55403 6.0% 55108 4.9% 55111 6.1% 55403 5.8%
55403 4.6% 55417 5.0% 55414 4.9% 55403 5.9% 55111 5.2%
55415 4.3% 55406 4.9% 55405 3.8% 55417 4.3% 55455 5.1%
55407 4.2% 55415 4.7% 55403 3.5% 55455 4.2% 55417 4.9%
55417 3.9% 55455 4.0% 55416 3.1% 55406 3.8% 55425 3.5%
55455 3.8% 55404 3.6% 55423 2.9% 55425 3.3% 55406 3.1%
55404 3.0% 55111 2.9% 55406 2.5% 55487 2.1% 55404 1.9%
55407 2.9%
LIGHT RAIL
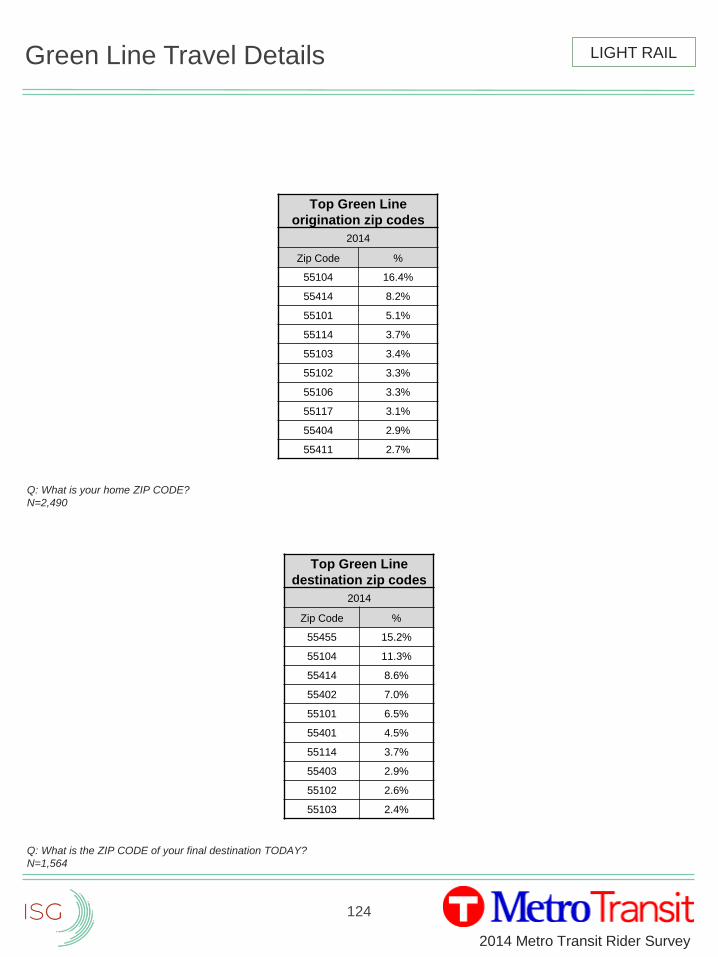
124
2014 Metro Transit Rider Survey
Green Line Travel Details
Q: What is your home ZIP CODE?
N=2,490
Q: What is the ZIP CODE of your final destination TODAY?
N=1,564
Top Green Line
origination zip codes
2014
Zip Code %
55104 16.4%
55414 8.2%
55101 5.1%
55114 3.7%
55103 3.4%
55102 3.3%
55106 3.3%
55117 3.1%
55404 2.9%
55411 2.7%
Top Green Line
destination zip codes
2014
Zip Code %
55455 15.2%
55104 11.3%
55414 8.6%
55402 7.0%
55101 6.5%
55401 4.5%
55114 3.7%
55403 2.9%
55102 2.6%
55103 2.4%
LIGHT RAIL
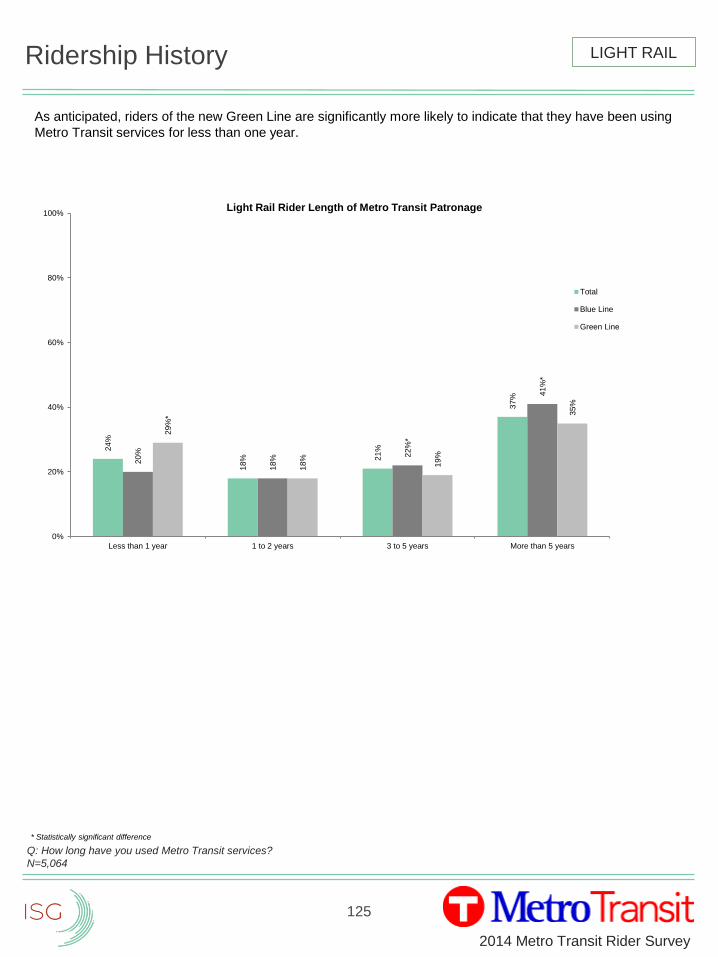
125
2014 Metro Transit Rider Survey
Ridership History
As anticipated, riders of the new Green Line are significantly more likely to indicate that they have been using
Metro Transit services for less than one year.
Q: How long have you used Metro Transit services?
N=5,064
24
%
18
% 21
%
37
%
20
%
18
%
22
%*
41
%*
29
%*
18
%
19
%
35
%
0%
20%
40%
60%
80%
100%
Less than 1 year 1 to 2 years 3 to 5 years More than 5 years
Light Rail Rider Length of Metro Transit Patronage
Total
Blue Line
Green Line
LIGHT RAIL
* Statistically significant difference
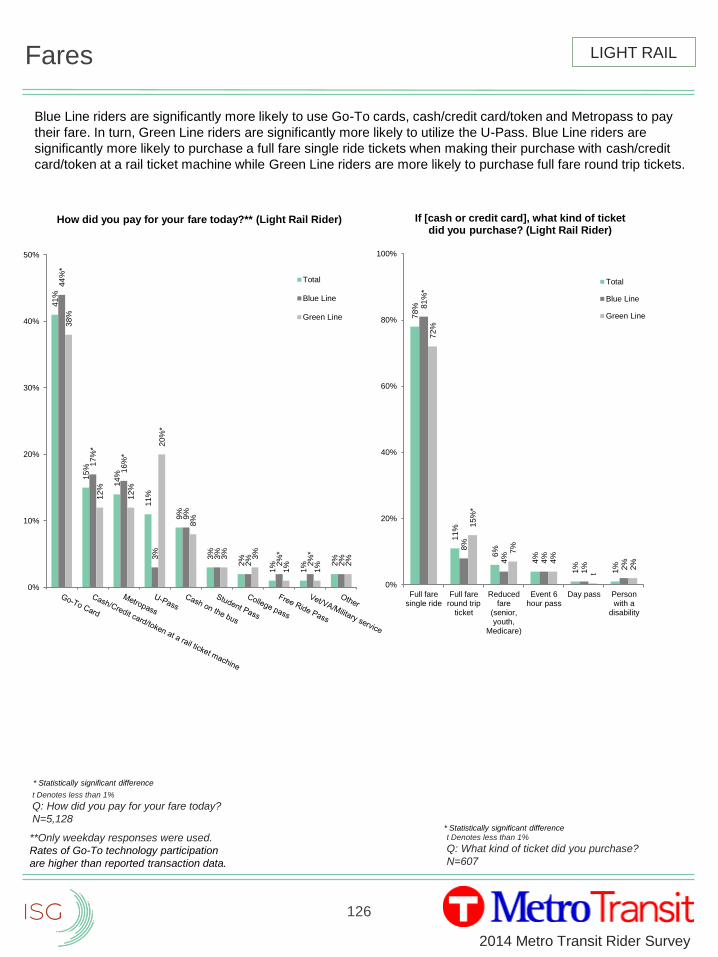
126
2014 Metro Transit Rider Survey
Fares
t Denotes less than 1%
Q: How did you pay for your fare today?
N=5,128
t Denotes less than 1%
Q: What kind of ticket did you purchase?
N=607
41
%
15
%
14
%
11
%
9%
3%
2%
1%
1% 2
%
44
%*
17
%*
16
%*
3%
9%
3%
2%
2%
*
2%
*
2%
38
%
12
%
12
%
20
%*
8%
3%
3%
1%
1% 2
%
0%
10%
20%
30%
40%
50%
How did you pay for your fare today?** (Light Rail Rider)
Total
Blue Line
Green Line
LIGHT RAIL
* Statistically significant difference
Blue Line riders are significantly more likely to use Go-To cards, cash/credit card/token and Metropass to pay
their fare. In turn, Green Line riders are significantly more likely to utilize the U-Pass. Blue Line riders are
significantly more likely to purchase a full fare single ride tickets when making their purchase with cash/credit
card/token at a rail ticket machine while Green Line riders are more likely to purchase full fare round trip tickets.
**Only weekday responses were used.
Rates of Go-To technology participation
are higher than reported transaction data.
78
%
11
%
6%
4%
1%
1%
81
%*
8%
4%
4%
1% 2%
72
%
15
%*
7%
4%
t
2%
0%
20%
40%
60%
80%
100%
Full faresingle ride
Full fareround trip
ticket
Reducedfare
(senior,youth,
Medicare)
Event 6hour pass
Day pass Personwith a
disability
If [cash or credit card], what kind of ticket did you purchase? (Light Rail Rider)
Total
Blue Line
Green Line
* Statistically significant difference
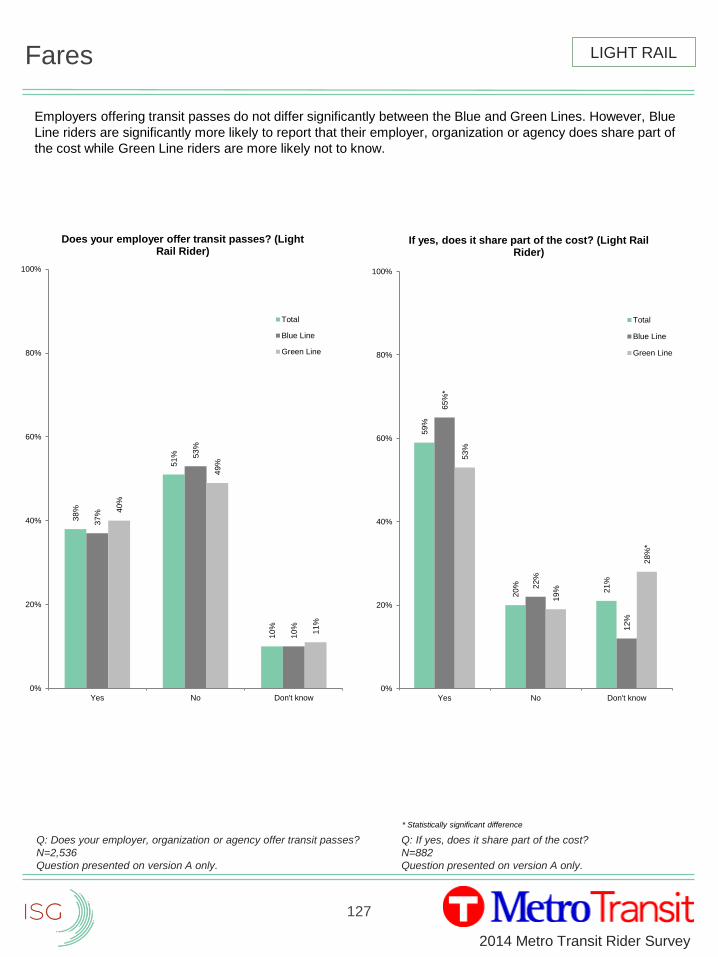
127
2014 Metro Transit Rider Survey
Fares
Q: Does your employer, organization or agency offer transit passes?
N=2,536
Question presented on version A only.
Q: If yes, does it share part of the cost?
N=882
Question presented on version A only.
38
%
51
%
10
%
37
%
53
%
10
%
40
%
49
%
11
%
0%
20%
40%
60%
80%
100%
Yes No Don't know
Does your employer offer transit passes? (Light Rail Rider)
Total
Blue Line
Green Line
59
%
20
%
21
%
65
%*
22
%
12
%
53
%
19
%
28
%*
0%
20%
40%
60%
80%
100%
Yes No Don't know
If yes, does it share part of the cost? (Light Rail Rider)
Total
Blue Line
Green Line
LIGHT RAIL
* Statistically significant difference
Employers offering transit passes do not differ significantly between the Blue and Green Lines. However, Blue
Line riders are significantly more likely to report that their employer, organization or agency does share part of
the cost while Green Line riders are more likely not to know.
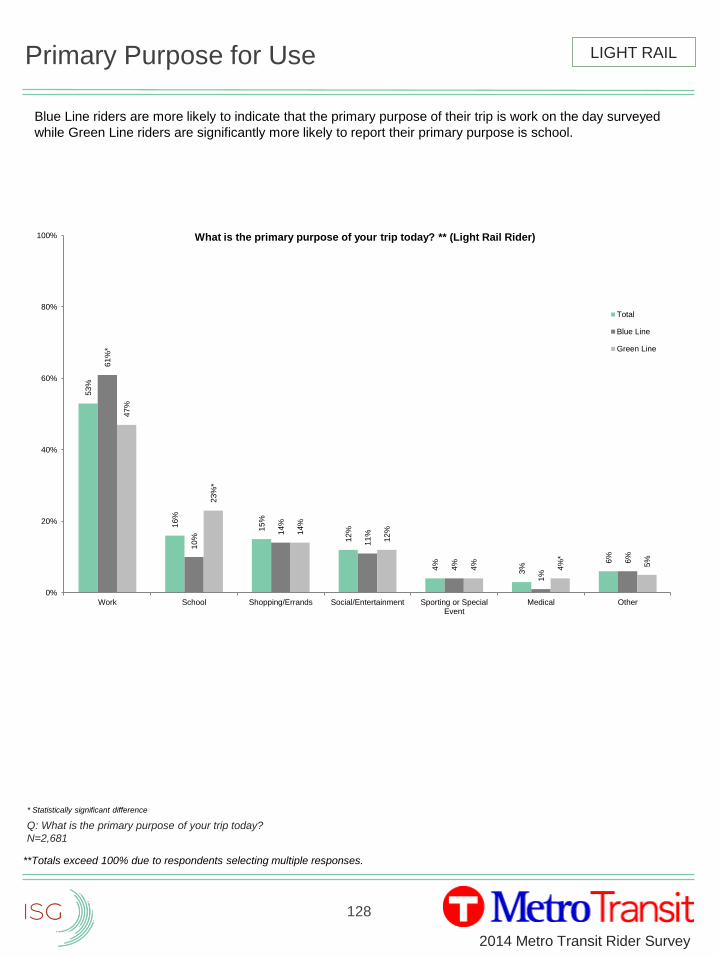
128
2014 Metro Transit Rider Survey
Primary Purpose for Use
Blue Line riders are more likely to indicate that the primary purpose of their trip is work on the day surveyed
while Green Line riders are significantly more likely to report their primary purpose is school.
Q: What is the primary purpose of your trip today?
N=2,681
53
%
16
%
15
%
12
%
4%
3%
6%
61
%*
10
%
14
%
11
%
4%
1%
6%
47
%
23
%*
14
%
12
%
4%
4%
*
5%
0%
20%
40%
60%
80%
100%
Work School Shopping/Errands Social/Entertainment Sporting or SpecialEvent
Medical Other
What is the primary purpose of your trip today? ** (Light Rail Rider)
Total
Blue Line
Green Line
LIGHT RAIL
* Statistically significant difference
**Totals exceed 100% due to respondents selecting multiple responses.
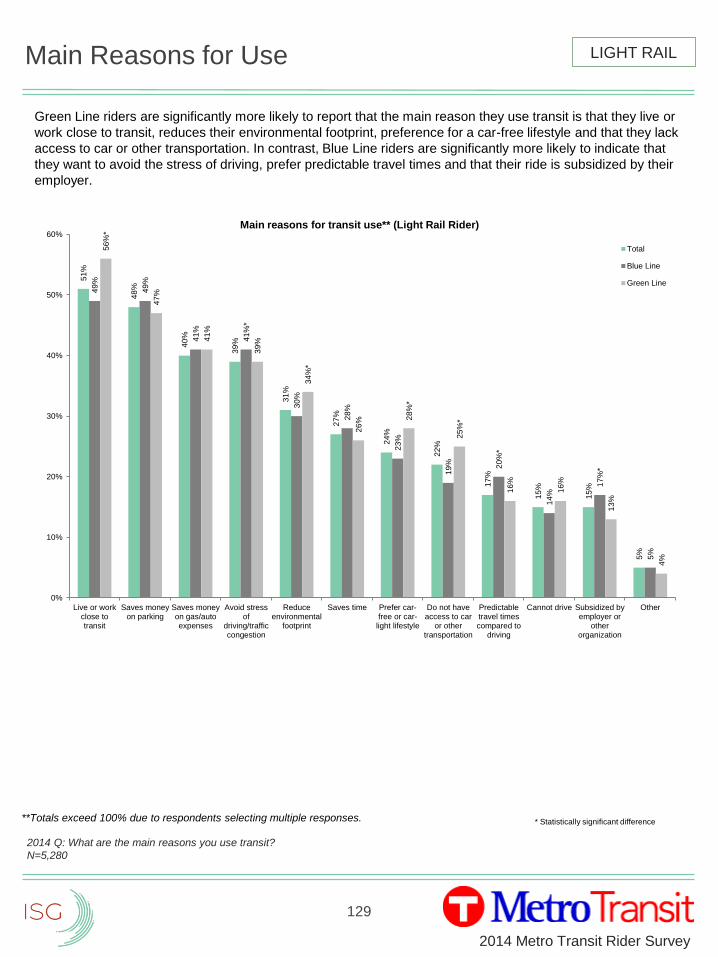
129
2014 Metro Transit Rider Survey
Main Reasons for Use
Green Line riders are significantly more likely to report that the main reason they use transit is that they live or
work close to transit, reduces their environmental footprint, preference for a car-free lifestyle and that they lack
access to car or other transportation. In contrast, Blue Line riders are significantly more likely to indicate that
they want to avoid the stress of driving, prefer predictable travel times and that their ride is subsidized by their
employer.
2014 Q: What are the main reasons you use transit?
N=5,280
51
%
48
%
40
%
39
%
31
%
27
%
24
%
22
%
17
%
15
%
15
%
5%
49
%
49
%
41
%
41
%*
30
%
28
%
23
%
19
% 20
%*
14
%
17
%*
5%
56
%*
47
%
41
%
39
%
34
%*
26
% 28
%*
25
%*
16
%
16
%
13
%
4%
0%
10%
20%
30%
40%
50%
60%
Live or workclose totransit
Saves moneyon parking
Saves moneyon gas/autoexpenses
Avoid stressof
driving/trafficcongestion
Reduceenvironmental
footprint
Saves time Prefer car-free or car-light lifestyle
Do not haveaccess to car
or othertransportation
Predictabletravel timescompared to
driving
Cannot drive Subsidized byemployer or
otherorganization
Other
Main reasons for transit use** (Light Rail Rider)
Total
Blue Line
Green Line
LIGHT RAIL
**Totals exceed 100% due to respondents selecting multiple responses. * Statistically significant difference
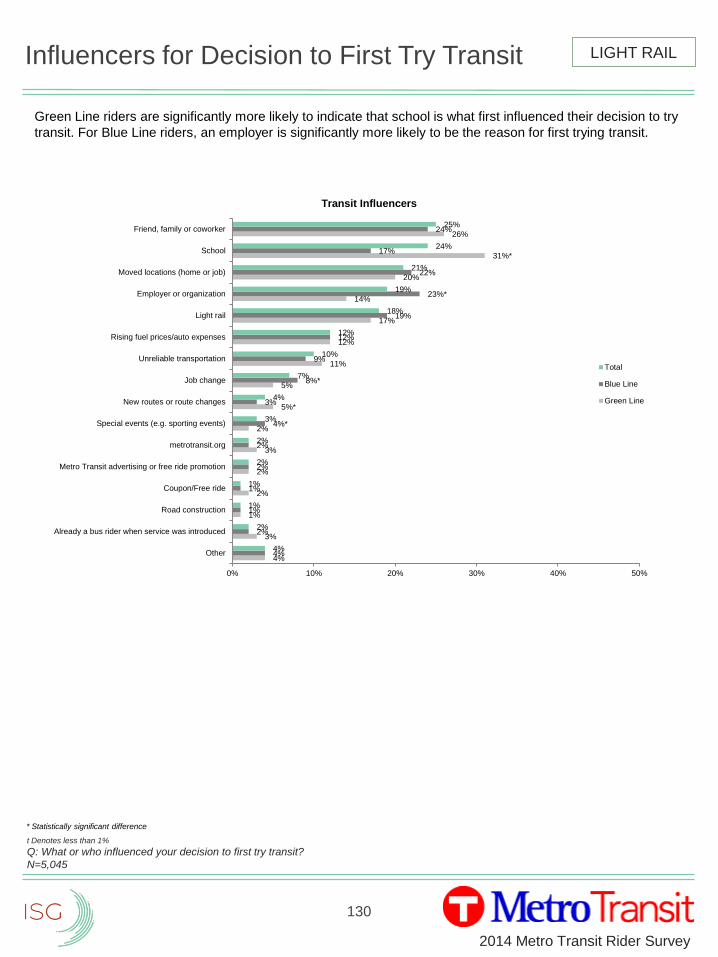
130
2014 Metro Transit Rider Survey
Influencers for Decision to First Try Transit
Green Line riders are significantly more likely to indicate that school is what first influenced their decision to try
transit. For Blue Line riders, an employer is significantly more likely to be the reason for first trying transit.
t Denotes less than 1%
Q: What or who influenced your decision to first try transit?
N=5,045
4%
3%
1%
2%
2%
3%
2%
5%*
5%
11%
12%
17%
14%
20%
31%*
26%
4%
2%
1%
1%
2%
2%
4%*
3%
8%*
9%
12%
19%
23%*
22%
17%
24%
4%
2%
1%
1%
2%
2%
3%
4%
7%
10%
12%
18%
19%
21%
24%
25%
0% 10% 20% 30% 40% 50%
Other
Already a bus rider when service was introduced
Road construction
Coupon/Free ride
Metro Transit advertising or free ride promotion
metrotransit.org
Special events (e.g. sporting events)
New routes or route changes
Job change
Unreliable transportation
Rising fuel prices/auto expenses
Light rail
Employer or organization
Moved locations (home or job)
School
Friend, family or coworker
Transit Influencers
Total
Blue Line
Green Line
LIGHT RAIL
* Statistically significant difference
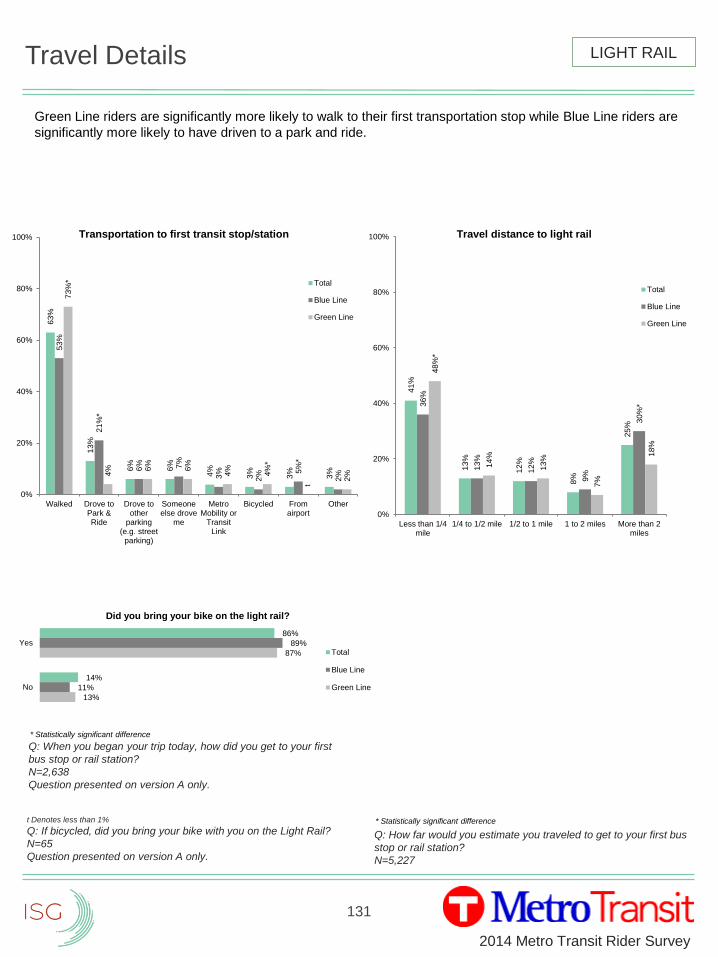
131
2014 Metro Transit Rider Survey
Travel Details
Green Line riders are significantly more likely to walk to their first transportation stop while Blue Line riders are
significantly more likely to have driven to a park and ride.
Q: When you began your trip today, how did you get to your first
bus stop or rail station?
N=2,638
Question presented on version A only.
Q: How far would you estimate you traveled to get to your first bus
stop or rail station?
N=5,227
t Denotes less than 1%
Q: If bicycled, did you bring your bike with you on the Light Rail?
N=65
Question presented on version A only.
63
%
13
%
6%
6%
4%
3%
3%
3%
53
%
21
%*
6% 7%
3%
2% 5
%*
2%
73
%*
4% 6
%
6%
4%
4%
*
t
2%
0%
20%
40%
60%
80%
100%
Walked Drove toPark &Ride
Drove toother
parking(e.g. street
parking)
Someoneelse drove
me
MetroMobility or
TransitLink
Bicycled Fromairport
Other
Transportation to first transit stop/station
Total
Blue Line
Green Line
41
%
13
%
12
%
8%
25
%
36
%
13
%
12
%
9%
30
%*
48
%*
14
%
13
%
7%
18
%
0%
20%
40%
60%
80%
100%
Less than 1/4mile
1/4 to 1/2 mile 1/2 to 1 mile 1 to 2 miles More than 2miles
Travel distance to light rail
Total
Blue Line
Green Line
13%
87%
11%
89%
14%
86%
No
Yes
Did you bring your bike on the light rail?
Total
Blue Line
Green Line
LIGHT RAIL
* Statistically significant difference
* Statistically significant difference
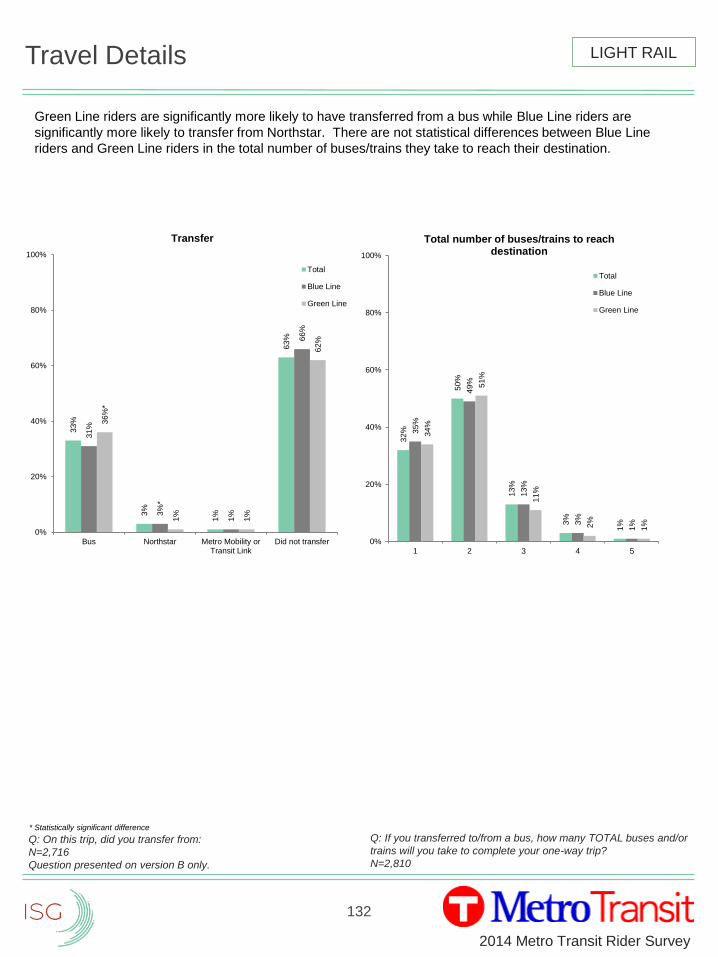
132
2014 Metro Transit Rider Survey
Travel Details
Green Line riders are significantly more likely to have transferred from a bus while Blue Line riders are
significantly more likely to transfer from Northstar. There are not statistical differences between Blue Line
riders and Green Line riders in the total number of buses/trains they take to reach their destination.
Q: If you transferred to/from a bus, how many TOTAL buses and/or
trains will you take to complete your one-way trip?
N=2,810
Q: On this trip, did you transfer from:
N=2,716
Question presented on version B only.
33
%
3%
1%
63
%
31
%
3%
*
1%
66
%
36
%*
1%
1%
62
%
0%
20%
40%
60%
80%
100%
Bus Northstar Metro Mobility orTransit Link
Did not transfer
Transfer
Total
Blue Line
Green Line
32
%
50
%
13
%
3%
1%
35
%
49
%
13
%
3%
1%
34
%
51
%
11
%
2%
1%
0%
20%
40%
60%
80%
100%
1 2 3 4 5
Total number of buses/trains to reach destination
Total
Blue Line
Green Line
LIGHT RAIL
* Statistically significant difference
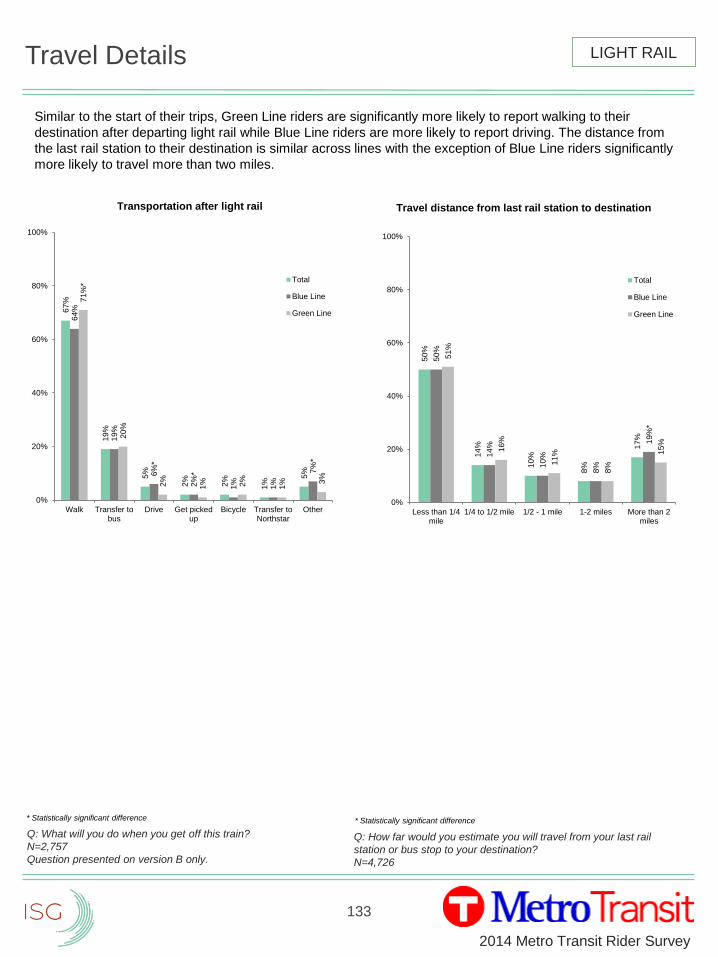
133
2014 Metro Transit Rider Survey
Travel Details
Similar to the start of their trips, Green Line riders are significantly more likely to report walking to their
destination after departing light rail while Blue Line riders are more likely to report driving. The distance from
the last rail station to their destination is similar across lines with the exception of Blue Line riders significantly
more likely to travel more than two miles.
Q: How far would you estimate you will travel from your last rail
station or bus stop to your destination?
N=4,726
Q: What will you do when you get off this train?
N=2,757
Question presented on version B only.
67
%
19
%
5%
2%
2%
1%
5%
64
%
19
%
6%
*
2%
*
1%
1%
7%
*
71
%*
20
%
2%
1% 2%
1% 3
%
0%
20%
40%
60%
80%
100%
Walk Transfer tobus
Drive Get pickedup
Bicycle Transfer toNorthstar
Other
Transportation after light rail
Total
Blue Line
Green Line
50
%
14
%
10
%
8%
17
%
50
%
14
%
10
%
8%
19
%*
51
%
16
%
11
%
8%
15
%
0%
20%
40%
60%
80%
100%
Less than 1/4mile
1/4 to 1/2 mile 1/2 - 1 mile 1-2 miles More than 2miles
Travel distance from last rail station to destination
Total
Blue Line
Green Line
LIGHT RAIL
* Statistically significant difference * Statistically significant difference
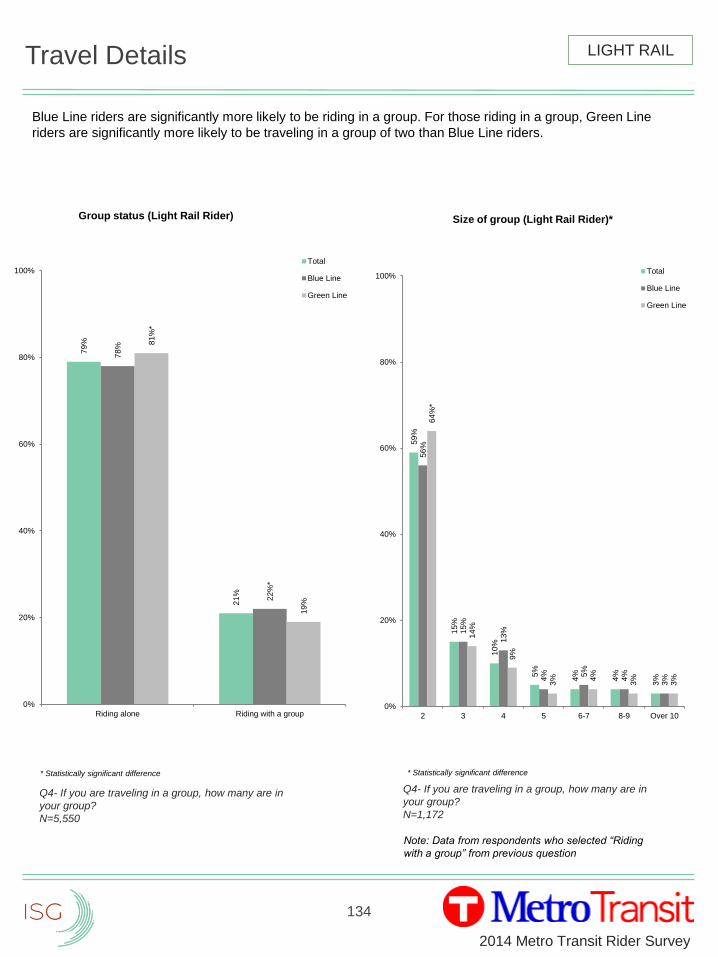
134
2014 Metro Transit Rider Survey
Travel Details
59
%
15
%
10
%
5%
4%
4%
3%
56
%
15
%
13
%
4% 5%
4%
3%
64
%*
14
%
9%
3% 4%
3%
3%
0%
20%
40%
60%
80%
100%
2 3 4 5 6-7 8-9 Over 10
Size of group (Light Rail Rider)*
Total
Blue Line
Green Line
79
%
21
%
78
%
22
%*
81
%*
19
%
0%
20%
40%
60%
80%
100%
Riding alone Riding with a group
Group status (Light Rail Rider)
Total
Blue Line
Green Line
Q4- If you are traveling in a group, how many are in
your group?
N=1,172
Note: Data from respondents who selected “Riding
with a group” from previous question
Q4- If you are traveling in a group, how many are in
your group?
N=5,550
Blue Line riders are significantly more likely to be riding in a group. For those riding in a group, Green Line
riders are significantly more likely to be traveling in a group of two than Blue Line riders.
LIGHT RAIL
* Statistically significant difference * Statistically significant difference
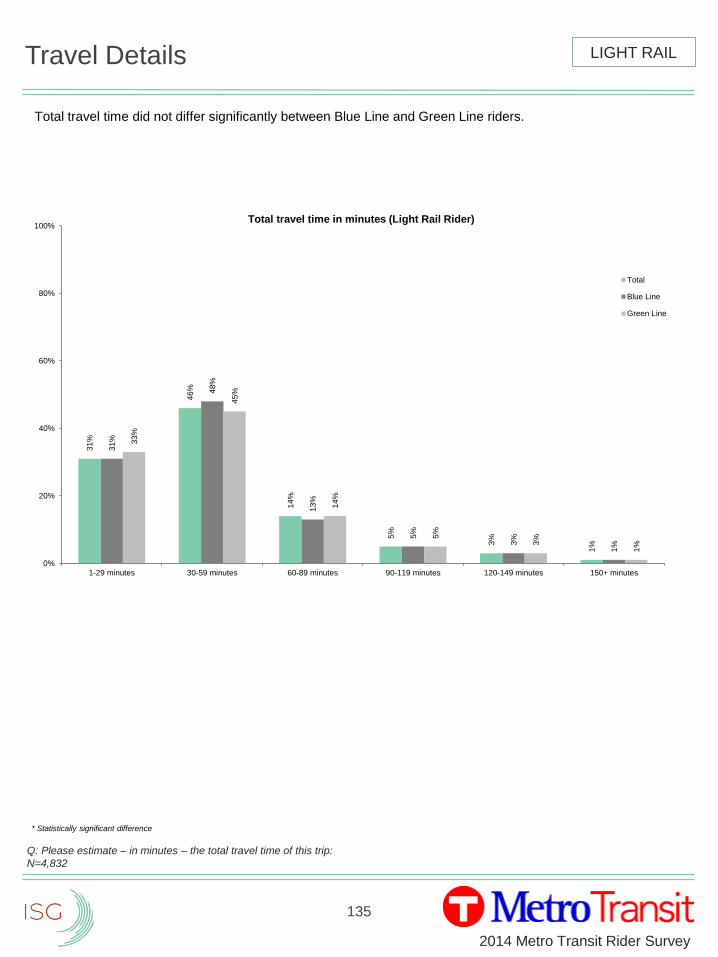
135
2014 Metro Transit Rider Survey
Travel Details
Total travel time did not differ significantly between Blue Line and Green Line riders.
Q: Please estimate – in minutes – the total travel time of this trip:
N=4,832
31
%
46
%
14
%
5%
3%
1%
31
%
48
%
13
%
5%
3%
1%
33
%
45
%
14
%
5%
3%
1%
0%
20%
40%
60%
80%
100%
1-29 minutes 30-59 minutes 60-89 minutes 90-119 minutes 120-149 minutes 150+ minutes
Total travel time in minutes (Light Rail Rider)
Total
Blue Line
Green Line
LIGHT RAIL
* Statistically significant difference
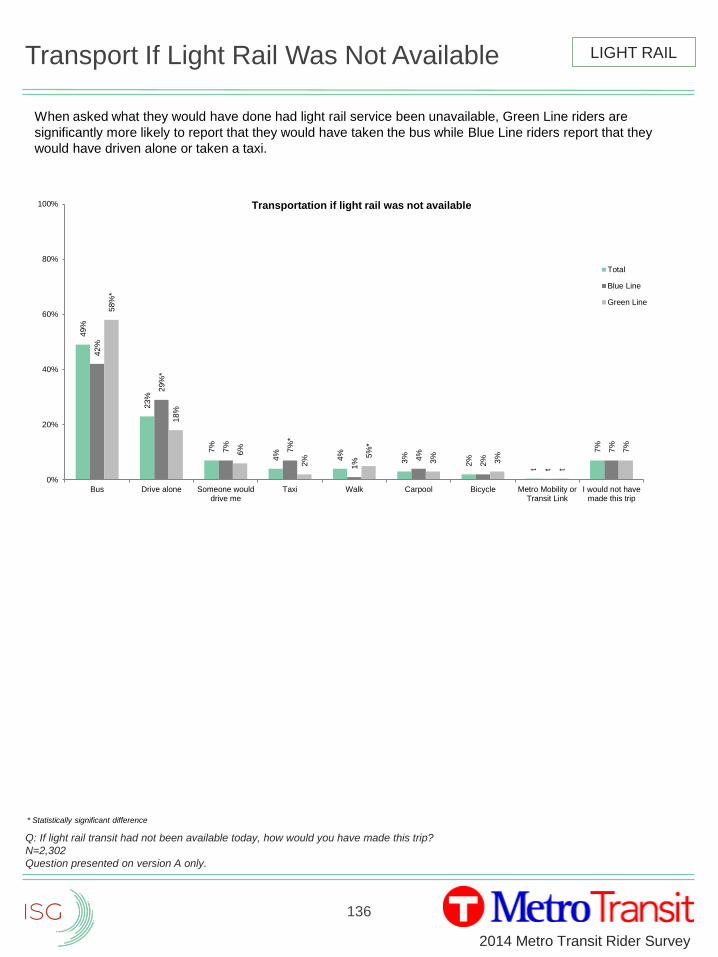
136
2014 Metro Transit Rider Survey
Transport If Light Rail Was Not Available
When asked what they would have done had light rail service been unavailable, Green Line riders are
significantly more likely to report that they would have taken the bus while Blue Line riders report that they
would have driven alone or taken a taxi.
Q: If light rail transit had not been available today, how would you have made this trip?
N=2,302
Question presented on version A only.
49
%
23
%
7%
4%
4%
3%
2%
t
7%
42
%
29
%*
7%
7%
*
1%
4%
2%
t
7%
58
%*
18
%
6%
2%
5%
*
3%
3%
t
7%
0%
20%
40%
60%
80%
100%
Bus Drive alone Someone woulddrive me
Taxi Walk Carpool Bicycle Metro Mobility orTransit Link
I would not havemade this trip
Transportation if light rail was not available
Total
Blue Line
Green Line
LIGHT RAIL
* Statistically significant difference
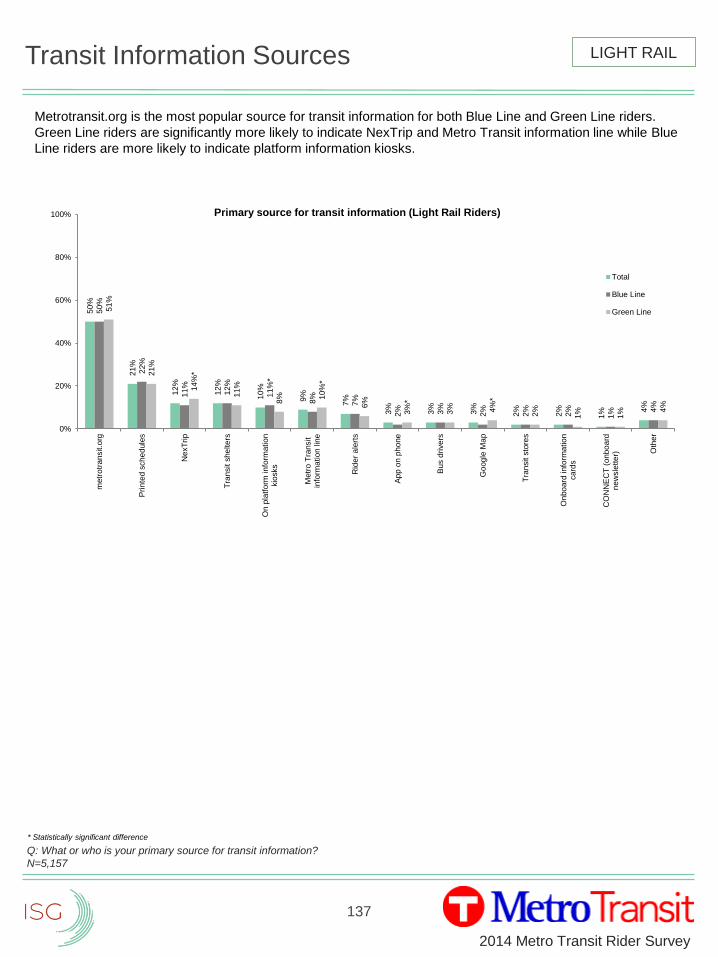
137
2014 Metro Transit Rider Survey
Transit Information Sources
Metrotransit.org is the most popular source for transit information for both Blue Line and Green Line riders.
Green Line riders are significantly more likely to indicate NexTrip and Metro Transit information line while Blue
Line riders are more likely to indicate platform information kiosks.
Q: What or who is your primary source for transit information?
N=5,157
50
%
21
%
12
%
12
%
10
%
9%
7%
3%
3%
3%
2%
2%
1% 4
%
50
%
22
%
11
%
12
%
11
%*
8%
7%
2% 3%
2%
2%
2%
1% 4
%
51
%
21
%
14
%*
11
%
8% 10
%*
6%
3%
*
3% 4%
*
2%
1%
1% 4
%
0%
20%
40%
60%
80%
100%
metr
otr
an
sit.o
rg
Pri
nte
d s
ch
ed
ule
s
NexT
rip
Tra
nsit s
he
lte
rs
On
pla
tfo
rm in
form
atio
nkio
sks
Metr
o T
ransit
info
rma
tio
n lin
e
Rid
er
ale
rts
Ap
p o
n p
ho
ne
Bu
s d
rivers
Go
og
le M
ap
Tra
nsit s
tore
s
On
bo
ard
info
rma
tio
nca
rds
CO
NN
EC
T (
onb
oa
rdn
ew
sle
tte
r) Oth
er
Primary source for transit information (Light Rail Riders)
Total
Blue Line
Green Line
LIGHT RAIL
* Statistically significant difference
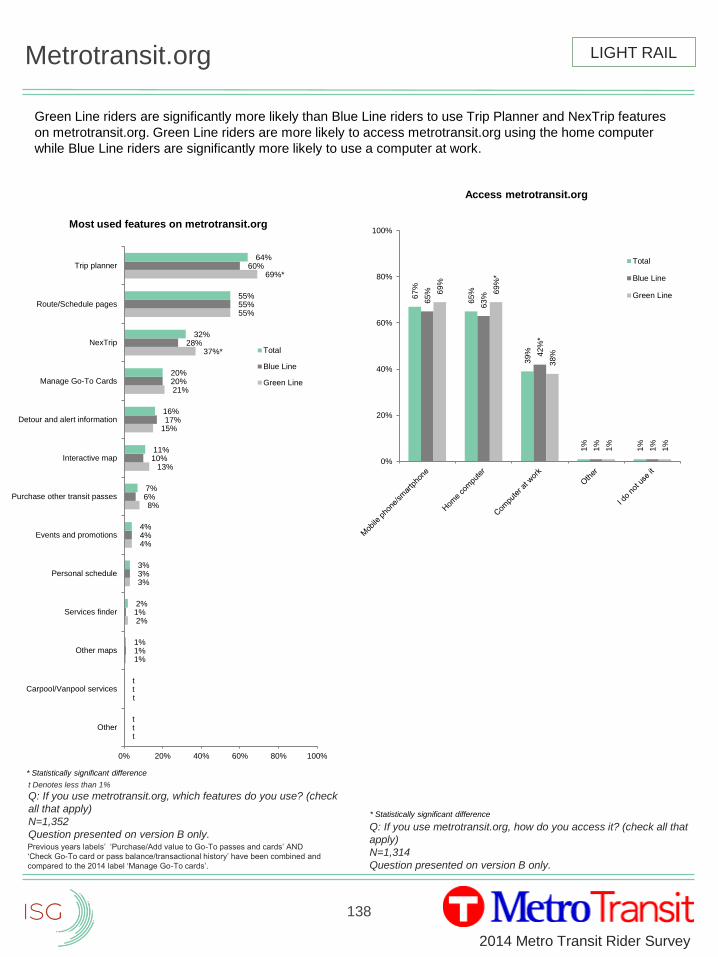
138
2014 Metro Transit Rider Survey
Metrotransit.org
Green Line riders are significantly more likely than Blue Line riders to use Trip Planner and NexTrip features
on metrotransit.org. Green Line riders are more likely to access metrotransit.org using the home computer
while Blue Line riders are significantly more likely to use a computer at work.
Q: If you use metrotransit.org, how do you access it? (check all that
apply)
N=1,314
Question presented on version B only.
t Denotes less than 1%
Q: If you use metrotransit.org, which features do you use? (check
all that apply)
N=1,352
Question presented on version B only.
t
t
1%
2%
3%
4%
8%
13%
15%
21%
37%*
55%
69%*
t
t
1%
1%
3%
4%
6%
10%
17%
20%
28%
55%
60%
t
t
1%
2%
3%
4%
7%
11%
16%
20%
32%
55%
64%
0% 20% 40% 60% 80% 100%
Other
Carpool/Vanpool services
Other maps
Services finder
Personal schedule
Events and promotions
Purchase other transit passes
Interactive map
Detour and alert information
Manage Go-To Cards
NexTrip
Route/Schedule pages
Trip planner
Most used features on metrotransit.org
Total
Blue Line
Green Line
LIGHT RAIL
67
%
65
%
39
%
1%
1%
65
%
63
%
42
%*
1%
1%
69
%
69
%*
38
%
1%
1%
0%
20%
40%
60%
80%
100%
Access metrotransit.org
Total
Blue Line
Green Line
* Statistically significant difference
Previous years labels’ ‘Purchase/Add value to Go-To passes and cards’ AND
‘Check Go-To card or pass balance/transactional history’ have been combined and
compared to the 2014 label ‘Manage Go-To cards’.
* Statistically significant difference
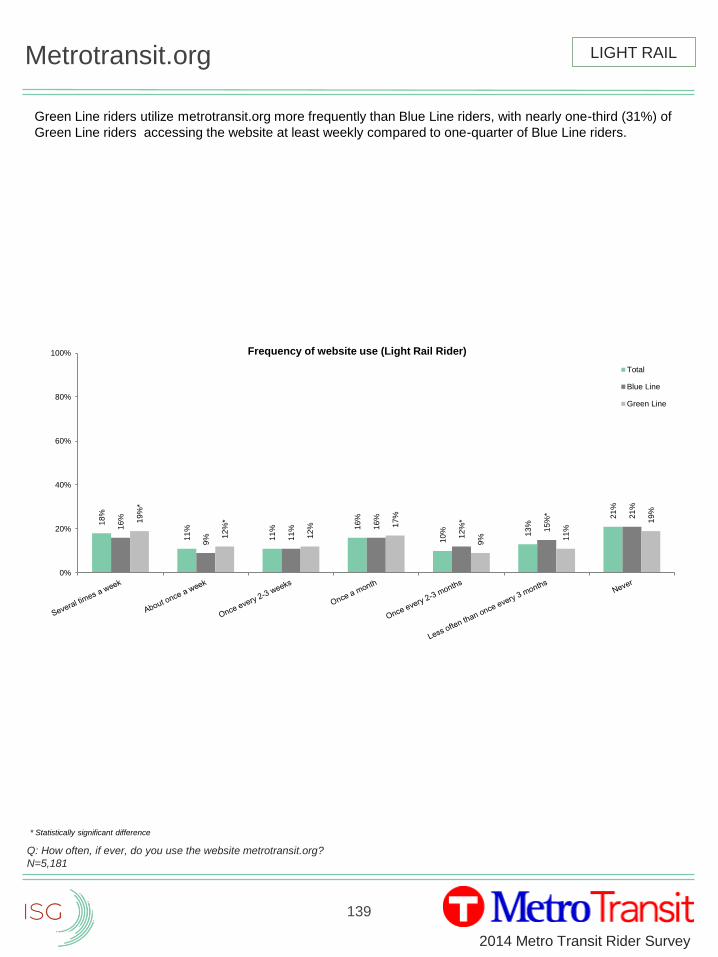
139
2014 Metro Transit Rider Survey
Metrotransit.org
Green Line riders utilize metrotransit.org more frequently than Blue Line riders, with nearly one-third (31%) of
Green Line riders accessing the website at least weekly compared to one-quarter of Blue Line riders.
Q: How often, if ever, do you use the website metrotransit.org?
N=5,181
LIGHT RAIL
18
%
11
%
11
% 16
%
10
% 13
%
21
%
16
%
9% 11
% 16
%
12
%*
15
%* 21
%
19
%*
12
%*
12
% 17
%
9% 11
%
19
%
0%
20%
40%
60%
80%
100% Frequency of website use (Light Rail Rider)
Total
Blue Line
Green Line
* Statistically significant difference
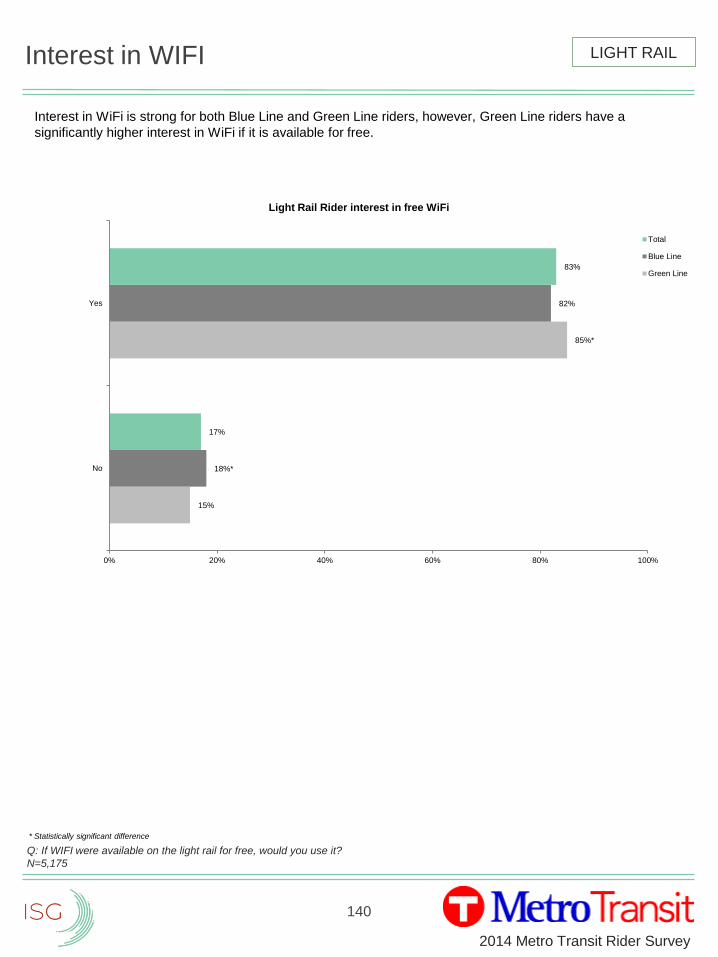
140
2014 Metro Transit Rider Survey
Interest in WIFI
Interest in WiFi is strong for both Blue Line and Green Line riders, however, Green Line riders have a
significantly higher interest in WiFi if it is available for free.
Q: If WIFI were available on the light rail for free, would you use it?
N=5,175
15%
85%*
18%*
82%
17%
83%
0% 20% 40% 60% 80% 100%
No
Yes
Light Rail Rider interest in free WiFi
Total
Blue Line
Green Line
LIGHT RAIL
* Statistically significant difference
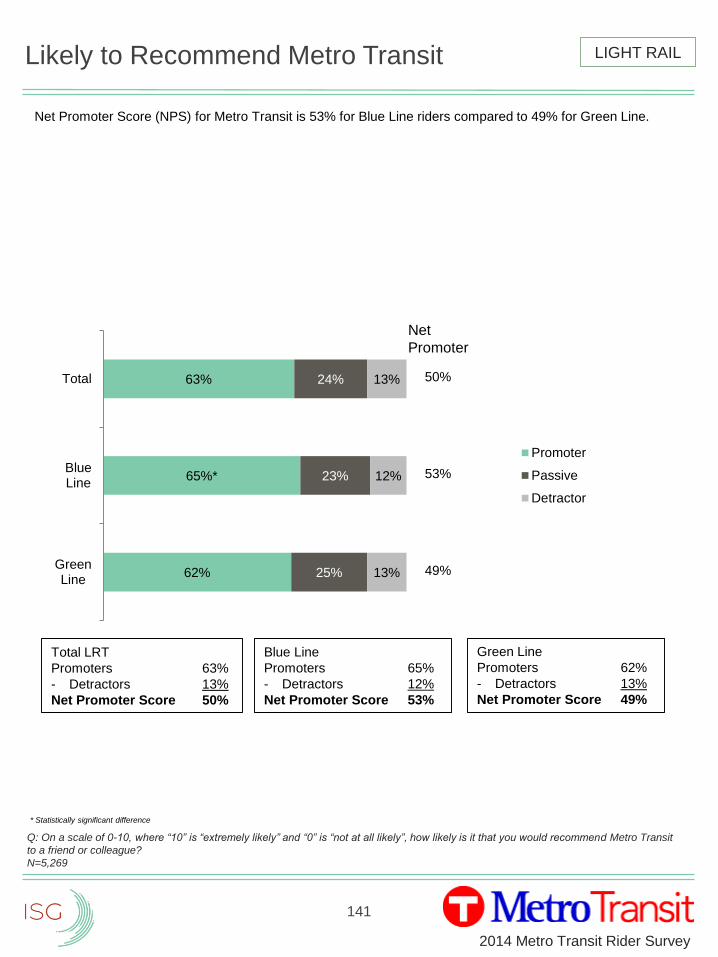
141
2014 Metro Transit Rider Survey
Likely to Recommend Metro Transit
Net Promoter Score (NPS) for Metro Transit is 53% for Blue Line riders compared to 49% for Green Line.
Q: On a scale of 0-10, where “10” is “extremely likely” and “0” is “not at all likely”, how likely is it that you would recommend Metro Transit
to a friend or colleague?
N=5,269
62%
65%*
63%
25%
23%
24%
13%
12%
13%
GreenLine
BlueLine
Total
Promoter
Passive
Detractor
Net
Promoter
50%
49%
53%
LIGHT RAIL
* Statistically significant difference
Blue Line
Promoters 65%
- Detractors 12%
Net Promoter Score 53%
Green Line
Promoters 62%
- Detractors 13%
Net Promoter Score 49%
Total LRT
Promoters 63%
- Detractors 13%
Net Promoter Score 50%
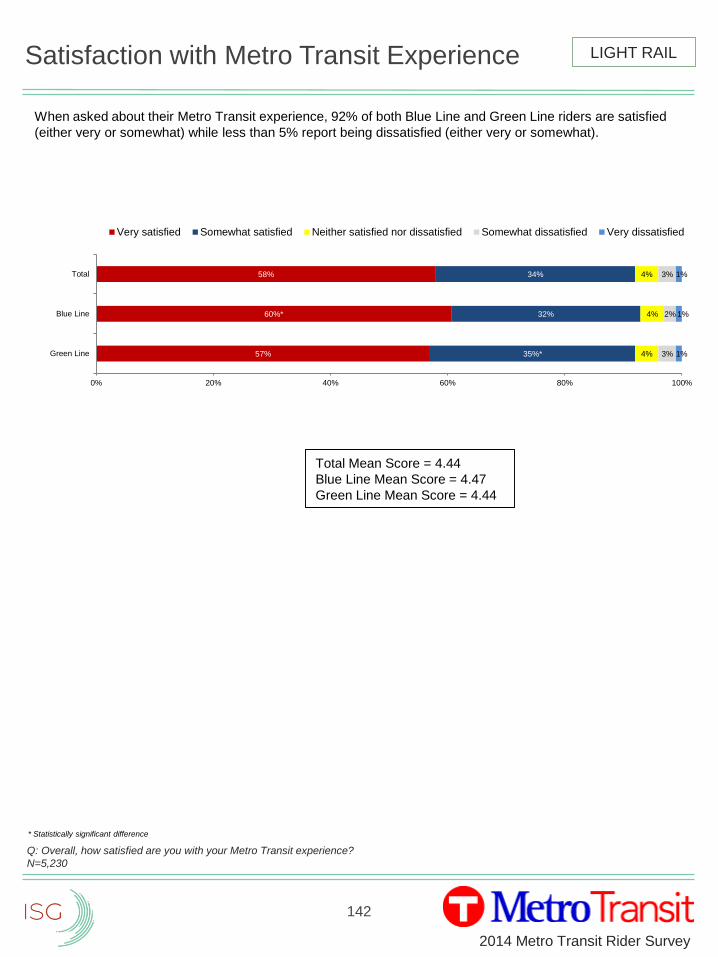
142
2014 Metro Transit Rider Survey
Satisfaction with Metro Transit Experience
When asked about their Metro Transit experience, 92% of both Blue Line and Green Line riders are satisfied
(either very or somewhat) while less than 5% report being dissatisfied (either very or somewhat).
Q: Overall, how satisfied are you with your Metro Transit experience?
N=5,230
57%
60%*
58%
35%*
32%
34%
4%
4%
4%
3%
2%
3%
1%
1%
1%
0% 20% 40% 60% 80% 100%
Green Line
Blue Line
Total
Very satisfied Somewhat satisfied Neither satisfied nor dissatisfied Somewhat dissatisfied Very dissatisfied
Total Mean Score = 4.44
Blue Line Mean Score = 4.47
Green Line Mean Score = 4.44
LIGHT RAIL
* Statistically significant difference
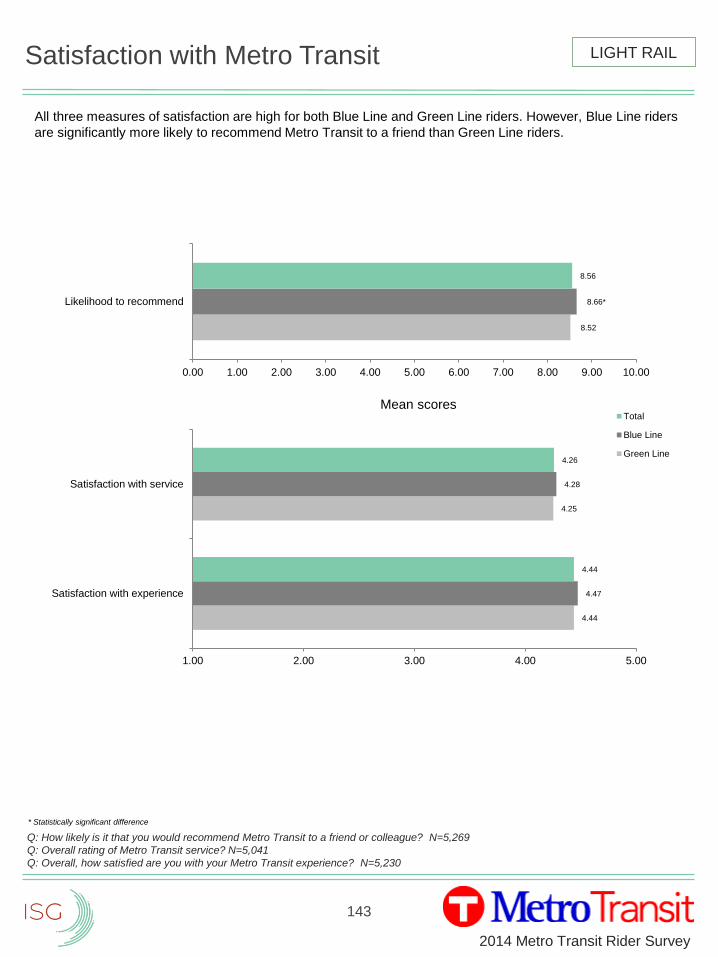
143
2014 Metro Transit Rider Survey
Satisfaction with Metro Transit
4.44
4.25
4.47
4.28
4.44
4.26
1.00 2.00 3.00 4.00 5.00
Satisfaction with experience
Satisfaction with service
Total
Blue Line
Green Line
8.52
8.66*
8.56
0.00 1.00 2.00 3.00 4.00 5.00 6.00 7.00 8.00 9.00 10.00
Likelihood to recommend
Mean scores
All three measures of satisfaction are high for both Blue Line and Green Line riders. However, Blue Line riders
are significantly more likely to recommend Metro Transit to a friend than Green Line riders.
LIGHT RAIL
Q: How likely is it that you would recommend Metro Transit to a friend or colleague? N=5,269
Q: Overall rating of Metro Transit service? N=5,041
Q: Overall, how satisfied are you with your Metro Transit experience? N=5,230
* Statistically significant difference
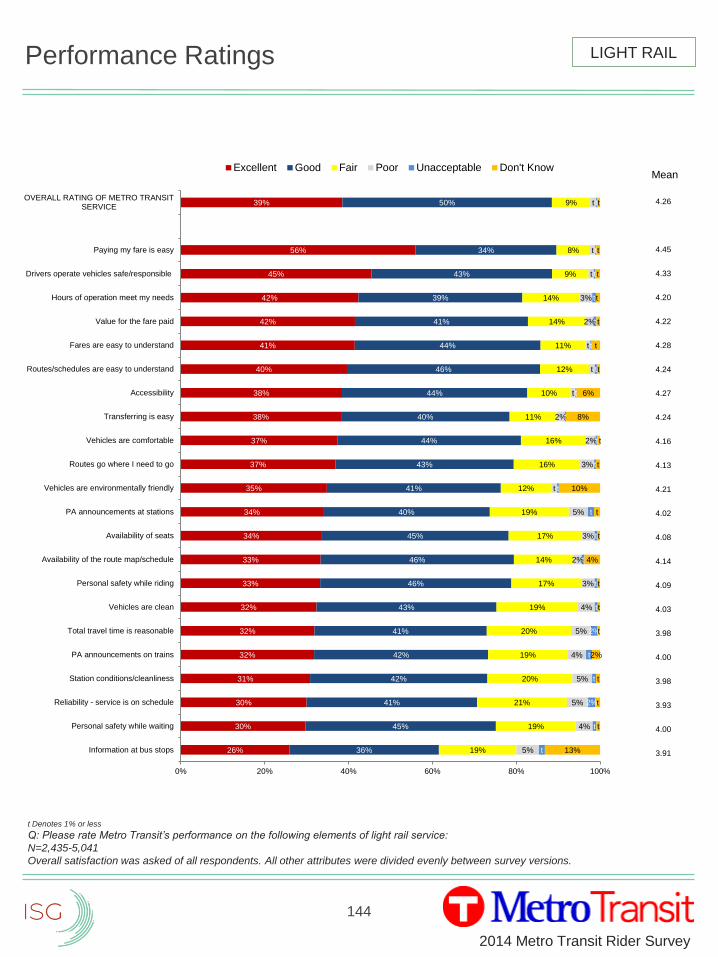
144
2014 Metro Transit Rider Survey
Mean
4.26
4.45
4.33
4.20
4.22
4.28
4.24
4.27
4.24
4.16
4.13
4.21
4.02
4.08
4.14
4.09
4.03
3.98
4.00
3.98
3.93
4.00
3.91
Performance Ratings
t Denotes 1% or less
Q: Please rate Metro Transit’s performance on the following elements of light rail service:
N=2,435-5,041
Overall satisfaction was asked of all respondents. All other attributes were divided evenly between survey versions.
26%
30%
30%
31%
32%
32%
32%
33%
33%
34%
34%
35%
37%
37%
38%
38%
40%
41%
42%
42%
45%
56%
39%
36%
45%
41%
42%
42%
41%
43%
46%
46%
45%
40%
41%
43%
44%
40%
44%
46%
44%
41%
39%
43%
34%
50%
19%
19%
21%
20%
19%
20%
19%
17%
14%
17%
19%
12%
16%
16%
11%
10%
12%
11%
14%
14%
9%
8%
9%
5%
4%
5%
5%
4%
5%
4%
3%
2%
3%
5%
t
3%
2%
2%
t
t
t
2%
3%
t
t
t
t
t
2%
t
t
2%
t
t
t
t
t
t
t
t
t
t
t
t
t
t
t
t
t
13%
t
t
t
2%
t
t
t
4%
t
t
10%
t
t
8%
6%
t
t
t
t
t
t
t
0% 20% 40% 60% 80% 100%
Information at bus stops
Personal safety while waiting
Reliability - service is on schedule
Station conditions/cleanliness
PA announcements on trains
Total travel time is reasonable
Vehicles are clean
Personal safety while riding
Availability of the route map/schedule
Availability of seats
PA announcements at stations
Vehicles are environmentally friendly
Routes go where I need to go
Vehicles are comfortable
Transferring is easy
Accessibility
Routes/schedules are easy to understand
Fares are easy to understand
Value for the fare paid
Hours of operation meet my needs
Drivers operate vehicles safe/responsible
Paying my fare is easy
OVERALL RATING OF METRO TRANSITSERVICE
Excellent Good Fair Poor Unacceptable Don't Know
LIGHT RAIL
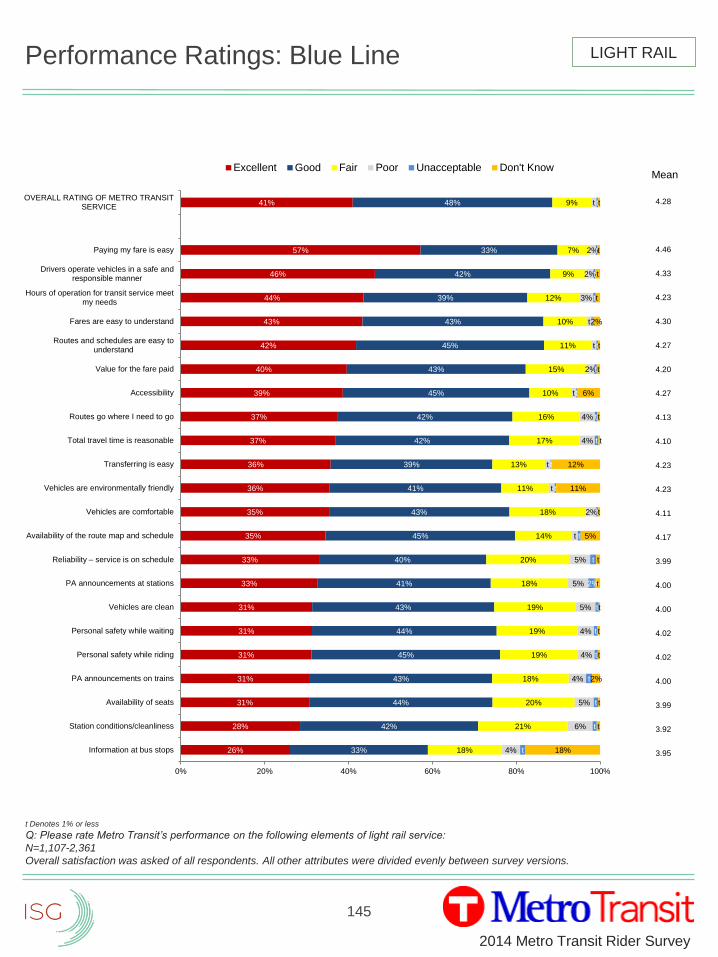
145
2014 Metro Transit Rider Survey
Mean
4.28
4.46
4.33
4.23
4.30
4.27
4.20
4.27
4.13
4.10
4.23
4.23
4.11
4.17
3.99
4.00
4.00
4.02
4.02
4.00
3.99
3.92
3.95
Performance Ratings: Blue Line
t Denotes 1% or less
Q: Please rate Metro Transit’s performance on the following elements of light rail service:
N=1,107-2,361
Overall satisfaction was asked of all respondents. All other attributes were divided evenly between survey versions.
26%
28%
31%
31%
31%
31%
31%
33%
33%
35%
35%
36%
36%
37%
37%
39%
40%
42%
43%
44%
46%
57%
41%
33%
42%
44%
43%
45%
44%
43%
41%
40%
45%
43%
41%
39%
42%
42%
45%
43%
45%
43%
39%
42%
33%
48%
18%
21%
20%
18%
19%
19%
19%
18%
20%
14%
18%
11%
13%
17%
16%
10%
15%
11%
10%
12%
9%
7%
9%
4%
6%
5%
4%
4%
4%
5%
5%
5%
t
2%
t
t
4%
4%
t
2%
t
t
3%
2%
2%
t
t
t
t
t
t
t
t
2%
t
t
t
t
t
t
t
t
t
t
t
t
t
t
t
18%
t
t
2%
t
t
t
t
t
5%
t
11%
12%
t
t
6%
t
t
2%
t
t
t
t
0% 20% 40% 60% 80% 100%
Information at bus stops
Station conditions/cleanliness
Availability of seats
PA announcements on trains
Personal safety while riding
Personal safety while waiting
Vehicles are clean
PA announcements at stations
Reliability – service is on schedule
Availability of the route map and schedule
Vehicles are comfortable
Vehicles are environmentally friendly
Transferring is easy
Total travel time is reasonable
Routes go where I need to go
Accessibility
Value for the fare paid
Routes and schedules are easy tounderstand
Fares are easy to understand
Hours of operation for transit service meetmy needs
Drivers operate vehicles in a safe andresponsible manner
Paying my fare is easy
OVERALL RATING OF METRO TRANSITSERVICE
Excellent Good Fair Poor Unacceptable Don't Know
LIGHT RAIL
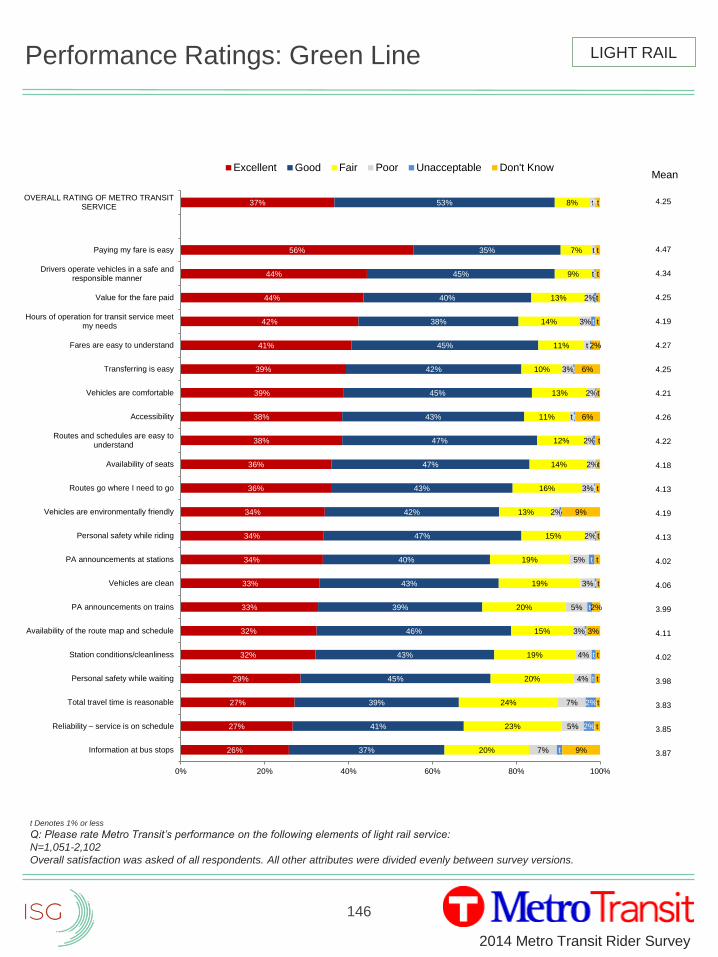
146
2014 Metro Transit Rider Survey
Mean
4.25
4.47
4.34
4.25
4.19
4.27
4.25
4.21
4.26
4.22
4.18
4.13
4.19
4.13
4.02
4.06
3.99
4.11
4.02
3.98
3.83
3.85
3.87
Performance Ratings: Green Line
t Denotes 1% or less
Q: Please rate Metro Transit’s performance on the following elements of light rail service:
N=1,051-2,102
Overall satisfaction was asked of all respondents. All other attributes were divided evenly between survey versions.
26%
27%
27%
29%
32%
32%
33%
33%
34%
34%
34%
36%
36%
38%
38%
39%
39%
41%
42%
44%
44%
56%
37%
37%
41%
39%
45%
43%
46%
39%
43%
40%
47%
42%
43%
47%
47%
43%
45%
42%
45%
38%
40%
45%
35%
53%
20%
23%
24%
20%
19%
15%
20%
19%
19%
15%
13%
16%
14%
12%
11%
13%
10%
11%
14%
13%
9%
7%
8%
7%
5%
7%
4%
4%
3%
5%
3%
5%
2%
2%
3%
2%
2%
t
2%
3%
t
3%
2%
t
t
t
t
2%
2%
t
t
t
t
t
t
t
t
t
t
t
t
t
t
t
t
t
t
t
2%
9%
t
t
t
t
3%
2%
t
t
t
9%
t
t
t
6%
t
6%
2%
t
t
t
t
t
0% 20% 40% 60% 80% 100%
Information at bus stops
Reliability – service is on schedule
Total travel time is reasonable
Personal safety while waiting
Station conditions/cleanliness
Availability of the route map and schedule
PA announcements on trains
Vehicles are clean
PA announcements at stations
Personal safety while riding
Vehicles are environmentally friendly
Routes go where I need to go
Availability of seats
Routes and schedules are easy tounderstand
Accessibility
Vehicles are comfortable
Transferring is easy
Fares are easy to understand
Hours of operation for transit service meetmy needs
Value for the fare paid
Drivers operate vehicles in a safe andresponsible manner
Paying my fare is easy
OVERALL RATING OF METRO TRANSITSERVICE
Excellent Good Fair Poor Unacceptable Don't Know
LIGHT RAIL
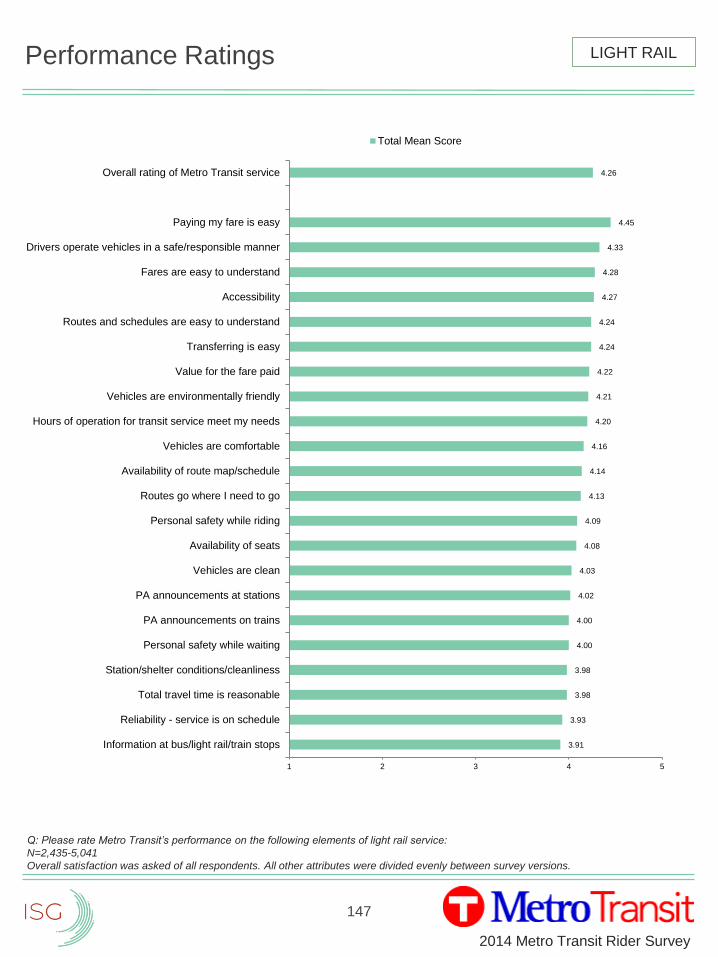
147
2014 Metro Transit Rider Survey
Performance Ratings
3.91
3.93
3.98
3.98
4.00
4.00
4.02
4.03
4.08
4.09
4.13
4.14
4.16
4.20
4.21
4.22
4.24
4.24
4.27
4.28
4.33
4.45
4.26
1 2 3 4 5
Information at bus/light rail/train stops
Reliability - service is on schedule
Total travel time is reasonable
Station/shelter conditions/cleanliness
Personal safety while waiting
PA announcements on trains
PA announcements at stations
Vehicles are clean
Availability of seats
Personal safety while riding
Routes go where I need to go
Availability of route map/schedule
Vehicles are comfortable
Hours of operation for transit service meet my needs
Vehicles are environmentally friendly
Value for the fare paid
Transferring is easy
Routes and schedules are easy to understand
Accessibility
Fares are easy to understand
Drivers operate vehicles in a safe/responsible manner
Paying my fare is easy
Overall rating of Metro Transit service
Total Mean Score
LIGHT RAIL
Q: Please rate Metro Transit’s performance on the following elements of light rail service:
N=2,435-5,041
Overall satisfaction was asked of all respondents. All other attributes were divided evenly between survey versions.
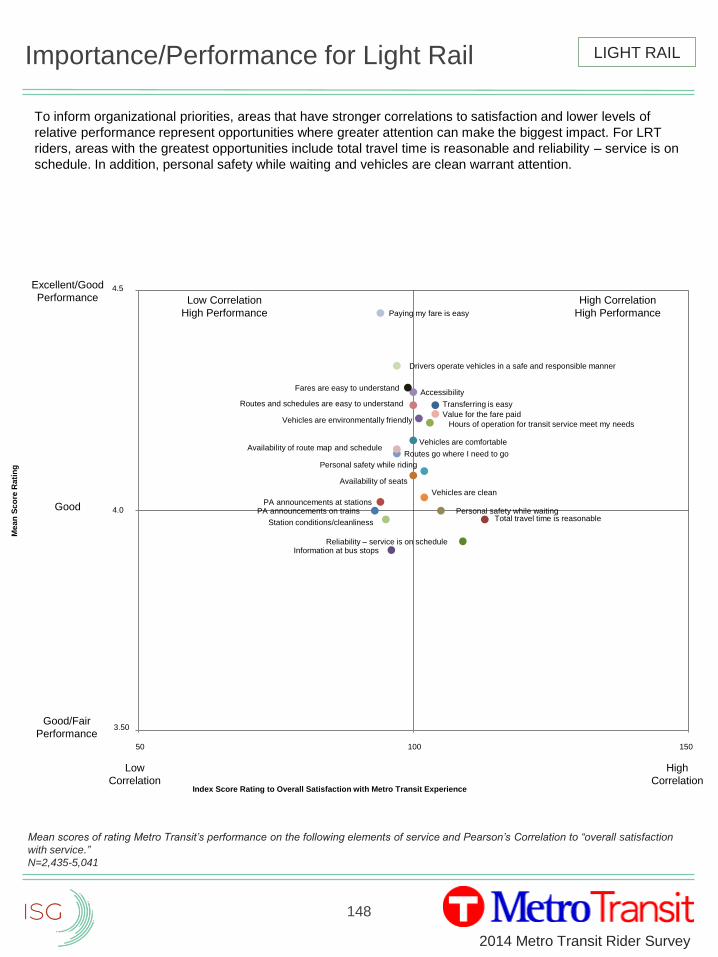
148
2014 Metro Transit Rider Survey
Importance/Performance for Light Rail
To inform organizational priorities, areas that have stronger correlations to satisfaction and lower levels of
relative performance represent opportunities where greater attention can make the biggest impact. For LRT
riders, areas with the greatest opportunities include total travel time is reasonable and reliability – service is on
schedule. In addition, personal safety while waiting and vehicles are clean warrant attention.
Mean scores of rating Metro Transit’s performance on the following elements of service and Pearson’s Correlation to “overall satisfaction
with service.”
N=2,435-5,041
Total travel time is reasonable
Reliability – service is on schedule
Value for the fare paid
Information at bus stops
Vehicles are comfortable
Availability of seats
PA announcements on trainsPA announcements at stations
Vehicles are environmentally friendly
Personal safety while riding
Vehicles are clean
Transferring is easy
Routes go where I need to go
Station conditions/cleanliness
AccessibilityFares are easy to understand
Personal safety while waiting
Paying my fare is easy
Me
an
Sc
ore
Rati
ng
Index Score Rating to Overall Satisfaction with Metro Transit Experience
Excellent/Good
Performance
Good
Good/Fair
Performance
High
Correlation
Low
Correlation
4.5
3.50
4.0
Low Correlation
High Performance
High Correlation
High Performance
50 100 150
Drivers operate vehicles in a safe and responsible manner
Routes and schedules are easy to understand
Hours of operation for transit service meet my needs
Availability of route map and schedule
LIGHT RAIL
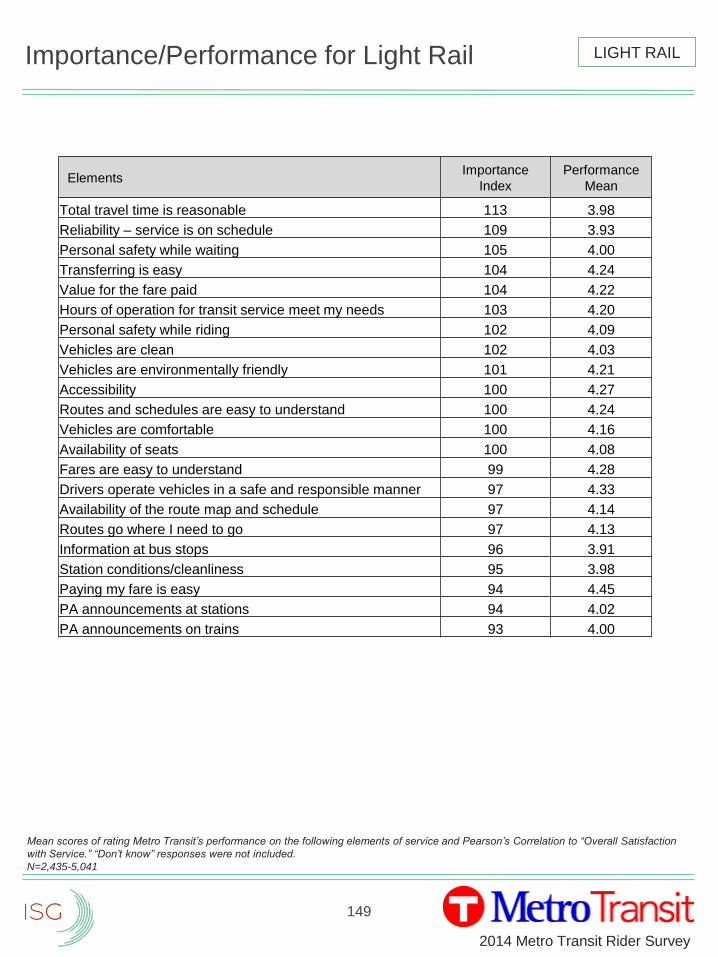
149
2014 Metro Transit Rider Survey
Importance/Performance for Light Rail
Mean scores of rating Metro Transit’s performance on the following elements of service and Pearson’s Correlation to “Overall Satisfaction
with Service.” “Don’t know” responses were not included.
N=2,435-5,041
ElementsImportance
Index
Performance
Mean
Total travel time is reasonable 113 3.98
Reliability – service is on schedule 109 3.93
Personal safety while waiting 105 4.00
Transferring is easy 104 4.24
Value for the fare paid 104 4.22
Hours of operation for transit service meet my needs 103 4.20
Personal safety while riding 102 4.09
Vehicles are clean 102 4.03
Vehicles are environmentally friendly 101 4.21
Accessibility 100 4.27
Routes and schedules are easy to understand 100 4.24
Vehicles are comfortable 100 4.16
Availability of seats 100 4.08
Fares are easy to understand 99 4.28
Drivers operate vehicles in a safe and responsible manner 97 4.33
Availability of the route map and schedule 97 4.14
Routes go where I need to go 97 4.13
Information at bus stops 96 3.91
Station conditions/cleanliness 95 3.98
Paying my fare is easy 94 4.45
PA announcements at stations 94 4.02
PA announcements on trains 93 4.00
LIGHT RAIL
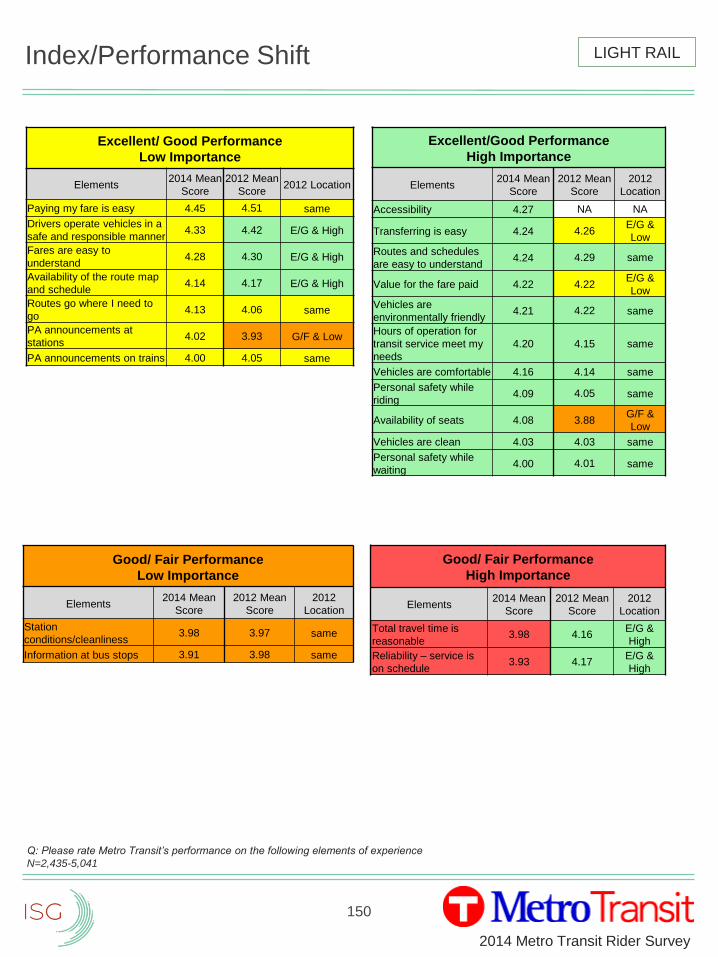
150
2014 Metro Transit Rider Survey
Index/Performance Shift
Q: Please rate Metro Transit’s performance on the following elements of experience
N=2,435-5,041
Excellent/ Good Performance
Low Importance
Elements2014 Mean
Score
2012 Mean
Score2012 Location
Paying my fare is easy 4.45 4.51 same
Drivers operate vehicles in a
safe and responsible manner4.33 4.42 E/G & High
Fares are easy to
understand4.28 4.30 E/G & High
Availability of the route map
and schedule4.14 4.17 E/G & High
Routes go where I need to
go4.13 4.06 same
PA announcements at
stations4.02 3.93 G/F & Low
PA announcements on trains 4.00 4.05 same
Good/ Fair Performance
High Importance
Elements2014 Mean
Score
2012 Mean
Score
2012
Location
Total travel time is
reasonable3.98 4.16
E/G &
High
Reliability – service is
on schedule3.93 4.17
E/G &
High
Excellent/Good Performance
High Importance
Elements2014 Mean
Score
2012 Mean
Score
2012
Location
Accessibility 4.27 NA NA
Transferring is easy 4.24 4.26E/G &
Low
Routes and schedules
are easy to understand4.24 4.29 same
Value for the fare paid 4.22 4.22E/G &
Low
Vehicles are
environmentally friendly4.21 4.22 same
Hours of operation for
transit service meet my
needs
4.20 4.15 same
Vehicles are comfortable 4.16 4.14 same
Personal safety while
riding4.09 4.05 same
Availability of seats 4.08 3.88G/F &
Low
Vehicles are clean 4.03 4.03 same
Personal safety while
waiting4.00 4.01 same
Good/ Fair Performance
Low Importance
Elements2014 Mean
Score
2012 Mean
Score
2012
Location
Station
conditions/cleanliness3.98 3.97 same
Information at bus stops 3.91 3.98 same
LIGHT RAIL
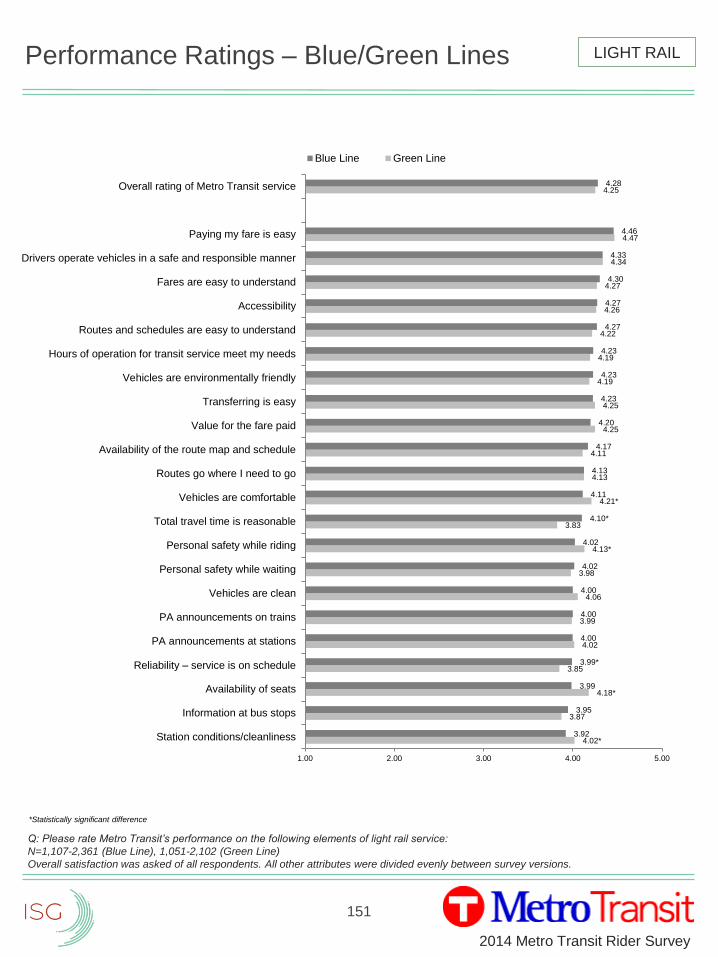
151
2014 Metro Transit Rider Survey
4.02*
3.87
4.18*
3.85
4.02
3.99
4.06
3.98
4.13*
3.83
4.21*
4.13
4.11
4.25
4.25
4.19
4.19
4.22
4.26
4.27
4.34
4.47
4.25
3.92
3.95
3.99
3.99*
4.00
4.00
4.00
4.02
4.02
4.10*
4.11
4.13
4.17
4.20
4.23
4.23
4.23
4.27
4.27
4.30
4.33
4.46
4.28
1.00 2.00 3.00 4.00 5.00
Station conditions/cleanliness
Information at bus stops
Availability of seats
Reliability – service is on schedule
PA announcements at stations
PA announcements on trains
Vehicles are clean
Personal safety while waiting
Personal safety while riding
Total travel time is reasonable
Vehicles are comfortable
Routes go where I need to go
Availability of the route map and schedule
Value for the fare paid
Transferring is easy
Vehicles are environmentally friendly
Hours of operation for transit service meet my needs
Routes and schedules are easy to understand
Accessibility
Fares are easy to understand
Drivers operate vehicles in a safe and responsible manner
Paying my fare is easy
Overall rating of Metro Transit service
Blue Line Green Line
Performance Ratings – Blue/Green Lines
Q: Please rate Metro Transit’s performance on the following elements of light rail service:
N=1,107-2,361 (Blue Line), 1,051-2,102 (Green Line)
Overall satisfaction was asked of all respondents. All other attributes were divided evenly between survey versions.
*Statistically significant difference
LIGHT RAIL
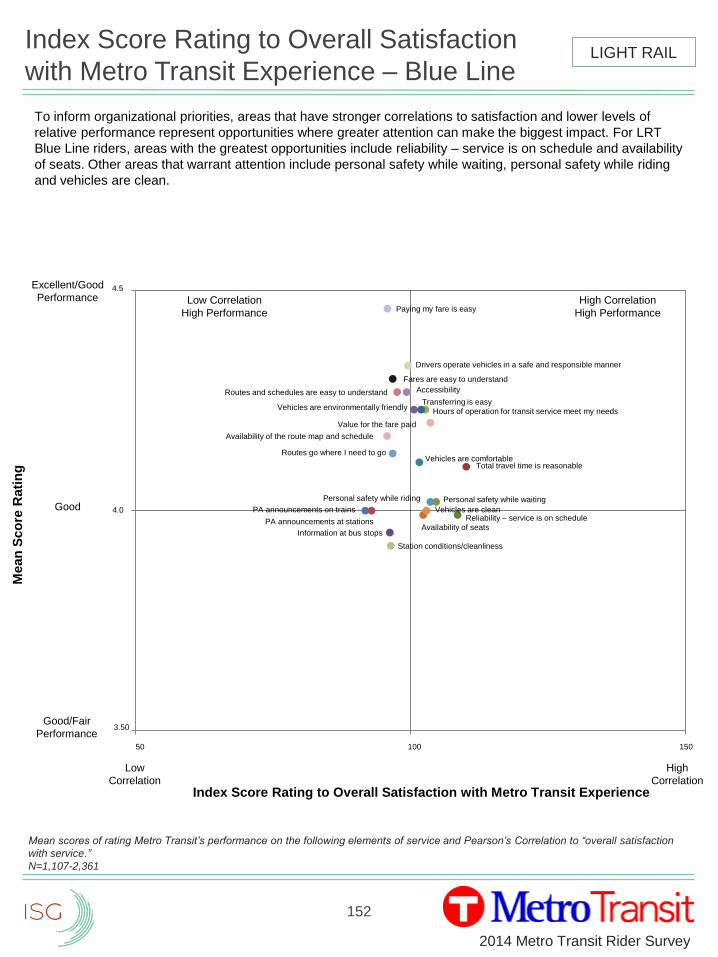
152
2014 Metro Transit Rider Survey
Index Score Rating to Overall Satisfaction
with Metro Transit Experience – Blue Line
To inform organizational priorities, areas that have stronger correlations to satisfaction and lower levels of
relative performance represent opportunities where greater attention can make the biggest impact. For LRT
Blue Line riders, areas with the greatest opportunities include reliability – service is on schedule and availability
of seats. Other areas that warrant attention include personal safety while waiting, personal safety while riding
and vehicles are clean.
Mean scores of rating Metro Transit’s performance on the following elements of service and Pearson’s Correlation to “overall satisfaction
with service.”
N=1,107-2,361
LIGHT RAIL
Total travel time is reasonable
Reliability – service is on schedule
Value for the fare paid
Information at bus stops
Vehicles are comfortable
Availability of seats
PA announcements on trains
PA announcements at stations
Hours of operation for transit service meet my needsVehicles are environmentally friendly
Personal safety while riding
Vehicles are clean
Transferring is easy
Routes go where I need to go
Routes and schedules are easy to understand
Station conditions/cleanliness
Accessibility
Fares are easy to understand
Personal safety while waiting
Paying my fare is easy
Availability of the route map and schedule
Drivers operate vehicles in a safe and responsible manner
Mean
Sco
re R
ati
ng
Index Score Rating to Overall Satisfaction with Metro Transit Experience
Excellent/Good
Performance
Good
Good/Fair
Performance
High
Correlation
Low
Correlation
4.5
3.50
4.0
Low Correlation
High Performance
High Correlation
High Performance
50 100 150
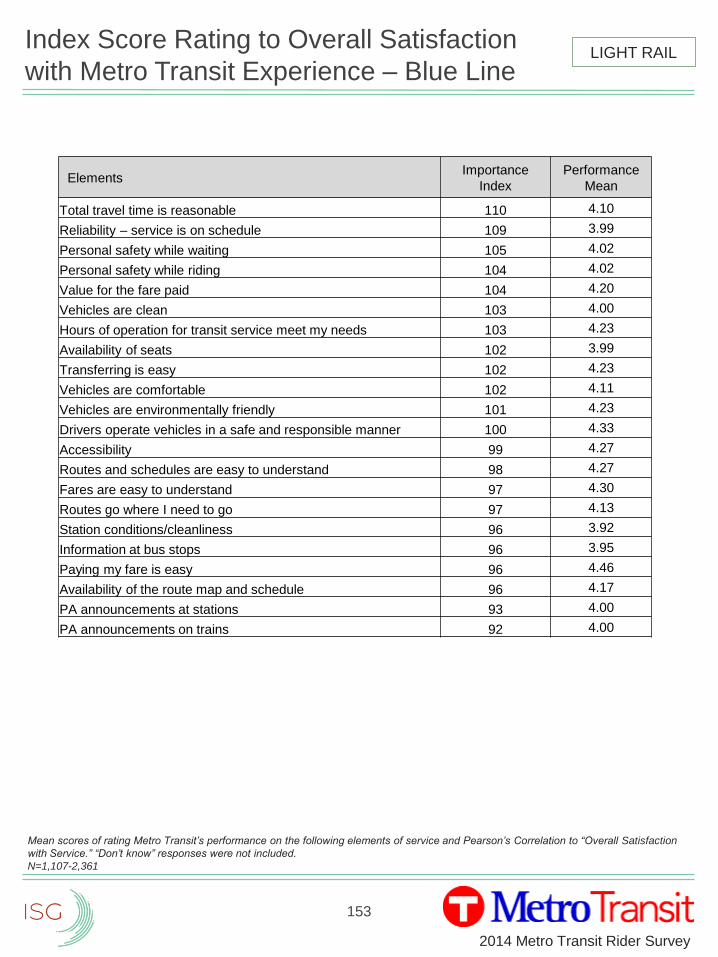
153
2014 Metro Transit Rider Survey
Index Score Rating to Overall Satisfaction
with Metro Transit Experience – Blue Line
Mean scores of rating Metro Transit’s performance on the following elements of service and Pearson’s Correlation to “Overall Satisfaction
with Service.” “Don’t know” responses were not included.
N=1,107-2,361
LIGHT RAIL
ElementsImportance
Index
Performance
Mean
Total travel time is reasonable 110 4.10
Reliability – service is on schedule 109 3.99
Personal safety while waiting 105 4.02
Personal safety while riding 104 4.02
Value for the fare paid 104 4.20
Vehicles are clean 103 4.00
Hours of operation for transit service meet my needs 103 4.23
Availability of seats 102 3.99
Transferring is easy 102 4.23
Vehicles are comfortable 102 4.11
Vehicles are environmentally friendly 101 4.23
Drivers operate vehicles in a safe and responsible manner 100 4.33
Accessibility 99 4.27
Routes and schedules are easy to understand 98 4.27
Fares are easy to understand 97 4.30
Routes go where I need to go 97 4.13
Station conditions/cleanliness 96 3.92
Information at bus stops 96 3.95
Paying my fare is easy 96 4.46
Availability of the route map and schedule 96 4.17
PA announcements at stations 93 4.00
PA announcements on trains 92 4.00
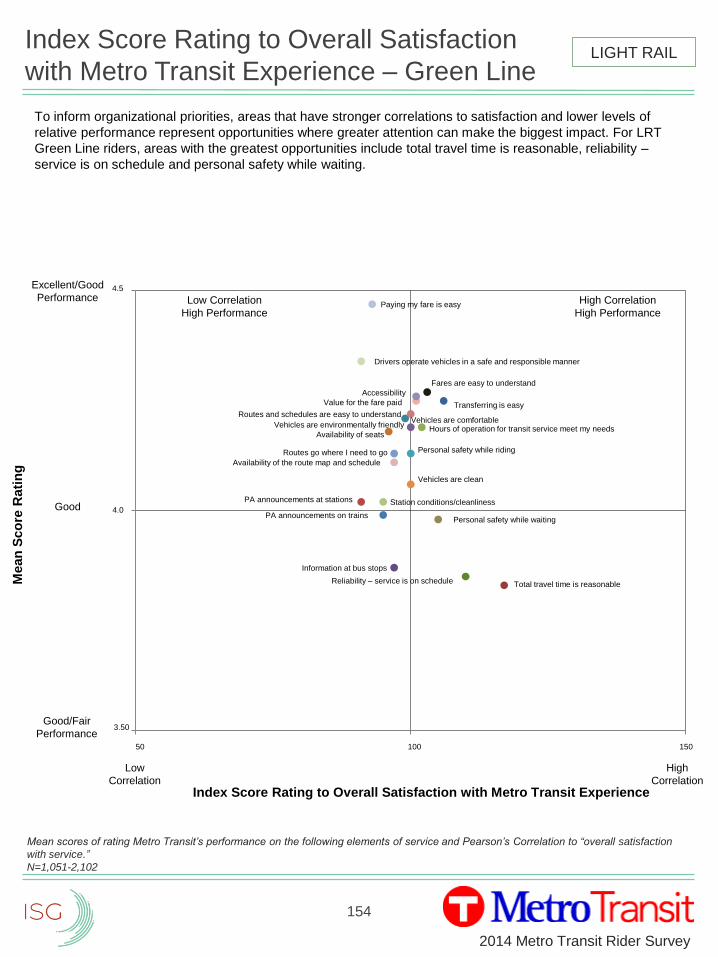
154
2014 Metro Transit Rider Survey
Index Score Rating to Overall Satisfaction
with Metro Transit Experience – Green Line
Mean scores of rating Metro Transit’s performance on the following elements of service and Pearson’s Correlation to “overall satisfaction
with service.”
N=1,051-2,102
LIGHT RAIL
Total travel time is reasonableReliability – service is on schedule
Value for the fare paid
Information at bus stops
Vehicles are comfortable
Availability of seats
PA announcements on trains
PA announcements at stations
Hours of operation for transit service meet my needsVehicles are environmentally friendly
Personal safety while riding
Vehicles are clean
Transferring is easy
Routes go where I need to go
Routes and schedules are easy to understand
Station conditions/cleanliness
Accessibility
Fares are easy to understand
Personal safety while waiting
Paying my fare is easy
Availability of the route map and schedule
Drivers operate vehicles in a safe and responsible manner
Mean
Sco
re R
ati
ng
Index Score Rating to Overall Satisfaction with Metro Transit Experience
Excellent/Good
Performance
Good
Good/Fair
Performance
High
Correlation
Low
Correlation
4.5
3.50
4.0
Low Correlation
High Performance
High Correlation
High Performance
50 100 150
To inform organizational priorities, areas that have stronger correlations to satisfaction and lower levels of
relative performance represent opportunities where greater attention can make the biggest impact. For LRT
Green Line riders, areas with the greatest opportunities include total travel time is reasonable, reliability –
service is on schedule and personal safety while waiting.
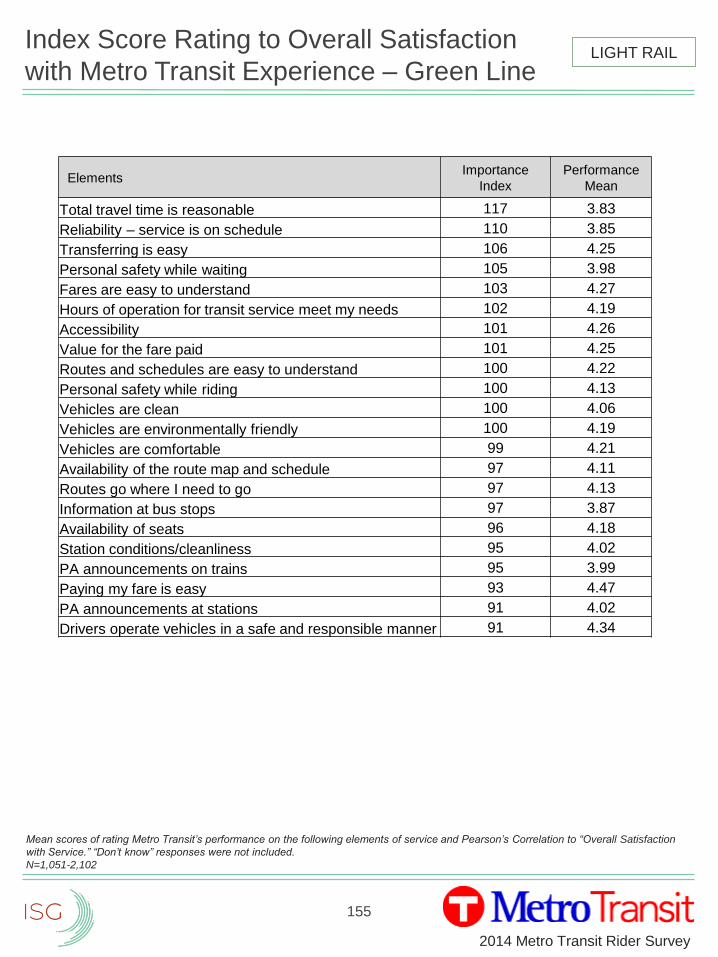
155
2014 Metro Transit Rider Survey
Index Score Rating to Overall Satisfaction
with Metro Transit Experience – Green Line
Mean scores of rating Metro Transit’s performance on the following elements of service and Pearson’s Correlation to “Overall Satisfaction
with Service.” “Don’t know” responses were not included.
N=1,051-2,102
LIGHT RAIL
ElementsImportance
Index
Performance
Mean
Total travel time is reasonable 117 3.83
Reliability – service is on schedule 110 3.85
Transferring is easy 106 4.25
Personal safety while waiting 105 3.98
Fares are easy to understand 103 4.27
Hours of operation for transit service meet my needs 102 4.19
Accessibility 101 4.26
Value for the fare paid 101 4.25
Routes and schedules are easy to understand 100 4.22
Personal safety while riding 100 4.13
Vehicles are clean 100 4.06
Vehicles are environmentally friendly 100 4.19
Vehicles are comfortable 99 4.21
Availability of the route map and schedule 97 4.11
Routes go where I need to go 97 4.13
Information at bus stops 97 3.87
Availability of seats 96 4.18
Station conditions/cleanliness 95 4.02
PA announcements on trains 95 3.99
Paying my fare is easy 93 4.47
PA announcements at stations 91 4.02
Drivers operate vehicles in a safe and responsible manner 91 4.34

156
2014 Metro Transit Rider Survey
Performance Priorities for LRT
N=1,051-5,041
High = Mean of 0 – 3.99 and Importance of 101 to 150
Moderate = Mean of 4.00 – 4.05 and Importance of 101 to 150 OR Mean of 0 – 3.99 and Importance of 100
Performance Areas OVERALL Blue Line Green Line
Total travel time is reasonable High High
Reliability – service is on schedule High High High
Personal safety while waiting Moderate Moderate High
Transferring is easy
Value for the fare paid
Hours of operation for transit service meet my
needs
Personal safety while riding Moderate
Vehicles are clean Moderate Moderate
Vehicles are environmentally friendly
Accessibility
Routes and schedules are easy to understand
Vehicles are comfortable
Availability of seats High
Fares are easy to understand
Drivers operate vehicles in a safe and responsible
manner
Availability of the route map and schedule
Routes go where I need to go
Information at bus stops
Station conditions/cleanliness
Paying my fare is easy
PA announcements at stations
PA announcements on trains
LIGHT RAIL

157
2014 Metro Transit Rider Survey
Mean
4.16
4.22
4.18
4.16
4.06
4.17
3.89
3.94
3.81
3.95
4.07
4.00
Communication Ratings
t Denotes 1% or less
Q: Please rate how well we are communicating with you in the following areas by providing:
N=2,350-2,684
Attributes were divided evenly between survey versions.
LIGHT RAIL
t
t
15%
19%
21%
22%
22%
23%
23%
28%
32%
34%
35%
37%
19%
21%
32%
39%
30%
35%
23%
36%
39%
41%
43%
44%
10%
9%
16%
22%
16%
19%
9%
14%
12%
11%
11%
14%
2%
2%
3%
6%
4%
5%
2%
3%
2%
2%
2%
3%
t
t
t
t
t
t
t
t
t
t
t
t
54%
49%
28%
10%
27%
17%
43%
18%
15%
11%
8%
2%
0% 20% 40% 60% 80% 100%
CONNECT onboard newsletter distributedmonthly on buses
Customer service on the Metro TransitInformation Line (612-373-3333)
Onboard information cards
Shelters
NexTrip signs
Bus stops
Metro Transit information line (612-373-3333)
Information about how to purchase or useMetro Transit fare cards (e.g. Go-To Cards)
Printed schedules
metrotransit.org
Transit System Map
Clear, accurate route and/or scheduleinformation
Excellent Good Fair Poor Unacceptable Don't Know
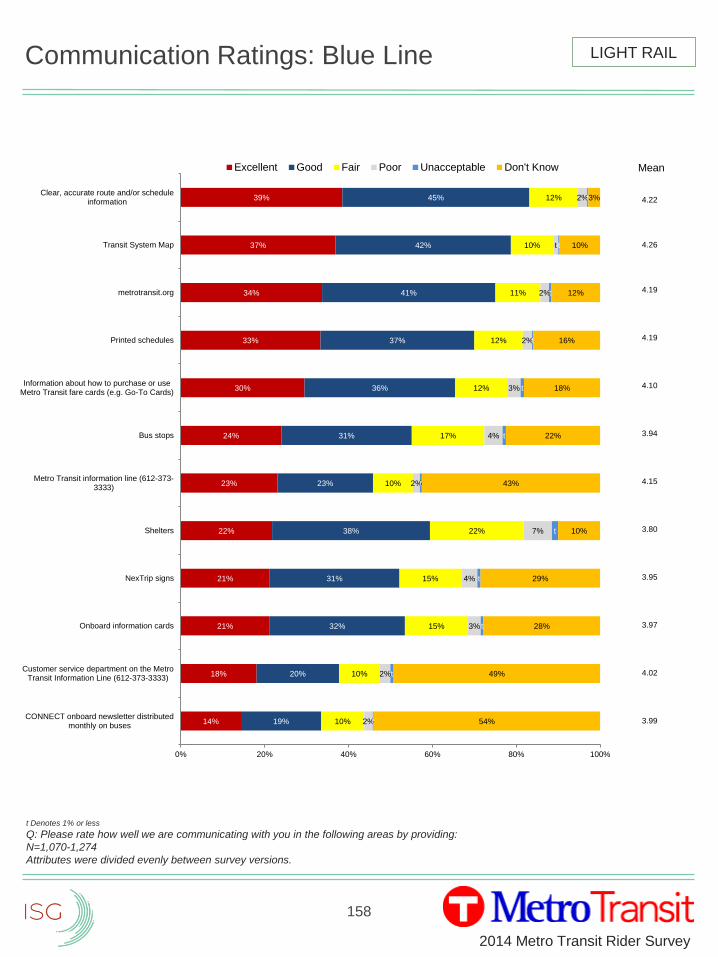
158
2014 Metro Transit Rider Survey
Mean
4.22
4.26
4.19
4.19
4.10
3.94
4.15
3.80
3.95
3.97
4.02
3.99
Communication Ratings: Blue Line
t Denotes 1% or less
Q: Please rate how well we are communicating with you in the following areas by providing:
N=1,070-1,274
Attributes were divided evenly between survey versions.
LIGHT RAIL
t
t
14%
18%
21%
21%
22%
23%
24%
30%
33%
34%
37%
39%
19%
20%
32%
31%
38%
23%
31%
36%
37%
41%
42%
45%
10%
10%
15%
15%
22%
10%
17%
12%
12%
11%
10%
12%
2%
2%
3%
4%
7%
2%
4%
3%
2%
2%
t
2%
t
t
t
t
t
t
t
t
t
t
t
t
54%
49%
28%
29%
10%
43%
22%
18%
16%
12%
10%
3%
0% 20% 40% 60% 80% 100%
CONNECT onboard newsletter distributedmonthly on buses
Customer service department on the MetroTransit Information Line (612-373-3333)
Onboard information cards
NexTrip signs
Shelters
Metro Transit information line (612-373-3333)
Bus stops
Information about how to purchase or useMetro Transit fare cards (e.g. Go-To Cards)
Printed schedules
metrotransit.org
Transit System Map
Clear, accurate route and/or scheduleinformation
Excellent Good Fair Poor Unacceptable Don't Know
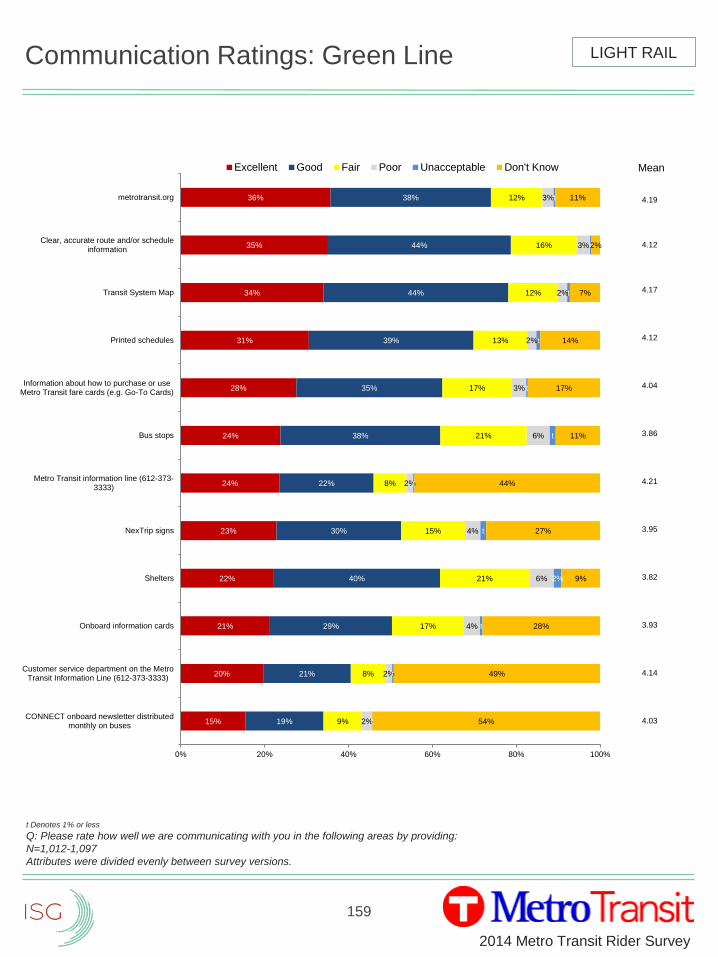
159
2014 Metro Transit Rider Survey
Mean
4.19
4.12
4.17
4.12
4.04
3.86
4.21
3.95
3.82
3.93
4.14
4.03
Communication Ratings: Green Line
t Denotes 1% or less
Q: Please rate how well we are communicating with you in the following areas by providing:
N=1,012-1,097
Attributes were divided evenly between survey versions.
LIGHT RAIL
t
t
15%
20%
21%
22%
23%
24%
24%
28%
31%
34%
35%
36%
19%
21%
29%
40%
30%
22%
38%
35%
39%
44%
44%
38%
9%
8%
17%
21%
15%
8%
21%
17%
13%
12%
16%
12%
2%
2%
4%
6%
4%
2%
6%
3%
2%
2%
3%
3%
t
t
t
2%
t
t
t
t
t
t
t
t
54%
49%
28%
9%
27%
44%
11%
17%
14%
7%
2%
11%
0% 20% 40% 60% 80% 100%
CONNECT onboard newsletter distributedmonthly on buses
Customer service department on the MetroTransit Information Line (612-373-3333)
Onboard information cards
Shelters
NexTrip signs
Metro Transit information line (612-373-3333)
Bus stops
Information about how to purchase or useMetro Transit fare cards (e.g. Go-To Cards)
Printed schedules
Transit System Map
Clear, accurate route and/or scheduleinformation
metrotransit.org
Excellent Good Fair Poor Unacceptable Don't Know
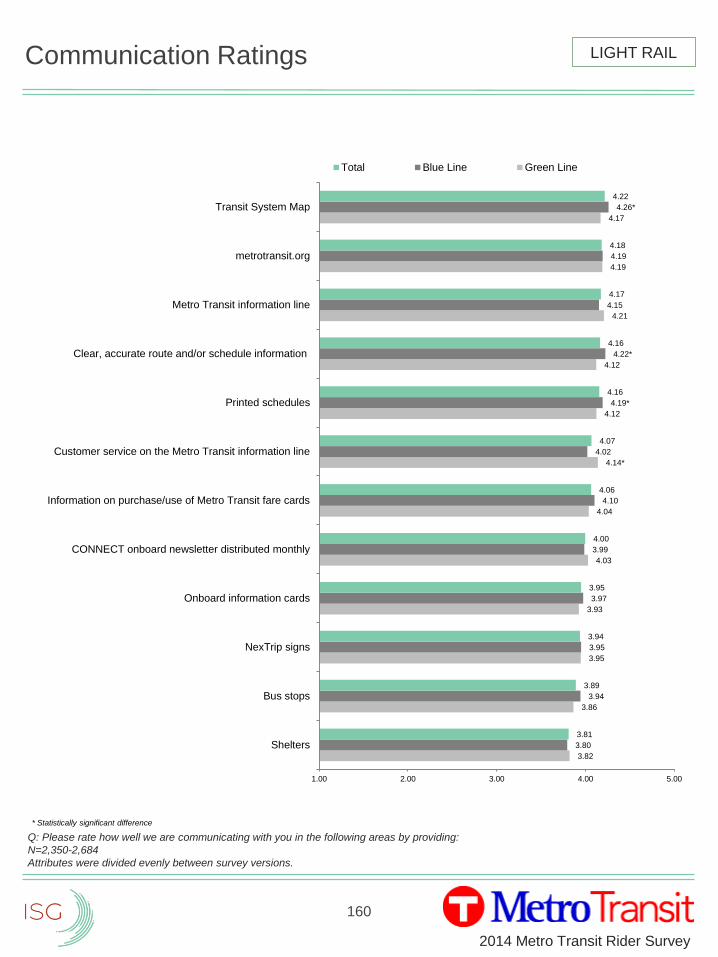
160
2014 Metro Transit Rider Survey
Communication Ratings
Q: Please rate how well we are communicating with you in the following areas by providing:
N=2,350-2,684
Attributes were divided evenly between survey versions.
3.82
3.86
3.95
3.93
4.03
4.04
4.14*
4.12
4.12
4.21
4.19
4.17
3.80
3.94
3.95
3.97
3.99
4.10
4.02
4.19*
4.22*
4.15
4.19
4.26*
3.81
3.89
3.94
3.95
4.00
4.06
4.07
4.16
4.16
4.17
4.18
4.22
1.00 2.00 3.00 4.00 5.00
Shelters
Bus stops
NexTrip signs
Onboard information cards
CONNECT onboard newsletter distributed monthly
Information on purchase/use of Metro Transit fare cards
Customer service on the Metro Transit information line
Printed schedules
Clear, accurate route and/or schedule information
Metro Transit information line
metrotransit.org
Transit System Map
Total Blue Line Green Line
LIGHT RAIL
* Statistically significant difference
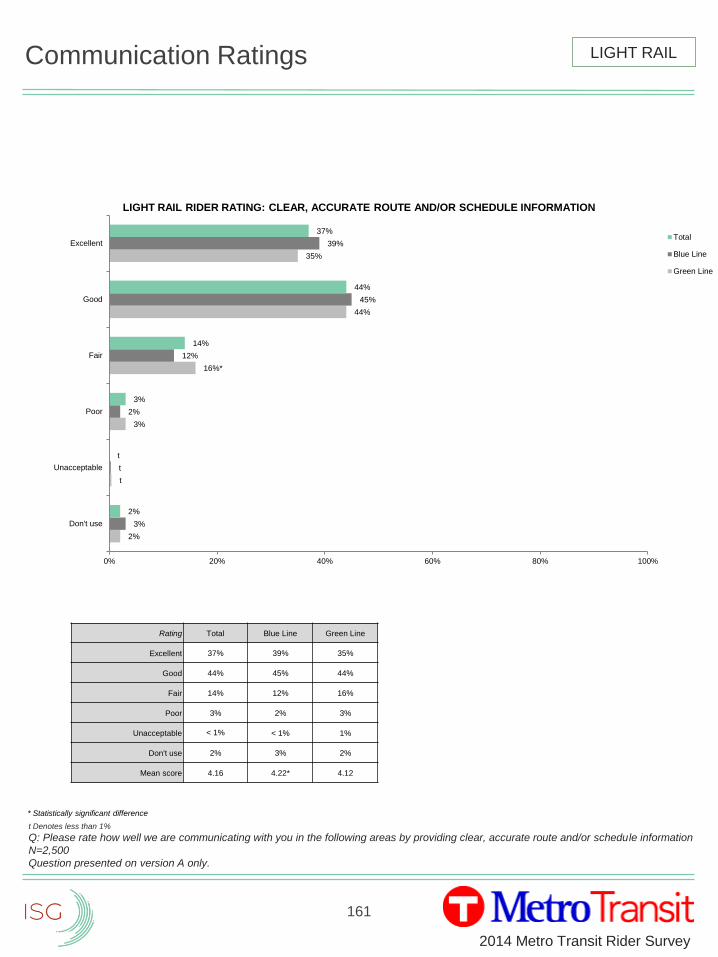
161
2014 Metro Transit Rider Survey
Communication Ratings
t Denotes less than 1%
Q: Please rate how well we are communicating with you in the following areas by providing clear, accurate route and/or schedule information
N=2,500
Question presented on version A only.
2%
t
3%
16%*
44%
35%
3%
t
2%
12%
45%
39%
2%
t
3%
14%
44%
37%
0% 20% 40% 60% 80% 100%
Don't use
Unacceptable
Poor
Fair
Good
Excellent
LIGHT RAIL RIDER RATING: CLEAR, ACCURATE ROUTE AND/OR SCHEDULE INFORMATION
Total
Blue Line
Green Line
LIGHT RAIL
* Statistically significant difference
Rating Total Blue Line Green Line
Excellent 37% 39% 35%
Good 44% 45% 44%
Fair 14% 12% 16%
Poor 3% 2% 3%
Unacceptable < 1% < 1% 1%
Don't use 2% 3% 2%
Mean score 4.16 4.22* 4.12
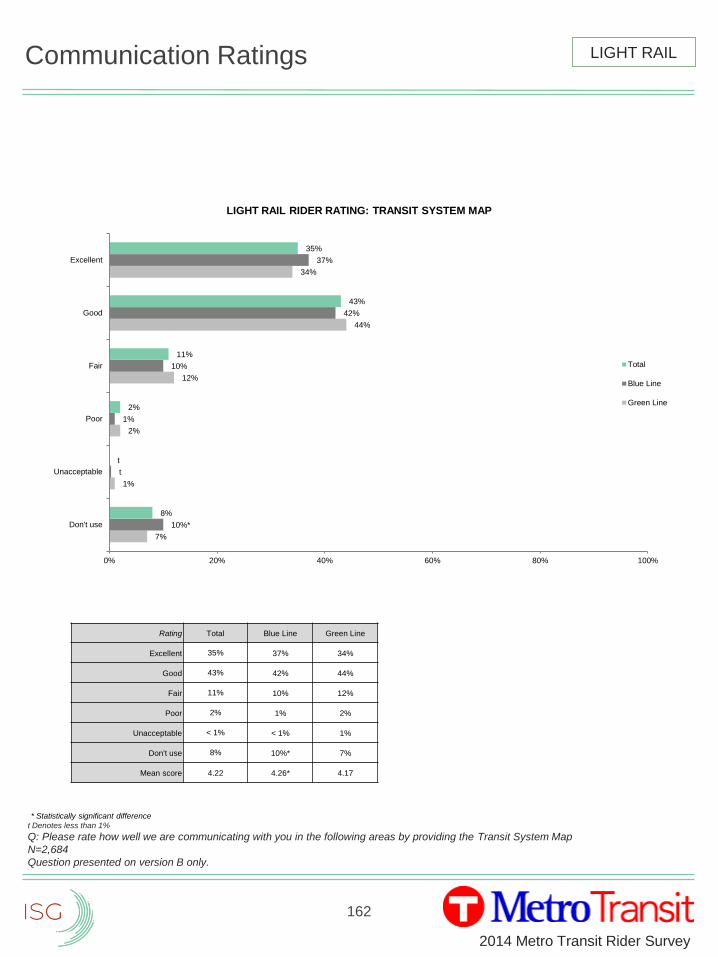
162
2014 Metro Transit Rider Survey
Communication Ratings
t Denotes less than 1%
Q: Please rate how well we are communicating with you in the following areas by providing the Transit System Map
N=2,684
Question presented on version B only.
7%
1%
2%
12%
44%
34%
10%*
t
1%
10%
42%
37%
8%
t
2%
11%
43%
35%
0% 20% 40% 60% 80% 100%
Don't use
Unacceptable
Poor
Fair
Good
Excellent
LIGHT RAIL RIDER RATING: TRANSIT SYSTEM MAP
Total
Blue Line
Green Line
Rating Total Blue Line Green Line
Excellent 35% 37% 34%
Good 43% 42% 44%
Fair 11% 10% 12%
Poor 2% 1% 2%
Unacceptable < 1% < 1% 1%
Don't use 8% 10%* 7%
Mean score 4.22 4.26* 4.17
LIGHT RAIL
* Statistically significant difference
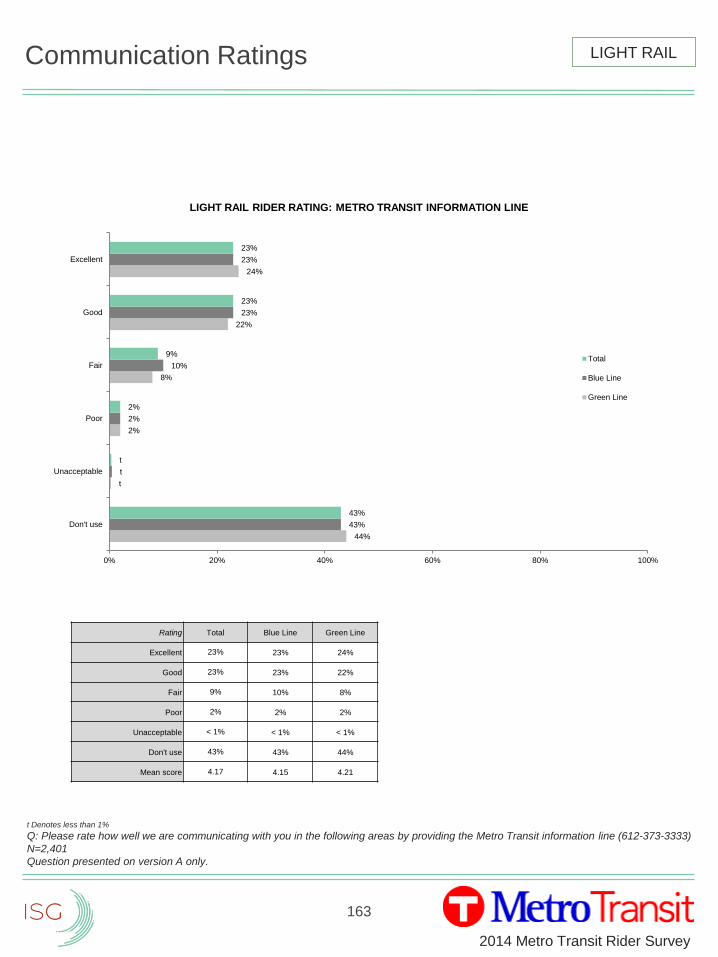
163
2014 Metro Transit Rider Survey
Communication Ratings
t Denotes less than 1%
Q: Please rate how well we are communicating with you in the following areas by providing the Metro Transit information line (612-373-3333)
N=2,401
Question presented on version A only.
44%
t
2%
8%
22%
24%
43%
t
2%
10%
23%
23%
43%
t
2%
9%
23%
23%
0% 20% 40% 60% 80% 100%
Don't use
Unacceptable
Poor
Fair
Good
Excellent
LIGHT RAIL RIDER RATING: METRO TRANSIT INFORMATION LINE
Total
Blue Line
Green Line
Rating Total Blue Line Green Line
Excellent 23% 23% 24%
Good 23% 23% 22%
Fair 9% 10% 8%
Poor 2% 2% 2%
Unacceptable < 1% < 1% < 1%
Don't use 43% 43% 44%
Mean score 4.17 4.15 4.21
LIGHT RAIL

164
2014 Metro Transit Rider Survey
Communication Ratings
t Denotes less than 1%
Q: Please rate how well we are communicating with you in the following areas by providing printed schedules
N=2,646
Question presented on version B only.
14%
1%
2%
13%
39%
31%
16%
t
2%
12%
37%
33%
15%
1%
2%
12%
39%
32%
0% 20% 40% 60% 80% 100%
Don't use
Unacceptable
Poor
Fair
Good
Excellent
LIGHT RAIL RIDER RATING: PRINTED SCHEDULES
Total
Blue Line
Green Line
Rating Total Blue Line Green Line
Excellent 32% 33% 31%
Good 39% 37% 39%
Fair 12% 12% 13%
Poor 2% 2% 2%
Unacceptable 1% < 1% 1%
Don't use 15% 16% 14%
Mean score 4.16 4.19 4.12
LIGHT RAIL
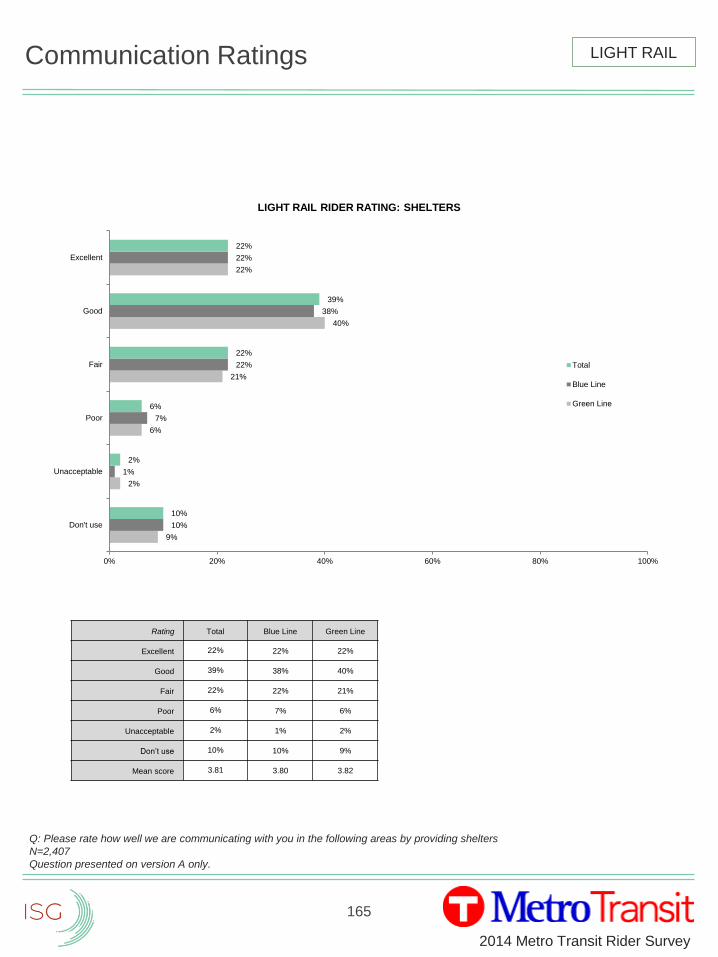
165
2014 Metro Transit Rider Survey
Communication Ratings
Q: Please rate how well we are communicating with you in the following areas by providing shelters
N=2,407
Question presented on version A only.
9%
2%
6%
21%
40%
22%
10%
1%
7%
22%
38%
22%
10%
2%
6%
22%
39%
22%
0% 20% 40% 60% 80% 100%
Don't use
Unacceptable
Poor
Fair
Good
Excellent
LIGHT RAIL RIDER RATING: SHELTERS
Total
Blue Line
Green Line
Rating Total Blue Line Green Line
Excellent 22% 22% 22%
Good 39% 38% 40%
Fair 22% 22% 21%
Poor 6% 7% 6%
Unacceptable 2% 1% 2%
Don’t use 10% 10% 9%
Mean score 3.81 3.80 3.82
LIGHT RAIL
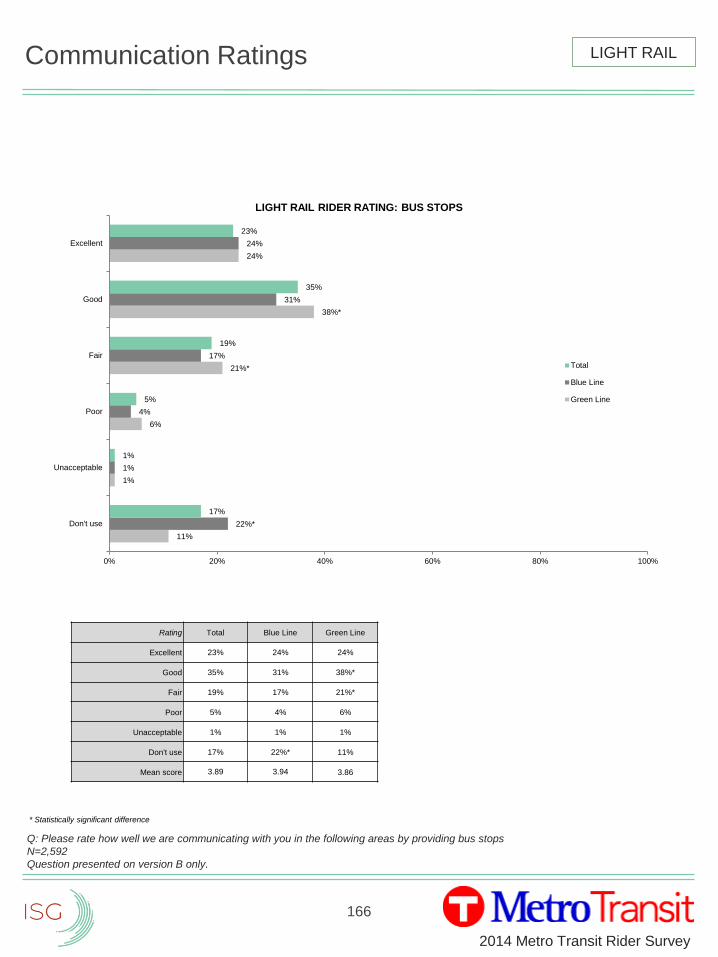
166
2014 Metro Transit Rider Survey
Communication Ratings
Q: Please rate how well we are communicating with you in the following areas by providing bus stops
N=2,592
Question presented on version B only.
11%
1%
6%
21%*
38%*
24%
22%*
1%
4%
17%
31%
24%
17%
1%
5%
19%
35%
23%
0% 20% 40% 60% 80% 100%
Don't use
Unacceptable
Poor
Fair
Good
Excellent
LIGHT RAIL RIDER RATING: BUS STOPS
Total
Blue Line
Green Line
LIGHT RAIL
* Statistically significant difference
Rating Total Blue Line Green Line
Excellent 23% 24% 24%
Good 35% 31% 38%*
Fair 19% 17% 21%*
Poor 5% 4% 6%
Unacceptable 1% 1% 1%
Don't use 17% 22%* 11%
Mean score 3.89 3.94 3.86
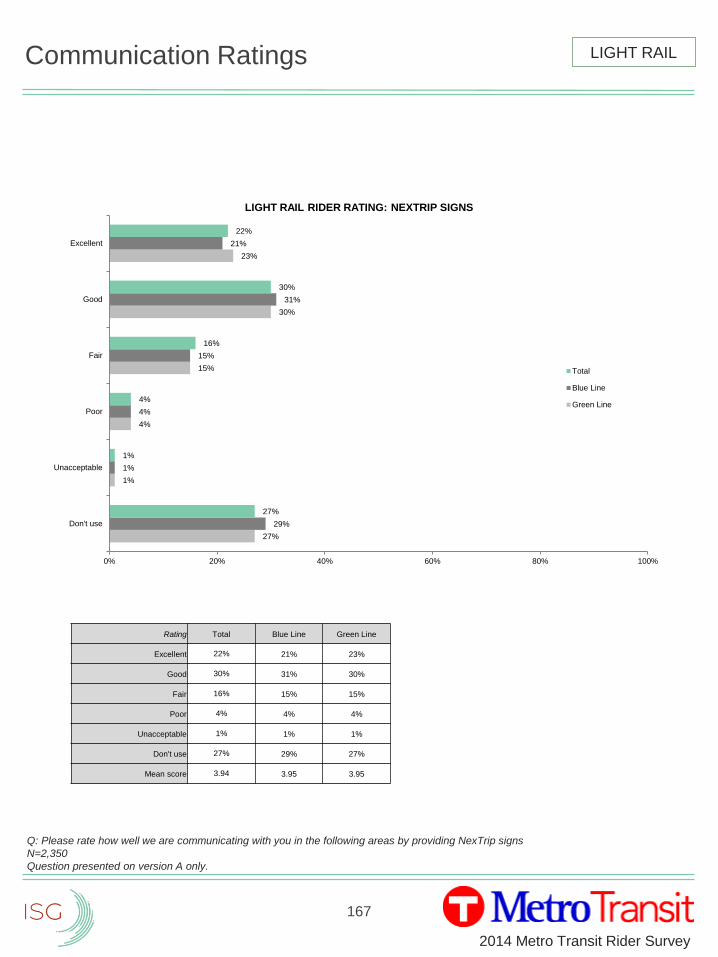
167
2014 Metro Transit Rider Survey
Communication Ratings
Q: Please rate how well we are communicating with you in the following areas by providing NexTrip signs
N=2,350
Question presented on version A only.
27%
1%
4%
15%
30%
23%
29%
1%
4%
15%
31%
21%
27%
1%
4%
16%
30%
22%
0% 20% 40% 60% 80% 100%
Don't use
Unacceptable
Poor
Fair
Good
Excellent
LIGHT RAIL RIDER RATING: NEXTRIP SIGNS
Total
Blue Line
Green Line
LIGHT RAIL
Rating Total Blue Line Green Line
Excellent 22% 21% 23%
Good 30% 31% 30%
Fair 16% 15% 15%
Poor 4% 4% 4%
Unacceptable 1% 1% 1%
Don't use 27% 29% 27%
Mean score 3.94 3.95 3.95
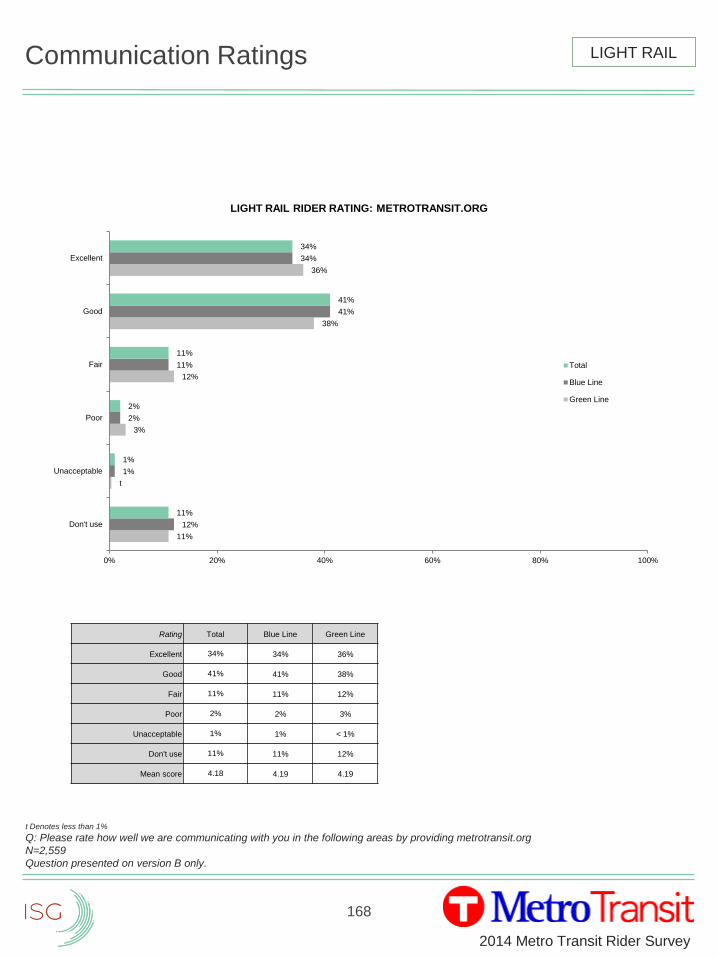
168
2014 Metro Transit Rider Survey
Communication Ratings
t Denotes less than 1%
Q: Please rate how well we are communicating with you in the following areas by providing metrotransit.org
N=2,559
Question presented on version B only.
11%
t
3%
12%
38%
36%
12%
1%
2%
11%
41%
34%
11%
1%
2%
11%
41%
34%
0% 20% 40% 60% 80% 100%
Don't use
Unacceptable
Poor
Fair
Good
Excellent
LIGHT RAIL RIDER RATING: METROTRANSIT.ORG
Total
Blue Line
Green Line
Rating Total Blue Line Green Line
Excellent 34% 34% 36%
Good 41% 41% 38%
Fair 11% 11% 12%
Poor 2% 2% 3%
Unacceptable 1% 1% < 1%
Don't use 11% 11% 12%
Mean score 4.18 4.19 4.19
LIGHT RAIL
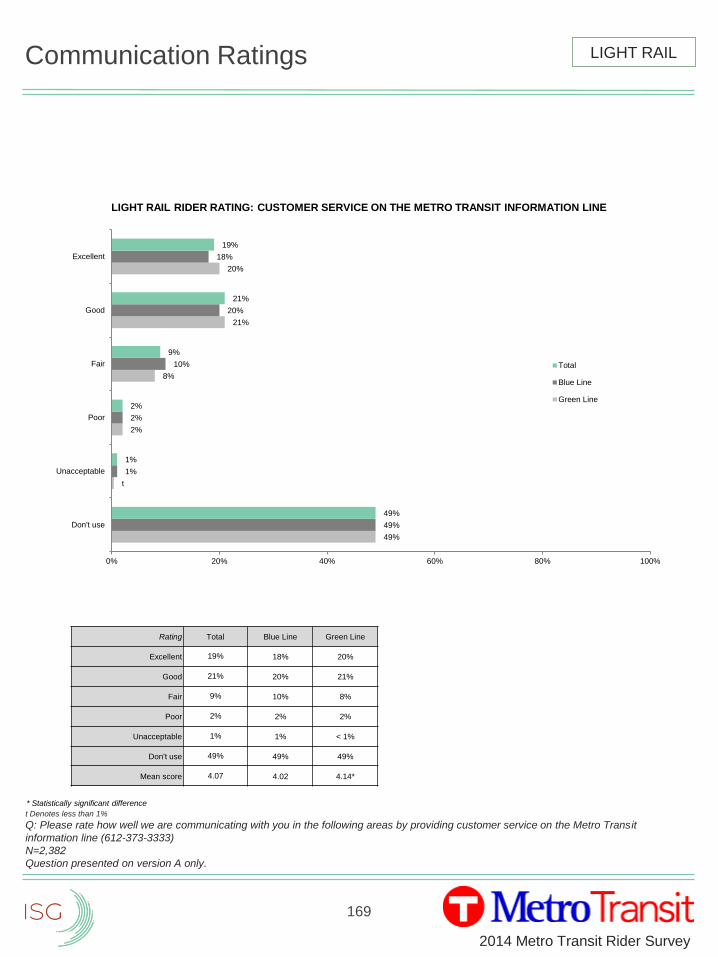
169
2014 Metro Transit Rider Survey
Communication Ratings
t Denotes less than 1%
Q: Please rate how well we are communicating with you in the following areas by providing customer service on the Metro Transit
information line (612-373-3333)
N=2,382
Question presented on version A only.
49%
t
2%
8%
21%
20%
49%
1%
2%
10%
20%
18%
49%
1%
2%
9%
21%
19%
0% 20% 40% 60% 80% 100%
Don't use
Unacceptable
Poor
Fair
Good
Excellent
LIGHT RAIL RIDER RATING: CUSTOMER SERVICE ON THE METRO TRANSIT INFORMATION LINE
Total
Blue Line
Green Line
Rating Total Blue Line Green Line
Excellent 19% 18% 20%
Good 21% 20% 21%
Fair 9% 10% 8%
Poor 2% 2% 2%
Unacceptable 1% 1% < 1%
Don't use 49% 49% 49%
Mean score 4.07 4.02 4.14*
LIGHT RAIL
* Statistically significant difference
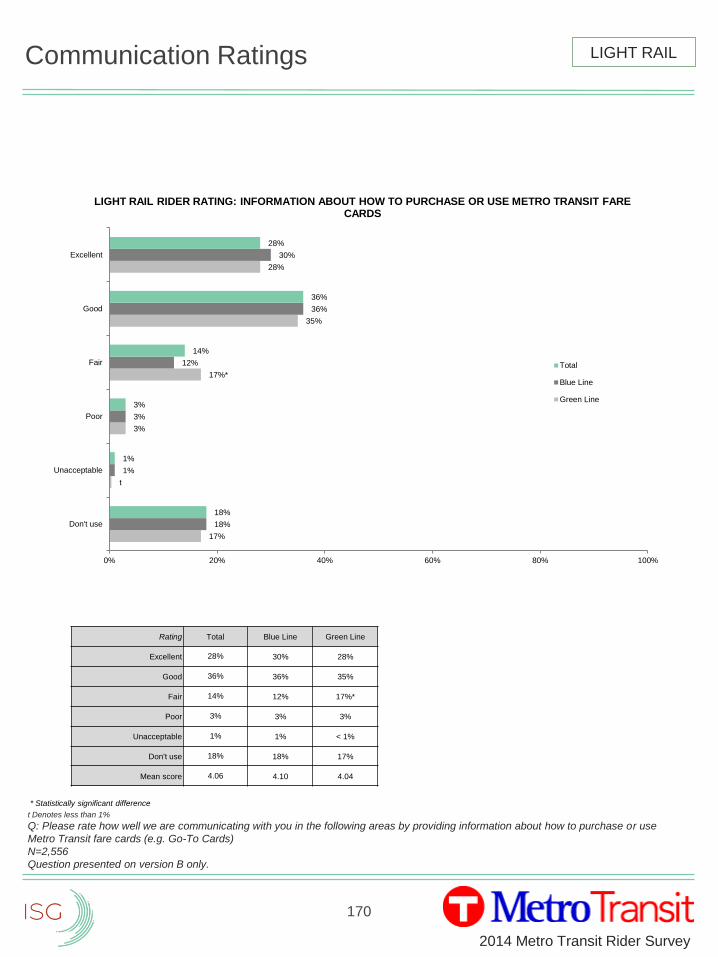
170
2014 Metro Transit Rider Survey
Communication Ratings
t Denotes less than 1%
Q: Please rate how well we are communicating with you in the following areas by providing information about how to purchase or use
Metro Transit fare cards (e.g. Go-To Cards)
N=2,556
Question presented on version B only.
17%
t
3%
17%*
35%
28%
18%
1%
3%
12%
36%
30%
18%
1%
3%
14%
36%
28%
0% 20% 40% 60% 80% 100%
Don't use
Unacceptable
Poor
Fair
Good
Excellent
LIGHT RAIL RIDER RATING: INFORMATION ABOUT HOW TO PURCHASE OR USE METRO TRANSIT FARE CARDS
Total
Blue Line
Green Line
Rating Total Blue Line Green Line
Excellent 28% 30% 28%
Good 36% 36% 35%
Fair 14% 12% 17%*
Poor 3% 3% 3%
Unacceptable 1% 1% < 1%
Don't use 18% 18% 17%
Mean score 4.06 4.10 4.04
LIGHT RAIL
* Statistically significant difference
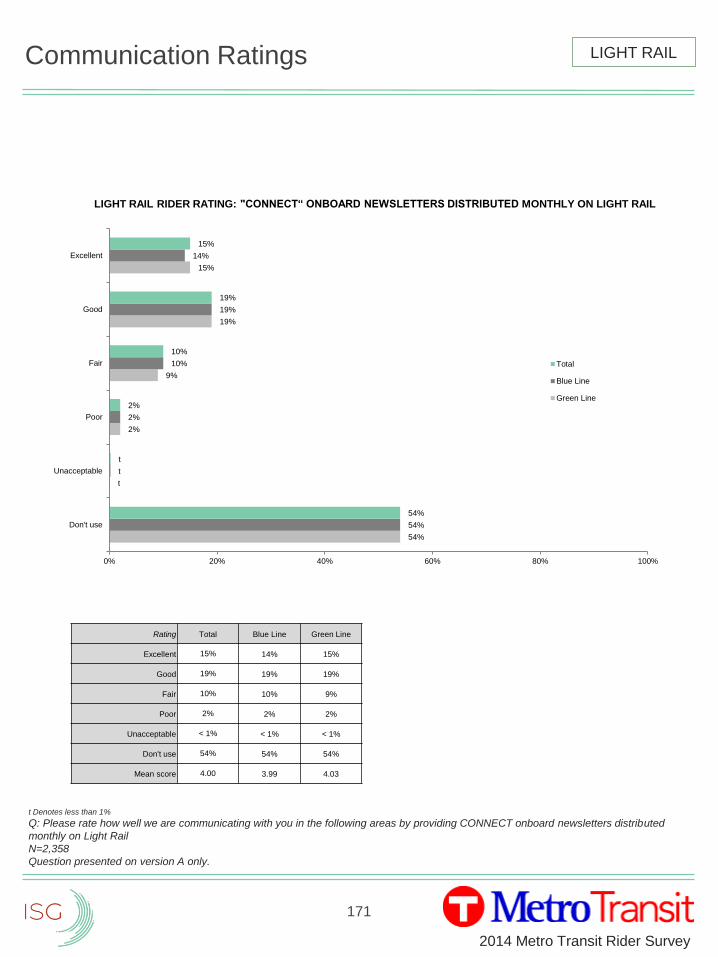
171
2014 Metro Transit Rider Survey
Communication Ratings
t Denotes less than 1%
Q: Please rate how well we are communicating with you in the following areas by providing CONNECT onboard newsletters distributed
monthly on Light Rail
N=2,358
Question presented on version A only.
54%
t
2%
9%
19%
15%
54%
t
2%
10%
19%
14%
54%
t
2%
10%
19%
15%
0% 20% 40% 60% 80% 100%
Don't use
Unacceptable
Poor
Fair
Good
Excellent
LIGHT RAIL RIDER RATING: "CONNECT“ ONBOARD NEWSLETTERS DISTRIBUTED MONTHLY ON LIGHT RAIL
Total
Blue Line
Green Line
LIGHT RAIL
Rating Total Blue Line Green Line
Excellent 15% 14% 15%
Good 19% 19% 19%
Fair 10% 10% 9%
Poor 2% 2% 2%
Unacceptable < 1% < 1% < 1%
Don't use 54% 54% 54%
Mean score 4.00 3.99 4.03
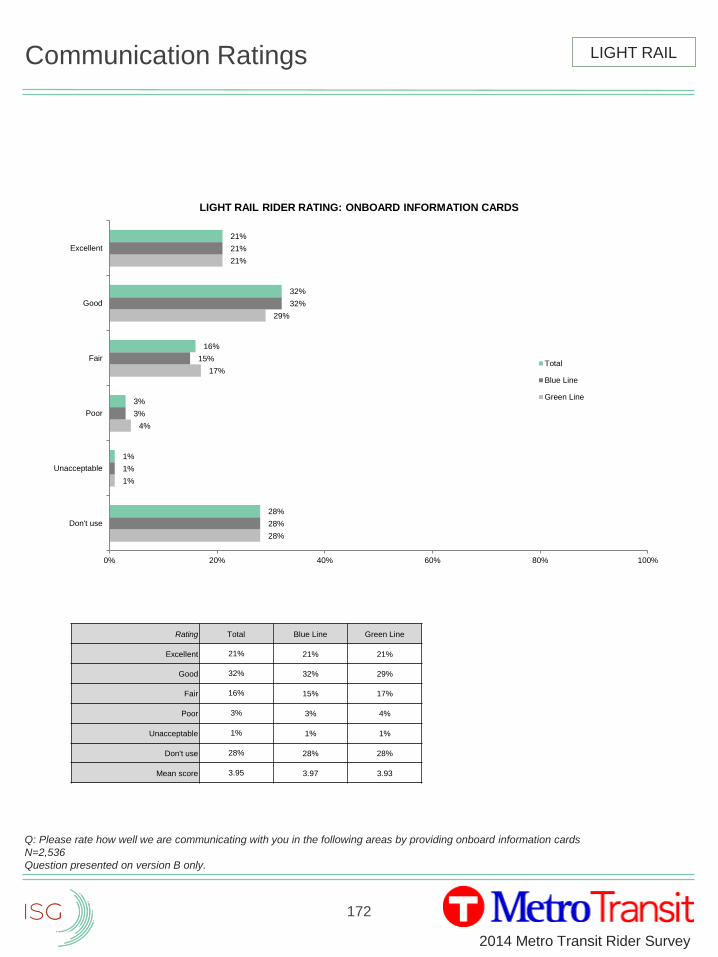
172
2014 Metro Transit Rider Survey
Communication Ratings
Q: Please rate how well we are communicating with you in the following areas by providing onboard information cards
N=2,536
Question presented on version B only.
28%
1%
4%
17%
29%
21%
28%
1%
3%
15%
32%
21%
28%
1%
3%
16%
32%
21%
0% 20% 40% 60% 80% 100%
Don't use
Unacceptable
Poor
Fair
Good
Excellent
LIGHT RAIL RIDER RATING: ONBOARD INFORMATION CARDS
Total
Blue Line
Green Line
LIGHT RAIL
Rating Total Blue Line Green Line
Excellent 21% 21% 21%
Good 32% 32% 29%
Fair 16% 15% 17%
Poor 3% 3% 4%
Unacceptable 1% 1% 1%
Don't use 28% 28% 28%
Mean score 3.95 3.97 3.93
2014 Metro Transit Rider Survey
173
Light Rail Trends
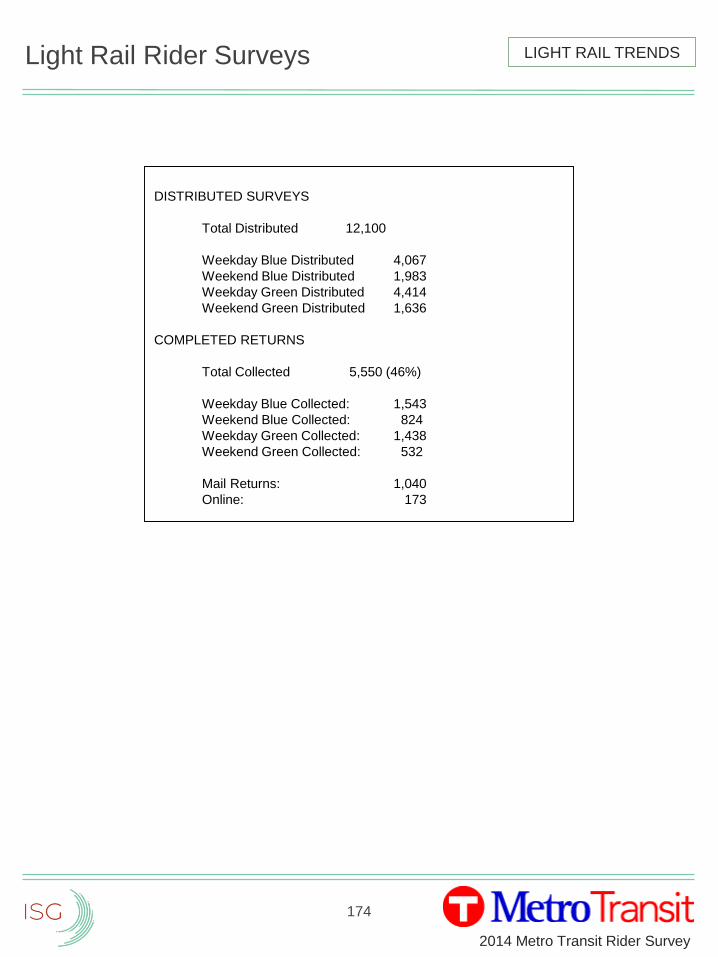
174
2014 Metro Transit Rider Survey
Light Rail Rider Surveys
DISTRIBUTED SURVEYS
Total Distributed 12,100
Weekday Blue Distributed 4,067
Weekend Blue Distributed 1,983
Weekday Green Distributed 4,414
Weekend Green Distributed 1,636
COMPLETED RETURNS
Total Collected 5,550 (46%)
Weekday Blue Collected: 1,543
Weekend Blue Collected: 824
Weekday Green Collected: 1,438
Weekend Green Collected: 532
Mail Returns: 1,040
Online: 173
LIGHT RAIL TRENDS

175
2014 Metro Transit Rider Survey
Light Rail Rider Snapshot
6%
14%
18%
16%
25%
20%
2%
4%*
12%*
14%*
15%
27%*
25%*
3%*
65 or Over
55-64
45-54
35-44
25-34
18-24
Under 18
Age
6%
3%
4%
2%
5%
14%
71%
6%
2%
5%
2%
7%*
19%*
65%*
Hispanic/Latino
Other
Mixed Race
American Indian
Asian
African American
Caucasian
Race
17
%
8% 9% 1
1%
11
%
15
%
11
%
11
%
7%
16
%
8% 1
0%
10
% 13
% 15
%
11
%
11
%
7%
<10 10-15 15-25 25-35 35-50 50-75 75-99 100-149 150+
Thousands ($)
Household Income 2014
2012
RIDERSHIP• 52% ride LRT on weekdays and
39% ride on both weekdays and
weekends.
• Most ride during rush hour (69%).
• Riding LRT five days a week is
most common (36%), 66% ride
four to seven days a week.
• Work is the primary trip purpose
(53%), followed by school (16%)
and shopping/errands (15%).
• 34% have no working
automobiles available for use.
• 13% use Park & Ride.
INFLUENCES• 38% report their employer or an
organization they are involved
with offer transit passes, and of
those, 59% cover part of the cost.
• Friends, family and coworkers
(25%), school (24%), and moved
locations (21%) are the top
influences to first try transit.
PREFERENCES• For over half (51%), living or
working close to transit is the
main reason for using transit,
followed by saving money on
parking (48%).
• Half (50%) use metrotransit.org
as their primary source for transit
information with the primary
features being trip planner and
route/schedule pages.
• 77% of riders use Go-To
technology to pay their fare.
METRO TRANSIT RATINGS
High Correlation, High Performance• Transferring is easy
• Value for fare paid
• Hours of operation for transit service
meet my needs
• Vehicles are environmentally friendly
High Correlation, Lower Performance• Total travel time is reasonable
• Reliability – service is on schedule
• In addition, personal safety while
waiting and vehicles are clean
warrant attention.
Demographics• Top zip code origins: 55406,
55417, 55407, 55404
• Top zip code destinations:
55402, 55401, 55425
• Increase in younger riders (18-
34) since 2012
• Number of non-white riders is
higher
• Annual HH incomes remain
stable since 2012
• 52% female
* Statistically significant difference 2014 to 2012
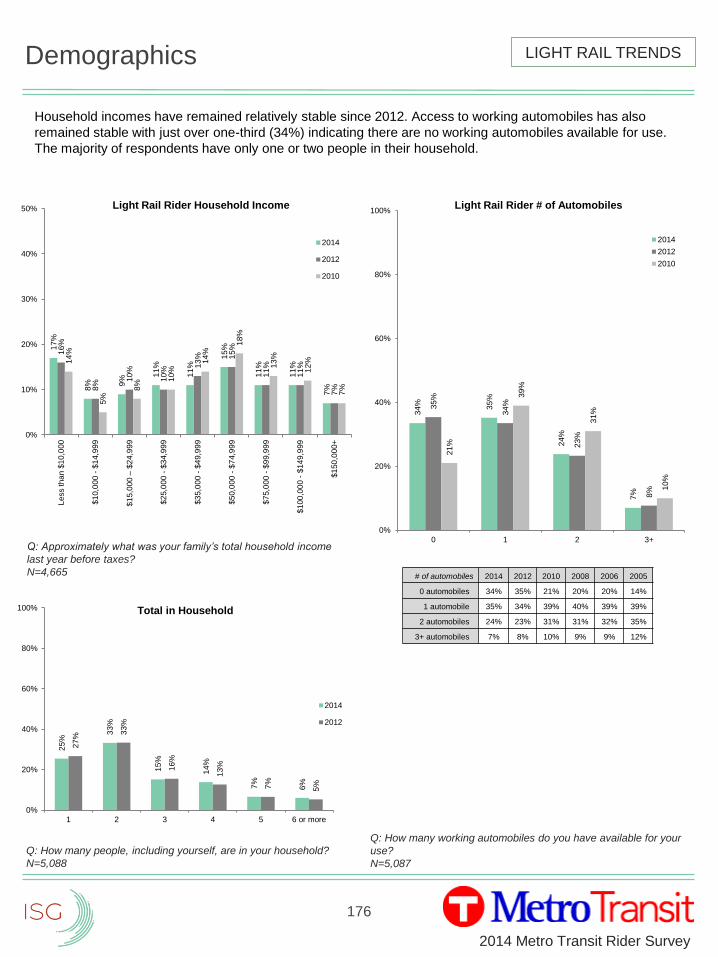
176
2014 Metro Transit Rider Survey
Demographics
Household incomes have remained relatively stable since 2012. Access to working automobiles has also
remained stable with just over one-third (34%) indicating there are no working automobiles available for use.
The majority of respondents have only one or two people in their household.
Q: Approximately what was your family’s total household income
last year before taxes?
N=4,665
Q: How many working automobiles do you have available for your
use?
N=5,087
17
%
8% 9
%
11
%
11
%
15
%
11
%
11
%
7%
16
%
8%
10
%
10
%
13
% 15
%
11
%
11
%
7%
14
%
5%
8%
10
%
14
%
18
%
13
%
12
%
7%
0%
10%
20%
30%
40%
50%
Le
ss th
an
$1
0,0
00
$1
0,0
00
- $
14,9
99
$1
5,0
00
–$
24
,99
9
$2
5,0
00
- $
34,9
99
$3
5,0
00
- $
49,9
99
$5
0,0
00
- $
74,9
99
$7
5,0
00
- $
99,9
99
$1
00
,00
0 -
$14
9,9
99
$1
50
,00
0+
Light Rail Rider Household Income
2014
2012
2010
34
% 35
%
24
%
7%
35
%
34
%
23
%
8%
21
%
39
%
31
%
10
%
0%
20%
40%
60%
80%
100%
0 1 2 3+
Light Rail Rider # of Automobiles
2014
2012
2010
# of automobiles 2014 2012 2010 2008 2006 2005
0 automobiles 34% 35% 21% 20% 20% 14%
1 automobile 35% 34% 39% 40% 39% 39%
2 automobiles 24% 23% 31% 31% 32% 35%
3+ automobiles 7% 8% 10% 9% 9% 12%
25
%
33
%
15
%
14
%
7%
6%
27
%
33
%
16
%
13
%
7%
5%
0%
20%
40%
60%
80%
100%
1 2 3 4 5 6 or more
Total in Household
2014
2012
Q: How many people, including yourself, are in your household?
N=5,088
LIGHT RAIL TRENDS
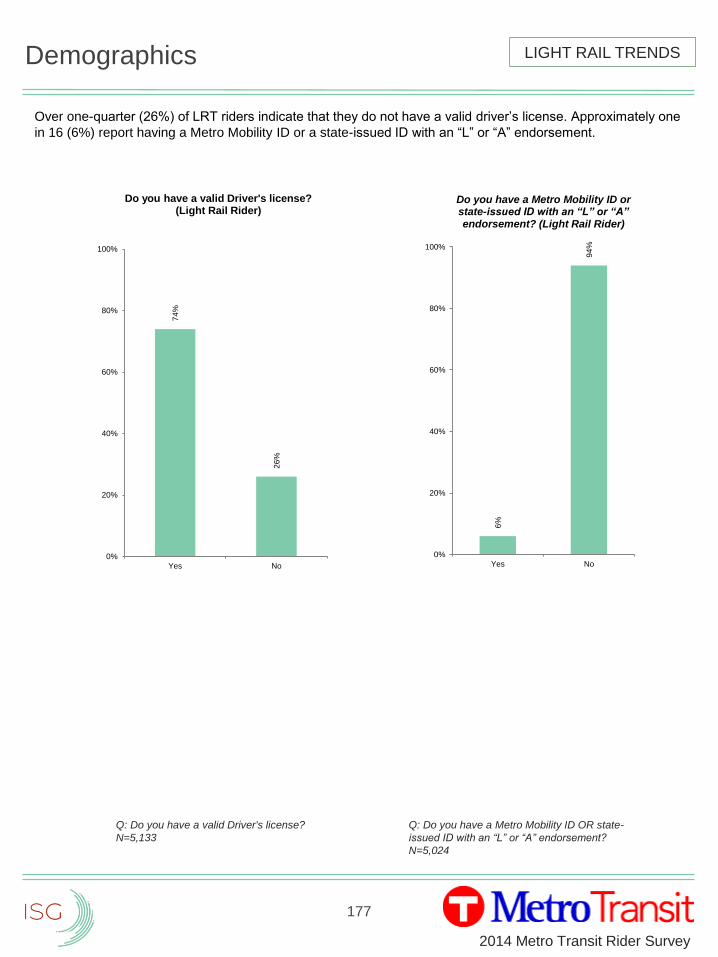
177
2014 Metro Transit Rider Survey
Demographics
Over one-quarter (26%) of LRT riders indicate that they do not have a valid driver’s license. Approximately one
in 16 (6%) report having a Metro Mobility ID or a state-issued ID with an “L” or “A” endorsement.
LIGHT RAIL TRENDS
Q: Do you have a valid Driver's license?
N=5,133
Q: Do you have a Metro Mobility ID OR state-
issued ID with an “L” or “A” endorsement?
N=5,024
74
%
26
%
0%
20%
40%
60%
80%
100%
Yes No
Do you have a valid Driver's license? (Light Rail Rider)
6%
94
%
0%
20%
40%
60%
80%
100%
Yes No
Do you have a Metro Mobility ID or state-issued ID with an “L” or “A” endorsement? (Light Rail Rider)
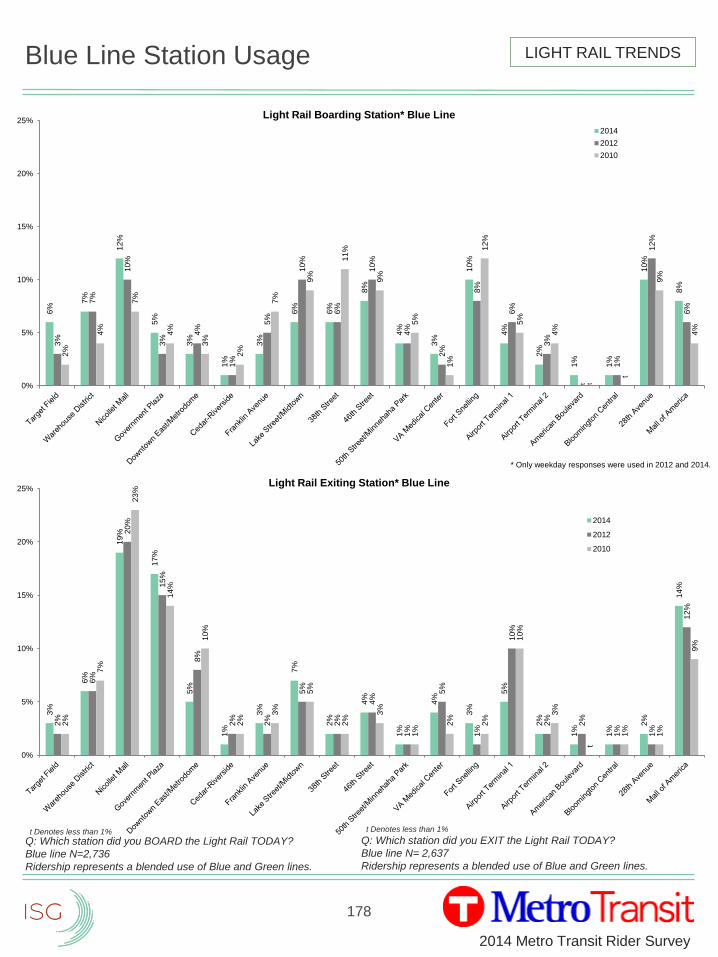
178
2014 Metro Transit Rider Survey
Blue Line Station Usage LIGHT RAIL TRENDS6
%
7%
12
%
5%
3%
1%
3%
6%
6%
8%
4%
3%
10
%
4%
2%
1%
1%
10
%
8%
3%
7%
10
%
3%
4%
1%
5%
10
%
6%
10
%
4%
2%
8%
6%
3%
1%
12
%
6%
2%
4%
7%
4%
3%
2%
7%
9%
11
%
9%
5%
1%
12
%
5%
4%
t
9%
4%
0%
5%
10%
15%
20%
25%Light Rail Boarding Station* Blue Line
2014
2012
2010
* Only weekday responses were used in 2012 and 2014.
t t
3%
6%
19
%
17
%
5%
1%
3%
7%
2%
4%
1%
4%
3%
5%
2%
1%
1%
2%
14
%
2%
6%
20
%
15
%
8%
2%
2%
5%
2%
4%
1%
5%
1%
10
%
2%
2%
1%
1%
12
%
2%
7%
23
%
14
%
10
%
2%
3%
5%
2%
3%
1%
2%
2%
10
%
3%
t
1%
1%
9%
0%
5%
10%
15%
20%
25%Light Rail Exiting Station* Blue Line
2014
2012
2010
Q: Which station did you EXIT the Light Rail TODAY?
Blue line N= 2,637
Ridership represents a blended use of Blue and Green lines.
Q: Which station did you BOARD the Light Rail TODAY?
Blue line N=2,736
Ridership represents a blended use of Blue and Green lines.
t Denotes less than 1% t Denotes less than 1%
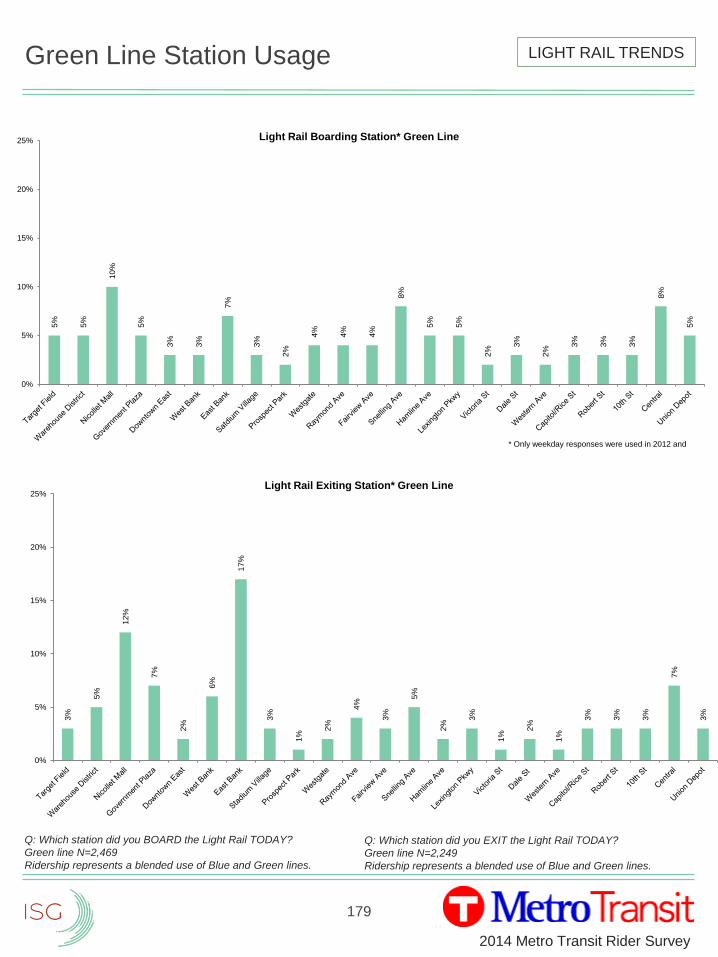
179
2014 Metro Transit Rider Survey
Green Line Station Usage
Q: Which station did you EXIT the Light Rail TODAY?
Green line N=2,249
Ridership represents a blended use of Blue and Green lines.
LIGHT RAIL TRENDS3
%
5%
12
%
7%
2%
6%
17
%
3%
1%
2%
4%
3%
5%
2%
3%
1%
2%
1%
3%
3%
3%
7%
3%
0%
5%
10%
15%
20%
25%Light Rail Exiting Station* Green Line
5%
5%
10
%
5%
3%
3%
7%
3%
2%
4%
4%
4%
8%
5%
5%
2%
3%
2%
3%
3%
3%
8%
5%
0%
5%
10%
15%
20%
25% Light Rail Boarding Station* Green Line
* Only weekday responses were used in 2012 and
Q: Which station did you BOARD the Light Rail TODAY?
Green line N=2,469
Ridership represents a blended use of Blue and Green lines.
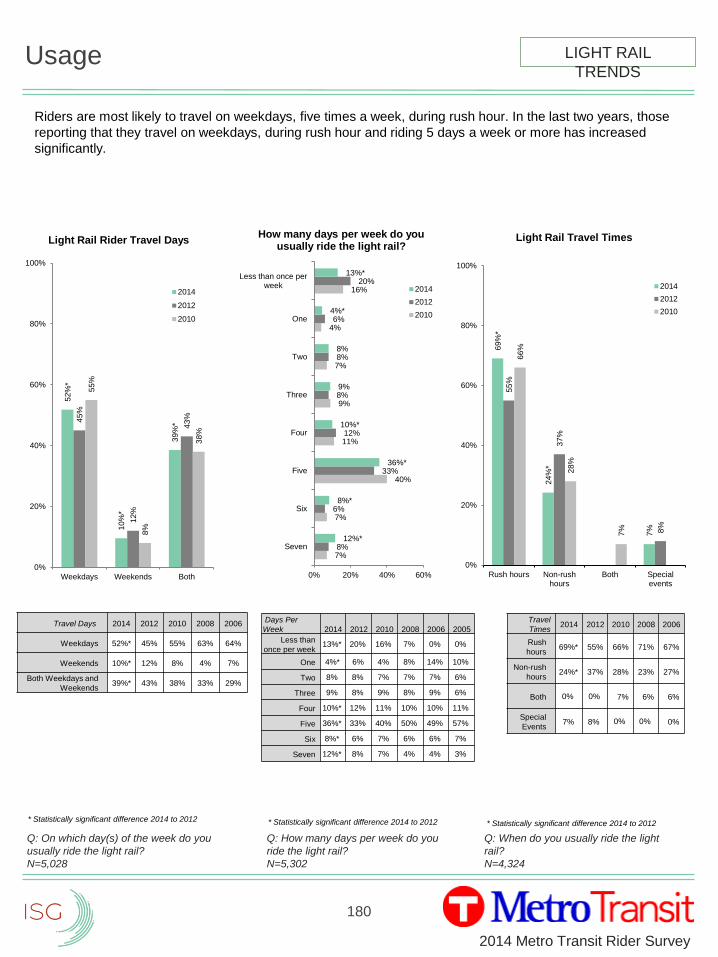
180
2014 Metro Transit Rider Survey
Usage
Riders are most likely to travel on weekdays, five times a week, during rush hour. In the last two years, those
reporting that they travel on weekdays, during rush hour and riding 5 days a week or more has increased
significantly.
Q: On which day(s) of the week do you
usually ride the light rail?
N=5,028
Q: How many days per week do you
ride the light rail?
N=5,302
52
%*
10
%*
39
%*4
5%
12
%
43
%
55
%
8%
38
%
0%
20%
40%
60%
80%
100%
Weekdays Weekends Both
Light Rail Rider Travel Days
2014
2012
2010
7%
7%
40%
11%
9%
7%
4%
16%
8%
6%
33%
12%
8%
8%
6%
20%
12%*
8%*
36%*
10%*
9%
8%
4%*
13%*
0% 20% 40% 60%
Seven
Six
Five
Four
Three
Two
One
Less than once perweek
How many days per week do you usually ride the light rail?
2014
2012
2010
69
%*
24
%*
7%
55
%
37
%
8%
66
%
28
%
7%
0%
20%
40%
60%
80%
100%
Rush hours Non-rushhours
Both Specialevents
Light Rail Travel Times
2014
2012
2010
Q: When do you usually ride the light
rail?
N=4,324
Travel
Times2014 2012 2010 2008 2006
Rush
hours69%* 55% 66% 71% 67%
Non-rush
hours24%* 37% 28% 23% 27%
Both 0% 0% 7% 6% 6%
Special
Events7% 8% 0% 0% 0%
Days Per
Week 2014 2012 2010 2008 2006 2005
Less than
once per week13%* 20% 16% 7% 0% 0%
One 4%* 6% 4% 8% 14% 10%
Two 8% 8% 7% 7% 7% 6%
Three 9% 8% 9% 8% 9% 6%
Four 10%* 12% 11% 10% 10% 11%
Five 36%* 33% 40% 50% 49% 57%
Six 8%* 6% 7% 6% 6% 7%
Seven 12%* 8% 7% 4% 4% 3%
Travel Days 2014 2012 2010 2008 2006
Weekdays 52%* 45% 55% 63% 64%
Weekends 10%* 12% 8% 4% 7%
Both Weekdays and
Weekends39%* 43% 38% 33% 29%
LIGHT RAIL
TRENDS
* Statistically significant difference 2014 to 2012* Statistically significant difference 2014 to 2012* Statistically significant difference 2014 to 2012
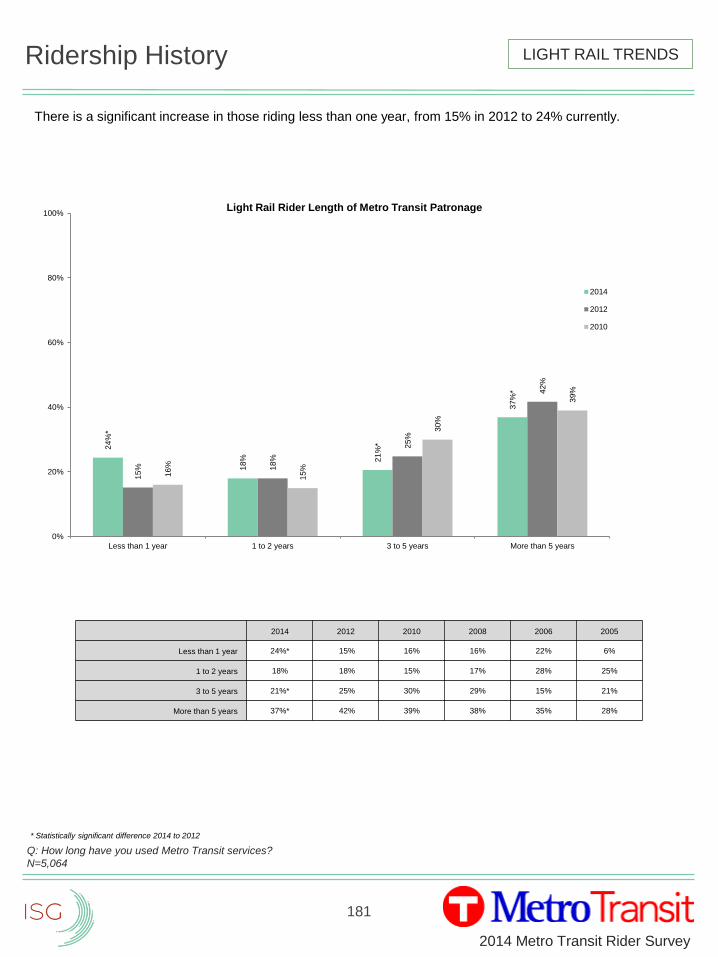
181
2014 Metro Transit Rider Survey
Ridership History
There is a significant increase in those riding less than one year, from 15% in 2012 to 24% currently.
Q: How long have you used Metro Transit services?
N=5,064
24
%*
18
% 21
%*
37
%*
15
% 18
%
25
%
42
%
16
%
15
%
30
%
39
%
0%
20%
40%
60%
80%
100%
Less than 1 year 1 to 2 years 3 to 5 years More than 5 years
Light Rail Rider Length of Metro Transit Patronage
2014
2012
2010
2014 2012 2010 2008 2006 2005
Less than 1 year 24%* 15% 16% 16% 22% 6%
1 to 2 years 18% 18% 15% 17% 28% 25%
3 to 5 years 21%* 25% 30% 29% 15% 21%
More than 5 years 37%* 42% 39% 38% 35% 28%
* Statistically significant difference 2014 to 2012
LIGHT RAIL TRENDS
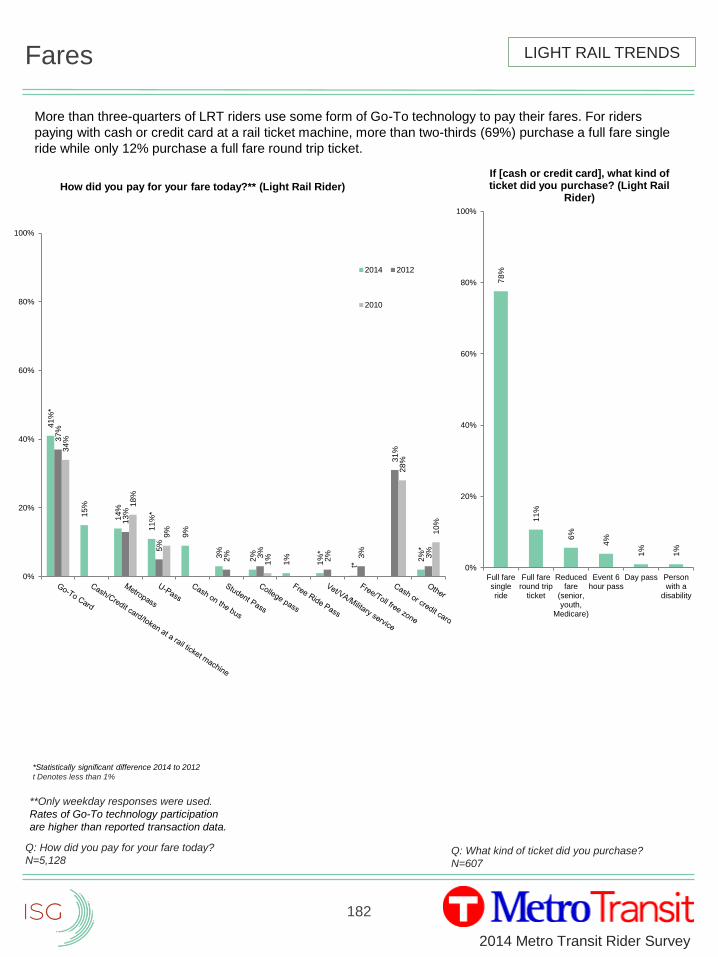
182
2014 Metro Transit Rider Survey
Fares
Q: How did you pay for your fare today?
N=5,128Q: What kind of ticket did you purchase?
N=607
41
%*
15
%
14
%
11
%*
9%
3%
2%
1%
1%
*
t*
2%
*
37
%
13
%
5%
2% 3%
2% 3%
31
%
3%
34
%
18
%
9%
1%
28
%
10
%
0%
20%
40%
60%
80%
100%
How did you pay for your fare today?** (Light Rail Rider)
2014 2012
2010
*Statistically significant difference 2014 to 2012
t Denotes less than 1%
More than three-quarters of LRT riders use some form of Go-To technology to pay their fares. For riders
paying with cash or credit card at a rail ticket machine, more than two-thirds (69%) purchase a full fare single
ride while only 12% purchase a full fare round trip ticket.
**Only weekday responses were used.
Rates of Go-To technology participation
are higher than reported transaction data.
78
%
11
%
6%
4%
1%
1%
0%
20%
40%
60%
80%
100%
Full faresingleride
Full fareround trip
ticket
Reducedfare
(senior,youth,
Medicare)
Event 6hour pass
Day pass Personwith a
disability
If [cash or credit card], what kind of ticket did you purchase? (Light Rail
Rider)
LIGHT RAIL TRENDS
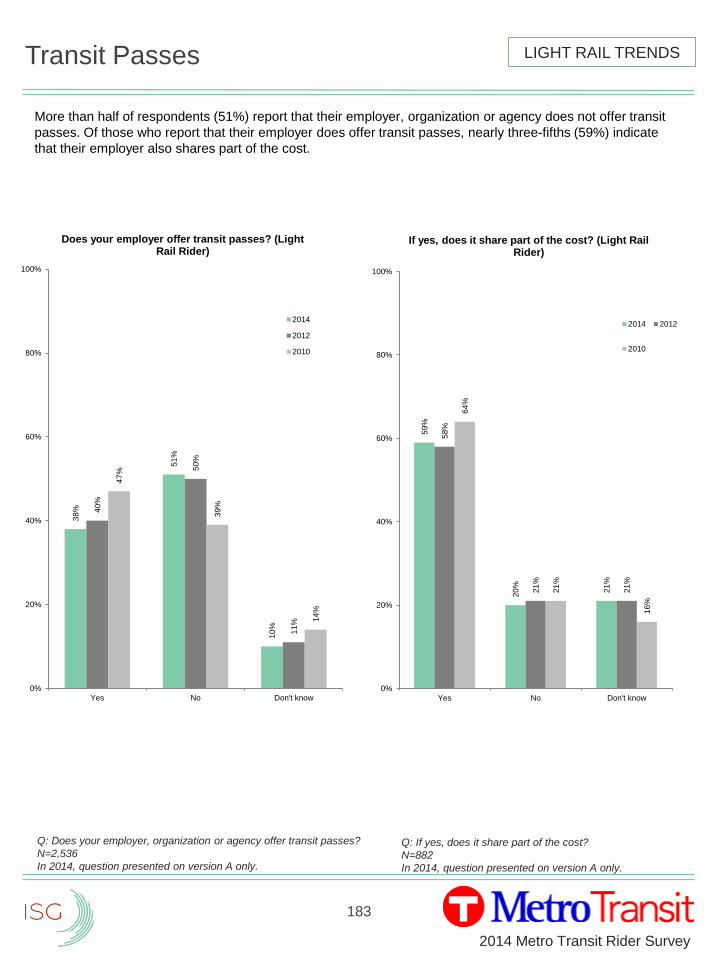
183
2014 Metro Transit Rider Survey
Transit Passes
Q: Does your employer, organization or agency offer transit passes?
N=2,536
In 2014, question presented on version A only.
Q: If yes, does it share part of the cost?
N=882
In 2014, question presented on version A only.
38
%
51
%
10
%
40
%
50
%
11
%
47
%
39
%
14
%
0%
20%
40%
60%
80%
100%
Yes No Don't know
Does your employer offer transit passes? (Light Rail Rider)
2014
2012
2010
59
%
20
%
21
%
58
%
21
%
21
%
64
%
21
%
16
%
0%
20%
40%
60%
80%
100%
Yes No Don't know
If yes, does it share part of the cost? (Light Rail Rider)
2014 2012
2010
More than half of respondents (51%) report that their employer, organization or agency does not offer transit
passes. Of those who report that their employer does offer transit passes, nearly three-fifths (59%) indicate
that their employer also shares part of the cost.
LIGHT RAIL TRENDS
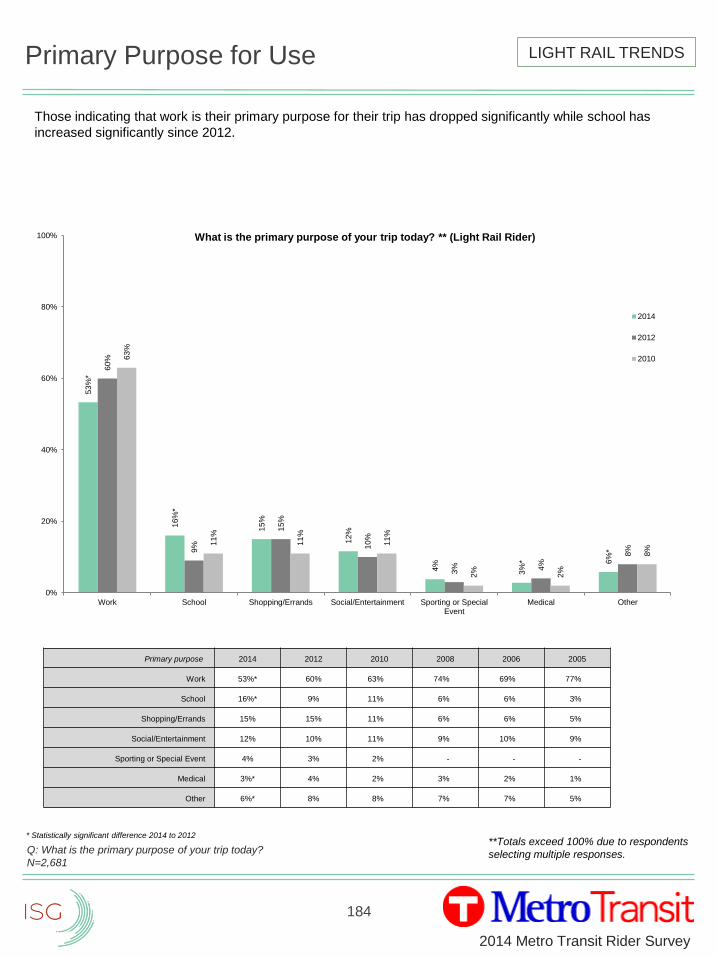
184
2014 Metro Transit Rider Survey
Primary Purpose for Use
Those indicating that work is their primary purpose for their trip has dropped significantly while school has
increased significantly since 2012.
Q: What is the primary purpose of your trip today?
N=2,681
53
%*
16
%*
15
%
12
%
4%
3%
* 6%
*
60
%
9%
15
%
10
%
3% 4%
8%
63
%
11
%
11
%
11
%
2%
2%
8%
0%
20%
40%
60%
80%
100%
Work School Shopping/Errands Social/Entertainment Sporting or SpecialEvent
Medical Other
What is the primary purpose of your trip today? ** (Light Rail Rider)
2014
2012
2010
Primary purpose 2014 2012 2010 2008 2006 2005
Work 53%* 60% 63% 74% 69% 77%
School 16%* 9% 11% 6% 6% 3%
Shopping/Errands 15% 15% 11% 6% 6% 5%
Social/Entertainment 12% 10% 11% 9% 10% 9%
Sporting or Special Event 4% 3% 2% - - -
Medical 3%* 4% 2% 3% 2% 1%
Other 6%* 8% 8% 7% 7% 5%
LIGHT RAIL TRENDS
* Statistically significant difference 2014 to 2012**Totals exceed 100% due to respondents
selecting multiple responses.
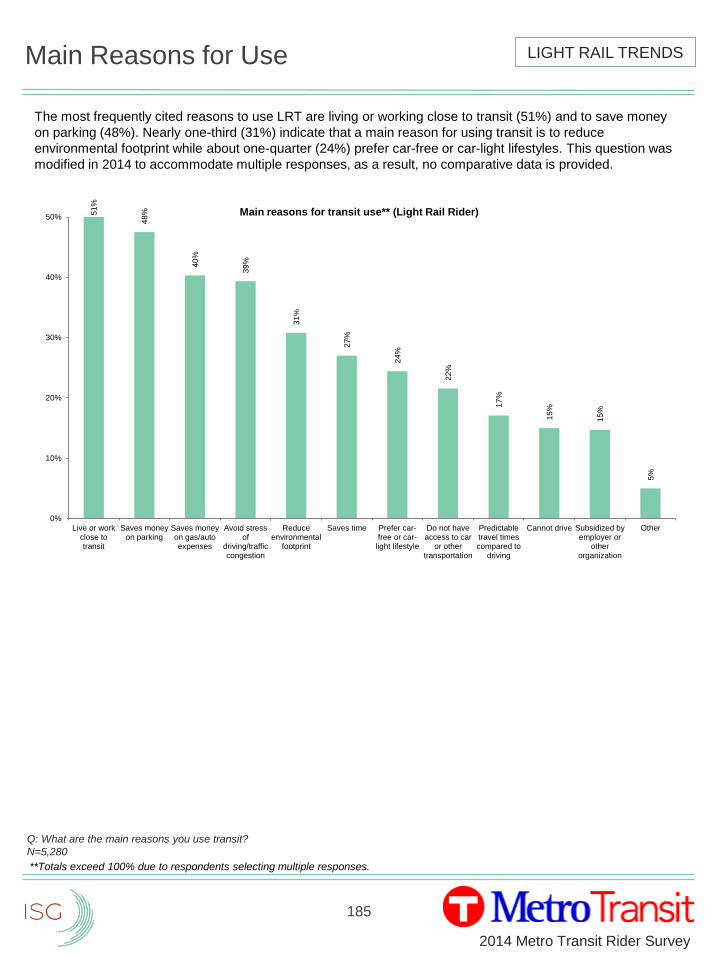
185
2014 Metro Transit Rider Survey
Main Reasons for Use
The most frequently cited reasons to use LRT are living or working close to transit (51%) and to save money
on parking (48%). Nearly one-third (31%) indicate that a main reason for using transit is to reduce
environmental footprint while about one-quarter (24%) prefer car-free or car-light lifestyles. This question was
modified in 2014 to accommodate multiple responses, as a result, no comparative data is provided.
Q: What are the main reasons you use transit?
N=5,280
51
%
48
%
40
%
39
%
31
%
27
%
24
%
22
%
17
%
15
%
15
%
5%
0%
10%
20%
30%
40%
50%
Live or workclose totransit
Saves moneyon parking
Saves moneyon gas/autoexpenses
Avoid stressof
driving/trafficcongestion
Reduceenvironmental
footprint
Saves time Prefer car-free or car-
light lifestyle
Do not haveaccess to car
or othertransportation
Predictabletravel timescompared to
driving
Cannot drive Subsidized byemployer or
otherorganization
Other
Main reasons for transit use** (Light Rail Rider)
LIGHT RAIL TRENDS
**Totals exceed 100% due to respondents selecting multiple responses.
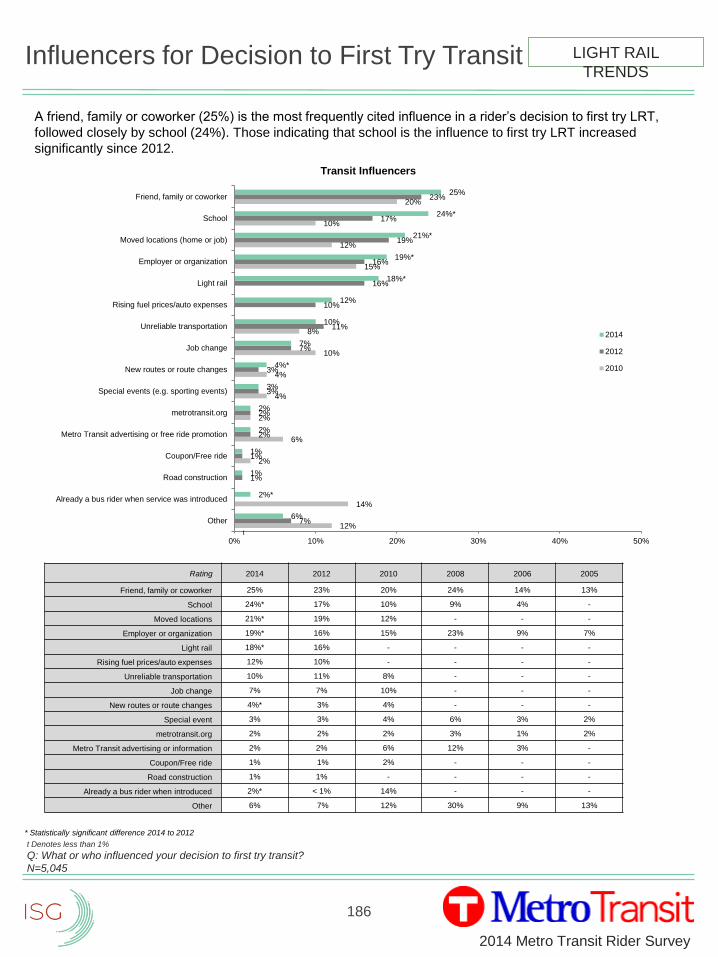
186
2014 Metro Transit Rider Survey
Influencers for Decision to First Try Transit
A friend, family or coworker (25%) is the most frequently cited influence in a rider’s decision to first try LRT,
followed closely by school (24%). Those indicating that school is the influence to first try LRT increased
significantly since 2012.
t Denotes less than 1%
Q: What or who influenced your decision to first try transit?
N=5,045
12%
14%
2%
6%
2%
4%
4%
10%
8%
15%
12%
10%
20%
7%
1%
1%
2%
2%
3%
3%
7%
11%
10%
16%
16%
19%
17%
23%
6%
2%*
1%
1%
2%
2%
3%
4%*
7%
10%
12%
18%*
19%*
21%*
24%*
25%
0% 10% 20% 30% 40% 50%
Other
Already a bus rider when service was introduced
Road construction
Coupon/Free ride
Metro Transit advertising or free ride promotion
metrotransit.org
Special events (e.g. sporting events)
New routes or route changes
Job change
Unreliable transportation
Rising fuel prices/auto expenses
Light rail
Employer or organization
Moved locations (home or job)
School
Friend, family or coworker
Transit Influencers
2014
2012
2010
Rating 2014 2012 2010 2008 2006 2005
Friend, family or coworker 25% 23% 20% 24% 14% 13%
School 24%* 17% 10% 9% 4% -
Moved locations 21%* 19% 12% - - -
Employer or organization 19%* 16% 15% 23% 9% 7%
Light rail 18%* 16% - - - -
Rising fuel prices/auto expenses 12% 10% - - - -
Unreliable transportation 10% 11% 8% - - -
Job change 7% 7% 10% - - -
New routes or route changes 4%* 3% 4% - - -
Special event 3% 3% 4% 6% 3% 2%
metrotransit.org 2% 2% 2% 3% 1% 2%
Metro Transit advertising or information 2% 2% 6% 12% 3% -
Coupon/Free ride 1% 1% 2% - - -
Road construction 1% 1% - - - -
Already a bus rider when introduced 2%* < 1% 14% - - -
Other 6% 7% 12% 30% 9% 13%
* Statistically significant difference 2014 to 2012
t
LIGHT RAIL
TRENDS
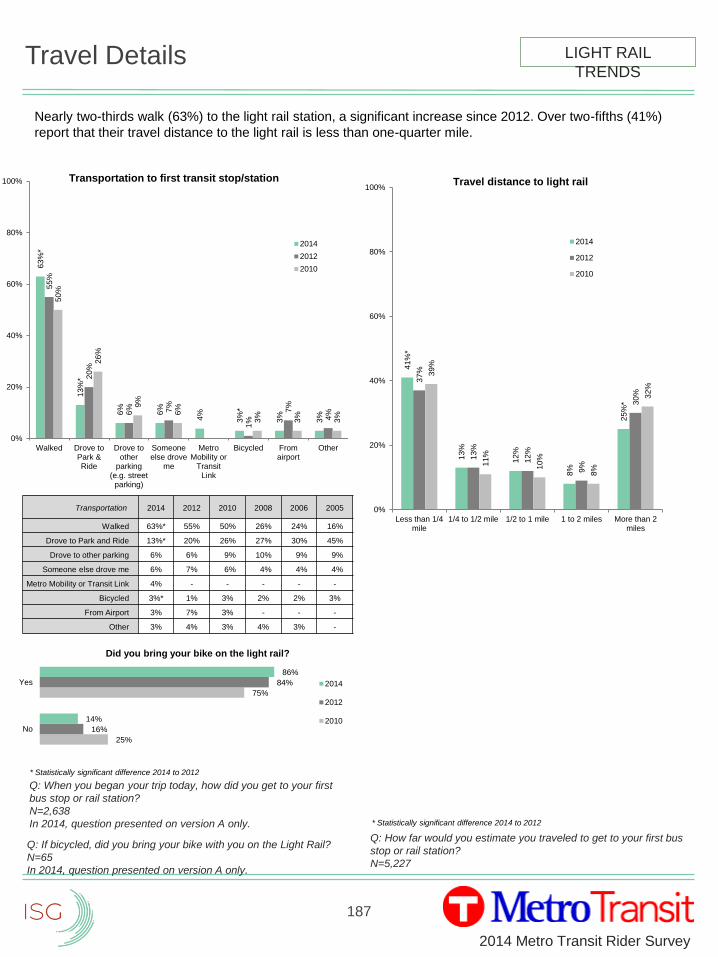
187
2014 Metro Transit Rider Survey
Travel Details
Nearly two-thirds walk (63%) to the light rail station, a significant increase since 2012. Over two-fifths (41%)
report that their travel distance to the light rail is less than one-quarter mile.
Q: When you began your trip today, how did you get to your first
bus stop or rail station?
N=2,638
In 2014, question presented on version A only.
Q: How far would you estimate you traveled to get to your first bus
stop or rail station?
N=5,227
Q: If bicycled, did you bring your bike with you on the Light Rail?
N=65
In 2014, question presented on version A only.
63
%*
13
%*
6%
6%
4%
3%
*
3%
3%
55
%
20
%
6% 7%
1%
7%
4%
50
%
26
%
9%
6%
3%
3%
3%
0%
20%
40%
60%
80%
100%
Walked Drove toPark &Ride
Drove toother
parking(e.g. street
parking)
Someoneelse drove
me
MetroMobility or
TransitLink
Bicycled Fromairport
Other
Transportation to first transit stop/station
2014
2012
2010
41
%*
13
%
12
%
8%
25
%*
37
%
13
%
12
%
9%
30
%
39
%
11
%
10
%
8%
32
%
0%
20%
40%
60%
80%
100%
Less than 1/4mile
1/4 to 1/2 mile 1/2 to 1 mile 1 to 2 miles More than 2miles
Travel distance to light rail
2014
2012
2010
25%
75%
16%
84%
14%
86%
No
Yes
Did you bring your bike on the light rail?
2014
2012
2010
LIGHT RAIL
TRENDS
Transportation 2014 2012 2010 2008 2006 2005
Walked 63%* 55% 50% 26% 24% 16%
Drove to Park and Ride 13%* 20% 26% 27% 30% 45%
Drove to other parking 6% 6% 9% 10% 9% 9%
Someone else drove me 6% 7% 6% 4% 4% 4%
Metro Mobility or Transit Link 4% - - - - -
Bicycled 3%* 1% 3% 2% 2% 3%
From Airport 3% 7% 3% - - -
Other 3% 4% 3% 4% 3% -
* Statistically significant difference 2014 to 2012
* Statistically significant difference 2014 to 2012
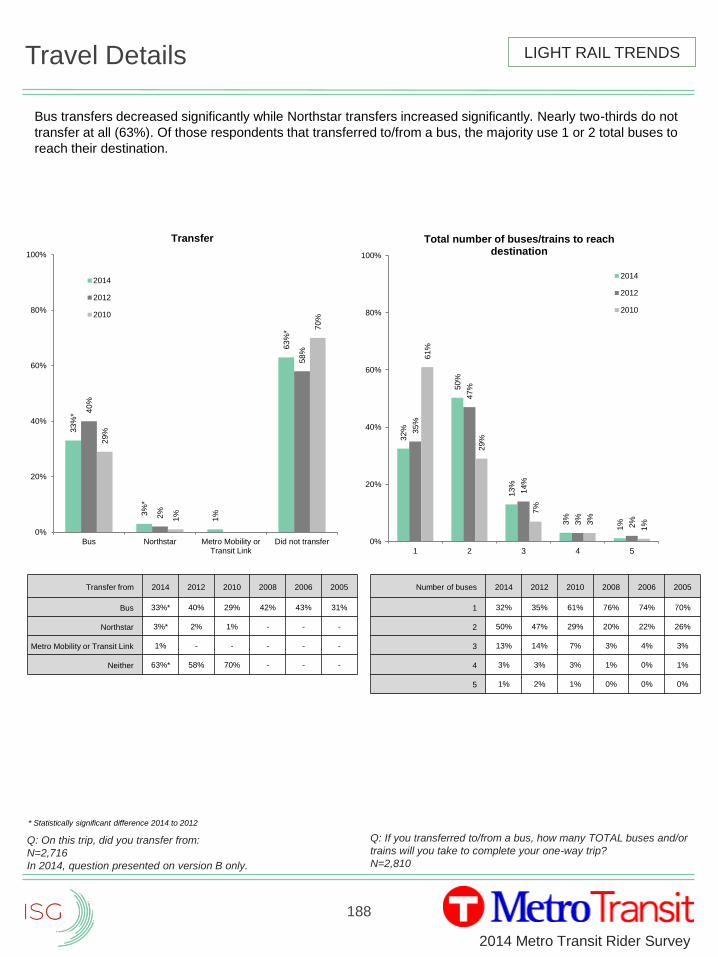
188
2014 Metro Transit Rider Survey
Travel Details
Bus transfers decreased significantly while Northstar transfers increased significantly. Nearly two-thirds do not
transfer at all (63%). Of those respondents that transferred to/from a bus, the majority use 1 or 2 total buses to
reach their destination.
Q: If you transferred to/from a bus, how many TOTAL buses and/or
trains will you take to complete your one-way trip?
N=2,810
Q: On this trip, did you transfer from:
N=2,716
In 2014, question presented on version B only.
33
%*
3%
*
1%
63
%*
40
%
2%
58
%
29
%
1%
70
%
0%
20%
40%
60%
80%
100%
Bus Northstar Metro Mobility orTransit Link
Did not transfer
Transfer
2014
2012
2010
32
%
50
%
13
%
3%
1%
35
%
47
%
14
%
3%
2%
61
%
29
%
7%
3%
1%
0%
20%
40%
60%
80%
100%
1 2 3 4 5
Total number of buses/trains to reach destination
2014
2012
2010
Transfer from 2014 2012 2010 2008 2006 2005
Bus 33%* 40% 29% 42% 43% 31%
Northstar 3%* 2% 1% - - -
Metro Mobility or Transit Link 1% - - - - -
Neither 63%* 58% 70% - - -
Number of buses 2014 2012 2010 2008 2006 2005
1 32% 35% 61% 76% 74% 70%
2 50% 47% 29% 20% 22% 26%
3 13% 14% 7% 3% 4% 3%
4 3% 3% 3% 1% 0% 1%
5 1% 2% 1% 0% 0% 0%
* Statistically significant difference 2014 to 2012
LIGHT RAIL TRENDS
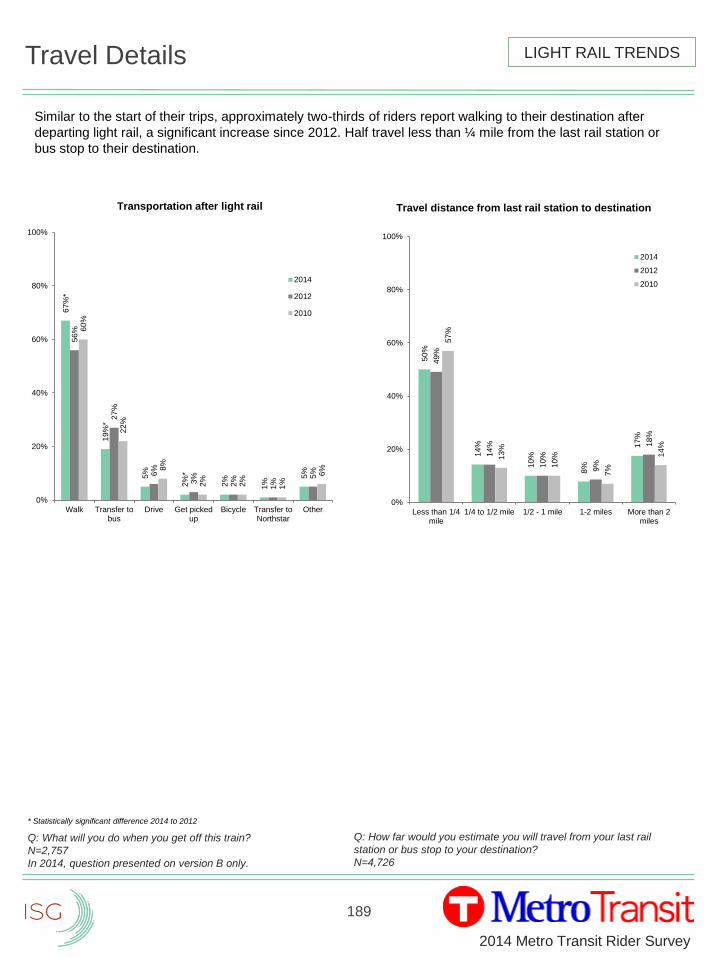
189
2014 Metro Transit Rider Survey
Travel Details
Similar to the start of their trips, approximately two-thirds of riders report walking to their destination after
departing light rail, a significant increase since 2012. Half travel less than ¼ mile from the last rail station or
bus stop to their destination.
Q: How far would you estimate you will travel from your last rail
station or bus stop to your destination?
N=4,726
Q: What will you do when you get off this train?
N=2,757
In 2014, question presented on version B only.
67
%*
19
%*
5%
2%
*
2%
1%
5%
56
%
27
%
6%
3%
2%
1%
5%
60
%
22
%
8%
2%
2%
1%
6%
0%
20%
40%
60%
80%
100%
Walk Transfer tobus
Drive Get pickedup
Bicycle Transfer toNorthstar
Other
Transportation after light rail
2014
2012
2010
50
%
14
%
10
%
8%
17
%
49
%
14
%
10
%
9%
18
%
57
%
13
%
10
%
7%
14
%
0%
20%
40%
60%
80%
100%
Less than 1/4mile
1/4 to 1/2 mile 1/2 - 1 mile 1-2 miles More than 2miles
Travel distance from last rail station to destination
2014
2012
2010
* Statistically significant difference 2014 to 2012
LIGHT RAIL TRENDS
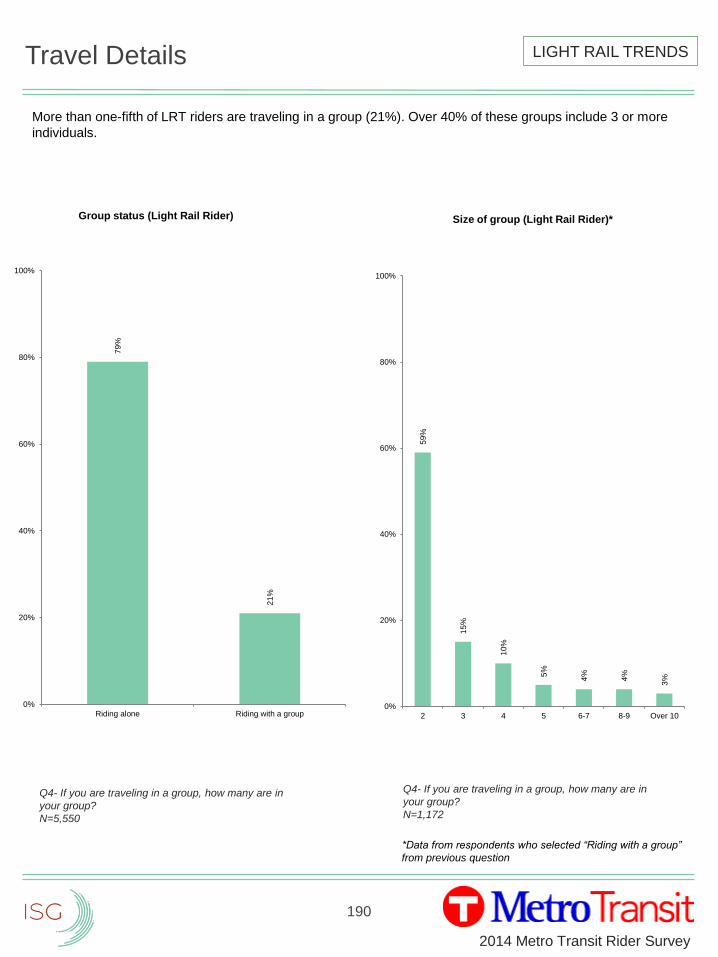
190
2014 Metro Transit Rider Survey
Travel Details
59
%
15
%
10
%
5%
4%
4%
3%
0%
20%
40%
60%
80%
100%
2 3 4 5 6-7 8-9 Over 10
Size of group (Light Rail Rider)*
79
%
21
%
0%
20%
40%
60%
80%
100%
Riding alone Riding with a group
Group status (Light Rail Rider)
Q4- If you are traveling in a group, how many are in
your group?
N=1,172
*Data from respondents who selected “Riding with a group”
from previous question
Q4- If you are traveling in a group, how many are in
your group?
N=5,550
More than one-fifth of LRT riders are traveling in a group (21%). Over 40% of these groups include 3 or more
individuals.
LIGHT RAIL TRENDS
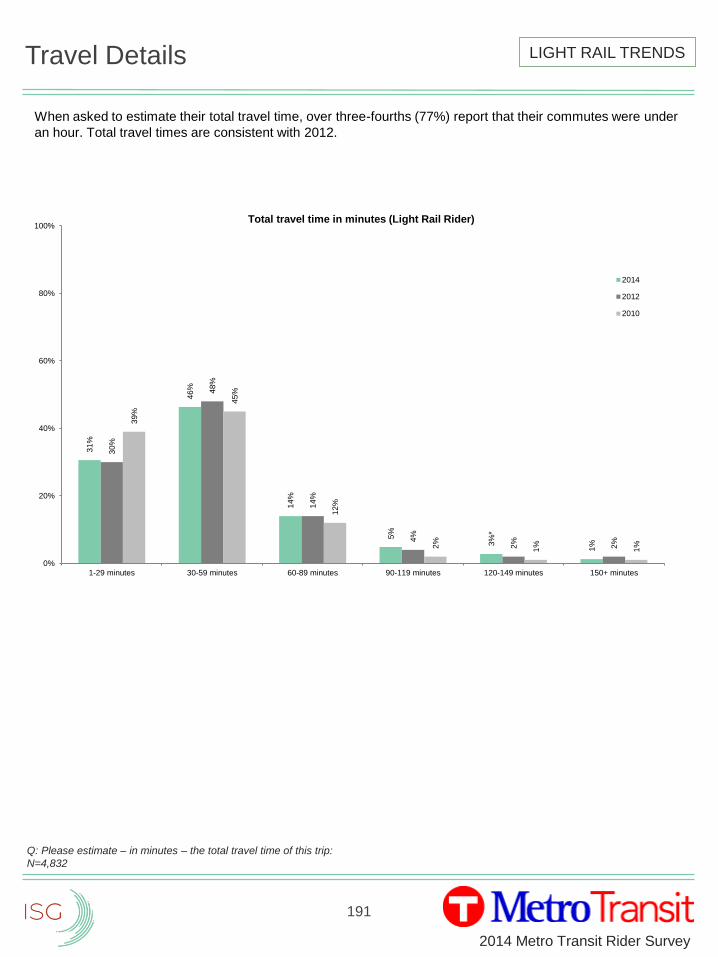
191
2014 Metro Transit Rider Survey
Travel Details
When asked to estimate their total travel time, over three-fourths (77%) report that their commutes were under
an hour. Total travel times are consistent with 2012.
Q: Please estimate – in minutes – the total travel time of this trip:
N=4,832
31
%
46
%
14
%
5%
3%
*
1%
30
%
48
%
14
%
4%
2%
2%
39
%
45
%
12
%
2%
1%
1%
0%
20%
40%
60%
80%
100%
1-29 minutes 30-59 minutes 60-89 minutes 90-119 minutes 120-149 minutes 150+ minutes
Total travel time in minutes (Light Rail Rider)
2014
2012
2010
LIGHT RAIL TRENDS
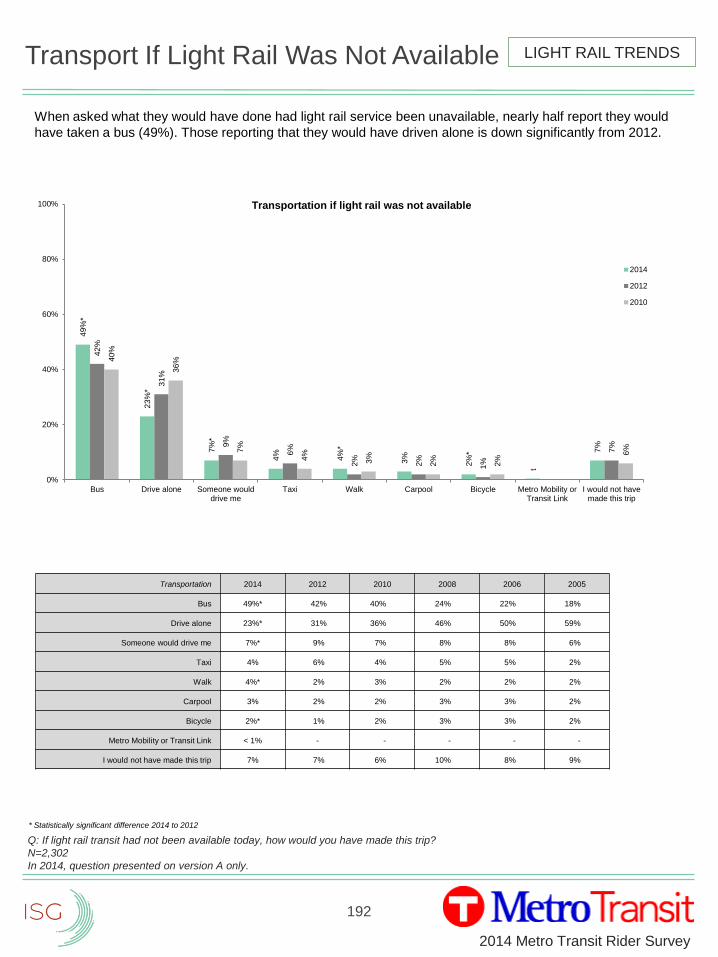
192
2014 Metro Transit Rider Survey
Transport If Light Rail Was Not Available
When asked what they would have done had light rail service been unavailable, nearly half report they would
have taken a bus (49%). Those reporting that they would have driven alone is down significantly from 2012.
Q: If light rail transit had not been available today, how would you have made this trip?
N=2,302
In 2014, question presented on version A only.
49
%*
23
%*
7%
*
4%
4%
*
3%
2%
*
t
7%
42
%
31
%
9%
6%
2%
2%
1%
7%
40
%
36
%
7%
4%
3%
2%
2%
6%
0%
20%
40%
60%
80%
100%
Bus Drive alone Someone woulddrive me
Taxi Walk Carpool Bicycle Metro Mobility orTransit Link
I would not havemade this trip
Transportation if light rail was not available
2014
2012
2010
Transportation 2014 2012 2010 2008 2006 2005
Bus 49%* 42% 40% 24% 22% 18%
Drive alone 23%* 31% 36% 46% 50% 59%
Someone would drive me 7%* 9% 7% 8% 8% 6%
Taxi 4% 6% 4% 5% 5% 2%
Walk 4%* 2% 3% 2% 2% 2%
Carpool 3% 2% 2% 3% 3% 2%
Bicycle 2%* 1% 2% 3% 3% 2%
Metro Mobility or Transit Link < 1% - - - - -
I would not have made this trip 7% 7% 6% 10% 8% 9%
* Statistically significant difference 2014 to 2012
LIGHT RAIL TRENDS
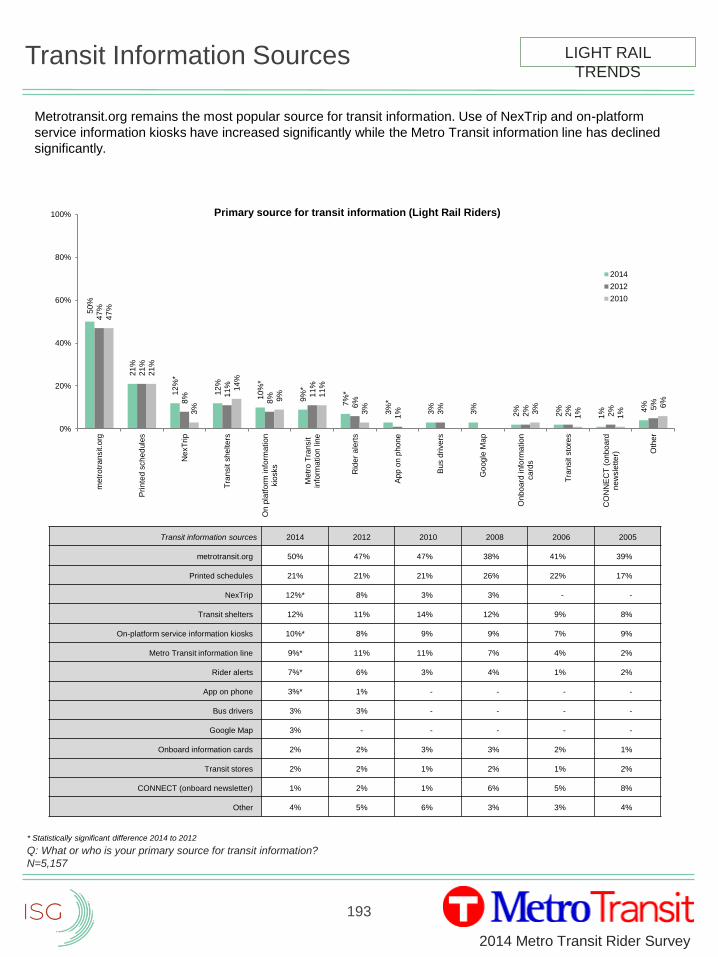
193
2014 Metro Transit Rider Survey
Transit Information Sources
Metrotransit.org remains the most popular source for transit information. Use of NexTrip and on-platform
service information kiosks have increased significantly while the Metro Transit information line has declined
significantly.
Q: What or who is your primary source for transit information?
N=5,157
50
%
21
%
12
%*
12
%
10
%*
9%
*
7%
*
3%
*
3%
3%
2%
2%
1% 4
%
47
%
21
%
8% 1
1%
8% 1
1%
6%
1% 3%
2%
2%
2% 5
%
47
%
21
%
3%
14
%
9% 11
%
3%
3%
1%
1%
6%
0%
20%
40%
60%
80%
100%
metr
otr
an
sit.o
rg
Pri
nte
d s
ch
ed
ule
s
NexT
rip
Tra
nsit s
he
lte
rs
On
pla
tfo
rm in
form
atio
nkio
sks
Metr
o T
ransit
info
rma
tio
n lin
e
Rid
er
ale
rts
Ap
p o
n p
ho
ne
Bu
s d
rivers
Go
og
le M
ap
On
bo
ard
info
rma
tio
nca
rds
Tra
nsit s
tore
s
CO
NN
EC
T (
onb
oa
rdn
ew
sle
tte
r) Oth
er
Primary source for transit information (Light Rail Riders)
2014
2012
2010
Transit information sources 2014 2012 2010 2008 2006 2005
metrotransit.org 50% 47% 47% 38% 41% 39%
Printed schedules 21% 21% 21% 26% 22% 17%
NexTrip 12%* 8% 3% 3% - -
Transit shelters 12% 11% 14% 12% 9% 8%
On-platform service information kiosks 10%* 8% 9% 9% 7% 9%
Metro Transit information line 9%* 11% 11% 7% 4% 2%
Rider alerts 7%* 6% 3% 4% 1% 2%
App on phone 3%* 1% - - - -
Bus drivers 3% 3% - - - -
Google Map 3% - - - - -
Onboard information cards 2% 2% 3% 3% 2% 1%
Transit stores 2% 2% 1% 2% 1% 2%
CONNECT (onboard newsletter) 1% 2% 1% 6% 5% 8%
Other 4% 5% 6% 3% 3% 4%
LIGHT RAIL
TRENDS
* Statistically significant difference 2014 to 2012
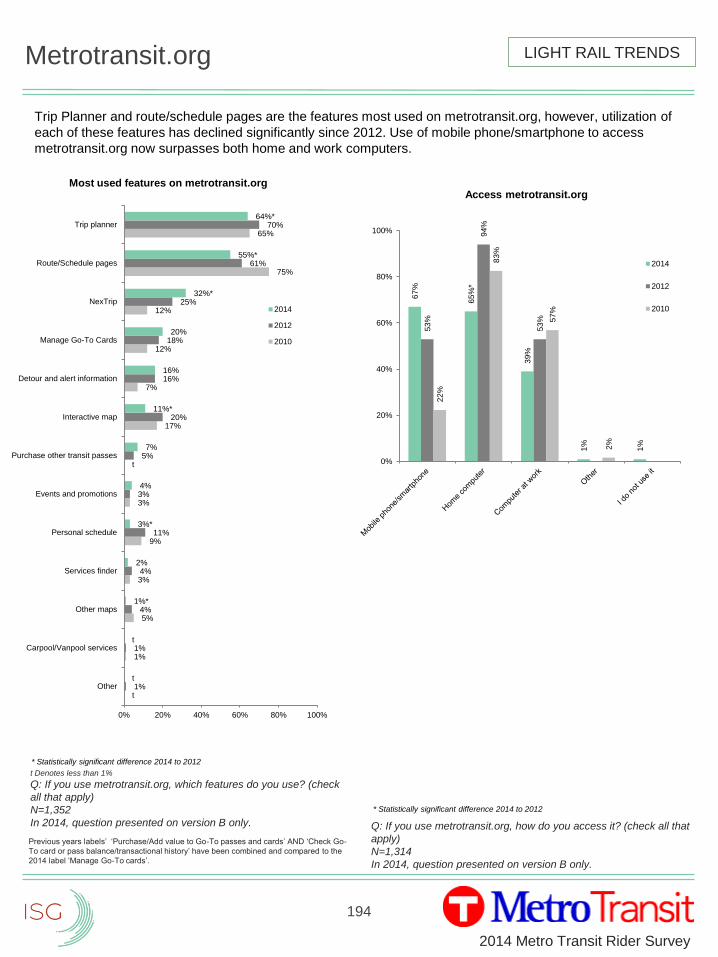
194
2014 Metro Transit Rider Survey
Metrotransit.org
Trip Planner and route/schedule pages are the features most used on metrotransit.org, however, utilization of
each of these features has declined significantly since 2012. Use of mobile phone/smartphone to access
metrotransit.org now surpasses both home and work computers.
Q: If you use metrotransit.org, how do you access it? (check all that
apply)
N=1,314
In 2014, question presented on version B only.
t Denotes less than 1%
Q: If you use metrotransit.org, which features do you use? (check
all that apply)
N=1,352
In 2014, question presented on version B only.
t
1%
5%
3%
9%
3%
t
17%
7%
12%
12%
75%
65%
1%
1%
4%
4%
11%
3%
5%
20%
16%
18%
25%
61%
70%
t
t
1%*
2%
3%*
4%
7%
11%*
16%
20%
32%*
55%*
64%*
0% 20% 40% 60% 80% 100%
Other
Carpool/Vanpool services
Other maps
Services finder
Personal schedule
Events and promotions
Purchase other transit passes
Interactive map
Detour and alert information
Manage Go-To Cards
NexTrip
Route/Schedule pages
Trip planner
Most used features on metrotransit.org
2014
2012
2010
67
%
65
%*
39
%
1%
1%
53
%
94
%
53
%
22
%
83
%
57
%
2%
0%
20%
40%
60%
80%
100%
Access metrotransit.org
2014
2012
2010
* Statistically significant difference 2014 to 2012
Previous years labels’ ‘Purchase/Add value to Go-To passes and cards’ AND ‘Check Go-
To card or pass balance/transactional history’ have been combined and compared to the
2014 label ‘Manage Go-To cards’.
* Statistically significant difference 2014 to 2012
LIGHT RAIL TRENDS
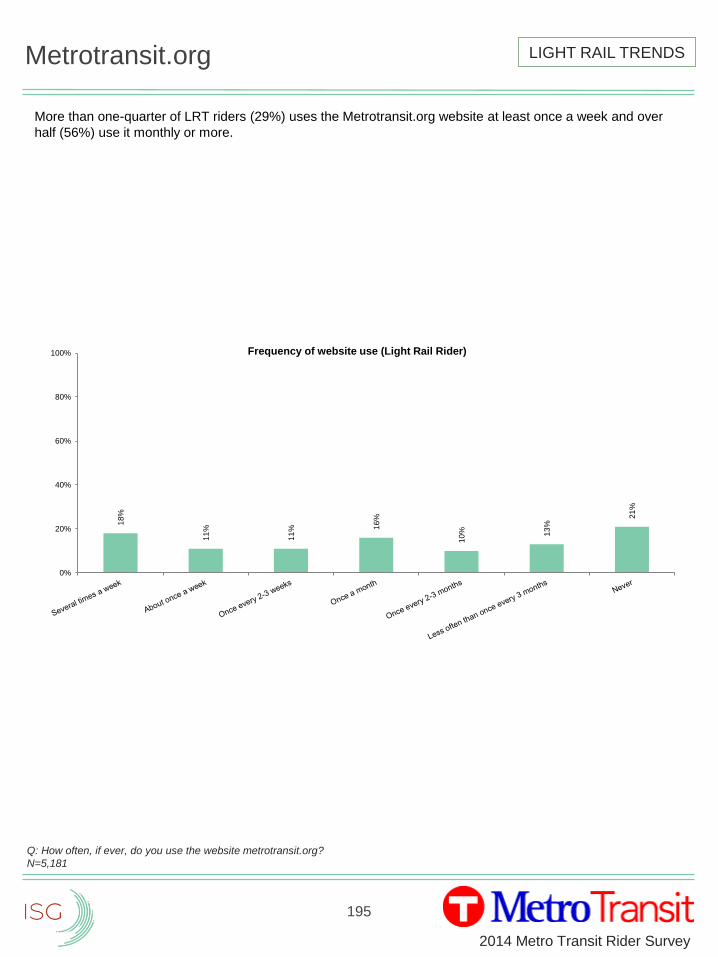
195
2014 Metro Transit Rider Survey
Metrotransit.org
More than one-quarter of LRT riders (29%) uses the Metrotransit.org website at least once a week and over
half (56%) use it monthly or more.
Q: How often, if ever, do you use the website metrotransit.org?
N=5,181
LIGHT RAIL TRENDS
18
%
11
%
11
% 16
%
10
% 13
%
21
%
0%
20%
40%
60%
80%
100% Frequency of website use (Light Rail Rider)
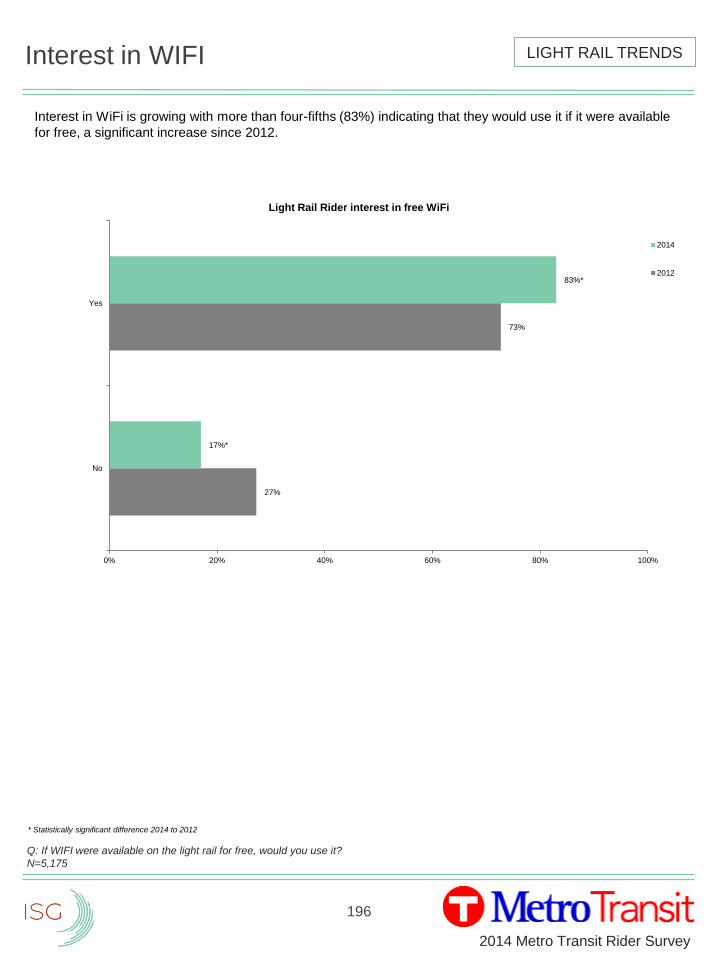
196
2014 Metro Transit Rider Survey
Interest in WIFI
Interest in WiFi is growing with more than four-fifths (83%) indicating that they would use it if it were available
for free, a significant increase since 2012.
Q: If WIFI were available on the light rail for free, would you use it?
N=5,175
27%
73%
17%*
83%*
0% 20% 40% 60% 80% 100%
No
Yes
Light Rail Rider interest in free WiFi
2014
2012
LIGHT RAIL TRENDS
* Statistically significant difference 2014 to 2012
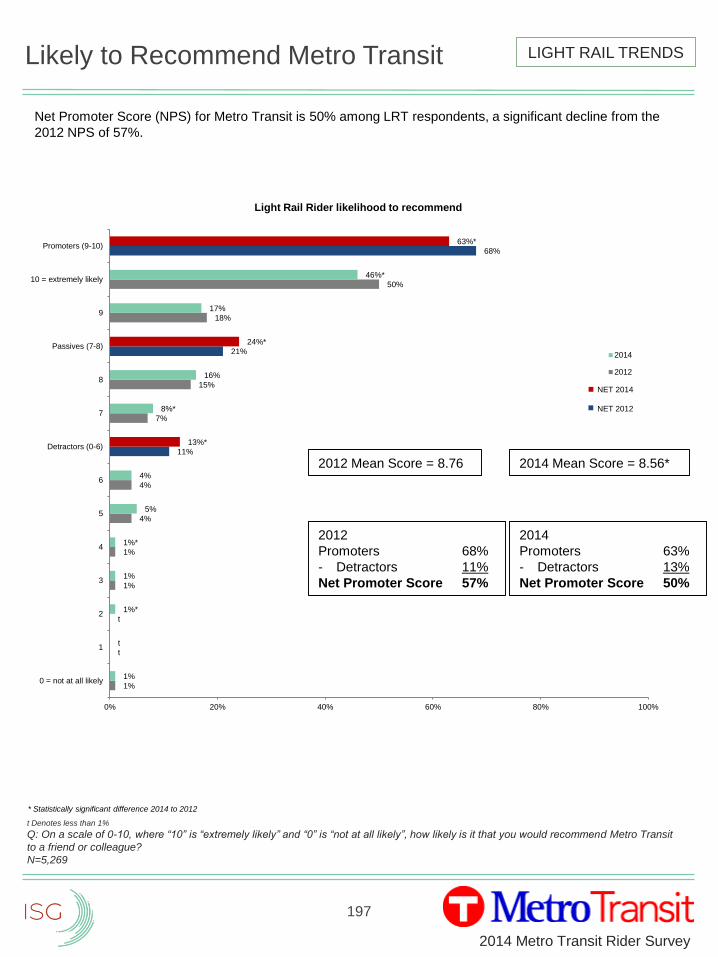
197
2014 Metro Transit Rider Survey
Likely to Recommend Metro Transit
Net Promoter Score (NPS) for Metro Transit is 50% among LRT respondents, a significant decline from the
2012 NPS of 57%.
1%
t
t
1%
1%
4%
4%
11%
7%
15%
21%
18%
50%
68%
1%
t
1%*
1%
1%*
5%
4%
13%*
8%*
16%
24%*
17%
46%*
63%*
0% 20% 40% 60% 80% 100%
0 = not at all likely
1
2
3
4
5
6
Detractors (0-6)
7
8
Passives (7-8)
9
10 = extremely likely
Promoters (9-10)
Light Rail Rider likelihood to recommend
2014
2012
t Denotes less than 1%
Q: On a scale of 0-10, where “10” is “extremely likely” and “0” is “not at all likely”, how likely is it that you would recommend Metro Transit
to a friend or colleague?
N=5,269
2012 Mean Score = 8.76
2012
Promoters 68%
- Detractors 11%
Net Promoter Score 57%
LIGHT RAIL TRENDS
2014 Mean Score = 8.56*
2014
Promoters 63%
- Detractors 13%
Net Promoter Score 50%
NET 2014
NET 2012
* Statistically significant difference 2014 to 2012
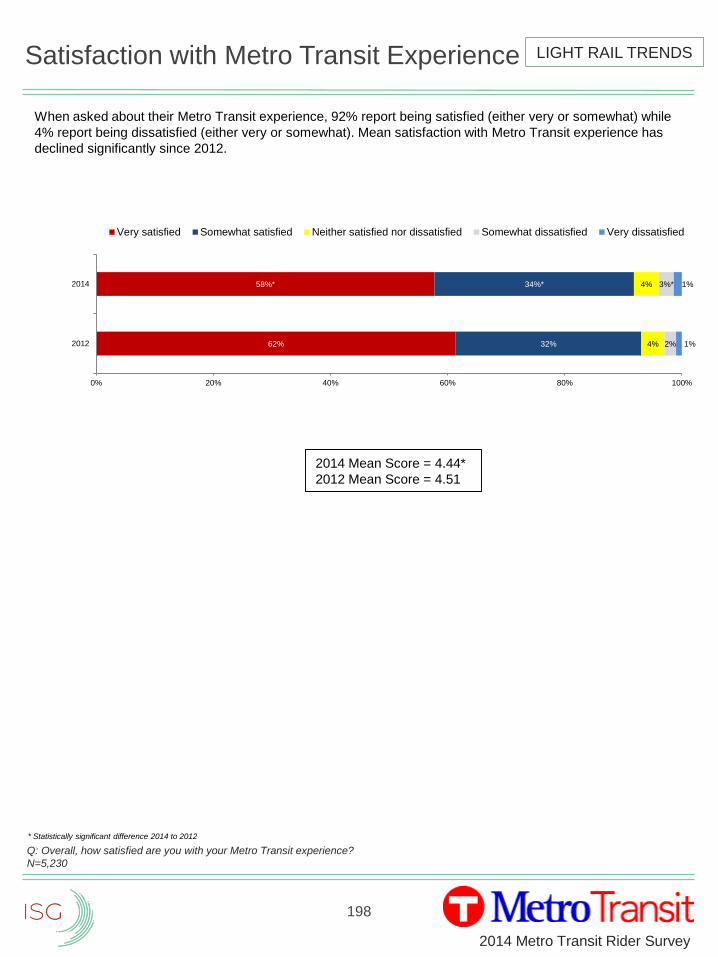
198
2014 Metro Transit Rider Survey
Satisfaction with Metro Transit Experience
When asked about their Metro Transit experience, 92% report being satisfied (either very or somewhat) while
4% report being dissatisfied (either very or somewhat). Mean satisfaction with Metro Transit experience has
declined significantly since 2012.
Q: Overall, how satisfied are you with your Metro Transit experience?
N=5,230
62%
58%*
32%
34%*
4%
4%
2%
3%*
1%
1%
0% 20% 40% 60% 80% 100%
2012
2014
Very satisfied Somewhat satisfied Neither satisfied nor dissatisfied Somewhat dissatisfied Very dissatisfied
2014 Mean Score = 4.44*
2012 Mean Score = 4.51
* Statistically significant difference 2014 to 2012
LIGHT RAIL TRENDS
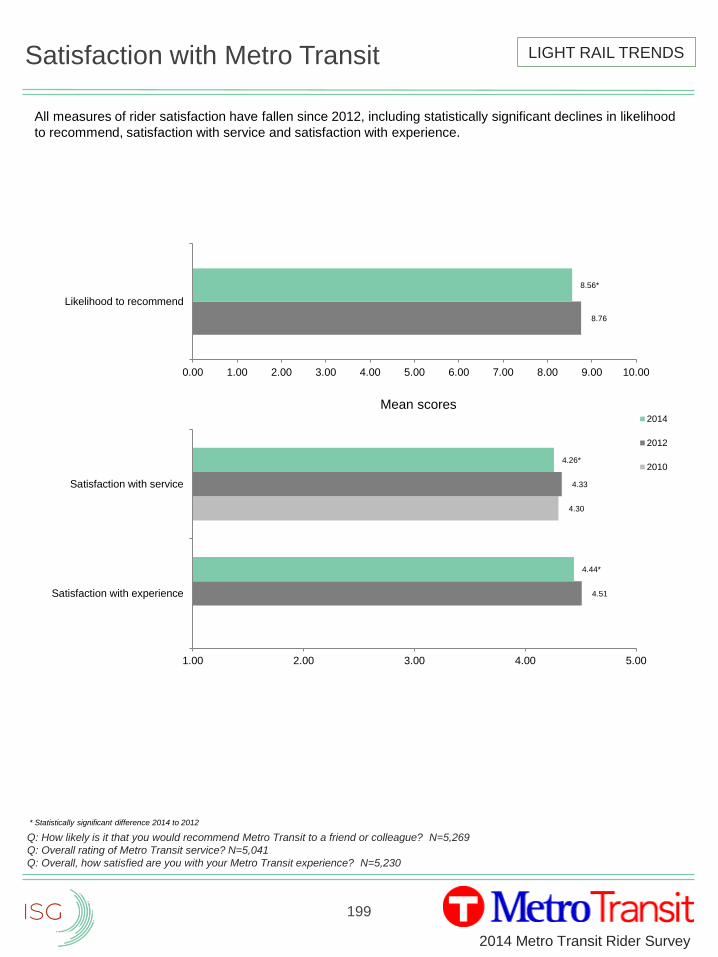
199
2014 Metro Transit Rider Survey
Satisfaction with Metro Transit
4.30
4.51
4.33
4.44*
4.26*
1.00 2.00 3.00 4.00 5.00
Satisfaction with experience
Satisfaction with service
2014
2012
2010
8.76
8.56*
0.00 1.00 2.00 3.00 4.00 5.00 6.00 7.00 8.00 9.00 10.00
Likelihood to recommend
Mean scores
All measures of rider satisfaction have fallen since 2012, including statistically significant declines in likelihood
to recommend, satisfaction with service and satisfaction with experience.
LIGHT RAIL TRENDS
Q: How likely is it that you would recommend Metro Transit to a friend or colleague? N=5,269
Q: Overall rating of Metro Transit service? N=5,041
Q: Overall, how satisfied are you with your Metro Transit experience? N=5,230
* Statistically significant difference 2014 to 2012
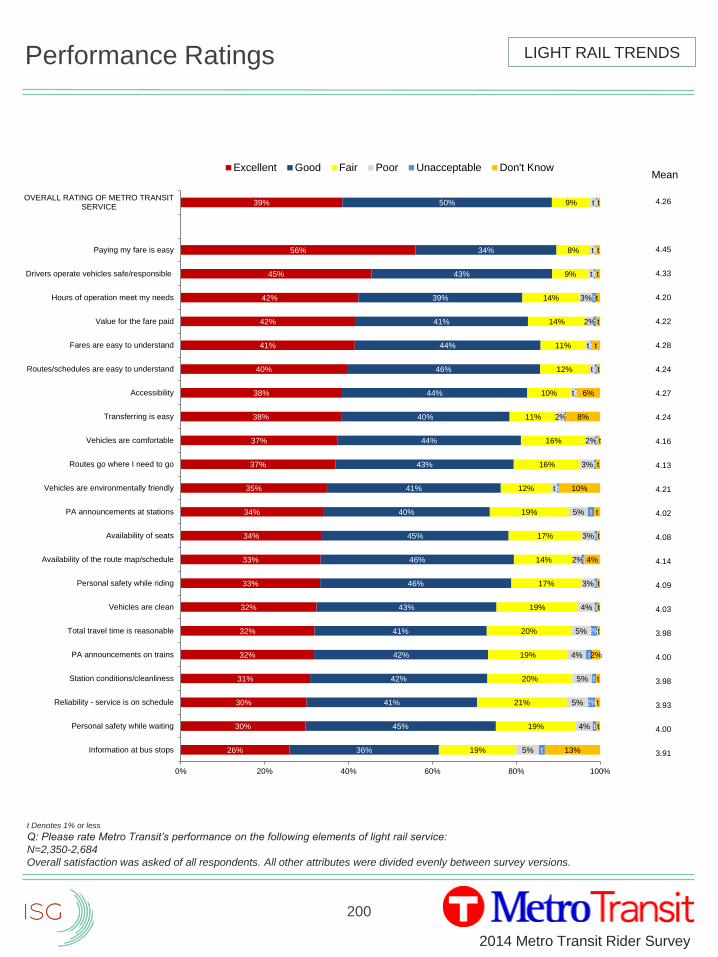
200
2014 Metro Transit Rider Survey
Mean
4.26
4.45
4.33
4.20
4.22
4.28
4.24
4.27
4.24
4.16
4.13
4.21
4.02
4.08
4.14
4.09
4.03
3.98
4.00
3.98
3.93
4.00
3.91
Performance Ratings
t Denotes 1% or less
Q: Please rate Metro Transit’s performance on the following elements of light rail service:
N=2,350-2,684
Overall satisfaction was asked of all respondents. All other attributes were divided evenly between survey versions.
26%
30%
30%
31%
32%
32%
32%
33%
33%
34%
34%
35%
37%
37%
38%
38%
40%
41%
42%
42%
45%
56%
39%
36%
45%
41%
42%
42%
41%
43%
46%
46%
45%
40%
41%
43%
44%
40%
44%
46%
44%
41%
39%
43%
34%
50%
19%
19%
21%
20%
19%
20%
19%
17%
14%
17%
19%
12%
16%
16%
11%
10%
12%
11%
14%
14%
9%
8%
9%
5%
4%
5%
5%
4%
5%
4%
3%
2%
3%
5%
t
3%
2%
2%
t
t
t
2%
3%
t
t
t
t
t
2%
t
t
2%
t
t
t
t
t
t
t
t
t
t
t
t
t
t
t
t
t
13%
t
t
t
2%
t
t
t
4%
t
t
10%
t
t
8%
6%
t
t
t
t
t
t
t
0% 20% 40% 60% 80% 100%
Information at bus stops
Personal safety while waiting
Reliability - service is on schedule
Station conditions/cleanliness
PA announcements on trains
Total travel time is reasonable
Vehicles are clean
Personal safety while riding
Availability of the route map/schedule
Availability of seats
PA announcements at stations
Vehicles are environmentally friendly
Routes go where I need to go
Vehicles are comfortable
Transferring is easy
Accessibility
Routes/schedules are easy to understand
Fares are easy to understand
Value for the fare paid
Hours of operation meet my needs
Drivers operate vehicles safe/responsible
Paying my fare is easy
OVERALL RATING OF METRO TRANSITSERVICE
Excellent Good Fair Poor Unacceptable Don't Know
LIGHT RAIL TRENDS
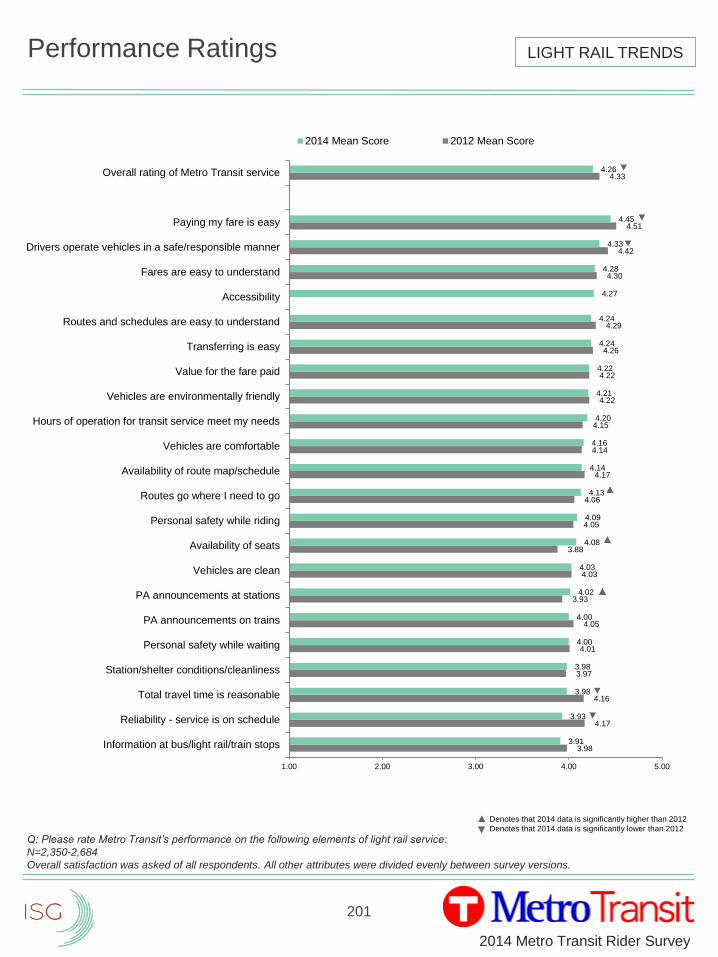
201
2014 Metro Transit Rider Survey
Performance Ratings
3.98
4.17
4.16
3.97
4.01
4.05
3.93
4.03
3.88
4.05
4.06
4.17
4.14
4.15
4.22
4.22
4.26
4.29
4.30
4.42
4.51
4.33
3.91
3.93
3.98
3.98
4.00
4.00
4.02
4.03
4.08
4.09
4.13
4.14
4.16
4.20
4.21
4.22
4.24
4.24
4.27
4.28
4.33
4.45
4.26
1.00 2.00 3.00 4.00 5.00
Information at bus/light rail/train stops
Reliability - service is on schedule
Total travel time is reasonable
Station/shelter conditions/cleanliness
Personal safety while waiting
PA announcements on trains
PA announcements at stations
Vehicles are clean
Availability of seats
Personal safety while riding
Routes go where I need to go
Availability of route map/schedule
Vehicles are comfortable
Hours of operation for transit service meet my needs
Vehicles are environmentally friendly
Value for the fare paid
Transferring is easy
Routes and schedules are easy to understand
Accessibility
Fares are easy to understand
Drivers operate vehicles in a safe/responsible manner
Paying my fare is easy
Overall rating of Metro Transit service
2014 Mean Score 2012 Mean Score
LIGHT RAIL TRENDS
Q: Please rate Metro Transit’s performance on the following elements of light rail service:
N=2,350-2,684
Overall satisfaction was asked of all respondents. All other attributes were divided evenly between survey versions.
Denotes that 2014 data is significantly higher than 2012
Denotes that 2014 data is significantly lower than 2012
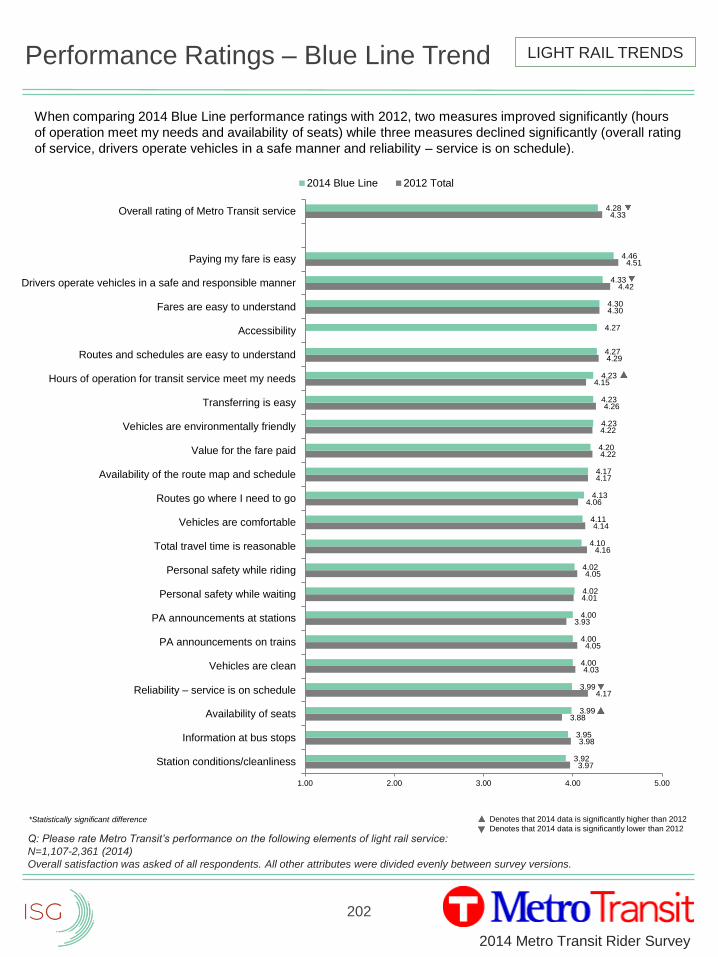
202
2014 Metro Transit Rider Survey
3.97
3.98
3.88
4.17
4.03
4.05
3.93
4.01
4.05
4.16
4.14
4.06
4.17
4.22
4.22
4.26
4.15
4.29
4.30
4.42
4.51
4.33
3.92
3.95
3.99
3.99
4.00
4.00
4.00
4.02
4.02
4.10
4.11
4.13
4.17
4.20
4.23
4.23
4.23
4.27
4.27
4.30
4.33
4.46
4.28
1.00 2.00 3.00 4.00 5.00
Station conditions/cleanliness
Information at bus stops
Availability of seats
Reliability – service is on schedule
Vehicles are clean
PA announcements on trains
PA announcements at stations
Personal safety while waiting
Personal safety while riding
Total travel time is reasonable
Vehicles are comfortable
Routes go where I need to go
Availability of the route map and schedule
Value for the fare paid
Vehicles are environmentally friendly
Transferring is easy
Hours of operation for transit service meet my needs
Routes and schedules are easy to understand
Accessibility
Fares are easy to understand
Drivers operate vehicles in a safe and responsible manner
Paying my fare is easy
Overall rating of Metro Transit service
2014 Blue Line 2012 Total
Performance Ratings – Blue Line Trend
Q: Please rate Metro Transit’s performance on the following elements of light rail service:
N=1,107-2,361 (2014)
Overall satisfaction was asked of all respondents. All other attributes were divided evenly between survey versions.
*Statistically significant difference
LIGHT RAIL TRENDS
Denotes that 2014 data is significantly higher than 2012
Denotes that 2014 data is significantly lower than 2012
When comparing 2014 Blue Line performance ratings with 2012, two measures improved significantly (hours
of operation meet my needs and availability of seats) while three measures declined significantly (overall rating
of service, drivers operate vehicles in a safe manner and reliability – service is on schedule).
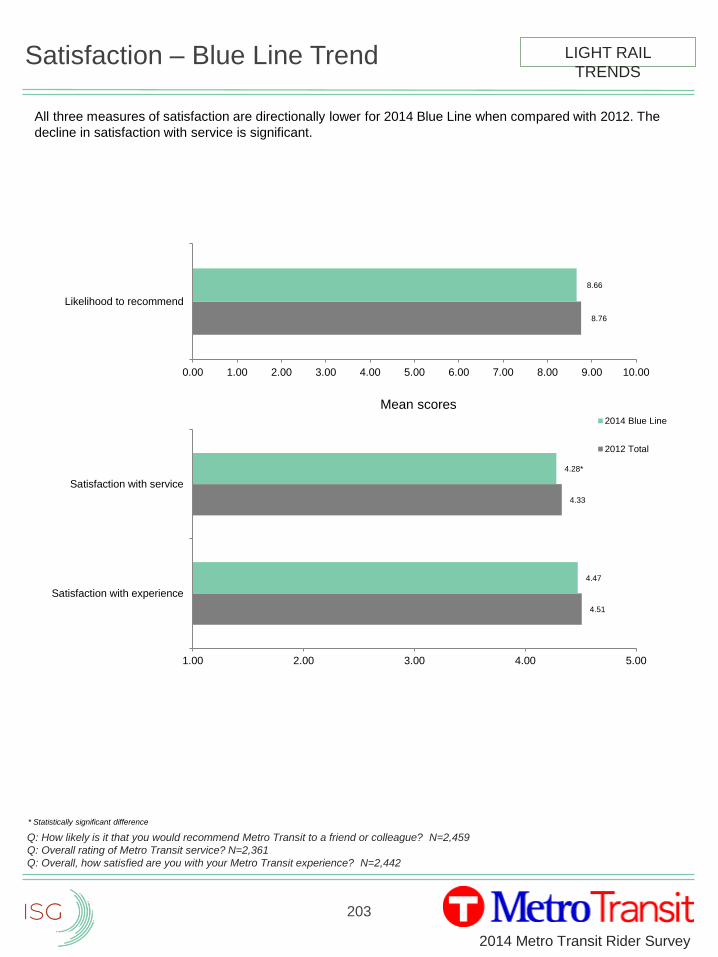
203
2014 Metro Transit Rider Survey
Satisfaction – Blue Line Trend
4.51
4.33
4.47
4.28*
1.00 2.00 3.00 4.00 5.00
Satisfaction with experience
Satisfaction with service
2014 Blue Line
2012 Total
8.76
8.66
0.00 1.00 2.00 3.00 4.00 5.00 6.00 7.00 8.00 9.00 10.00
Likelihood to recommend
Mean scores
All three measures of satisfaction are directionally lower for 2014 Blue Line when compared with 2012. The
decline in satisfaction with service is significant.
Q: How likely is it that you would recommend Metro Transit to a friend or colleague? N=2,459
Q: Overall rating of Metro Transit service? N=2,361
Q: Overall, how satisfied are you with your Metro Transit experience? N=2,442
* Statistically significant difference
LIGHT RAIL
TRENDS
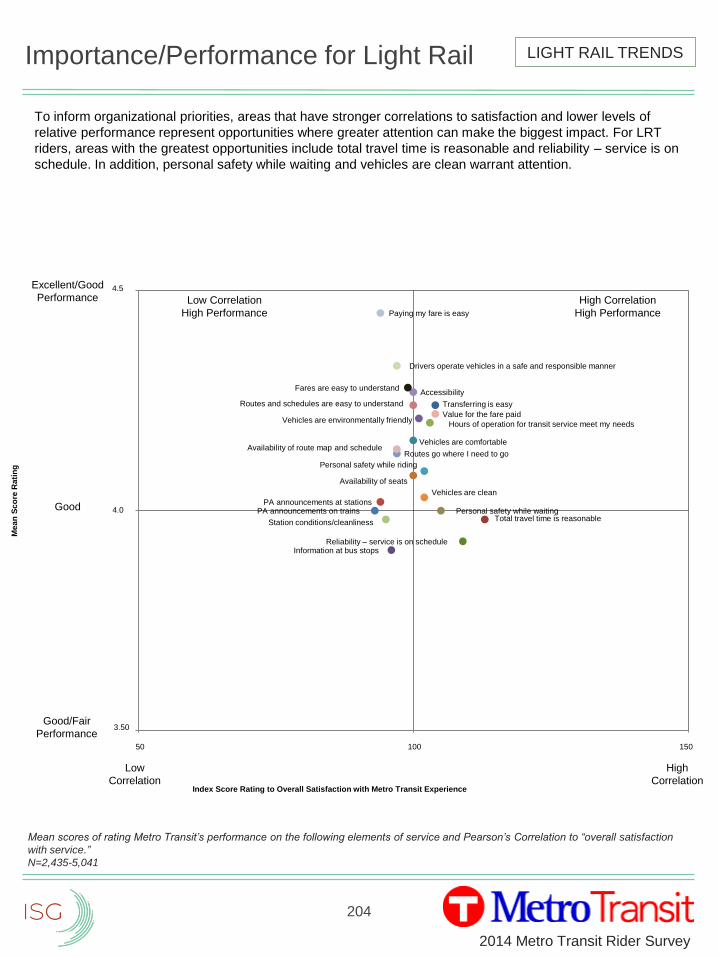
204
2014 Metro Transit Rider Survey
Importance/Performance for Light Rail
To inform organizational priorities, areas that have stronger correlations to satisfaction and lower levels of
relative performance represent opportunities where greater attention can make the biggest impact. For LRT
riders, areas with the greatest opportunities include total travel time is reasonable and reliability – service is on
schedule. In addition, personal safety while waiting and vehicles are clean warrant attention.
Mean scores of rating Metro Transit’s performance on the following elements of service and Pearson’s Correlation to “overall satisfaction
with service.”
N=2,435-5,041
LIGHT RAIL TRENDS
Total travel time is reasonable
Reliability – service is on schedule
Value for the fare paid
Information at bus stops
Vehicles are comfortable
Availability of seats
PA announcements on trainsPA announcements at stations
Vehicles are environmentally friendly
Personal safety while riding
Vehicles are clean
Transferring is easy
Routes go where I need to go
Station conditions/cleanliness
AccessibilityFares are easy to understand
Personal safety while waiting
Paying my fare is easy
Me
an
Sc
ore
Rati
ng
Index Score Rating to Overall Satisfaction with Metro Transit Experience
Excellent/Good
Performance
Good
Good/Fair
Performance
High
Correlation
Low
Correlation
4.5
3.50
4.0
Low Correlation
High Performance
High Correlation
High Performance
50 100 150
Drivers operate vehicles in a safe and responsible manner
Routes and schedules are easy to understand
Hours of operation for transit service meet my needs
Availability of route map and schedule

205
2014 Metro Transit Rider Survey
Importance/Performance for Light Rail
Mean scores of rating Metro Transit’s performance on the following elements of service and Pearson’s Correlation to “Overall Satisfaction
with Service.” “Don’t know” responses were not included.
N=2,435-5,041
LIGHT RAIL TRENDS
ElementsImportance
Index
Performance
Mean
Total travel time is reasonable 113 3.98
Reliability – service is on schedule 109 3.93
Personal safety while waiting 105 4.00
Transferring is easy 104 4.24
Value for the fare paid 104 4.22
Hours of operation for transit service meet my needs 103 4.20
Personal safety while riding 102 4.09
Vehicles are clean 102 4.03
Vehicles are environmentally friendly 101 4.21
Accessibility 100 4.27
Routes and schedules are easy to understand 100 4.24
Vehicles are comfortable 100 4.16
Availability of seats 100 4.08
Fares are easy to understand 99 4.28
Drivers operate vehicles in a safe and responsible manner 97 4.33
Availability of the route map and schedule 97 4.14
Routes go where I need to go 97 4.13
Information at bus stops 96 3.91
Station conditions/cleanliness 95 3.98
Paying my fare is easy 94 4.45
PA announcements at stations 94 4.02
PA announcements on trains 93 4.00

206
2014 Metro Transit Rider Survey
Index/Performance Shift
Q: Please rate Metro Transit’s performance on the following elements of experience
N=2,435-5,041
Excellent/ Good Performance
Low Importance
Elements2014 Mean
Score
2012 Mean
Score2012 Location
Paying my fare is easy 4.45 4.51 same
Drivers operate vehicles in a
safe and responsible manner4.33 4.42 E/G & High
Fares are easy to
understand4.28 4.30 E/G & High
Availability of the route map
and schedule4.14 4.17 E/G & High
Routes go where I need to
go4.13 4.06 same
PA announcements at
stations4.02 3.93 G/F & Low
PA announcements on trains 4.00 4.05 same
LIGHT RAIL TRENDS
Good/ Fair Performance
High Importance
Elements2014 Mean
Score
2012 Mean
Score
2012
Location
Total travel time is
reasonable3.98 4.16
E/G &
High
Reliability – service is
on schedule3.93 4.17
E/G &
High
Excellent/Good Performance
High Importance
Elements2014 Mean
Score
2012 Mean
Score
2012
Location
Accessibility 4.27 NA NA
Transferring is easy 4.24 4.26E/G &
Low
Routes and schedules
are easy to understand4.24 4.29 same
Value for the fare paid 4.22 4.22E/G &
Low
Vehicles are
environmentally friendly4.21 4.22 same
Hours of operation for
transit service meet my
needs
4.20 4.15 same
Vehicles are comfortable 4.16 4.14 same
Personal safety while
riding4.09 4.05 same
Availability of seats 4.08 3.88G/F &
Low
Vehicles are clean 4.03 4.03 same
Personal safety while
waiting4.00 4.01 same
Good/ Fair Performance
Low Importance
Elements2014 Mean
Score
2012 Mean
Score
2012
Location
Station
conditions/cleanliness3.98 3.97 same
Information at bus stops 3.91 3.98 same
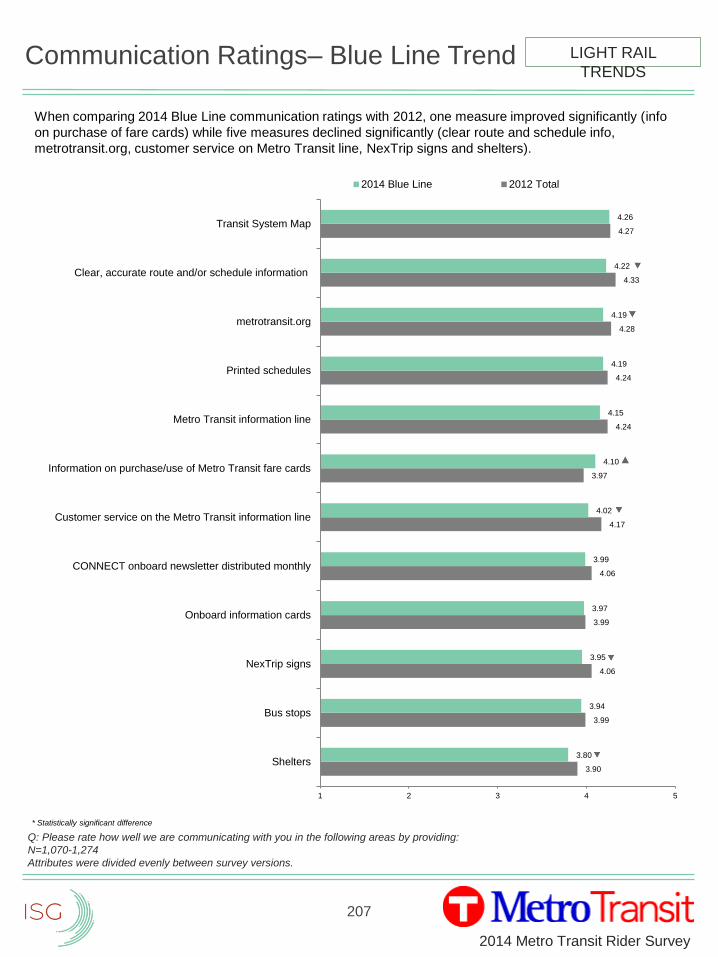
207
2014 Metro Transit Rider Survey
Communication Ratings– Blue Line Trend
Q: Please rate how well we are communicating with you in the following areas by providing:
N=1,070-1,274
Attributes were divided evenly between survey versions.
3.90
3.99
4.06
3.99
4.06
4.17
3.97
4.24
4.24
4.28
4.33
4.27
3.80
3.94
3.95
3.97
3.99
4.02
4.10
4.15
4.19
4.19
4.22
4.26
1 2 3 4 5
Shelters
Bus stops
NexTrip signs
Onboard information cards
CONNECT onboard newsletter distributed monthly
Customer service on the Metro Transit information line
Information on purchase/use of Metro Transit fare cards
Metro Transit information line
Printed schedules
metrotransit.org
Clear, accurate route and/or schedule information
Transit System Map
2014 Blue Line 2012 Total
* Statistically significant difference
LIGHT RAIL
TRENDS
When comparing 2014 Blue Line communication ratings with 2012, one measure improved significantly (info
on purchase of fare cards) while five measures declined significantly (clear route and schedule info,
metrotransit.org, customer service on Metro Transit line, NexTrip signs and shelters).
208
2014 Metro Transit Rider Survey
Mean
4.16
4.22
4.18
4.16
4.06
4.17
3.89
3.94
3.81
3.95
4.07
4.00
Communication Ratings
t Denotes 1% or less
Q: Please rate how well we are communicating with you in the following areas by providing:
N=2,435-5,041
Attributes were divided evenly between survey versions.
t
t
15%
19%
21%
22%
22%
23%
23%
28%
32%
34%
35%
37%
19%
21%
32%
39%
30%
35%
23%
36%
39%
41%
43%
44%
10%
9%
16%
22%
16%
19%
9%
14%
12%
11%
11%
14%
2%
2%
3%
6%
4%
5%
2%
3%
2%
2%
2%
3%
t
t
t
t
t
t
t
t
t
t
t
t
54%
49%
28%
10%
27%
17%
43%
18%
15%
11%
8%
2%
0% 20% 40% 60% 80% 100%
CONNECT onboard newsletter distributedmonthly on buses
Customer service on the Metro TransitInformation Line (612-373-3333)
Onboard information cards
Shelters
NexTrip signs
Bus stops
Metro Transit information line (612-373-3333)
Information about how to purchase or useMetro Transit fare cards (e.g. Go-To Cards)
Printed schedules
metrotransit.org
Transit System Map
Clear, accurate route and/or scheduleinformation
Excellent Good Fair Poor Unacceptable Don't Know
LIGHT RAIL TRENDS
209
2014 Metro Transit Rider Survey
Communication Ratings
Q: Please rate how well we are communicating with you in the following areas by providing:
N=2,435-5,041
Attributes were divided evenly between survey versions.
4.10
4.20
4.22
4.26
4.31
4.29
4.34
4.29
4.33
3.90
3.99
4.06
3.99
4.06
3.97
4.17
4.24
4.33
4.24
4.28
4.27
3.81
3.89
3.94
3.95
4.00
4.06
4.07
4.16
4.16
4.17
4.18
4.22
1.00 2.00 3.00 4.00 5.00
Shelters
Bus stops
NexTrip signs
Onboard information cards
CONNECT onboard newsletter distributed monthly
Information on purchase/use of Metro Transit fare cards
Customer service on the Metro Transit information line
Printed schedules
Clear, accurate route and/or schedule information
Metro Transit information line
metrotransit.org
Transit System Map
2014 Mean Score 2012 Mean Score 2010 Mean Score
LIGHT RAIL TRENDS
Denotes that 2014 data is significantly higher than 2012
Denotes that 2014 data is significantly lower than 2012
210
2014 Metro Transit Rider Survey
Communication Ratings
t Denotes less than 1%
Q: Please rate how well we are communicating with you in the following areas by providing clear, accurate route and/or schedule information
N=2,500
In 2014, question presented on version A only.
4%
t
1%
9%
44%
43%
2%
t
3%*
14%*
44%
37%*
0% 20% 40% 60% 80% 100%
Don't use
Unacceptable
Poor
Fair
Good
Excellent
LIGHT RAIL RIDER RATING: CLEAR, ACCURATE ROUTE AND/OR SCHEDULE INFORMATION
2014
2012
LIGHT RAIL TRENDS
2014 Mean Score = 4.16*
2012 Mean Score = 4.33
* Statistically significant difference 2014 to 2012
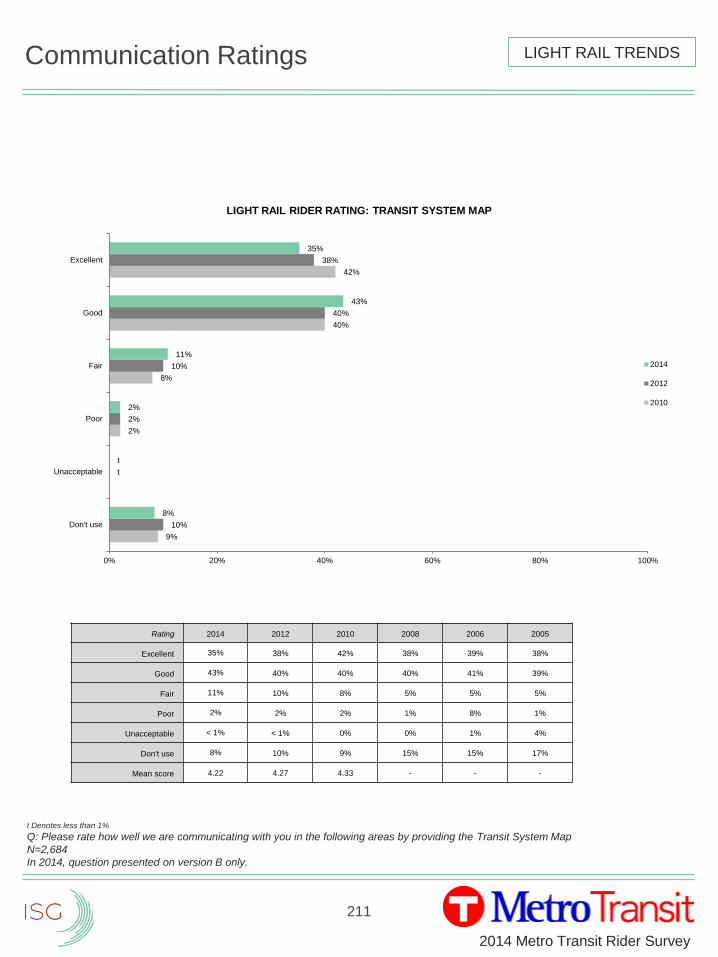
211
2014 Metro Transit Rider Survey
Communication Ratings
t Denotes less than 1%
Q: Please rate how well we are communicating with you in the following areas by providing the Transit System Map
N=2,684
In 2014, question presented on version B only.
9%
2%
8%
40%
42%
10%
t
2%
10%
40%
38%
8%
t
2%
11%
43%
35%
0% 20% 40% 60% 80% 100%
Don't use
Unacceptable
Poor
Fair
Good
Excellent
LIGHT RAIL RIDER RATING: TRANSIT SYSTEM MAP
2014
2012
2010
Rating 2014 2012 2010 2008 2006 2005
Excellent 35% 38% 42% 38% 39% 38%
Good 43% 40% 40% 40% 41% 39%
Fair 11% 10% 8% 5% 5% 5%
Poor 2% 2% 2% 1% 8% 1%
Unacceptable < 1% < 1% 0% 0% 1% 4%
Don't use 8% 10% 9% 15% 15% 17%
Mean score 4.22 4.27 4.33 - - -
LIGHT RAIL TRENDS
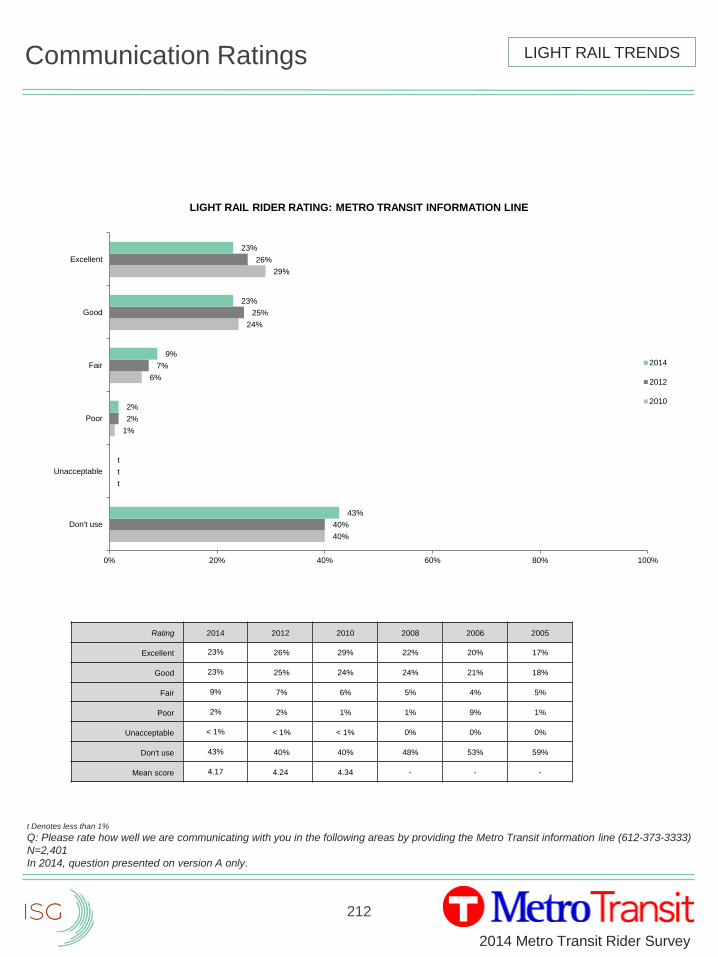
212
2014 Metro Transit Rider Survey
Communication Ratings
t Denotes less than 1%
Q: Please rate how well we are communicating with you in the following areas by providing the Metro Transit information line (612-373-3333)
N=2,401
In 2014, question presented on version A only.
40%
t
1%
6%
24%
29%
40%
t
2%
7%
25%
26%
43%
t
2%
9%
23%
23%
0% 20% 40% 60% 80% 100%
Don't use
Unacceptable
Poor
Fair
Good
Excellent
LIGHT RAIL RIDER RATING: METRO TRANSIT INFORMATION LINE
2014
2012
2010
Rating 2014 2012 2010 2008 2006 2005
Excellent 23% 26% 29% 22% 20% 17%
Good 23% 25% 24% 24% 21% 18%
Fair 9% 7% 6% 5% 4% 5%
Poor 2% 2% 1% 1% 9% 1%
Unacceptable < 1% < 1% < 1% 0% 0% 0%
Don't use 43% 40% 40% 48% 53% 59%
Mean score 4.17 4.24 4.34 - - -
LIGHT RAIL TRENDS
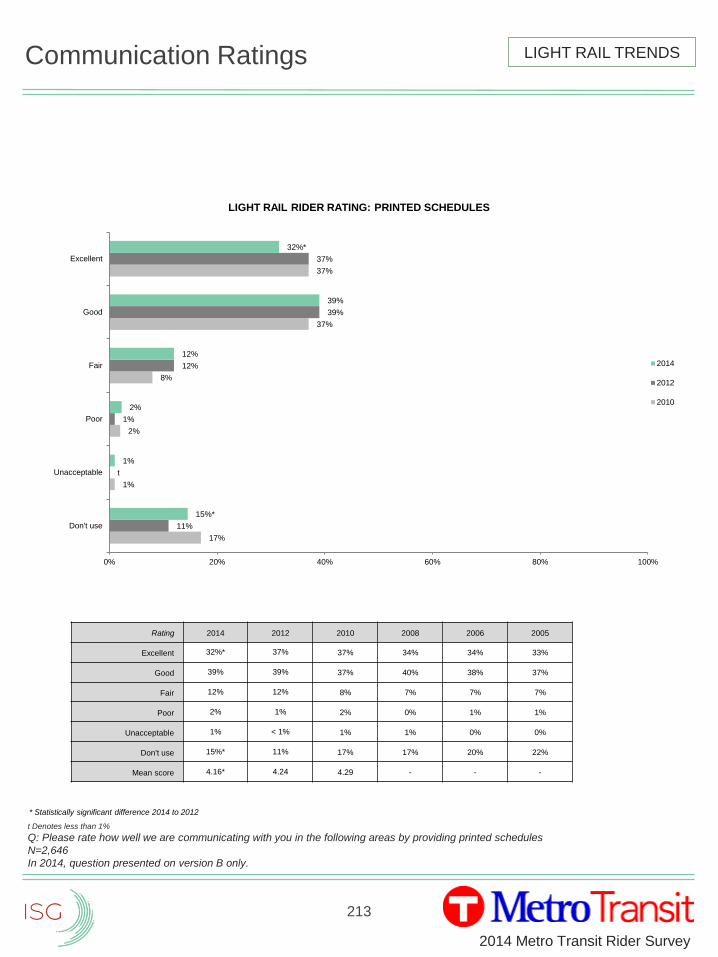
213
2014 Metro Transit Rider Survey
Communication Ratings
t Denotes less than 1%
Q: Please rate how well we are communicating with you in the following areas by providing printed schedules
N=2,646
In 2014, question presented on version B only.
17%
1%
2%
8%
37%
37%
11%
t
1%
12%
39%
37%
15%*
1%
2%
12%
39%
32%*
0% 20% 40% 60% 80% 100%
Don't use
Unacceptable
Poor
Fair
Good
Excellent
LIGHT RAIL RIDER RATING: PRINTED SCHEDULES
2014
2012
2010
Rating 2014 2012 2010 2008 2006 2005
Excellent 32%* 37% 37% 34% 34% 33%
Good 39% 39% 37% 40% 38% 37%
Fair 12% 12% 8% 7% 7% 7%
Poor 2% 1% 2% 0% 1% 1%
Unacceptable 1% < 1% 1% 1% 0% 0%
Don't use 15%* 11% 17% 17% 20% 22%
Mean score 4.16* 4.24 4.29 - - -
* Statistically significant difference 2014 to 2012
LIGHT RAIL TRENDS

214
2014 Metro Transit Rider Survey
Communication Ratings
Q: Please rate how well we are communicating with you in the following areas by providing shelters
N=2,407
In 2014, question presented on version A only.
7%
1%
3%
15%
40%
34%
9%
1%
6%
20%
39%
25%
10%
2%
6%
22%
39%
22%
0% 20% 40% 60% 80% 100%
Don't use
Unacceptable
Poor
Fair
Good
Excellent
LIGHT RAIL RIDER RATING: SHELTERS
2014
2012
2010
Rating 2014 2012 2010 2008 2006 2005
Excellent 22% 25% 34% 33% 26% 28%
Good 39% 39% 40% 43% 39% 37%
Fair 22% 20% 15% 14% 13% 13%
Poor 6% 6% 3% 4% 5% 4%
Unacceptable 2% 1% 1% 1% 1% 1%
Don’t use 10% 9% 7% 7% 16% 17%
Mean score 3.81* 3.90 4.10 - - -
LIGHT RAIL TRENDS
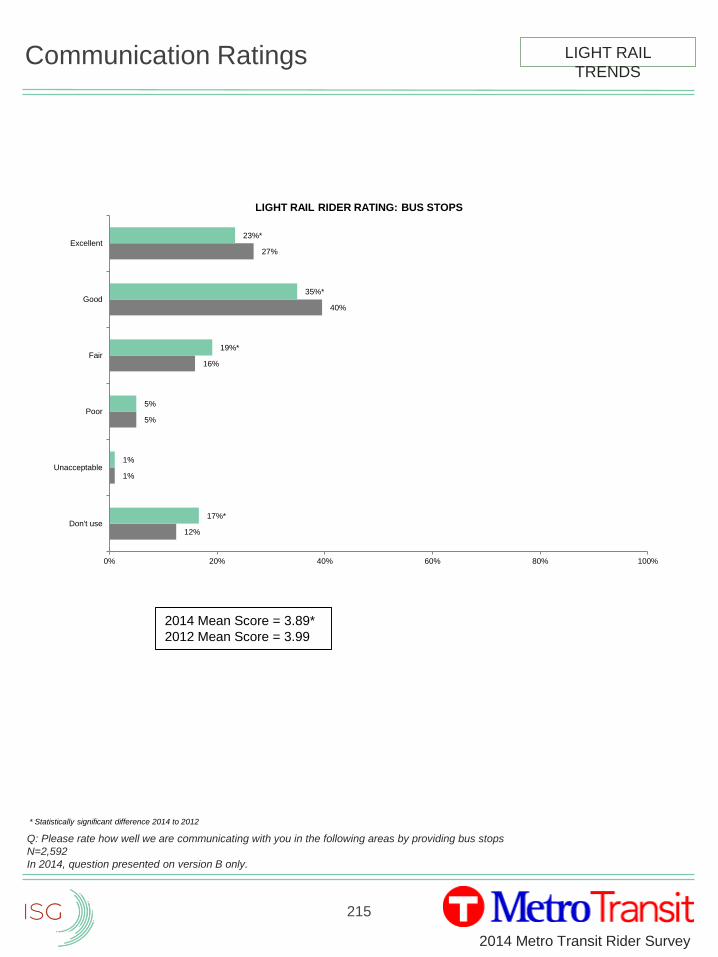
215
2014 Metro Transit Rider Survey
Communication Ratings
Q: Please rate how well we are communicating with you in the following areas by providing bus stops
N=2,592
In 2014, question presented on version B only.
12%
1%
5%
16%
40%
27%
17%*
1%
5%
19%*
35%*
23%*
0% 20% 40% 60% 80% 100%
Don't use
Unacceptable
Poor
Fair
Good
Excellent
LIGHT RAIL RIDER RATING: BUS STOPS
LIGHT RAIL
TRENDS
2014 Mean Score = 3.89*
2012 Mean Score = 3.99
* Statistically significant difference 2014 to 2012
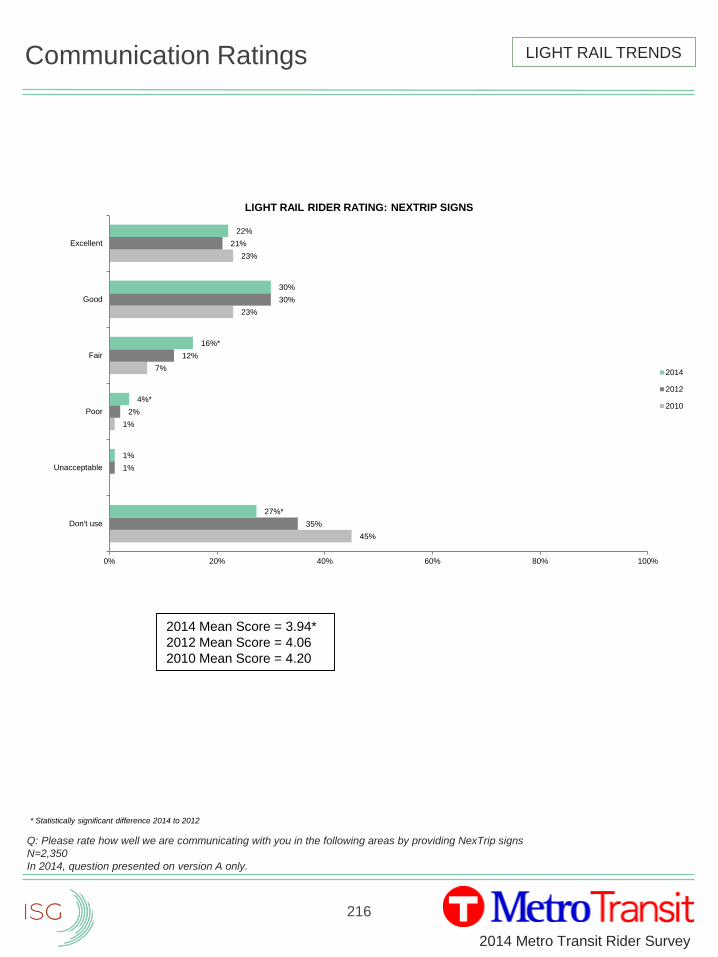
216
2014 Metro Transit Rider Survey
Communication Ratings
Q: Please rate how well we are communicating with you in the following areas by providing NexTrip signs
N=2,350
In 2014, question presented on version A only.
45%
1%
7%
23%
23%
35%
1%
2%
12%
30%
21%
27%*
1%
4%*
16%*
30%
22%
0% 20% 40% 60% 80% 100%
Don't use
Unacceptable
Poor
Fair
Good
Excellent
LIGHT RAIL RIDER RATING: NEXTRIP SIGNS
2014
2012
2010
LIGHT RAIL TRENDS
* Statistically significant difference 2014 to 2012
2014 Mean Score = 3.94*
2012 Mean Score = 4.06
2010 Mean Score = 4.20
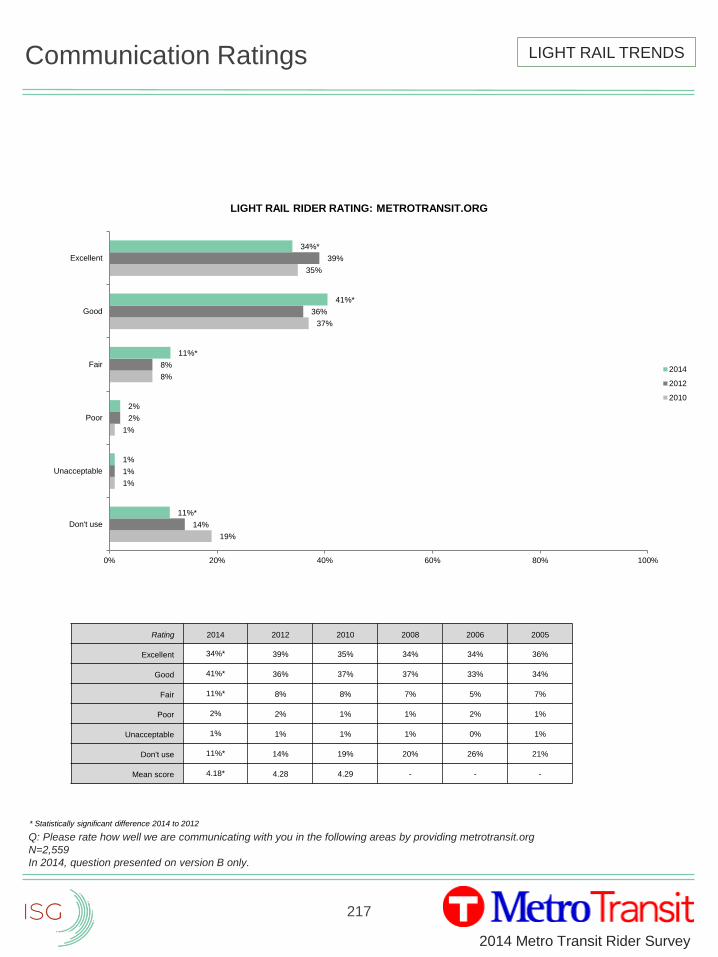
217
2014 Metro Transit Rider Survey
Communication Ratings
Q: Please rate how well we are communicating with you in the following areas by providing metrotransit.org
N=2,559
In 2014, question presented on version B only.
19%
1%
1%
8%
37%
35%
14%
1%
2%
8%
36%
39%
11%*
1%
2%
11%*
41%*
34%*
0% 20% 40% 60% 80% 100%
Don't use
Unacceptable
Poor
Fair
Good
Excellent
LIGHT RAIL RIDER RATING: METROTRANSIT.ORG
2014
2012
2010
Rating 2014 2012 2010 2008 2006 2005
Excellent 34%* 39% 35% 34% 34% 36%
Good 41%* 36% 37% 37% 33% 34%
Fair 11%* 8% 8% 7% 5% 7%
Poor 2% 2% 1% 1% 2% 1%
Unacceptable 1% 1% 1% 1% 0% 1%
Don't use 11%* 14% 19% 20% 26% 21%
Mean score 4.18* 4.28 4.29 - - -
LIGHT RAIL TRENDS
* Statistically significant difference 2014 to 2012
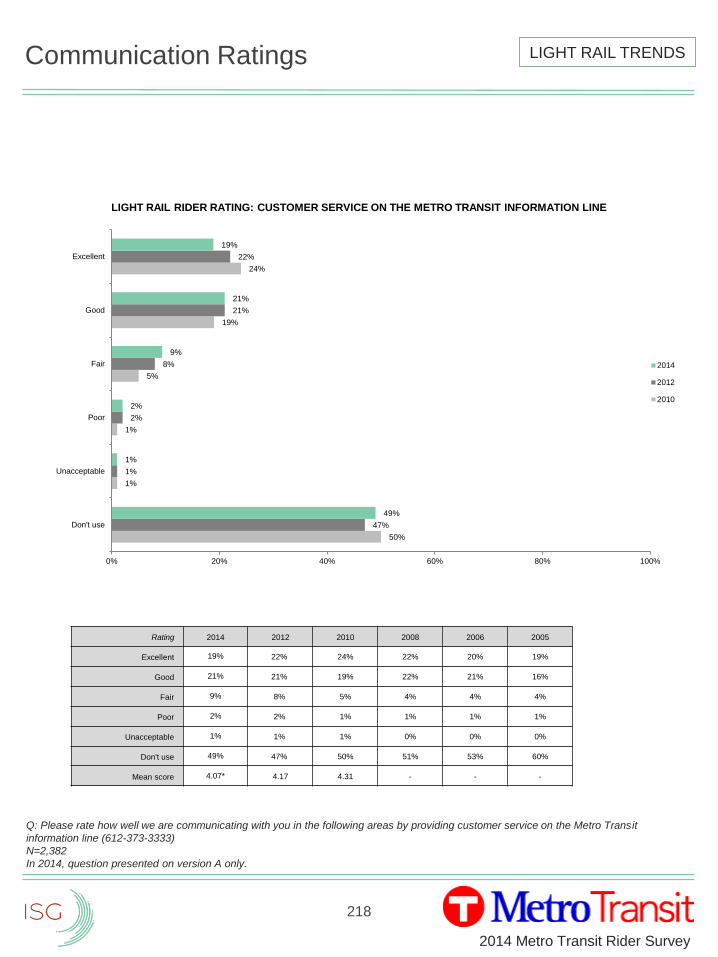
218
2014 Metro Transit Rider Survey
Communication Ratings
Q: Please rate how well we are communicating with you in the following areas by providing customer service on the Metro Transit
information line (612-373-3333)
N=2,382
In 2014, question presented on version A only.
50%
1%
1%
5%
19%
24%
47%
1%
2%
8%
21%
22%
49%
1%
2%
9%
21%
19%
0% 20% 40% 60% 80% 100%
Don't use
Unacceptable
Poor
Fair
Good
Excellent
LIGHT RAIL RIDER RATING: CUSTOMER SERVICE ON THE METRO TRANSIT INFORMATION LINE
2014
2012
2010
Rating 2014 2012 2010 2008 2006 2005
Excellent 19% 22% 24% 22% 20% 19%
Good 21% 21% 19% 22% 21% 16%
Fair 9% 8% 5% 4% 4% 4%
Poor 2% 2% 1% 1% 1% 1%
Unacceptable 1% 1% 1% 0% 0% 0%
Don't use 49% 47% 50% 51% 53% 60%
Mean score 4.07* 4.17 4.31 - - -
LIGHT RAIL TRENDS
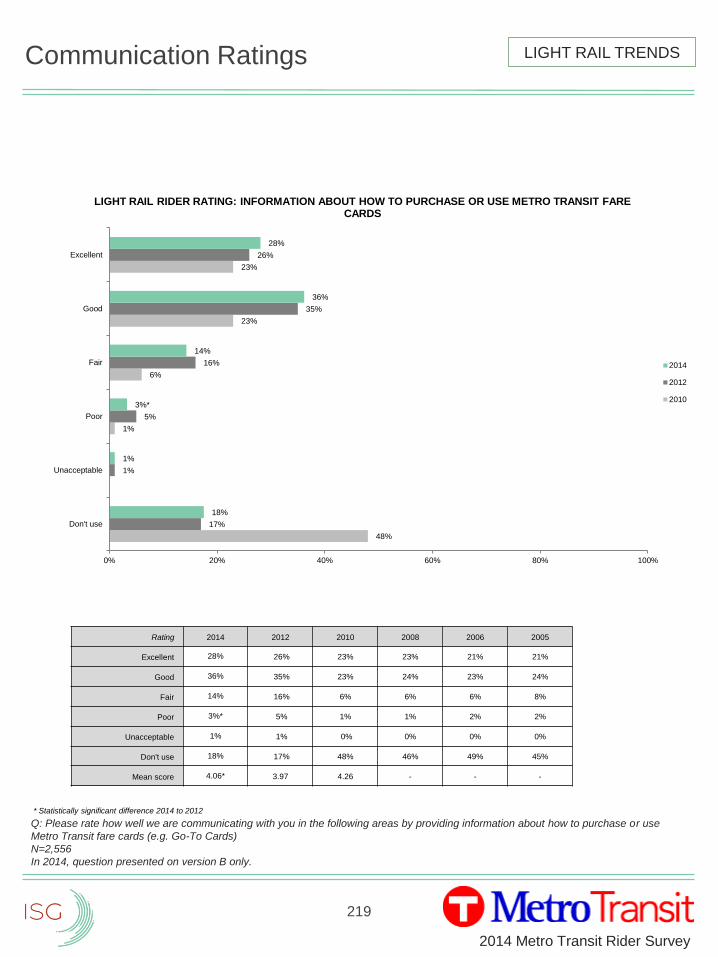
219
2014 Metro Transit Rider Survey
Communication Ratings
Q: Please rate how well we are communicating with you in the following areas by providing information about how to purchase or use
Metro Transit fare cards (e.g. Go-To Cards)
N=2,556
In 2014, question presented on version B only.
48%
1%
6%
23%
23%
17%
1%
5%
16%
35%
26%
18%
1%
3%*
14%
36%
28%
0% 20% 40% 60% 80% 100%
Don't use
Unacceptable
Poor
Fair
Good
Excellent
LIGHT RAIL RIDER RATING: INFORMATION ABOUT HOW TO PURCHASE OR USE METRO TRANSIT FARE CARDS
2014
2012
2010
Rating 2014 2012 2010 2008 2006 2005
Excellent 28% 26% 23% 23% 21% 21%
Good 36% 35% 23% 24% 23% 24%
Fair 14% 16% 6% 6% 6% 8%
Poor 3%* 5% 1% 1% 2% 2%
Unacceptable 1% 1% 0% 0% 0% 0%
Don't use 18% 17% 48% 46% 49% 45%
Mean score 4.06* 3.97 4.26 - - -
* Statistically significant difference 2014 to 2012
LIGHT RAIL TRENDS
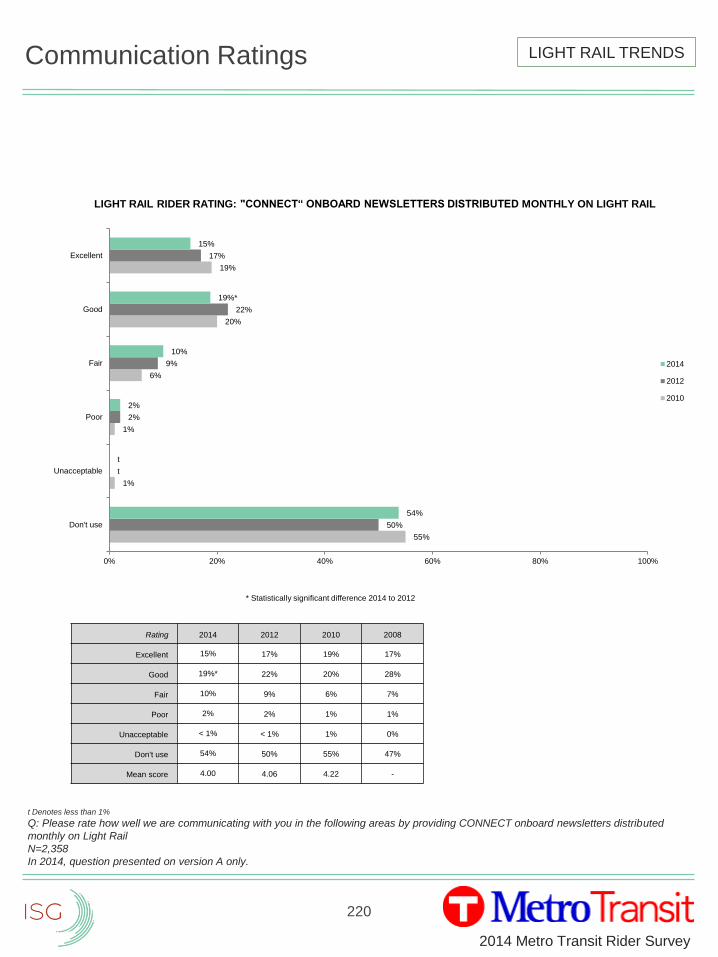
220
2014 Metro Transit Rider Survey
Communication Ratings
t Denotes less than 1%
Q: Please rate how well we are communicating with you in the following areas by providing CONNECT onboard newsletters distributed
monthly on Light Rail
N=2,358
In 2014, question presented on version A only.
55%
1%
1%
6%
20%
19%
50%
t
2%
9%
22%
17%
54%
t
2%
10%
19%*
15%
0% 20% 40% 60% 80% 100%
Don't use
Unacceptable
Poor
Fair
Good
Excellent
LIGHT RAIL RIDER RATING: "CONNECT“ ONBOARD NEWSLETTERS DISTRIBUTED MONTHLY ON LIGHT RAIL
2014
2012
2010
LIGHT RAIL TRENDS
* Statistically significant difference 2014 to 2012
Rating 2014 2012 2010 2008
Excellent 15% 17% 19% 17%
Good 19%* 22% 20% 28%
Fair 10% 9% 6% 7%
Poor 2% 2% 1% 1%
Unacceptable < 1% < 1% 1% 0%
Don't use 54% 50% 55% 47%
Mean score 4.00 4.06 4.22 -
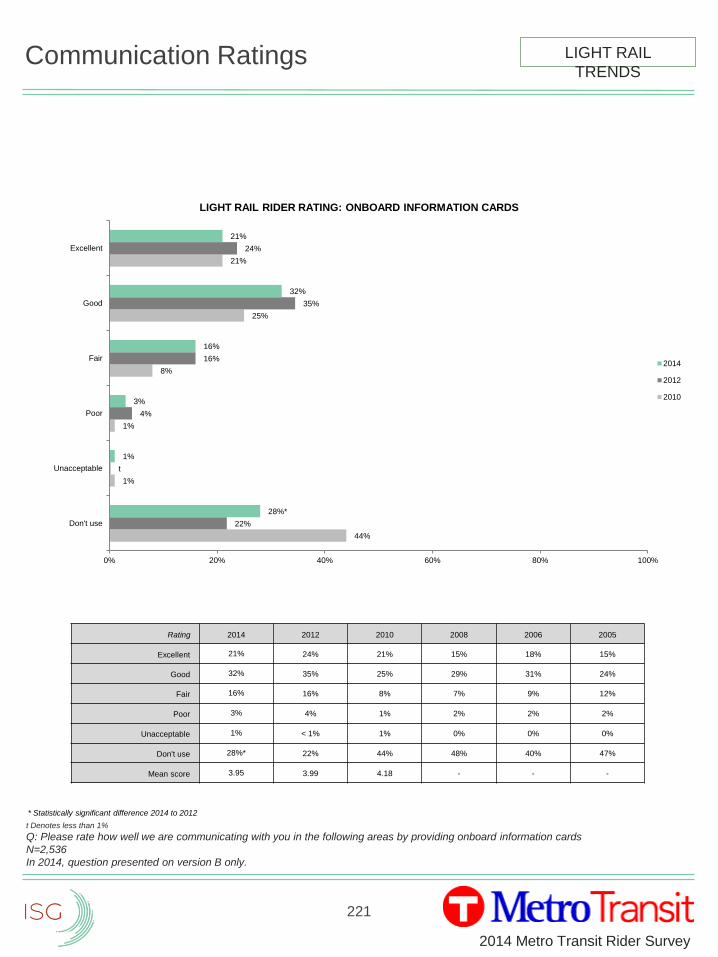
221
2014 Metro Transit Rider Survey
Communication Ratings
t Denotes less than 1%
Q: Please rate how well we are communicating with you in the following areas by providing onboard information cards
N=2,536
In 2014, question presented on version B only.
44%
1%
1%
8%
25%
21%
22%
t
4%
16%
35%
24%
28%*
1%
3%
16%
32%
21%
0% 20% 40% 60% 80% 100%
Don't use
Unacceptable
Poor
Fair
Good
Excellent
LIGHT RAIL RIDER RATING: ONBOARD INFORMATION CARDS
2014
2012
2010
LIGHT RAIL
TRENDS
Rating 2014 2012 2010 2008 2006 2005
Excellent 21% 24% 21% 15% 18% 15%
Good 32% 35% 25% 29% 31% 24%
Fair 16% 16% 8% 7% 9% 12%
Poor 3% 4% 1% 2% 2% 2%
Unacceptable 1% < 1% 1% 0% 0% 0%
Don't use 28%* 22% 44% 48% 40% 47%
Mean score 3.95 3.99 4.18 - - -
* Statistically significant difference 2014 to 2012

2014 Metro Transit Rider Survey
222
Northstar
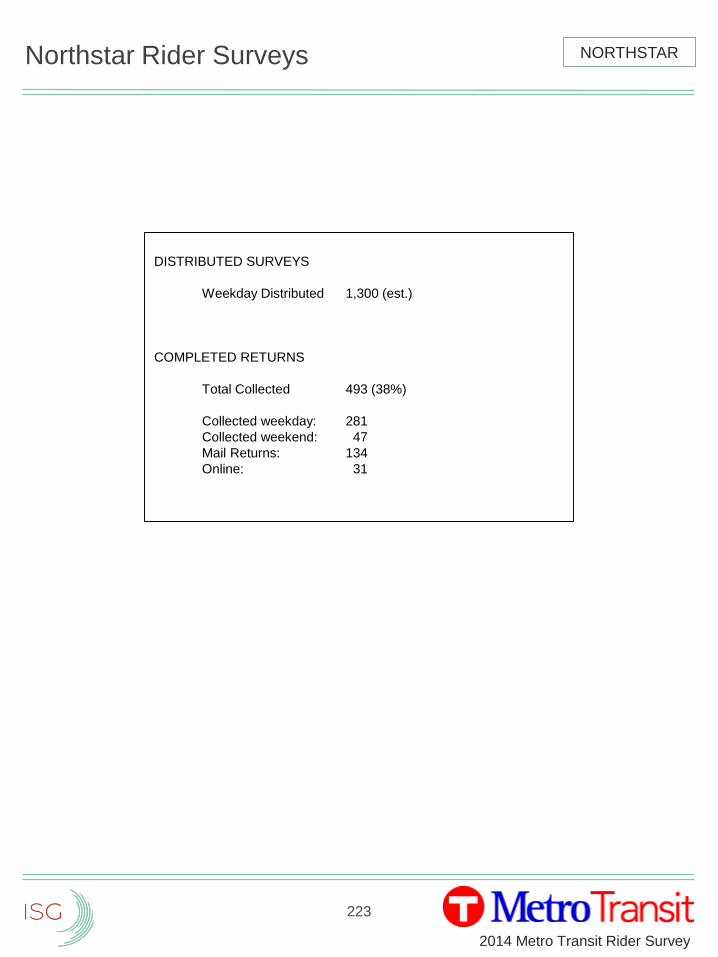
223
2014 Metro Transit Rider Survey
Northstar Rider Surveys
DISTRIBUTED SURVEYS
Weekday Distributed 1,300 (est.)
COMPLETED RETURNS
Total Collected 493 (38%)
Collected weekday: 281
Collected weekend: 47
Mail Returns: 134
Online: 31
NORTHSTAR
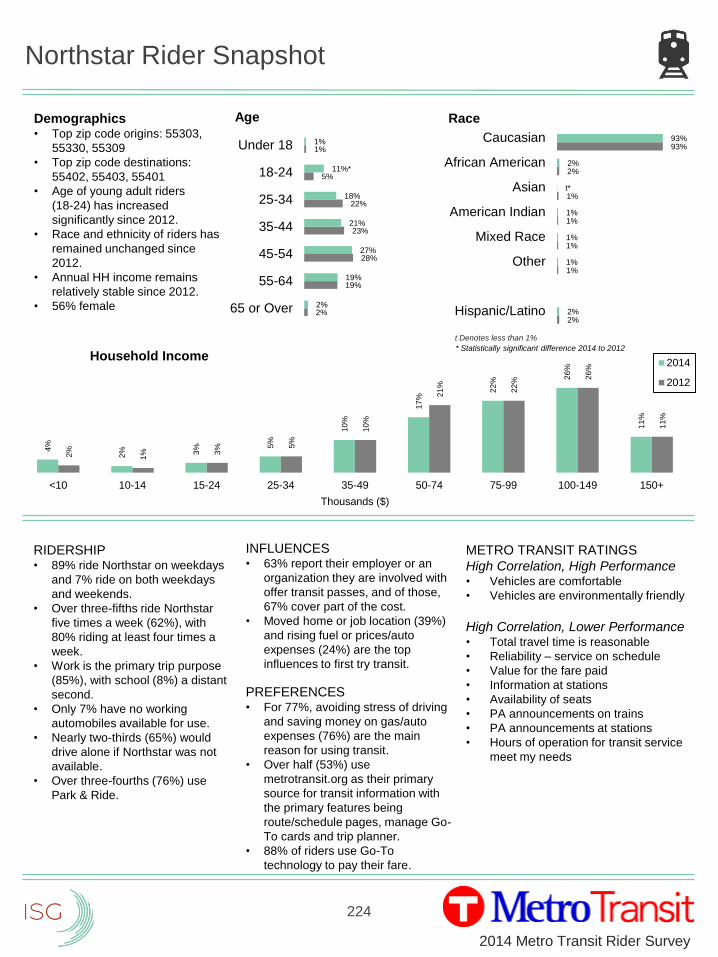
224
2014 Metro Transit Rider Survey
Northstar Rider Snapshot
2%
19%
28%
23%
22%
5%
1%
2%
19%
27%
21%
18%
11%*
1%
65 or Over
55-64
45-54
35-44
25-34
18-24
Under 18
Age
2%
1%
1%
1%
1%
2%
93%
2%
1%
1%
1%
t*
2%
93%
Hispanic/Latino
Other
Mixed Race
American Indian
Asian
African American
Caucasian
Race
4%
2% 3% 5
%
10
%
17
%
22
%
26
%
11
%
2%
1% 3
% 5%
10
%
21
%
22
%
26
%
11
%
<10 10-14 15-24 25-34 35-49 50-74 75-99 100-149 150+
Thousands ($)
Household Income2014
2012
RIDERSHIP• 89% ride Northstar on weekdays
and 7% ride on both weekdays
and weekends.
• Over three-fifths ride Northstar
five times a week (62%), with
80% riding at least four times a
week.
• Work is the primary trip purpose
(85%), with school (8%) a distant
second.
• Only 7% have no working
automobiles available for use.
• Nearly two-thirds (65%) would
drive alone if Northstar was not
available.
• Over three-fourths (76%) use
Park & Ride.
INFLUENCES• 63% report their employer or an
organization they are involved with
offer transit passes, and of those,
67% cover part of the cost.
• Moved home or job location (39%)
and rising fuel or prices/auto
expenses (24%) are the top
influences to first try transit.
PREFERENCES• For 77%, avoiding stress of driving
and saving money on gas/auto
expenses (76%) are the main
reason for using transit.
• Over half (53%) use
metrotransit.org as their primary
source for transit information with
the primary features being
route/schedule pages, manage Go-
To cards and trip planner.
• 88% of riders use Go-To
technology to pay their fare.
METRO TRANSIT RATINGS
High Correlation, High Performance• Vehicles are comfortable
• Vehicles are environmentally friendly
High Correlation, Lower Performance• Total travel time is reasonable
• Reliability – service on schedule
• Value for the fare paid
• Information at stations
• Availability of seats
• PA announcements on trains
• PA announcements at stations
• Hours of operation for transit service
meet my needs
Demographics• Top zip code origins: 55303,
55330, 55309
• Top zip code destinations:
55402, 55403, 55401
• Age of young adult riders
(18-24) has increased
significantly since 2012.
• Race and ethnicity of riders has
remained unchanged since
2012.
• Annual HH income remains
relatively stable since 2012.
• 56% female
* Statistically significant difference 2014 to 2012
t Denotes less than 1%
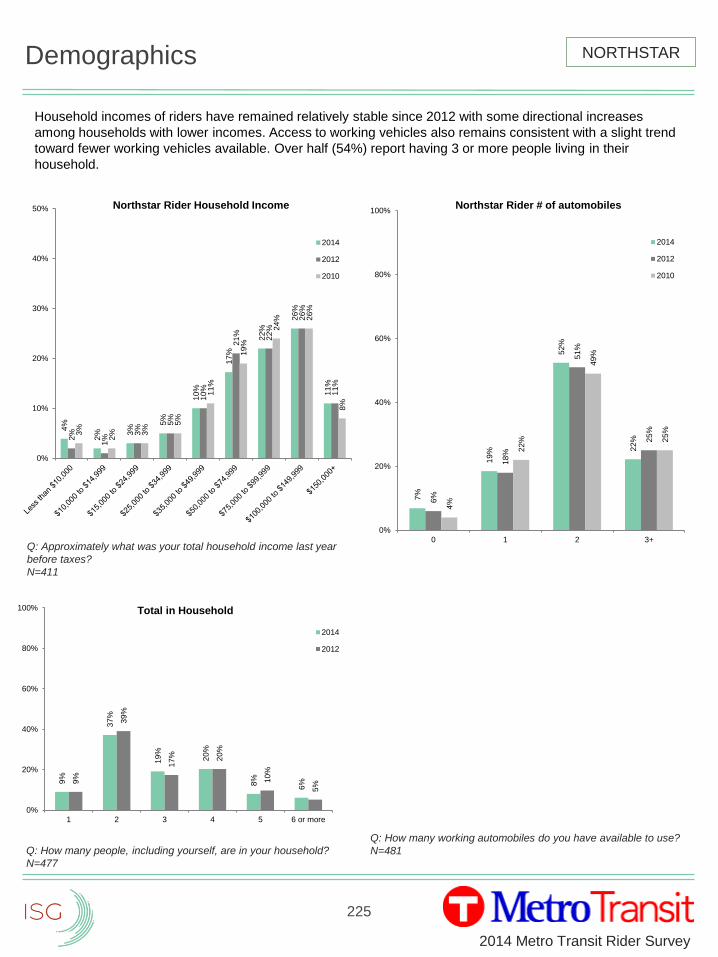
225
2014 Metro Transit Rider Survey
Demographics
Household incomes of riders have remained relatively stable since 2012 with some directional increases
among households with lower incomes. Access to working vehicles also remains consistent with a slight trend
toward fewer working vehicles available. Over half (54%) report having 3 or more people living in their
household.
Q: Approximately what was your total household income last year
before taxes?
N=411
Q: How many working automobiles do you have available to use?
N=481
4%
2% 3
%
5%
10
%
17
%
22
%
26
%
11
%
2%
1%
3%
5%
10
%
21
%
22
%
26
%
11
%
3%
2% 3
%
5%
11
%
19
%
24
% 26
%
8%
0%
10%
20%
30%
40%
50% Northstar Rider Household Income
2014
2012
2010
7%
19
%
52
%
22
%
6%
18
%
51
%
25
%
4%
22
%
49
%
25
%
0%
20%
40%
60%
80%
100%
0 1 2 3+
Northstar Rider # of automobiles
2014
2012
2010
9%
37
%
19
%
20
%
8%
6%9
%
39
%
17
% 20
%
10
%
5%
0%
20%
40%
60%
80%
100%
1 2 3 4 5 6 or more
Total in Household
2014
2012
Q: How many people, including yourself, are in your household?
N=477
NORTHSTAR
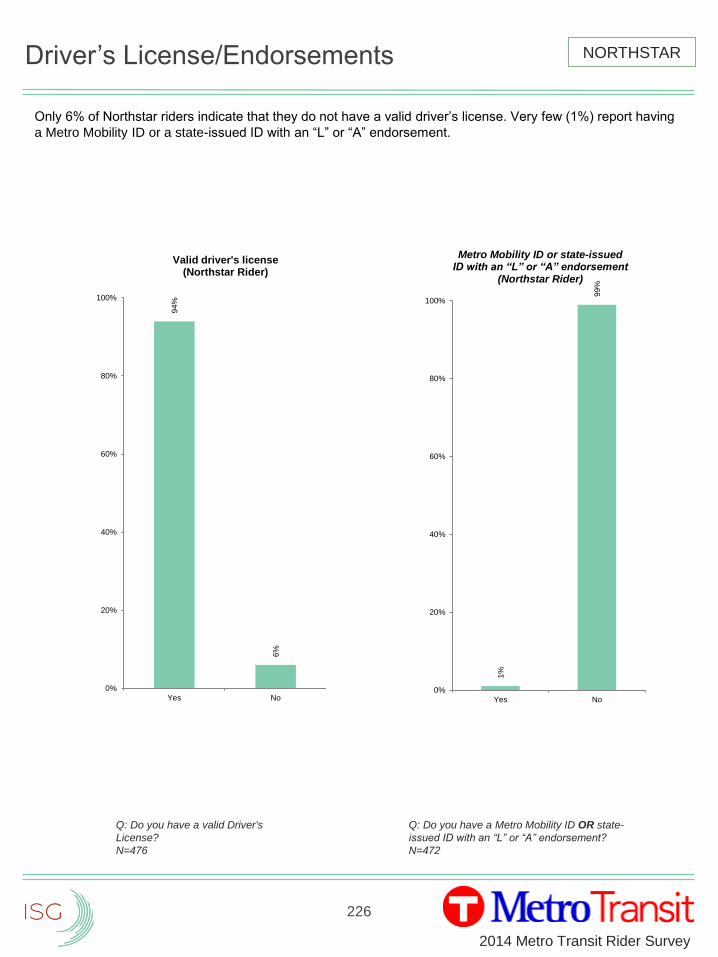
226
2014 Metro Transit Rider Survey
Driver’s License/Endorsements
Only 6% of Northstar riders indicate that they do not have a valid driver’s license. Very few (1%) report having
a Metro Mobility ID or a state-issued ID with an “L” or “A” endorsement.
Q: Do you have a valid Driver's
License?
N=476
Q: Do you have a Metro Mobility ID OR state-
issued ID with an “L” or “A” endorsement?
N=472
94
%
6%
0%
20%
40%
60%
80%
100%
Yes No
Valid driver's license (Northstar Rider)
1%
99
%
0%
20%
40%
60%
80%
100%
Yes No
Metro Mobility ID or state-issued ID with an “L” or “A” endorsement
(Northstar Rider)
NORTHSTAR
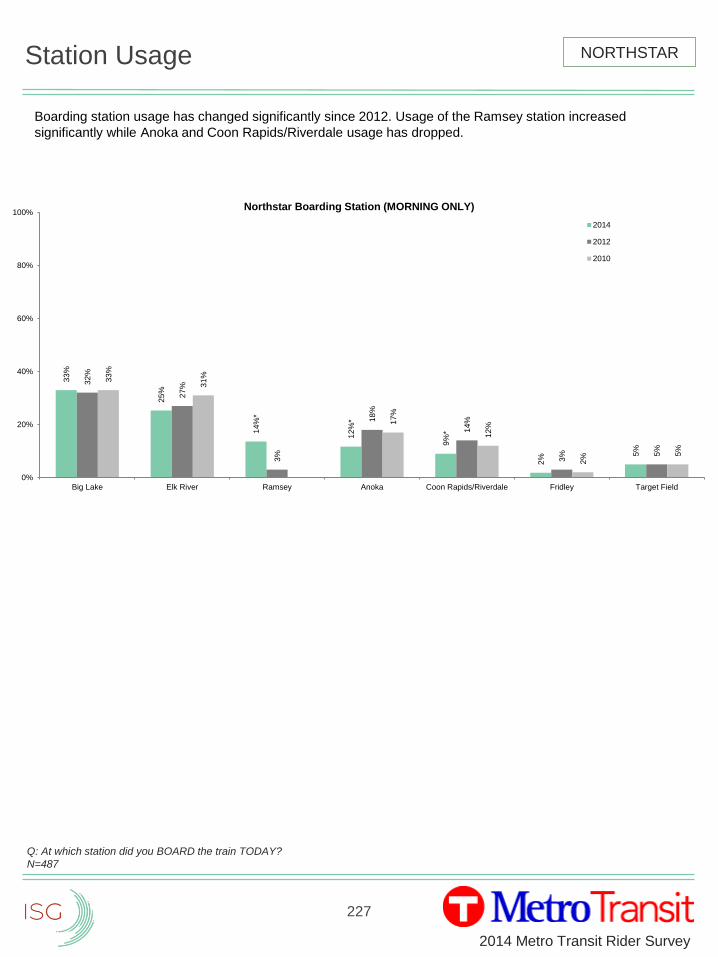
227
2014 Metro Transit Rider Survey
Station Usage
Q: At which station did you BOARD the train TODAY?
N=487
33
%
25
%
14
%*
12
%*
9%
*
2%
5%
32
%
27
%
3%
18
%
14
%
3% 5
%
33
%
31
%
17
%
12
%
2% 5
%
0%
20%
40%
60%
80%
100%
Big Lake Elk River Ramsey Anoka Coon Rapids/Riverdale Fridley Target Field
Northstar Boarding Station (MORNING ONLY)
2014
2012
2010
NORTHSTAR
Boarding station usage has changed significantly since 2012. Usage of the Ramsey station increased
significantly while Anoka and Coon Rapids/Riverdale usage has dropped.
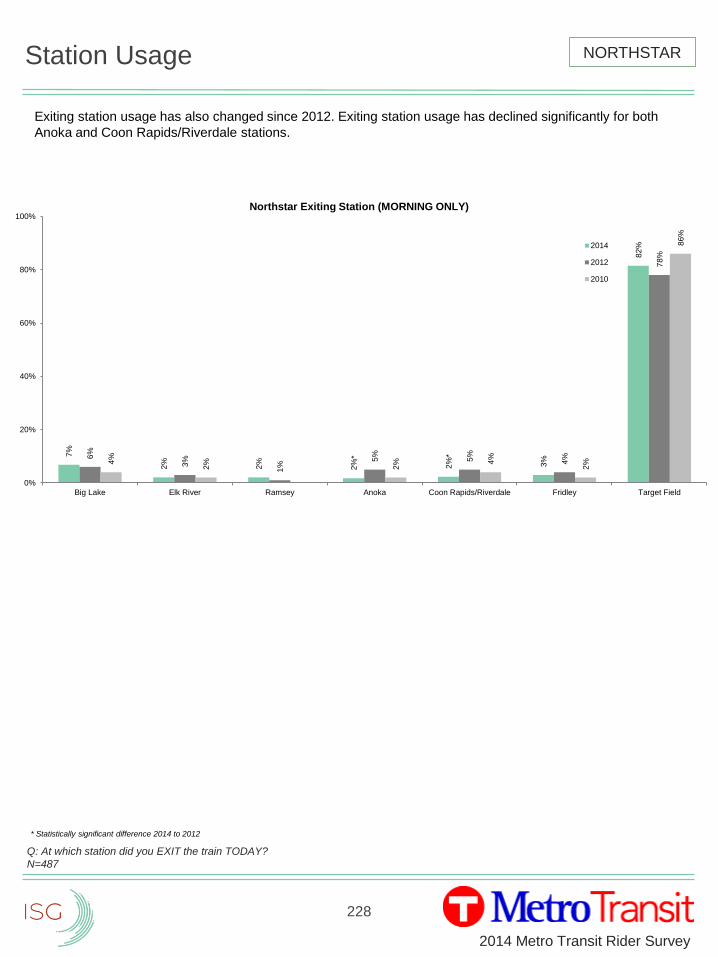
228
2014 Metro Transit Rider Survey
Station Usage
Q: At which station did you EXIT the train TODAY?
N=487
7%
2%
2%
2%
*
2%
*
3%
82
%
6%
3%
1%
5%
5%
4%
78
%
4%
2%
2% 4
%
2%
86
%
0%
20%
40%
60%
80%
100%
Big Lake Elk River Ramsey Anoka Coon Rapids/Riverdale Fridley Target Field
Northstar Exiting Station (MORNING ONLY)
2014
2012
2010
NORTHSTAR
* Statistically significant difference 2014 to 2012
Exiting station usage has also changed since 2012. Exiting station usage has declined significantly for both
Anoka and Coon Rapids/Riverdale stations.
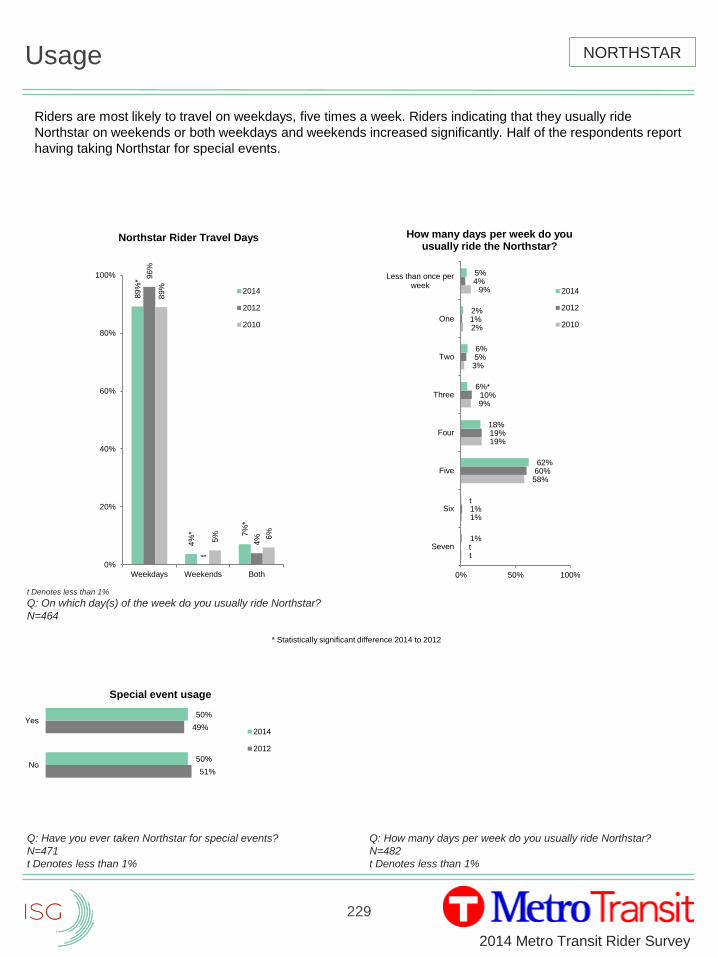
229
2014 Metro Transit Rider Survey
Usage
Riders are most likely to travel on weekdays, five times a week. Riders indicating that they usually ride
Northstar on weekends or both weekdays and weekends increased significantly. Half of the respondents report
having taking Northstar for special events.
Q: Have you ever taken Northstar for special events?
N=471
t Denotes less than 1%
89
%*
4%
* 7%
*
96
%
t
4%
89
%
5% 6%
0%
20%
40%
60%
80%
100%
Weekdays Weekends Both
Northstar Rider Travel Days
2014
2012
2010
t
1%
58%
19%
9%
3%
2%
9%
t
1%
60%
19%
10%
5%
1%
4%
1%
t
62%
18%
6%*
6%
2%
5%
0% 50% 100%
Seven
Six
Five
Four
Three
Two
One
Less than once perweek
How many days per week do you usually ride the Northstar?
2014
2012
2010
Q: How many days per week do you usually ride Northstar?
N=482
t Denotes less than 1%
NORTHSTAR
t Denotes less than 1%
Q: On which day(s) of the week do you usually ride Northstar?
N=464
51%
49%
50%
50%
No
Yes
Special event usage
2014
2012
* Statistically significant difference 2014 to 2012
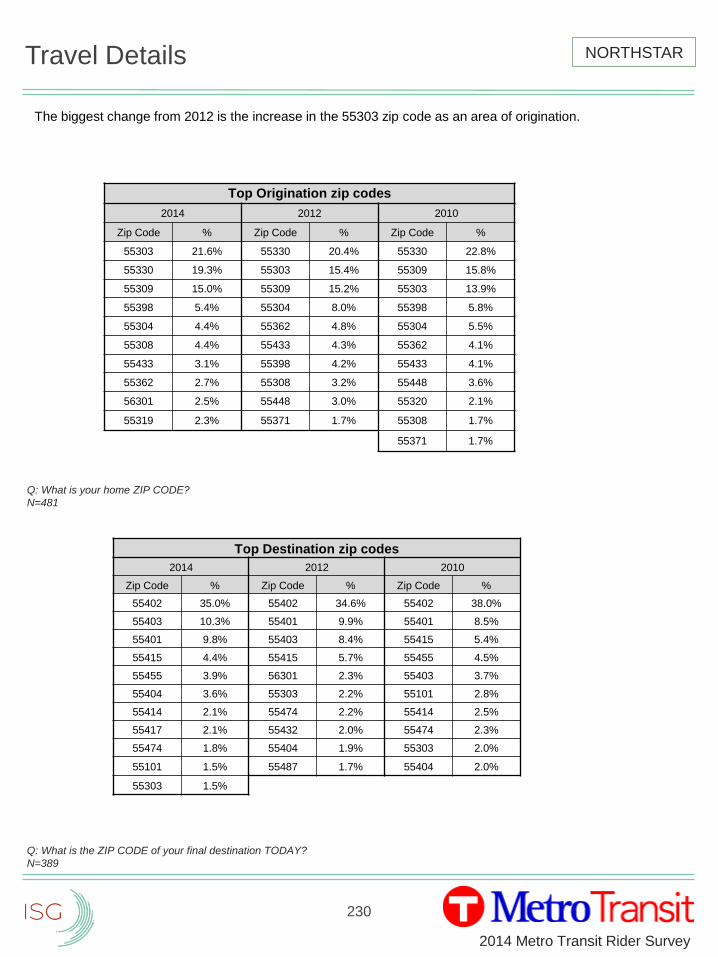
230
2014 Metro Transit Rider Survey
Travel Details
Q: What is your home ZIP CODE?
N=481
Q: What is the ZIP CODE of your final destination TODAY?
N=389
NORTHSTAR
Top Origination zip codes
2014 2012 2010
Zip Code % Zip Code % Zip Code %
55303 21.6% 55330 20.4% 55330 22.8%
55330 19.3% 55303 15.4% 55309 15.8%
55309 15.0% 55309 15.2% 55303 13.9%
55398 5.4% 55304 8.0% 55398 5.8%
55304 4.4% 55362 4.8% 55304 5.5%
55308 4.4% 55433 4.3% 55362 4.1%
55433 3.1% 55398 4.2% 55433 4.1%
55362 2.7% 55308 3.2% 55448 3.6%
56301 2.5% 55448 3.0% 55320 2.1%
55319 2.3% 55371 1.7% 55308 1.7%
55371 1.7%
Top Destination zip codes
2014 2012 2010
Zip Code % Zip Code % Zip Code %
55402 35.0% 55402 34.6% 55402 38.0%
55403 10.3% 55401 9.9% 55401 8.5%
55401 9.8% 55403 8.4% 55415 5.4%
55415 4.4% 55415 5.7% 55455 4.5%
55455 3.9% 56301 2.3% 55403 3.7%
55404 3.6% 55303 2.2% 55101 2.8%
55414 2.1% 55474 2.2% 55414 2.5%
55417 2.1% 55432 2.0% 55474 2.3%
55474 1.8% 55404 1.9% 55303 2.0%
55101 1.5% 55487 1.7% 55404 2.0%
55303 1.5%
The biggest change from 2012 is the increase in the 55303 zip code as an area of origination.
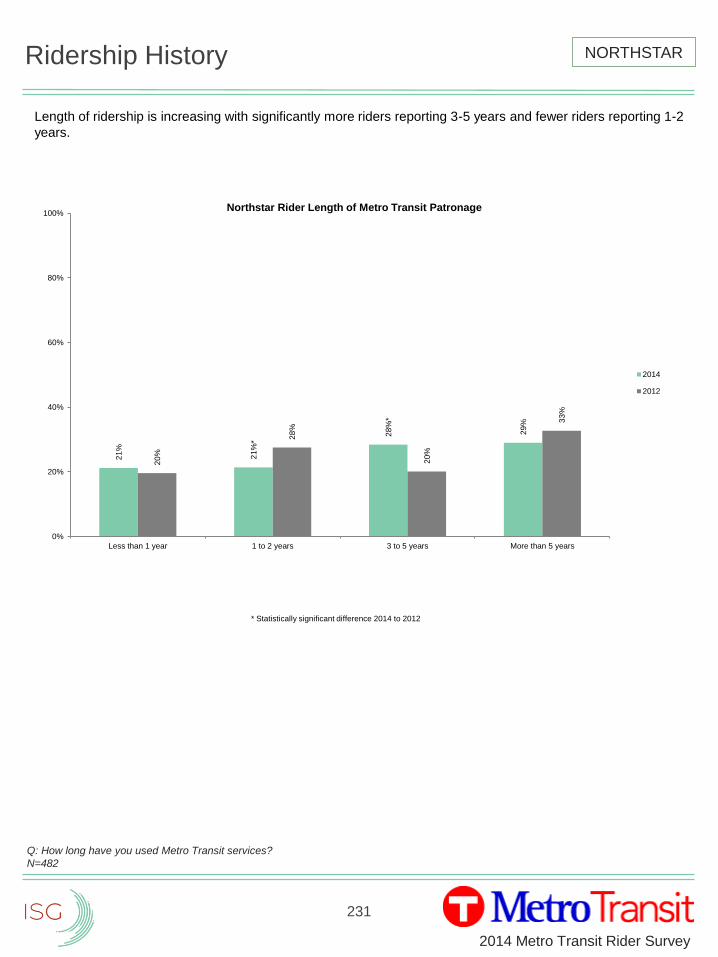
231
2014 Metro Transit Rider Survey
Ridership History
Length of ridership is increasing with significantly more riders reporting 3-5 years and fewer riders reporting 1-2
years.
Q: How long have you used Metro Transit services?
N=482
21
%
21
%*
28
%*
29
%
20
%
28
%
20
%
33
%
0%
20%
40%
60%
80%
100%
Less than 1 year 1 to 2 years 3 to 5 years More than 5 years
Northstar Rider Length of Metro Transit Patronage
2014
2012
NORTHSTAR
* Statistically significant difference 2014 to 2012
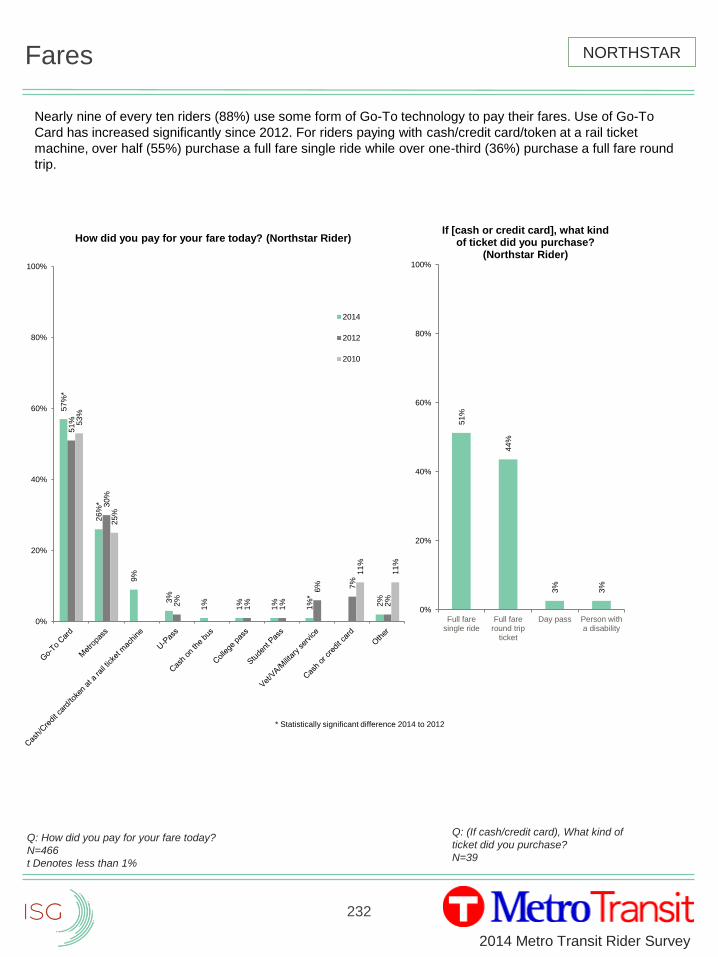
232
2014 Metro Transit Rider Survey
Fares
Nearly nine of every ten riders (88%) use some form of Go-To technology to pay their fares. Use of Go-To
Card has increased significantly since 2012. For riders paying with cash/credit card/token at a rail ticket
machine, over half (55%) purchase a full fare single ride while over one-third (36%) purchase a full fare round
trip.
Q: How did you pay for your fare today?
N=466
t Denotes less than 1%
Q: (If cash/credit card), What kind of
ticket did you purchase?
N=39
NORTHSTAR
* Statistically significant difference 2014 to 2012
51
%
44
%
3%
3%
0%
20%
40%
60%
80%
100%
Full faresingle ride
Full fareround trip
ticket
Day pass Person witha disability
If [cash or credit card], what kind of ticket did you purchase?
(Northstar Rider)
57
%*
26
%*
9%
3%
1%
1%
1%
1%
*
2%
51
%
30
%
2%
1%
1%
6% 7%
2%
53
%
25
%
11
%
11
%
0%
20%
40%
60%
80%
100%
How did you pay for your fare today? (Northstar Rider)
2014
2012
2010
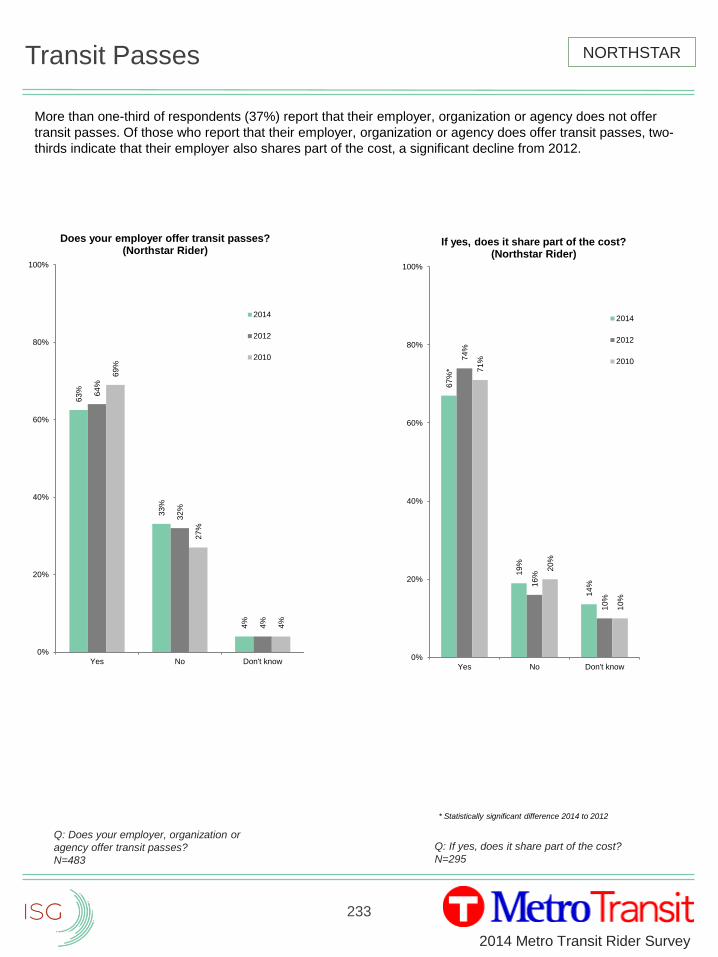
233
2014 Metro Transit Rider Survey
Transit Passes
More than one-third of respondents (37%) report that their employer, organization or agency does not offer
transit passes. Of those who report that their employer, organization or agency does offer transit passes, two-
thirds indicate that their employer also shares part of the cost, a significant decline from 2012.
Q: Does your employer, organization or
agency offer transit passes?
N=483
Q: If yes, does it share part of the cost?
N=295
NORTHSTAR
* Statistically significant difference 2014 to 2012
63
%
33
%
4%
64
%
32
%
4%
69
%
27
%
4%
0%
20%
40%
60%
80%
100%
Yes No Don't know
Does your employer offer transit passes? (Northstar Rider)
2014
2012
2010
67
%*
19
%
14
%
74
%
16
%
10
%
71
%
20
%
10
%
0%
20%
40%
60%
80%
100%
Yes No Don't know
If yes, does it share part of the cost? (Northstar Rider)
2014
2012
2010
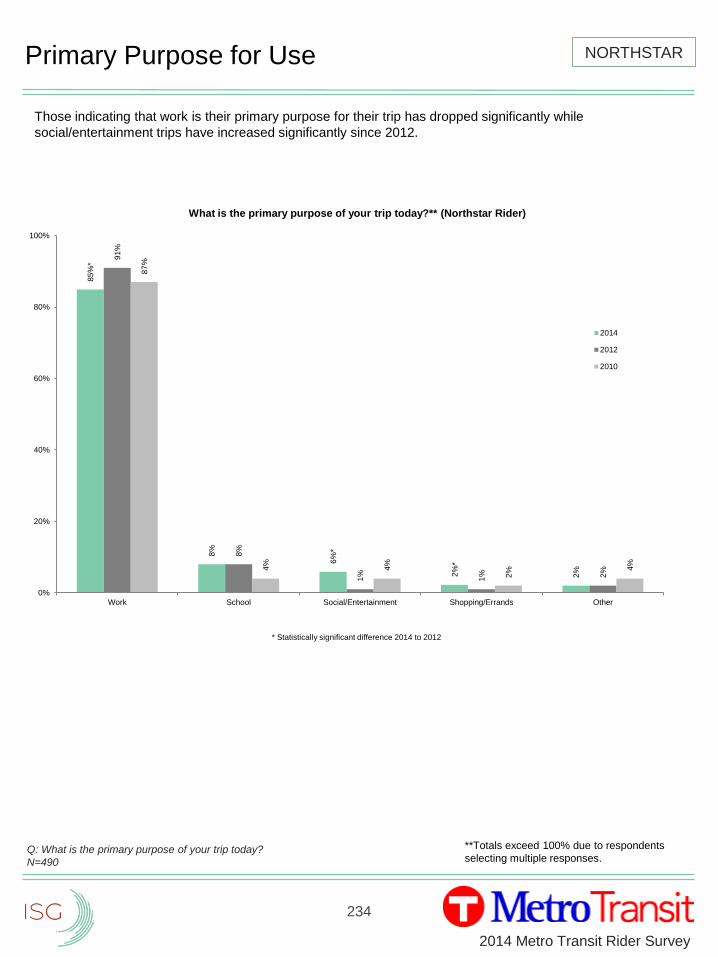
234
2014 Metro Transit Rider Survey
Primary Purpose for Use
Q: What is the primary purpose of your trip today?
N=490
85
%*
8%
6%
*
2%
*
2%
91
%
8%
1%
1% 2%
87
%
4%
4%
2% 4
%
0%
20%
40%
60%
80%
100%
Work School Social/Entertainment Shopping/Errands Other
What is the primary purpose of your trip today?** (Northstar Rider)
2014
2012
2010
NORTHSTAR
Those indicating that work is their primary purpose for their trip has dropped significantly while
social/entertainment trips have increased significantly since 2012.
* Statistically significant difference 2014 to 2012
**Totals exceed 100% due to respondents
selecting multiple responses.
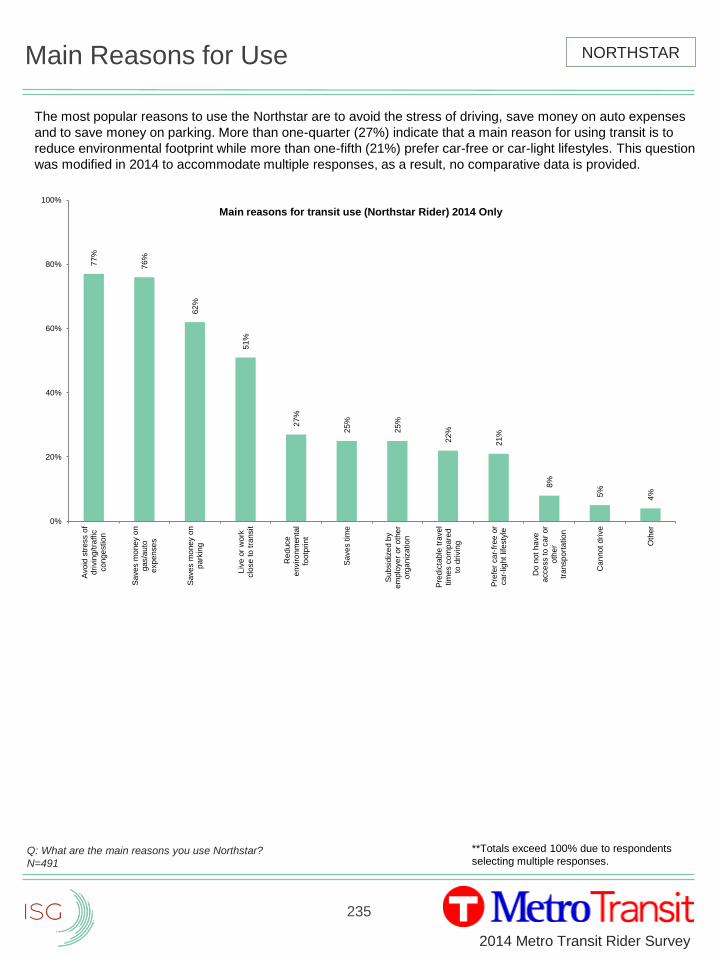
235
2014 Metro Transit Rider Survey
Main Reasons for Use
The most popular reasons to use the Northstar are to avoid the stress of driving, save money on auto expenses
and to save money on parking. More than one-quarter (27%) indicate that a main reason for using transit is to
reduce environmental footprint while more than one-fifth (21%) prefer car-free or car-light lifestyles. This question
was modified in 2014 to accommodate multiple responses, as a result, no comparative data is provided.
Q: What are the main reasons you use Northstar?
N=491
77
%
76
%
62
%
51
%
27
%
25
%
25
%
22
%
21
%
8%
5%
4%
0%
20%
40%
60%
80%
100%
Avo
id s
tre
ss o
fd
rivin
g/t
raffic
co
nge
stio
n
Sa
ve
s m
on
ey o
ng
as/a
uto
exp
en
se
s
Sa
ve
s m
on
ey o
np
ark
ing
Liv
e o
r w
ork
clo
se
to
tra
nsit
Re
duce
en
viro
nm
en
tal
footp
rint
Sa
ve
s t
ime
Su
bsid
ize
d b
ye
mp
loye
r or
oth
er
org
an
ization
Pre
dic
tab
le t
rave
ltim
es c
om
pare
dto
dri
vin
g
Pre
fer
ca
r-fr
ee
or
ca
r-lig
ht
life
sty
le
Do n
ot
ha
ve
acce
ss to
ca
r o
ro
the
rtr
an
sp
ort
atio
n
Can
not
dri
ve
Oth
er
Main reasons for transit use (Northstar Rider) 2014 Only
NORTHSTAR
**Totals exceed 100% due to respondents
selecting multiple responses.
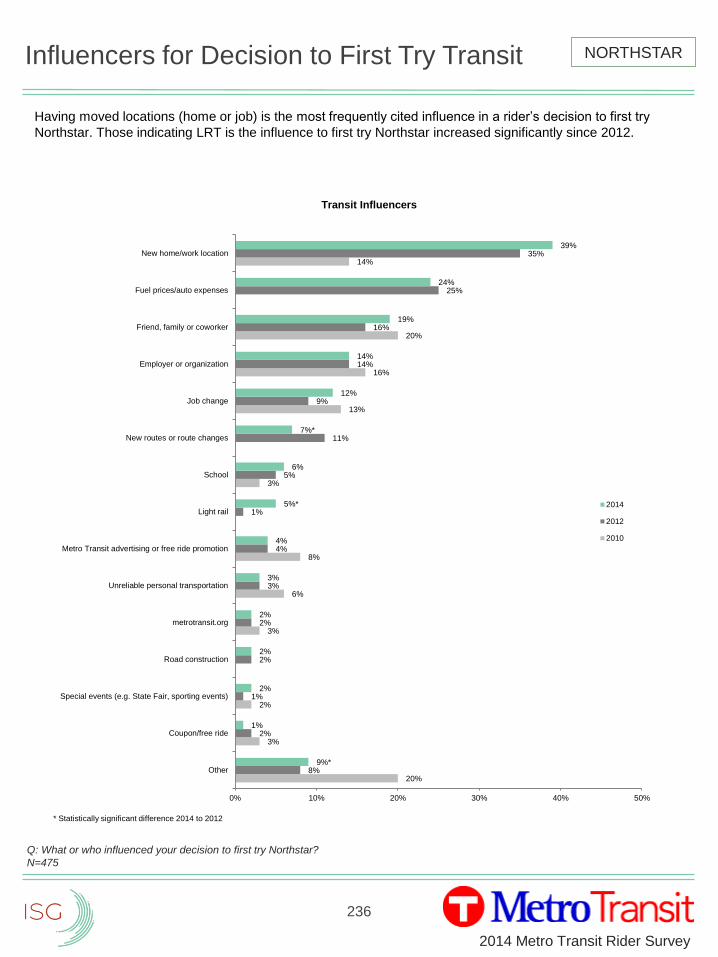
236
2014 Metro Transit Rider Survey
Influencers for Decision to First Try Transit
Having moved locations (home or job) is the most frequently cited influence in a rider’s decision to first try
Northstar. Those indicating LRT is the influence to first try Northstar increased significantly since 2012.
Q: What or who influenced your decision to first try Northstar?
N=475
20%
3%
2%
3%
6%
8%
3%
13%
16%
20%
14%
8%
2%
1%
2%
2%
3%
4%
1%
5%
11%
9%
14%
16%
25%
35%
9%*
1%
2%
2%
2%
3%
4%
5%*
6%
7%*
12%
14%
19%
24%
39%
0% 10% 20% 30% 40% 50%
Other
Coupon/free ride
Special events (e.g. State Fair, sporting events)
Road construction
metrotransit.org
Unreliable personal transportation
Metro Transit advertising or free ride promotion
Light rail
School
New routes or route changes
Job change
Employer or organization
Friend, family or coworker
Fuel prices/auto expenses
New home/work location
Transit Influencers
2014
2012
2010
NORTHSTAR
* Statistically significant difference 2014 to 2012
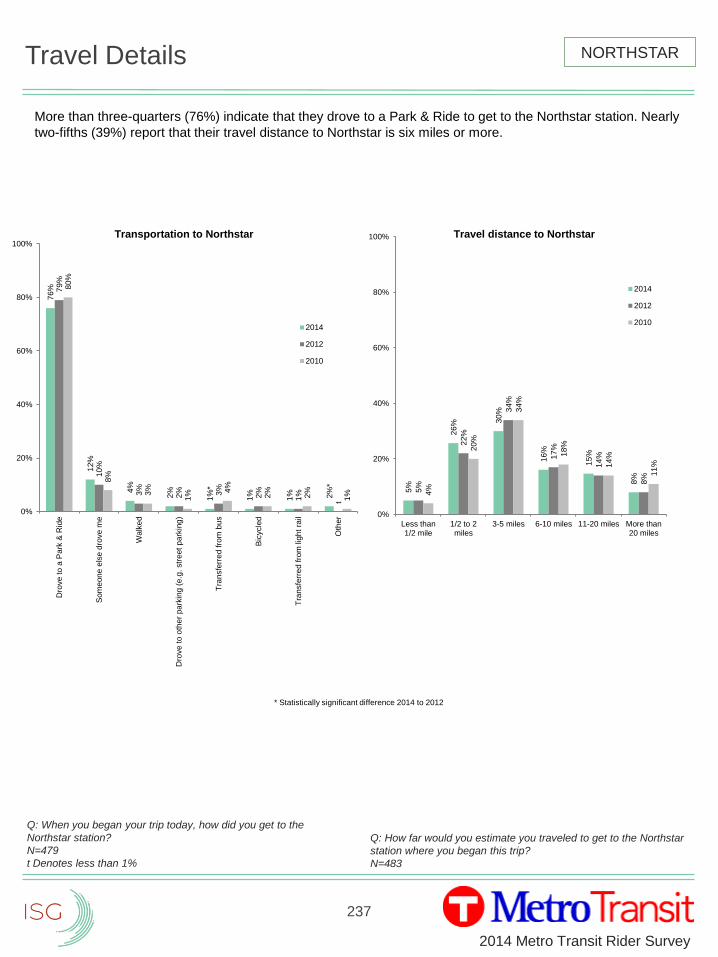
237
2014 Metro Transit Rider Survey
Travel Details
More than three-quarters (76%) indicate that they drove to a Park & Ride to get to the Northstar station. Nearly
two-fifths (39%) report that their travel distance to Northstar is six miles or more.
Q: When you began your trip today, how did you get to the
Northstar station?
N=479
t Denotes less than 1%
Q: How far would you estimate you traveled to get to the Northstar
station where you began this trip?
N=483
76
%
12
%
4%
2%
1%
*
1%
1% 2%
*
79
%
10
%
3%
2% 3%
2%
1%
t
80
%
8%
3%
1% 4
%
2%
2%
1%
0%
20%
40%
60%
80%
100%
Dro
ve t
o a
Pa
rk &
Rid
e
So
me
on
e e
lse d
rove m
e
Wa
lked
Dro
ve t
o o
the
r pa
rkin
g (
e.g
. str
eet
pa
rkin
g)
Tra
nsfe
rre
d f
rom
bu
s
Bic
ycle
d
Tra
nsfe
rre
d f
rom
lig
ht
rail
Oth
er
Transportation to Northstar
2014
2012
2010
5%
26
% 30
%
16
%
15
%
8%
5%
22
%
34
%
17
%
14
%
8%
4%
20
%
34
%
18
%
14
%
11
%
0%
20%
40%
60%
80%
100%
Less than1/2 mile
1/2 to 2miles
3-5 miles 6-10 miles 11-20 miles More than20 miles
Travel distance to Northstar
2014
2012
2010
NORTHSTAR
* Statistically significant difference 2014 to 2012
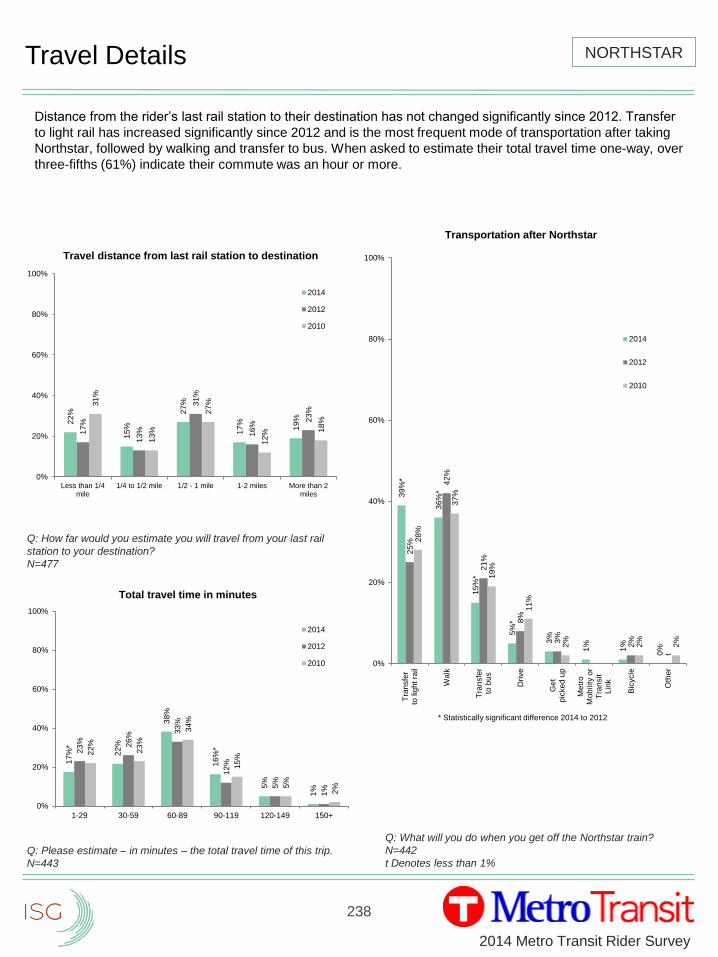
238
2014 Metro Transit Rider Survey
Travel Details
Q: What will you do when you get off the Northstar train?
N=442
t Denotes less than 1%
Q: Please estimate – in minutes – the total travel time of this trip.
N=443
17
%*
22
%
38
%
16
%*
5%
1%
23
% 26
%
33
%
12
%
5%
1%
22
%
23
%
34
%
15
%
5%
2%
0%
20%
40%
60%
80%
100%
1-29 30-59 60-89 90-119 120-149 150+
Total travel time in minutes
2014
2012
2010
NORTHSTAR2
2%
15
%
27
%
17
%
19
%
17
%
13
%
31
%
16
%
23
%
31
%
13
%
27
%
12
% 18
%
0%
20%
40%
60%
80%
100%
Less than 1/4mile
1/4 to 1/2 mile 1/2 - 1 mile 1-2 miles More than 2miles
Travel distance from last rail station to destination
2014
2012
2010
Q: How far would you estimate you will travel from your last rail
station to your destination?
N=477
39
%*
36
%*
15
%*
5%
*
3%
1%
1%
0%
25
%
42
%
21
%
8%
3%
2%
t
28
%
37
%
19
%
11
%
2%
2%
2%
0%
20%
40%
60%
80%
100%
Tra
nsfe
rto
lig
ht
rail
Wa
lk
Tra
nsfe
rto
bu
s
Dri
ve
Ge
tp
icked
up
Metr
oM
ob
ility
or
Tra
nsit
Lin
k
Bic
ycle
Oth
er
Transportation after Northstar
2014
2012
2010
* Statistically significant difference 2014 to 2012
Distance from the rider’s last rail station to their destination has not changed significantly since 2012. Transfer
to light rail has increased significantly since 2012 and is the most frequent mode of transportation after taking
Northstar, followed by walking and transfer to bus. When asked to estimate their total travel time one-way, over
three-fifths (61%) indicate their commute was an hour or more.
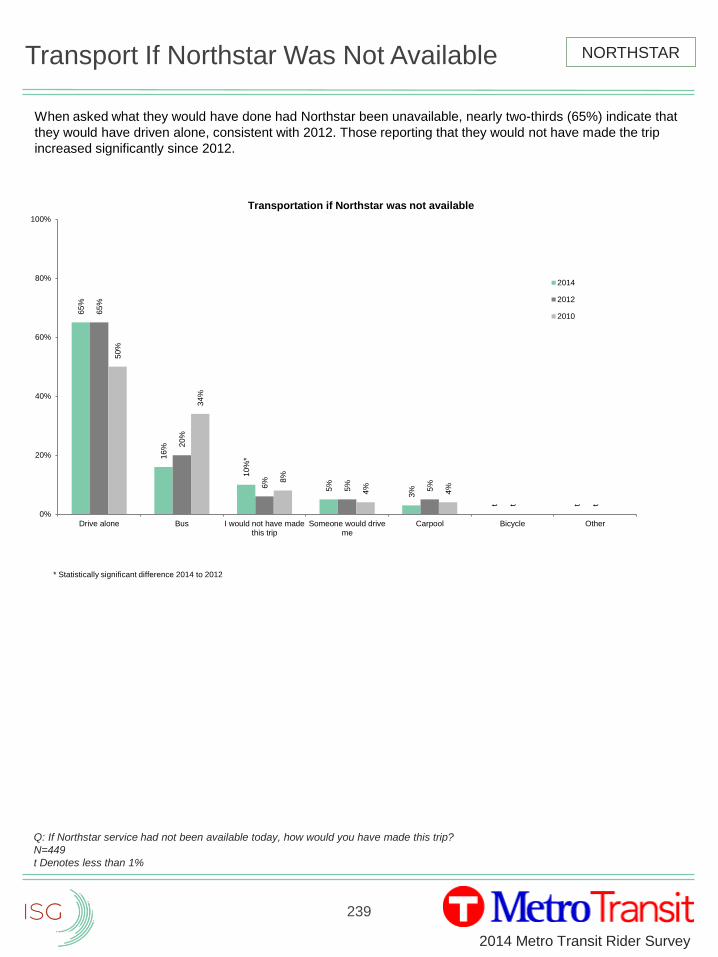
239
2014 Metro Transit Rider Survey
Transport If Northstar Was Not Available
When asked what they would have done had Northstar been unavailable, nearly two-thirds (65%) indicate that
they would have driven alone, consistent with 2012. Those reporting that they would not have made the trip
increased significantly since 2012.
65
%
16
%
10
%*
5%
3%
t t
65
%
20
%
6%
5%
5%
t t
50
%
34
%
8%
4%
4%
0%
20%
40%
60%
80%
100%
Drive alone Bus I would not have madethis trip
Someone would driveme
Carpool Bicycle Other
Transportation if Northstar was not available
2014
2012
2010
NORTHSTAR
Q: If Northstar service had not been available today, how would you have made this trip?
N=449
t Denotes less than 1%
* Statistically significant difference 2014 to 2012
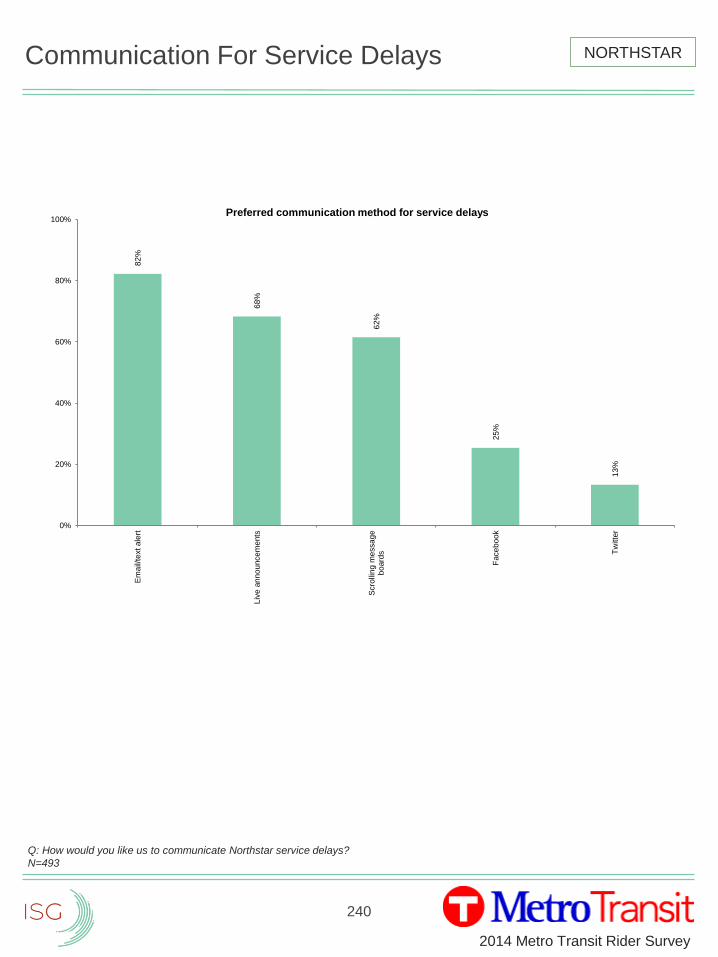
240
2014 Metro Transit Rider Survey
Communication For Service Delays
Q: How would you like us to communicate Northstar service delays?
N=493
82
%
68
%
62
%
25
%
13
%
0%
20%
40%
60%
80%
100%
Em
ail/
text a
lert
Liv
e a
nn
ou
nce
me
nts
Scro
lling
me
ssa
ge
bo
ard
s
Face
bo
ok
Tw
itte
r
Preferred communication method for service delays
NORTHSTAR
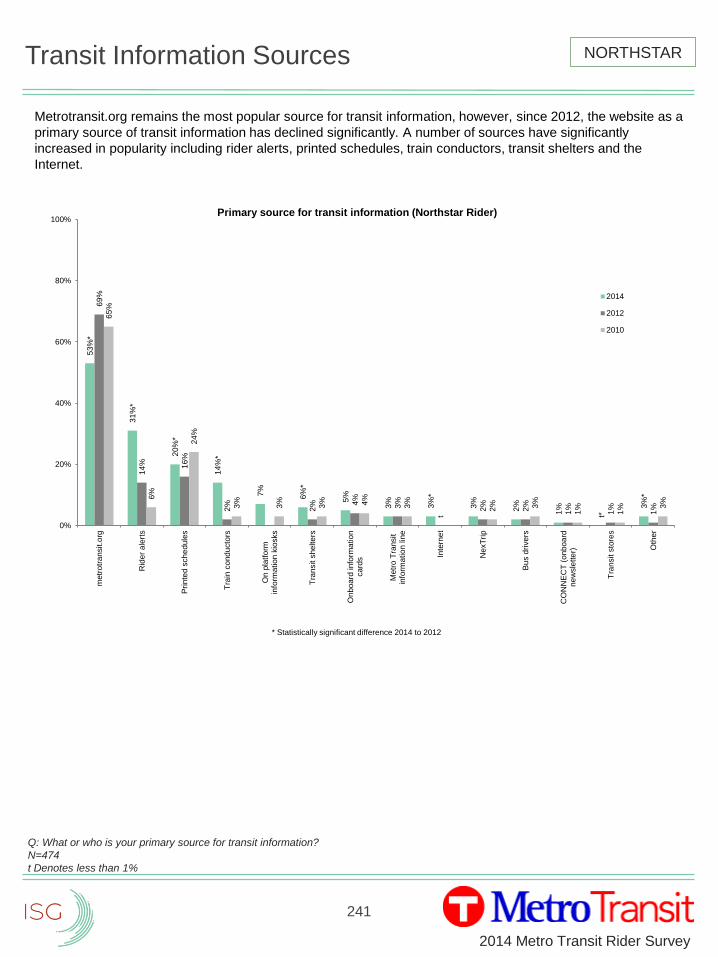
241
2014 Metro Transit Rider Survey
Transit Information Sources
Metrotransit.org remains the most popular source for transit information, however, since 2012, the website as a
primary source of transit information has declined significantly. A number of sources have significantly
increased in popularity including rider alerts, printed schedules, train conductors, transit shelters and the
Internet.
Q: What or who is your primary source for transit information?
N=474
t Denotes less than 1%
53
%*
31
%*
20
%*
14
%*
7%
6%
*
5%
3%
3%
*
3%
2%
1%
t*
3%
*
69
%
14
% 16
%
2%
2% 4
%
3%
t
2%
2%
1%
1%
1%
65
%
6%
24
%
3%
3%
3% 4%
3%
2% 3%
1%
1% 3
%
0%
20%
40%
60%
80%
100%
metr
otr
an
sit.o
rg
Rid
er
ale
rts
Pri
nte
d s
ch
ed
ule
s
Tra
in c
ond
ucto
rs
On
pla
tfo
rmin
form
atio
n k
iosks
Tra
nsit s
he
lte
rs
On
bo
ard
info
rma
tio
nca
rds
Metr
o T
ransit
info
rma
tio
n lin
e
Inte
rne
t
NexT
rip
Bu
s d
rivers
CO
NN
EC
T (
onb
oa
rdn
ew
sle
tte
r)
Tra
nsit s
tore
s
Oth
er
Primary source for transit information (Northstar Rider)
2014
2012
2010
NORTHSTAR
* Statistically significant difference 2014 to 2012
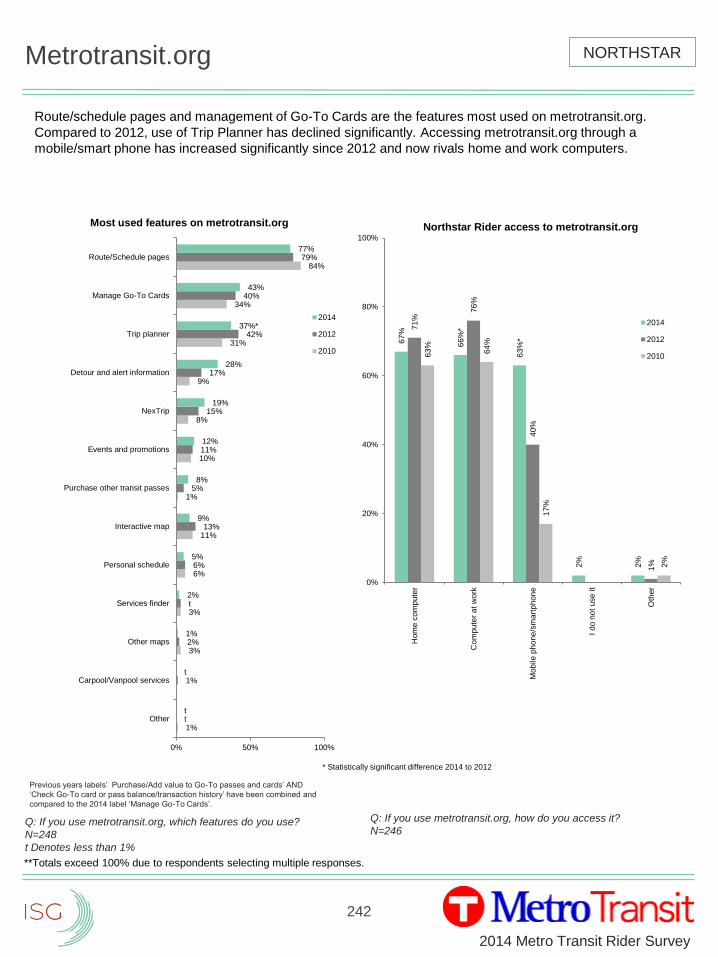
242
2014 Metro Transit Rider Survey
Metrotransit.org
Route/schedule pages and management of Go-To Cards are the features most used on metrotransit.org.
Compared to 2012, use of Trip Planner has declined significantly. Accessing metrotransit.org through a
mobile/smart phone has increased significantly since 2012 and now rivals home and work computers.
Q: If you use metrotransit.org, how do you access it?
N=246Q: If you use metrotransit.org, which features do you use?
N=248
t Denotes less than 1%
1%
3%
3%
6%
11%
1%
10%
8%
9%
31%
34%
84%
t
1%
2%
t
6%
13%
5%
11%
15%
17%
42%
40%
79%
t
t
1%
2%
5%
9%
8%
12%
19%
28%
37%*
43%
77%
0% 50% 100%
Other
Carpool/Vanpool services
Other maps
Services finder
Personal schedule
Interactive map
Purchase other transit passes
Events and promotions
NexTrip
Detour and alert information
Trip planner
Manage Go-To Cards
Route/Schedule pages
Most used features on metrotransit.org
2014
2012
2010
67
%
66
%*
63
%*
2%
2%
71
%
76
%
40
%
1%
63
%
64
%
17
%
2%
0%
20%
40%
60%
80%
100%
Hom
e c
om
pute
r
Com
pu
ter
at
work
Mob
ile p
ho
ne
/sm
art
ph
on
e
I d
o n
ot
use
it
Oth
er
Northstar Rider access to metrotransit.org
2014
2012
2010
NORTHSTAR
* Statistically significant difference 2014 to 2012
Previous years labels’ Purchase/Add value to Go-To passes and cards’ AND
‘Check Go-To card or pass balance/transaction history’ have been combined and
compared to the 2014 label ‘Manage Go-To Cards’.
**Totals exceed 100% due to respondents selecting multiple responses.
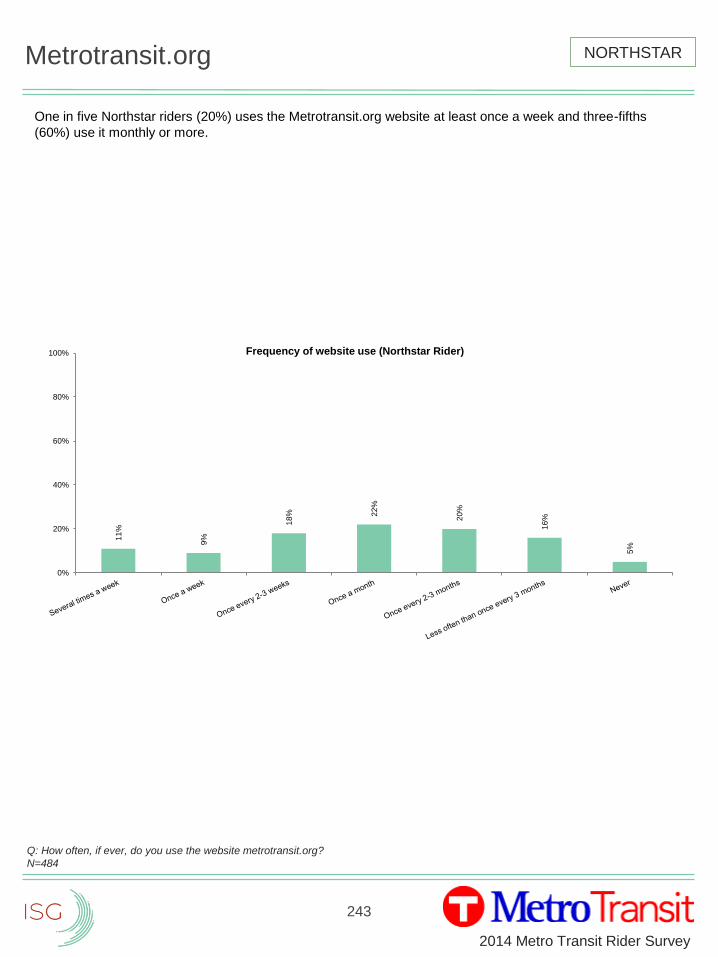
243
2014 Metro Transit Rider Survey
Metrotransit.org
One in five Northstar riders (20%) uses the Metrotransit.org website at least once a week and three-fifths
(60%) use it monthly or more.
Q: How often, if ever, do you use the website metrotransit.org?
N=484
NORTHSTAR
11
%
9%
18
% 22
%
20
%
16
%
5%
0%
20%
40%
60%
80%
100% Frequency of website use (Northstar Rider)
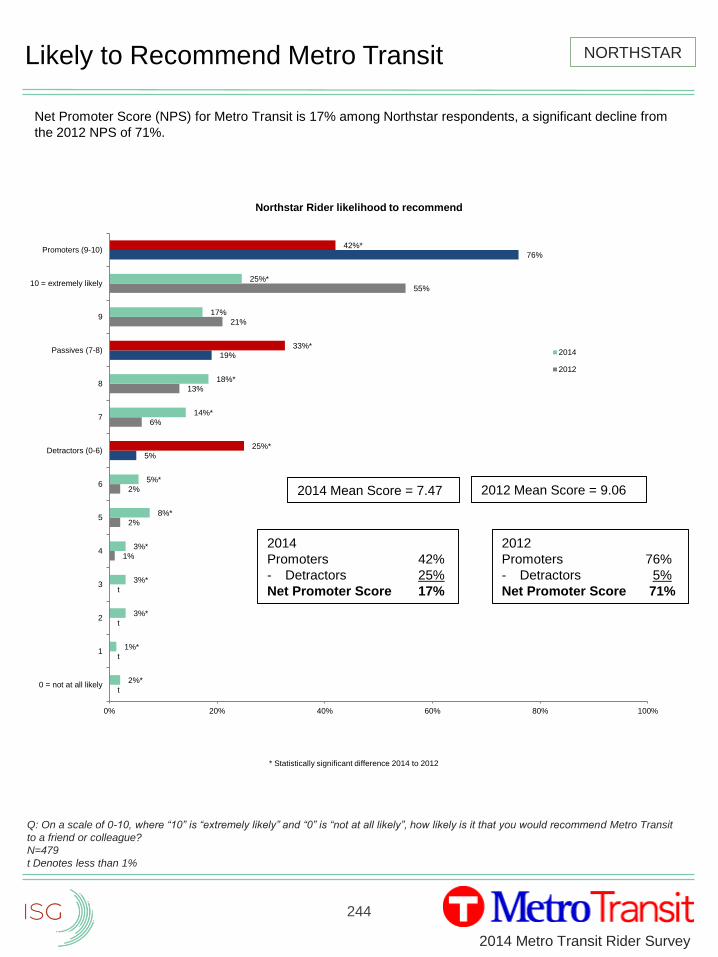
244
2014 Metro Transit Rider Survey
Likely to Recommend Metro Transit
t
t
t
t
1%
2%
2%
5%
6%
13%
19%
21%
55%
76%
2%*
1%*
3%*
3%*
3%*
8%*
5%*
25%*
14%*
18%*
33%*
17%
25%*
42%*
0% 20% 40% 60% 80% 100%
0 = not at all likely
1
2
3
4
5
6
Detractors (0-6)
7
8
Passives (7-8)
9
10 = extremely likely
Promoters (9-10)
Northstar Rider likelihood to recommend
2014
2012
Q: On a scale of 0-10, where “10” is “extremely likely” and “0” is “not at all likely”, how likely is it that you would recommend Metro Transit
to a friend or colleague?
N=479
t Denotes less than 1%
2014 Mean Score = 7.47
2012
Promoters 76%
- Detractors 5%
Net Promoter Score 71%
NORTHSTAR
Net Promoter Score (NPS) for Metro Transit is 17% among Northstar respondents, a significant decline from
the 2012 NPS of 71%.
2012 Mean Score = 9.06
2014
Promoters 42%
- Detractors 25%
Net Promoter Score 17%
* Statistically significant difference 2014 to 2012
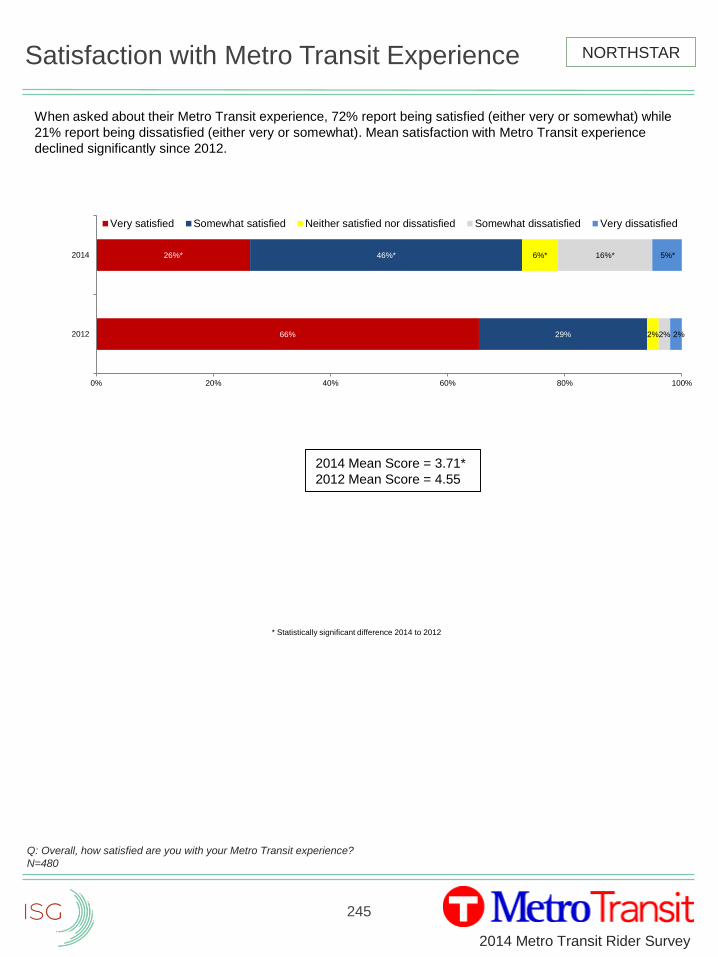
245
2014 Metro Transit Rider Survey
Satisfaction with Metro Transit Experience
When asked about their Metro Transit experience, 72% report being satisfied (either very or somewhat) while
21% report being dissatisfied (either very or somewhat). Mean satisfaction with Metro Transit experience
declined significantly since 2012.
Q: Overall, how satisfied are you with your Metro Transit experience?
N=480
66%
26%*
29%
46%*
2%
6%*
2%
16%*
2%
5%*
0% 20% 40% 60% 80% 100%
2012
2014
Very satisfied Somewhat satisfied Neither satisfied nor dissatisfied Somewhat dissatisfied Very dissatisfied
2014 Mean Score = 3.71*
2012 Mean Score = 4.55
NORTHSTAR
* Statistically significant difference 2014 to 2012
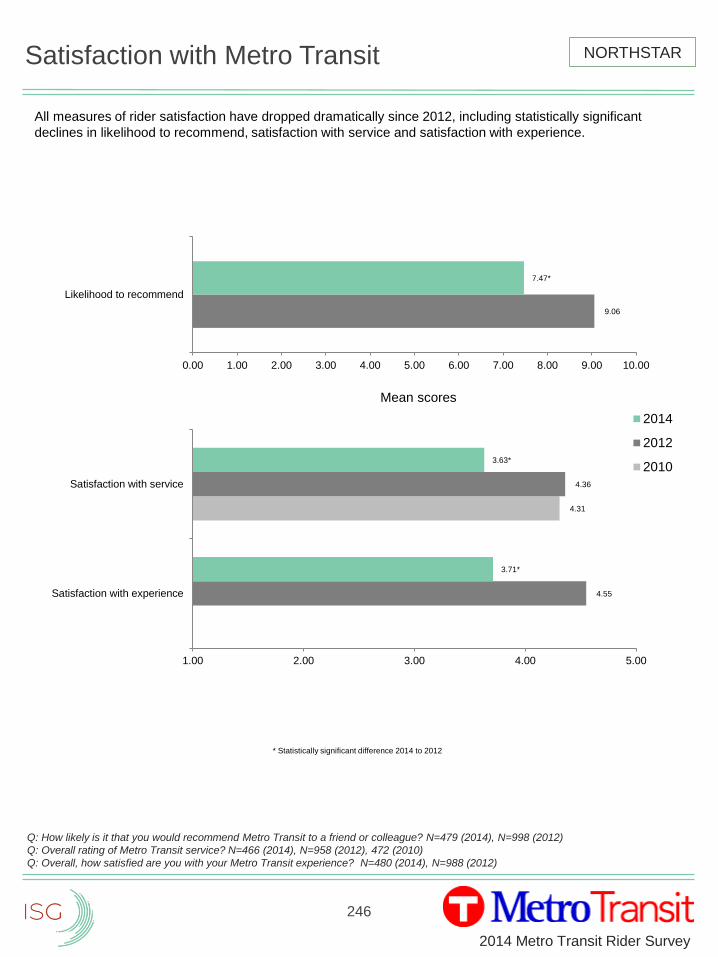
246
2014 Metro Transit Rider Survey
Satisfaction with Metro Transit
4.31
4.55
4.36
3.71*
3.63*
1.00 2.00 3.00 4.00 5.00
Satisfaction with experience
Satisfaction with service
2014
2012
2010
9.06
7.47*
0.00 1.00 2.00 3.00 4.00 5.00 6.00 7.00 8.00 9.00 10.00
Likelihood to recommend
Mean scores
All measures of rider satisfaction have dropped dramatically since 2012, including statistically significant
declines in likelihood to recommend, satisfaction with service and satisfaction with experience.
NORTHSTAR
Q: How likely is it that you would recommend Metro Transit to a friend or colleague? N=479 (2014), N=998 (2012)
Q: Overall rating of Metro Transit service? N=466 (2014), N=958 (2012), 472 (2010)
Q: Overall, how satisfied are you with your Metro Transit experience? N=480 (2014), N=988 (2012)
* Statistically significant difference 2014 to 2012
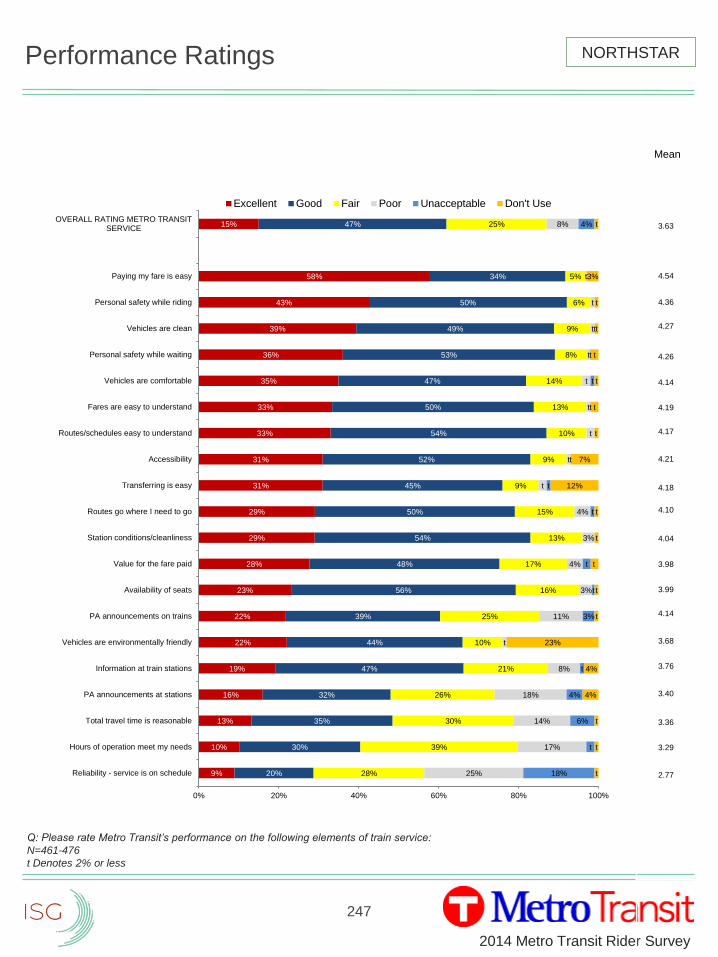
247
2014 Metro Transit Rider Survey
Performance Ratings
Q: Please rate Metro Transit’s performance on the following elements of train service:
N=461-476
t Denotes 2% or less
9%
10%
13%
16%
19%
22%
22%
23%
28%
29%
29%
31%
31%
33%
33%
35%
36%
39%
43%
58%
15%
20%
30%
35%
32%
47%
44%
39%
56%
48%
54%
50%
45%
52%
54%
50%
47%
53%
49%
50%
34%
47%
28%
39%
30%
26%
21%
10%
25%
16%
17%
13%
15%
9%
9%
10%
13%
14%
8%
9%
6%
5%
25%
25%
17%
14%
18%
8%
t
11%
3%
4%
3%
4%
t
t
t
t
t
t
t
t
t
8%
18%
t
6%
4%
t
3%
t
t
t
t
t
t
t
t
t
t
4%
t
t
t
4%
4%
23%
t
t
t
t
t
12%
7%
t
t
t
t
t
3%
t
0% 20% 40% 60% 80% 100%
Reliability - service is on schedule
Hours of operation meet my needs
Total travel time is reasonable
PA announcements at stations
Information at train stations
Vehicles are environmentally friendly
PA announcements on trains
Availability of seats
Value for the fare paid
Station conditions/cleanliness
Routes go where I need to go
Transferring is easy
Accessibility
Routes/schedules easy to understand
Fares are easy to understand
Vehicles are comfortable
Personal safety while waiting
Vehicles are clean
Personal safety while riding
Paying my fare is easy
OVERALL RATING METRO TRANSITSERVICE
Excellent Good Fair Poor Unacceptable Don't Use
NORTHSTAR
Mean
3.63
4.54
4.36
4.27
4.26
4.14
4.19
4.17
4.21
4.18
4.10
4.04
3.98
3.99
4.14
3.68
3.76
3.40
3.36
3.29
2.77
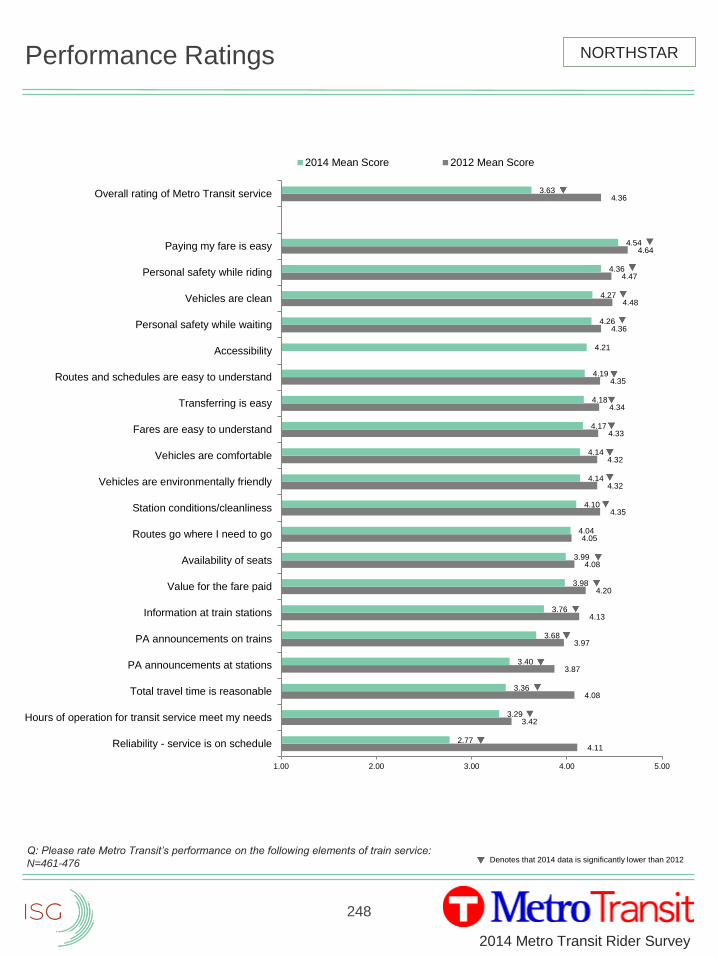
248
2014 Metro Transit Rider Survey
Performance Ratings
4.11
3.42
4.08
3.87
3.97
4.13
4.20
4.08
4.05
4.35
4.32
4.32
4.33
4.34
4.35
4.36
4.48
4.47
4.64
4.36
2.77
3.29
3.36
3.40
3.68
3.76
3.98
3.99
4.04
4.10
4.14
4.14
4.17
4.18
4.19
4.21
4.26
4.27
4.36
4.54
3.63
1.00 2.00 3.00 4.00 5.00
Reliability - service is on schedule
Hours of operation for transit service meet my needs
Total travel time is reasonable
PA announcements at stations
PA announcements on trains
Information at train stations
Value for the fare paid
Availability of seats
Routes go where I need to go
Station conditions/cleanliness
Vehicles are environmentally friendly
Vehicles are comfortable
Fares are easy to understand
Transferring is easy
Routes and schedules are easy to understand
Accessibility
Personal safety while waiting
Vehicles are clean
Personal safety while riding
Paying my fare is easy
Overall rating of Metro Transit service
2014 Mean Score 2012 Mean Score
Denotes that 2014 data is significantly lower than 2012
NORTHSTAR
Q: Please rate Metro Transit’s performance on the following elements of train service:
N=461-476
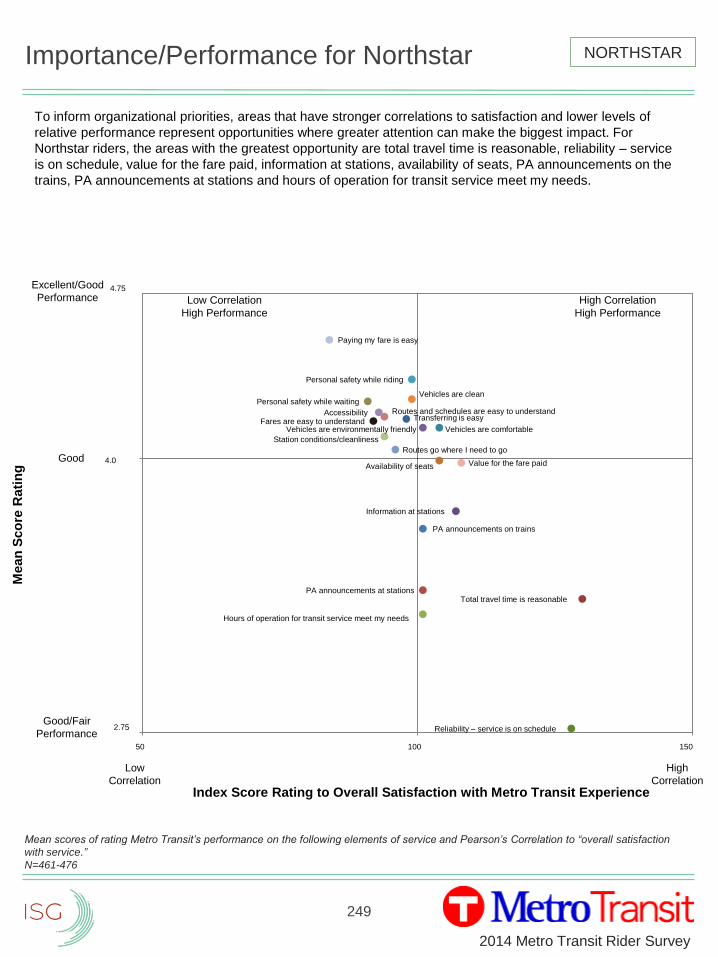
249
2014 Metro Transit Rider Survey
Importance/Performance for Northstar
Mean scores of rating Metro Transit’s performance on the following elements of service and Pearson’s Correlation to “overall satisfaction
with service.”
N=461-476
Total travel time is reasonable
Reliability – service is on schedule
Value for the fare paid
Information at stations
Vehicles are comfortable
Availability of seats
PA announcements on trains
PA announcements at stations
Vehicles are environmentally friendly
Personal safety while riding
Vehicles are clean
Transferring is easy
Routes go where I need to go
Station conditions/cleanliness
AccessibilityFares are easy to understand
Personal safety while waiting
Paying my fare is easy
Mean
Sco
re R
ati
ng
Index Score Rating to Overall Satisfaction with Metro Transit Experience
Excellent/Good
Performance
Good
Good/Fair
Performance
High
Correlation
Low
Correlation
4.75
2.75
4.0
Low Correlation
High Performance
High Correlation
High Performance
50 100 150
Hours of operation for transit service meet my needs
Routes and schedules are easy to understand
NORTHSTAR
To inform organizational priorities, areas that have stronger correlations to satisfaction and lower levels of
relative performance represent opportunities where greater attention can make the biggest impact. For
Northstar riders, the areas with the greatest opportunity are total travel time is reasonable, reliability – service
is on schedule, value for the fare paid, information at stations, availability of seats, PA announcements on the
trains, PA announcements at stations and hours of operation for transit service meet my needs.
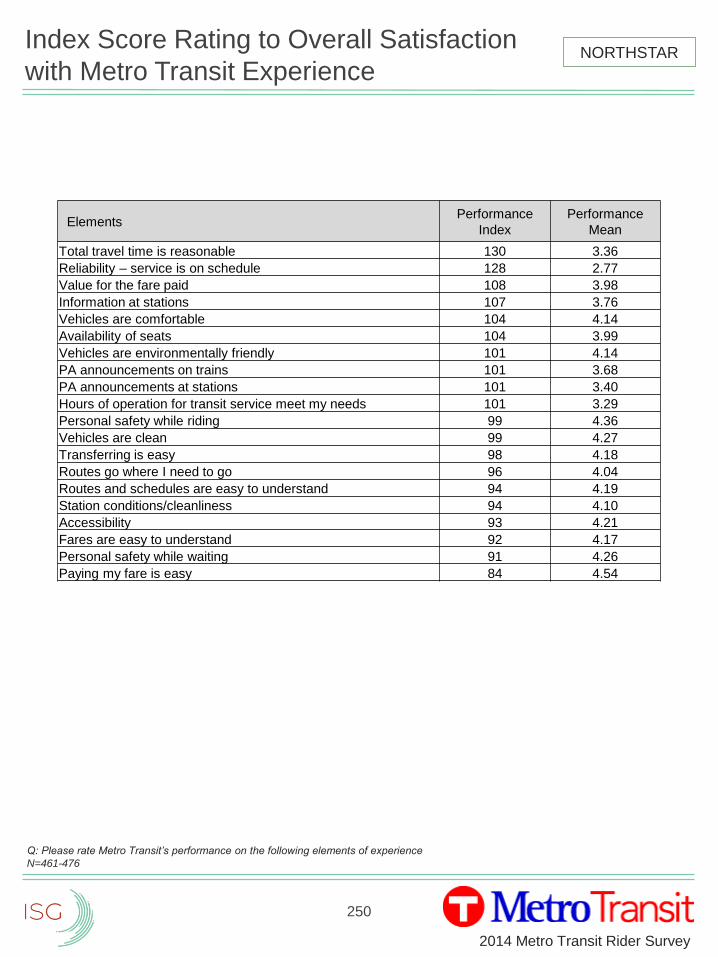
250
2014 Metro Transit Rider Survey
Index Score Rating to Overall Satisfaction
with Metro Transit Experience
Q: Please rate Metro Transit’s performance on the following elements of experience
N=461-476
ElementsPerformance
Index
Performance
Mean
Total travel time is reasonable 130 3.36
Reliability – service is on schedule 128 2.77
Value for the fare paid 108 3.98
Information at stations 107 3.76
Vehicles are comfortable 104 4.14
Availability of seats 104 3.99
Vehicles are environmentally friendly 101 4.14
PA announcements on trains 101 3.68
PA announcements at stations 101 3.40
Hours of operation for transit service meet my needs 101 3.29
Personal safety while riding 99 4.36
Vehicles are clean 99 4.27
Transferring is easy 98 4.18
Routes go where I need to go 96 4.04
Routes and schedules are easy to understand 94 4.19
Station conditions/cleanliness 94 4.10
Accessibility 93 4.21
Fares are easy to understand 92 4.17
Personal safety while waiting 91 4.26
Paying my fare is easy 84 4.54
NORTHSTAR
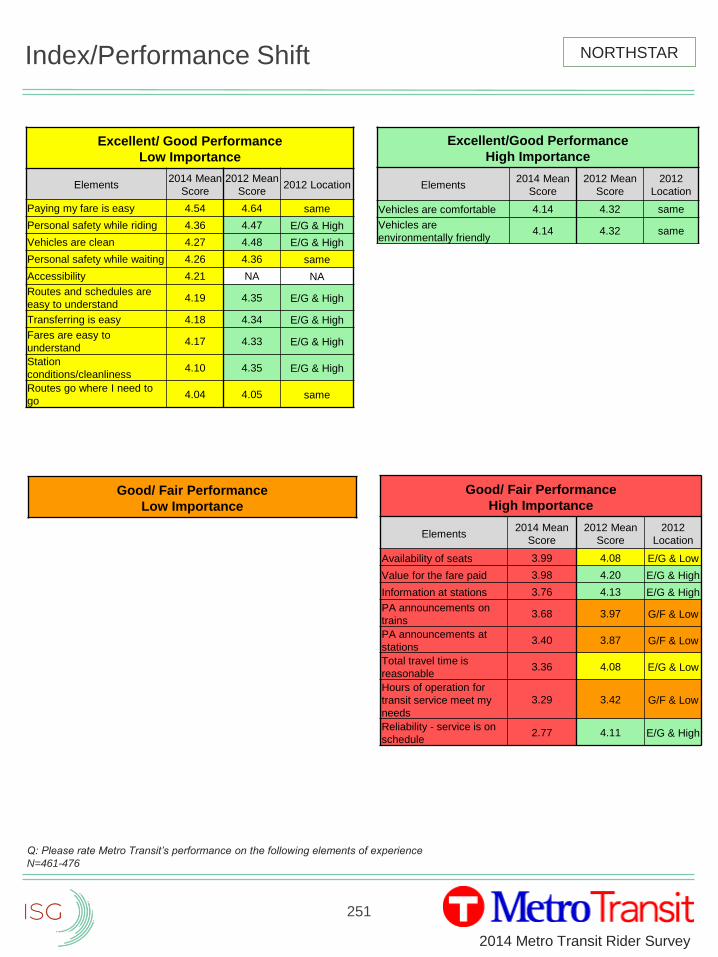
251
2014 Metro Transit Rider Survey
Index/Performance Shift
Q: Please rate Metro Transit’s performance on the following elements of experience
N=461-476
Excellent/ Good Performance
Low Importance
Elements2014 Mean
Score
2012 Mean
Score2012 Location
Paying my fare is easy 4.54 4.64 same
Personal safety while riding 4.36 4.47 E/G & High
Vehicles are clean 4.27 4.48 E/G & High
Personal safety while waiting 4.26 4.36 same
Accessibility 4.21 NA NA
Routes and schedules are
easy to understand4.19 4.35 E/G & High
Transferring is easy 4.18 4.34 E/G & High
Fares are easy to
understand4.17 4.33 E/G & High
Station
conditions/cleanliness4.10 4.35 E/G & High
Routes go where I need to
go4.04 4.05 same
NORTHSTAR
Good/ Fair Performance
High Importance
Elements2014 Mean
Score
2012 Mean
Score
2012
Location
Availability of seats 3.99 4.08 E/G & Low
Value for the fare paid 3.98 4.20 E/G & High
Information at stations 3.76 4.13 E/G & High
PA announcements on
trains3.68 3.97 G/F & Low
PA announcements at
stations3.40 3.87 G/F & Low
Total travel time is
reasonable3.36 4.08 E/G & Low
Hours of operation for
transit service meet my
needs
3.29 3.42 G/F & Low
Reliability - service is on
schedule2.77 4.11 E/G & High
Excellent/Good Performance
High Importance
Elements2014 Mean
Score
2012 Mean
Score
2012
Location
Vehicles are comfortable 4.14 4.32 same
Vehicles are
environmentally friendly4.14 4.32 same
Good/ Fair Performance
Low Importance
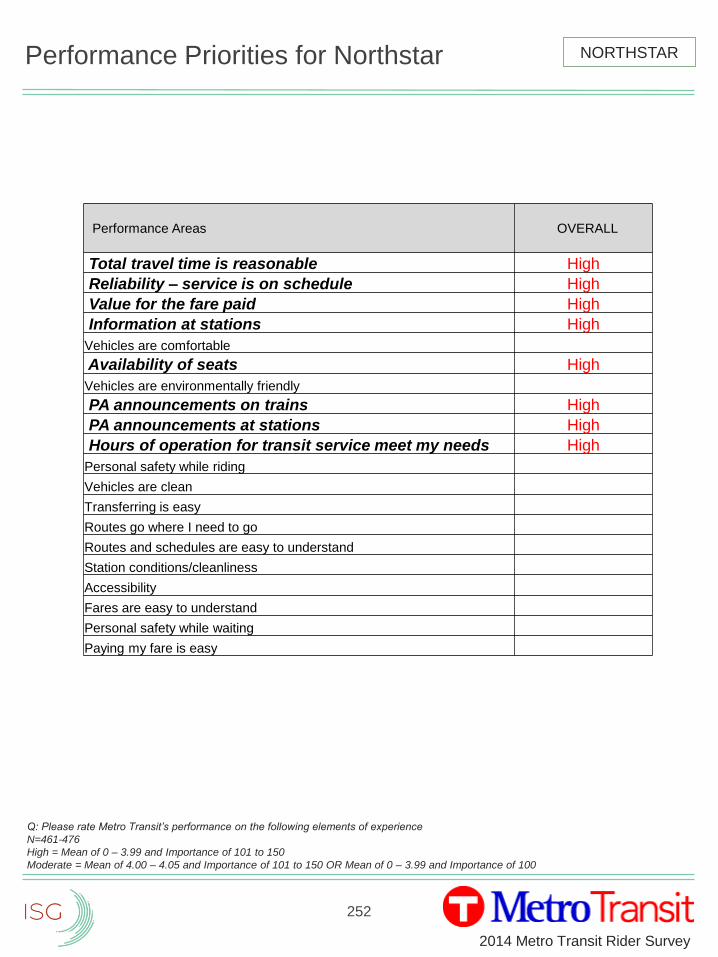
252
2014 Metro Transit Rider Survey
Performance Priorities for Northstar
Q: Please rate Metro Transit’s performance on the following elements of experience
N=461-476
High = Mean of 0 – 3.99 and Importance of 101 to 150
Moderate = Mean of 4.00 – 4.05 and Importance of 101 to 150 OR Mean of 0 – 3.99 and Importance of 100
Performance Areas OVERALL
Total travel time is reasonable High
Reliability – service is on schedule High
Value for the fare paid High
Information at stations High
Vehicles are comfortable
Availability of seats High
Vehicles are environmentally friendly
PA announcements on trains High
PA announcements at stations High
Hours of operation for transit service meet my needs High
Personal safety while riding
Vehicles are clean
Transferring is easy
Routes go where I need to go
Routes and schedules are easy to understand
Station conditions/cleanliness
Accessibility
Fares are easy to understand
Personal safety while waiting
Paying my fare is easy
NORTHSTAR
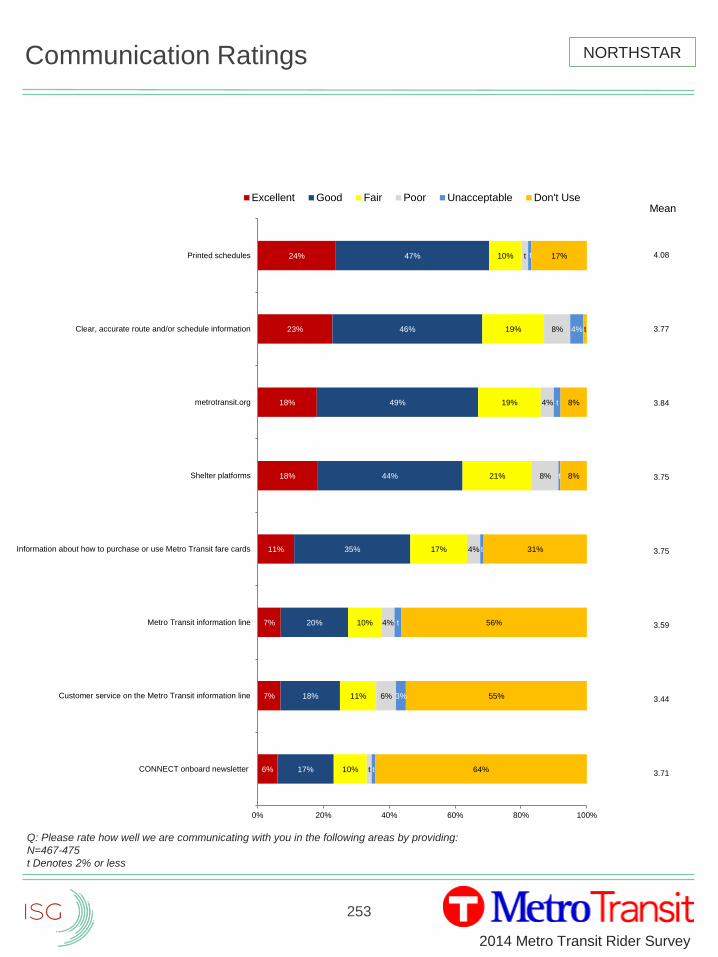
253
2014 Metro Transit Rider Survey
Communication Ratings
Q: Please rate how well we are communicating with you in the following areas by providing:
N=467-475
t Denotes 2% or less
6%
7%
7%
11%
18%
18%
23%
24%
17%
18%
20%
35%
44%
49%
46%
47%
10%
11%
10%
17%
21%
19%
19%
10%
t
6%
4%
4%
8%
4%
8%
t
t
3%
t
t
t
t
4%
t
64%
55%
56%
31%
8%
8%
t
17%
0% 20% 40% 60% 80% 100%
CONNECT onboard newsletter
Customer service on the Metro Transit information line
Metro Transit information line
Information about how to purchase or use Metro Transit fare cards
Shelter platforms
metrotransit.org
Clear, accurate route and/or schedule information
Printed schedules
Excellent Good Fair Poor Unacceptable Don't Use
NORTHSTAR
Mean
4.08
3.77
3.84
3.75
3.75
3.59
3.44
3.71
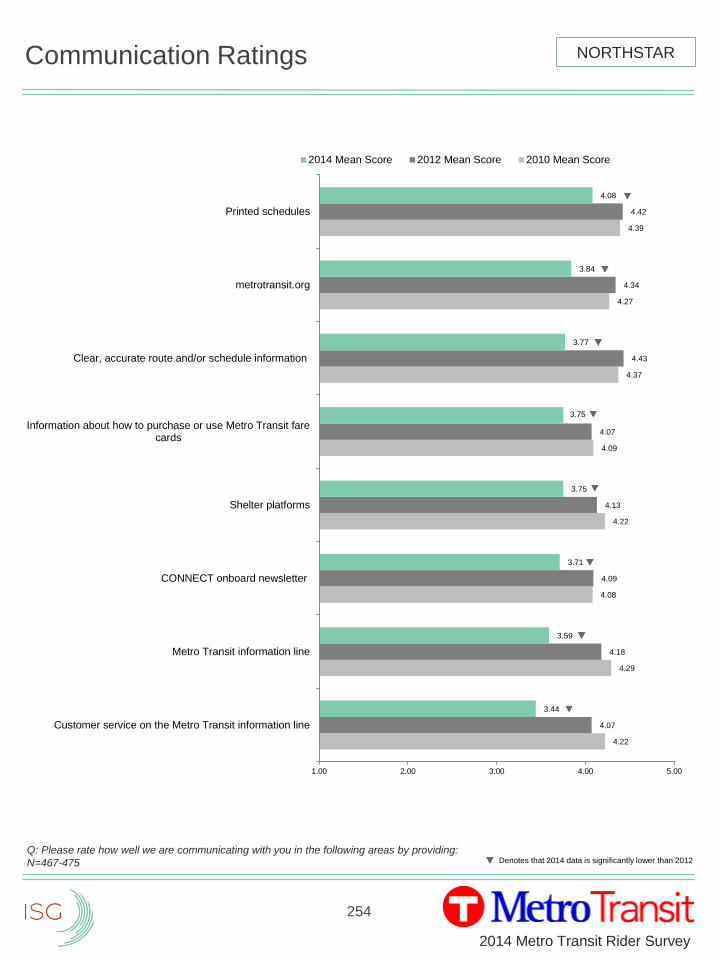
254
2014 Metro Transit Rider Survey
Communication Ratings
Q: Please rate how well we are communicating with you in the following areas by providing:
N=467-475
4.22
4.29
4.08
4.22
4.09
4.37
4.27
4.39
4.07
4.18
4.09
4.13
4.07
4.43
4.34
4.42
3.44
3.59
3.71
3.75
3.75
3.77
3.84
4.08
1.00 2.00 3.00 4.00 5.00
Customer service on the Metro Transit information line
Metro Transit information line
CONNECT onboard newsletter
Shelter platforms
Information about how to purchase or use Metro Transit farecards
Clear, accurate route and/or schedule information
metrotransit.org
Printed schedules
2014 Mean Score 2012 Mean Score 2010 Mean Score
Denotes that 2014 data is significantly lower than 2012
NORTHSTAR
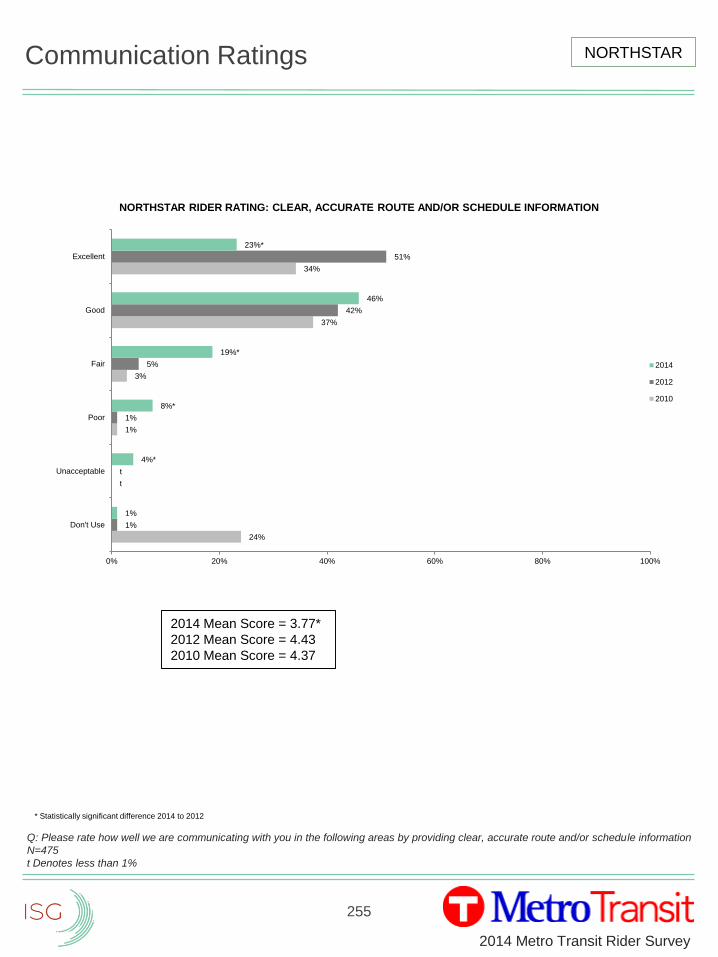
255
2014 Metro Transit Rider Survey
Communication Ratings
Q: Please rate how well we are communicating with you in the following areas by providing clear, accurate route and/or schedule information
N=475
t Denotes less than 1%
24%
t
1%
3%
37%
34%
1%
t
1%
5%
42%
51%
1%
4%*
8%*
19%*
46%
23%*
0% 20% 40% 60% 80% 100%
Don't Use
Unacceptable
Poor
Fair
Good
Excellent
NORTHSTAR RIDER RATING: CLEAR, ACCURATE ROUTE AND/OR SCHEDULE INFORMATION
2014
2012
2010
NORTHSTAR
* Statistically significant difference 2014 to 2012
2014 Mean Score = 3.77*
2012 Mean Score = 4.43
2010 Mean Score = 4.37

256
2014 Metro Transit Rider Survey
Communication Ratings
Q: Please rate how well we are communicating with you in the following areas by providing the Metro Transit information line (612-373-3333)
N=469
53%
1%
6%
20%
21%
52%
1%
2%
6%
20%
20%
56%
2%
4%*
10%*
20%
7%*
0% 20% 40% 60% 80% 100%
Don't Use
Unacceptable
Poor
Fair
Good
Excellent
NORTHSTAR RIDER RATING: METRO TRANSIT INFORMATION LINE
2014
2012
2010
NORTHSTAR
* Statistically significant difference 2014 to 2012
2014 Mean Score = 3.59*
2012 Mean Score = 4.18
2010 Mean Score = 4.29
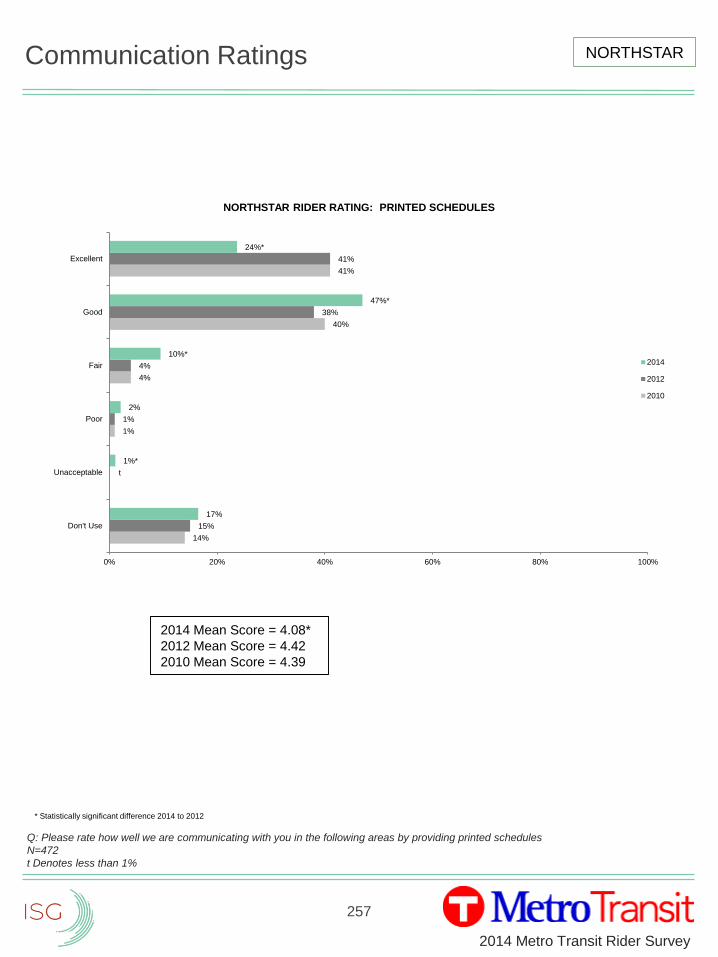
257
2014 Metro Transit Rider Survey
Communication Ratings
Q: Please rate how well we are communicating with you in the following areas by providing printed schedules
N=472
t Denotes less than 1%
14%
1%
4%
40%
41%
15%
t
1%
4%
38%
41%
17%
1%*
2%
10%*
47%*
24%*
0% 20% 40% 60% 80% 100%
Don't Use
Unacceptable
Poor
Fair
Good
Excellent
NORTHSTAR RIDER RATING: PRINTED SCHEDULES
2014
2012
2010
NORTHSTAR
* Statistically significant difference 2014 to 2012
2014 Mean Score = 4.08*
2012 Mean Score = 4.42
2010 Mean Score = 4.39
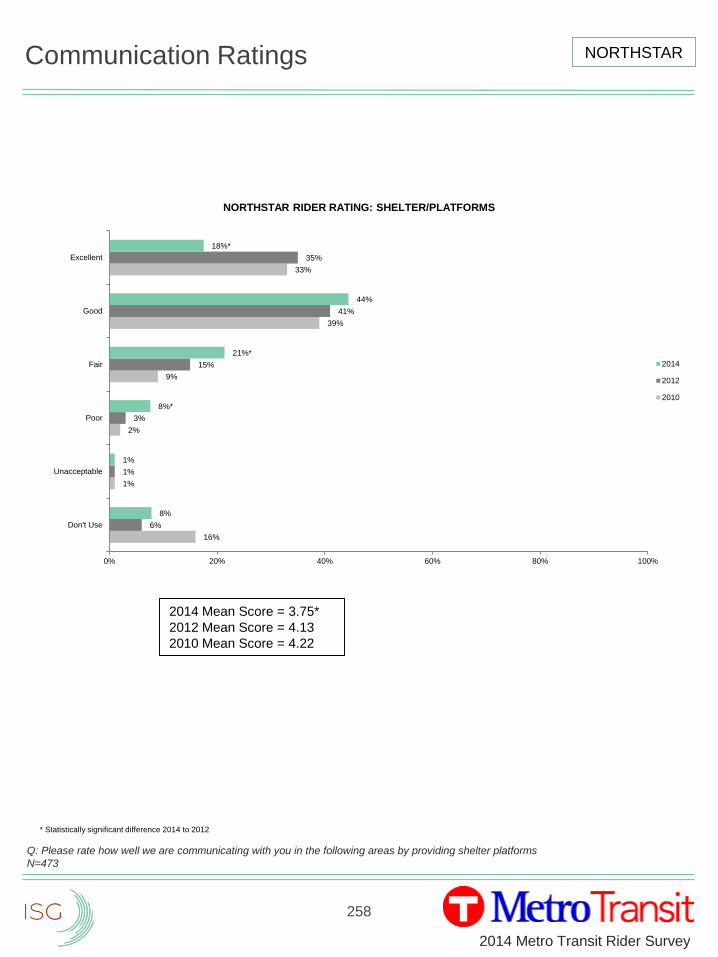
258
2014 Metro Transit Rider Survey
Communication Ratings
Q: Please rate how well we are communicating with you in the following areas by providing shelter platforms
N=473
16%
1%
2%
9%
39%
33%
6%
1%
3%
15%
41%
35%
8%
1%
8%*
21%*
44%
18%*
0% 20% 40% 60% 80% 100%
Don't Use
Unacceptable
Poor
Fair
Good
Excellent
NORTHSTAR RIDER RATING: SHELTER/PLATFORMS
2014
2012
2010
NORTHSTAR
* Statistically significant difference 2014 to 2012
2014 Mean Score = 3.75*
2012 Mean Score = 4.13
2010 Mean Score = 4.22
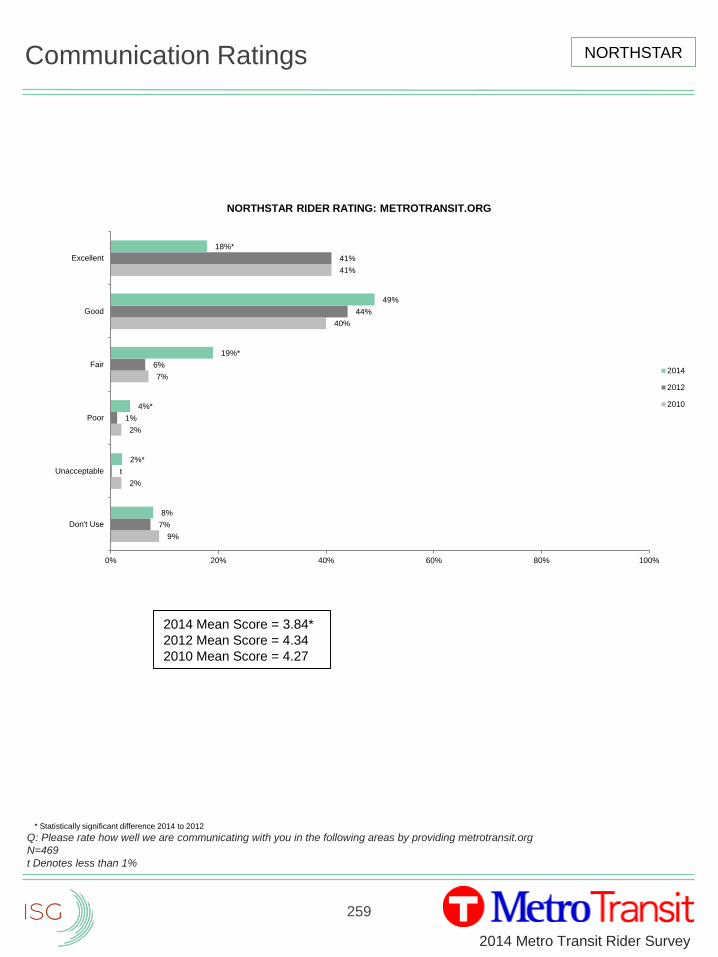
259
2014 Metro Transit Rider Survey
Communication Ratings
Q: Please rate how well we are communicating with you in the following areas by providing metrotransit.org
N=469
t Denotes less than 1%
9%
2%
2%
7%
40%
41%
7%
t
1%
6%
44%
41%
8%
2%*
4%*
19%*
49%
18%*
0% 20% 40% 60% 80% 100%
Don't Use
Unacceptable
Poor
Fair
Good
Excellent
NORTHSTAR RIDER RATING: METROTRANSIT.ORG
2014
2012
2010
NORTHSTAR
* Statistically significant difference 2014 to 2012
2014 Mean Score = 3.84*
2012 Mean Score = 4.34
2010 Mean Score = 4.27

260
2014 Metro Transit Rider Survey
Communication Ratings
Q: Please rate how well we are communicating with you in the following areas by providing customer service on the Metro Transit
information line (612-373-3333)
N=470
53%
2%
6%
18%
21%
55%
1%
3%
6%
17%
18%
55%
3%*
6%*
11%*
18%
7%*
0% 20% 40% 60% 80% 100%
Don't Use
Unacceptable
Poor
Fair
Good
Excellent
NORTHSTAR RIDER RATING: CUSTOMER SERVICE ON THE METRO TRANSIT INFORMATION LINE
2014
2012
2010
NORTHSTAR
* Statistically significant difference 2014 to 2012
2014 Mean Score = 3.44*
2012 Mean Score = 4.07
2010 Mean Score = 4.22
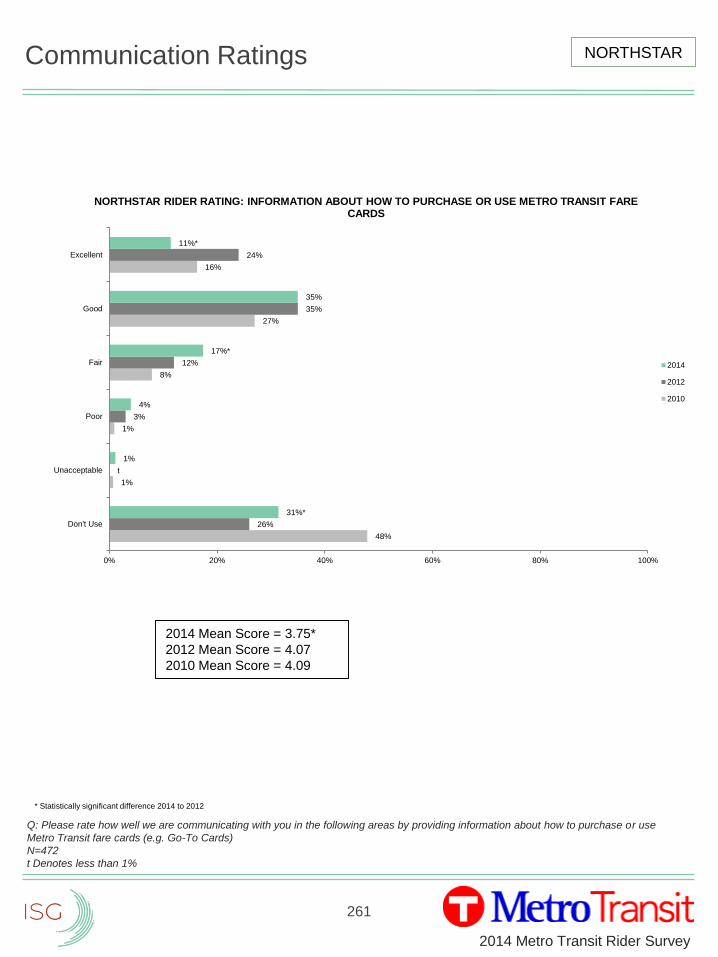
261
2014 Metro Transit Rider Survey
Communication Ratings
Q: Please rate how well we are communicating with you in the following areas by providing information about how to purchase or use
Metro Transit fare cards (e.g. Go-To Cards)
N=472
t Denotes less than 1%
48%
1%
1%
8%
27%
16%
26%
t
3%
12%
35%
24%
31%*
1%
4%
17%*
35%
11%*
0% 20% 40% 60% 80% 100%
Don't Use
Unacceptable
Poor
Fair
Good
Excellent
NORTHSTAR RIDER RATING: INFORMATION ABOUT HOW TO PURCHASE OR USE METRO TRANSIT FARE CARDS
2014
2012
2010
NORTHSTAR
* Statistically significant difference 2014 to 2012
2014 Mean Score = 3.75*
2012 Mean Score = 4.07
2010 Mean Score = 4.09
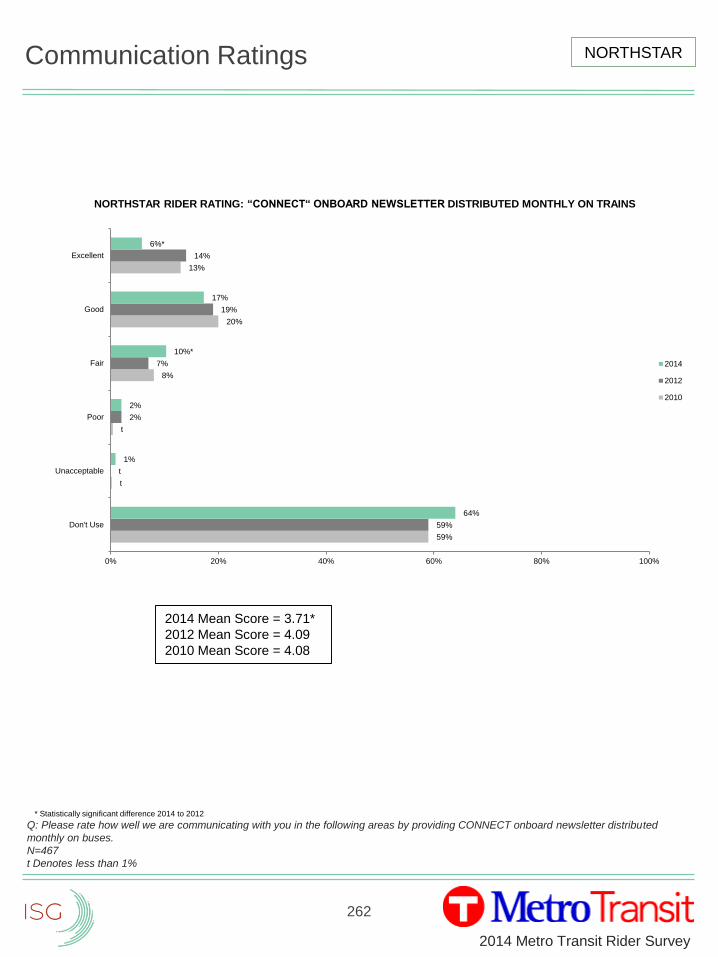
262
2014 Metro Transit Rider Survey
Communication Ratings
Q: Please rate how well we are communicating with you in the following areas by providing CONNECT onboard newsletter distributed
monthly on buses.
N=467
t Denotes less than 1%
59%
t
t
8%
20%
13%
59%
t
2%
7%
19%
14%
64%
1%
2%
10%*
17%
6%*
0% 20% 40% 60% 80% 100%
Don't Use
Unacceptable
Poor
Fair
Good
Excellent
NORTHSTAR RIDER RATING: “CONNECT“ ONBOARD NEWSLETTER DISTRIBUTED MONTHLY ON TRAINS
2014
2012
2010
NORTHSTAR
* Statistically significant difference 2014 to 2012
2014 Mean Score = 3.71*
2012 Mean Score = 4.09
2010 Mean Score = 4.08

2014 Metro Transit Rider Survey
263
Survey Instruments
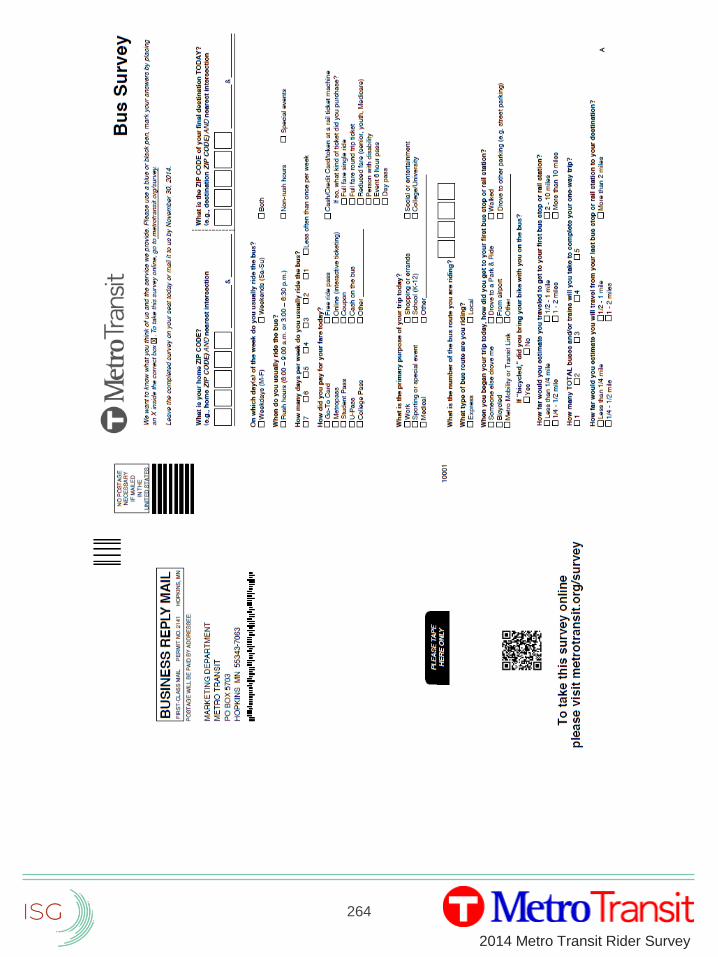
2014 Metro Transit Rider Survey
264
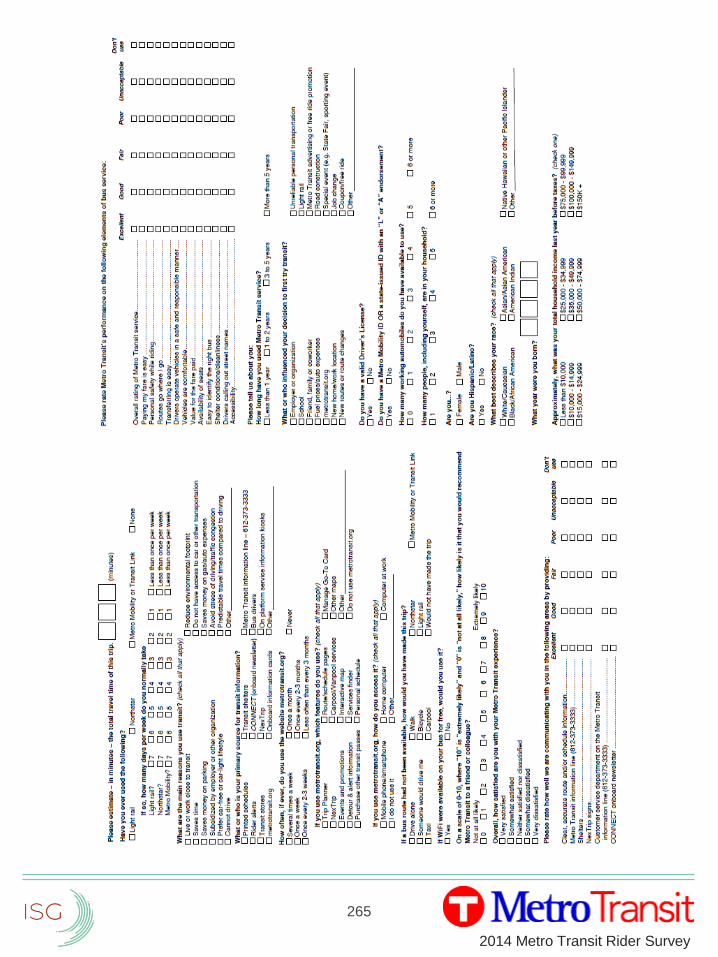
2014 Metro Transit Rider Survey
265
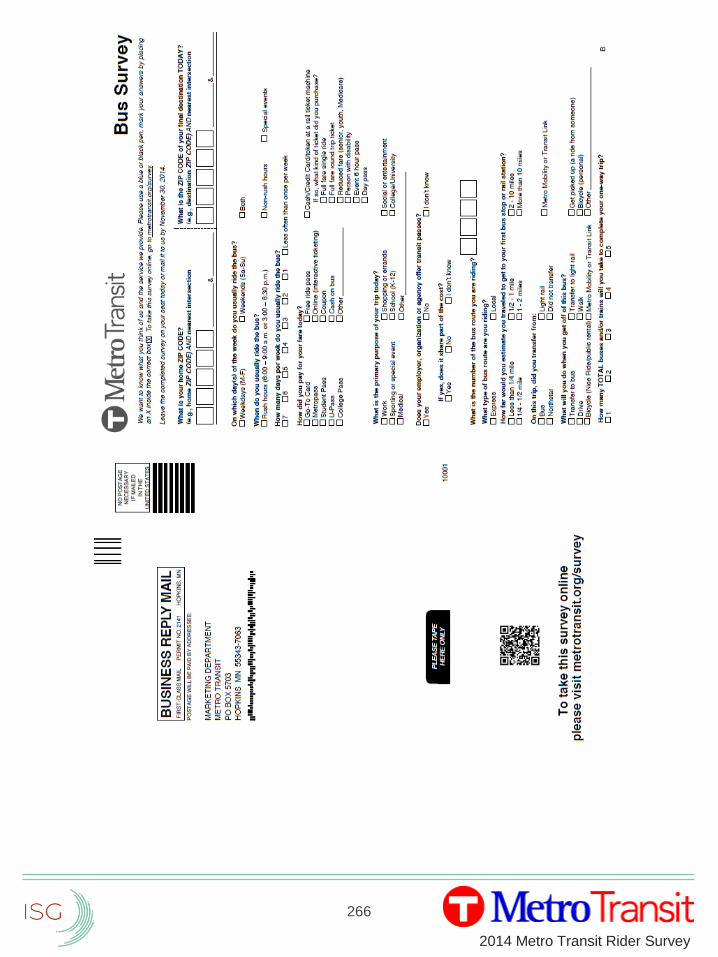
2014 Metro Transit Rider Survey
266
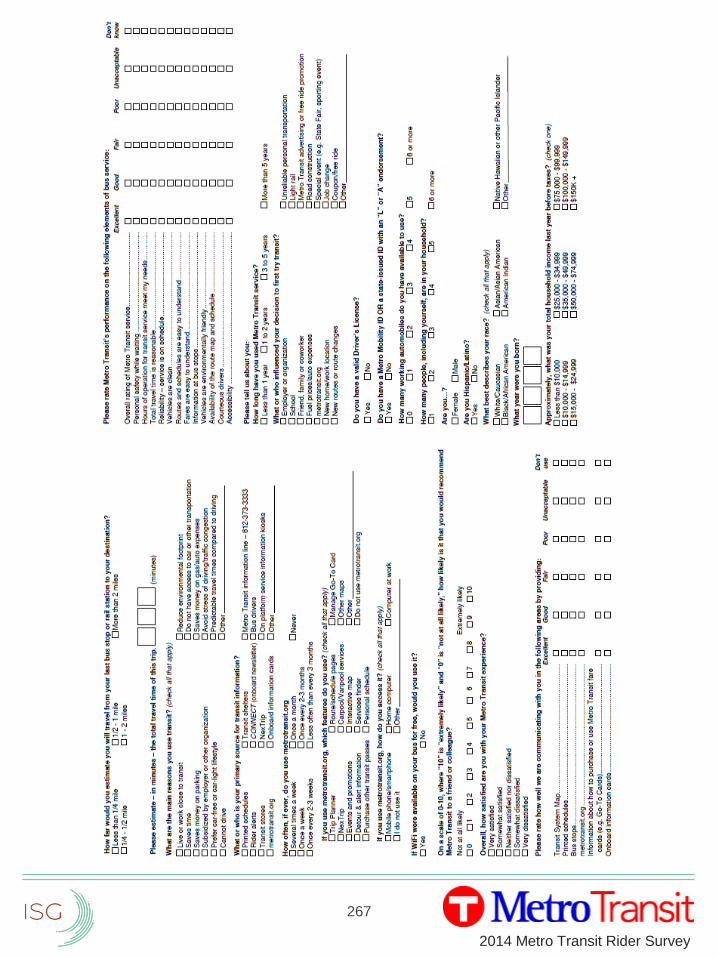
2014 Metro Transit Rider Survey
267
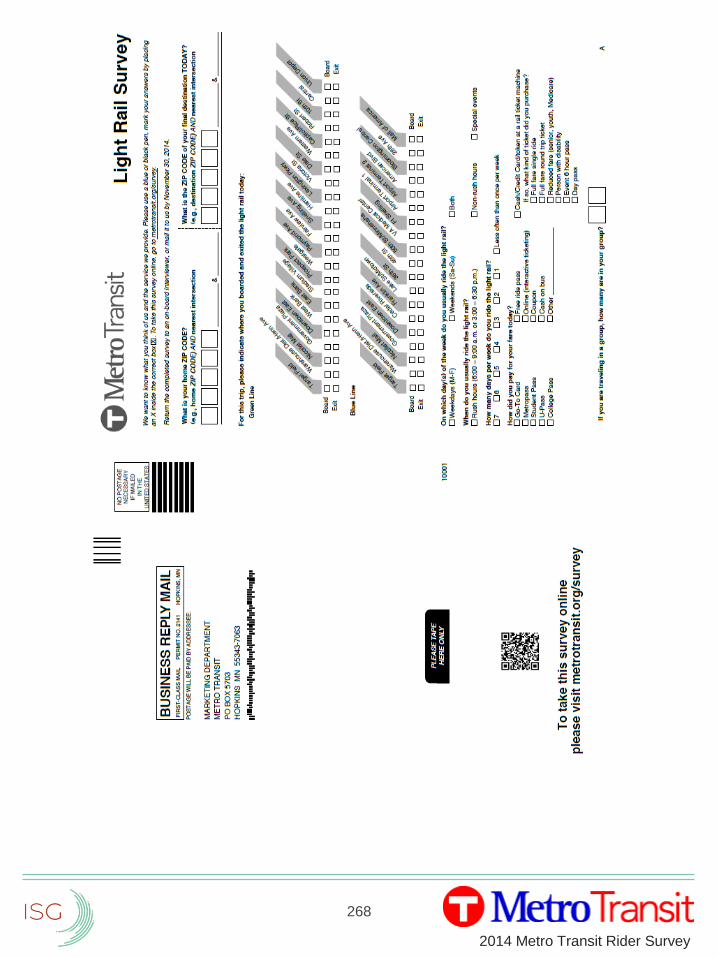
2014 Metro Transit Rider Survey
268
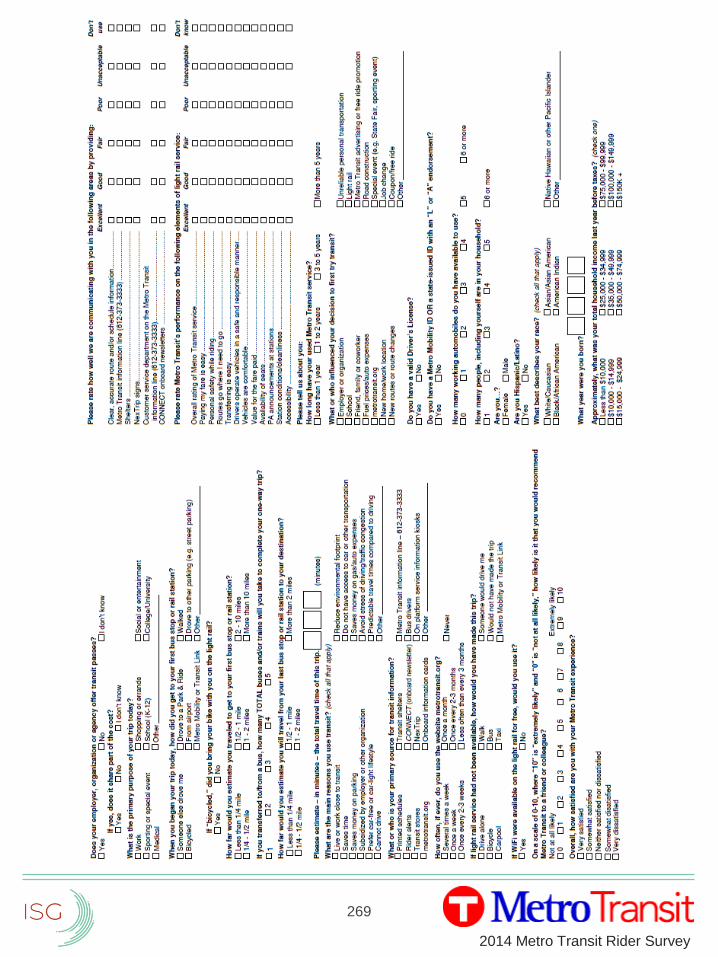
2014 Metro Transit Rider Survey
269
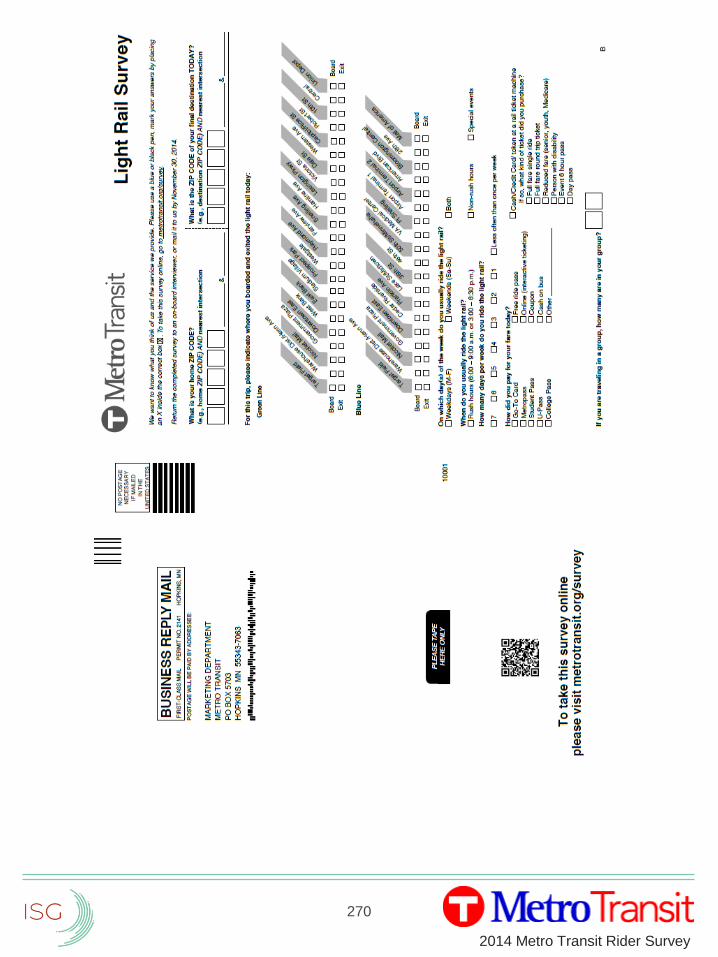
2014 Metro Transit Rider Survey
270
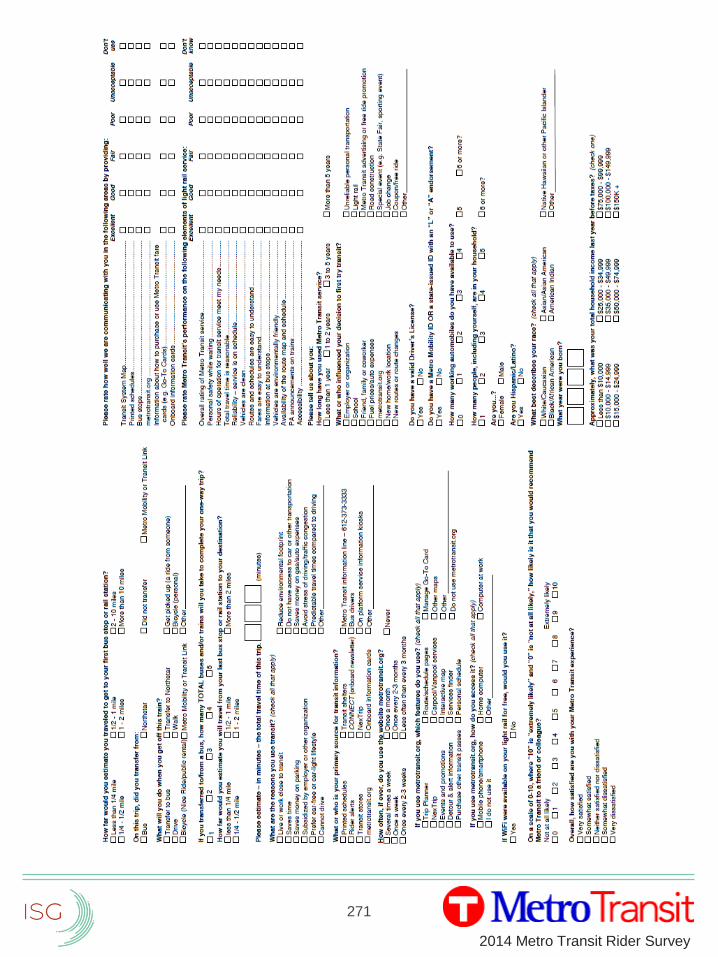
2014 Metro Transit Rider Survey
271
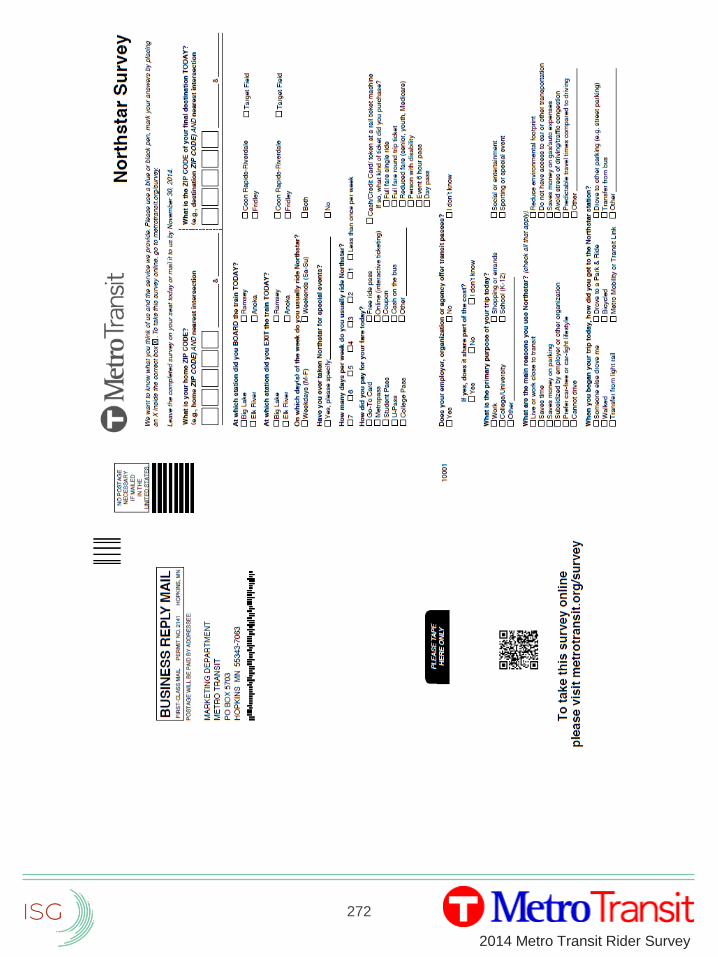
2014 Metro Transit Rider Survey
272
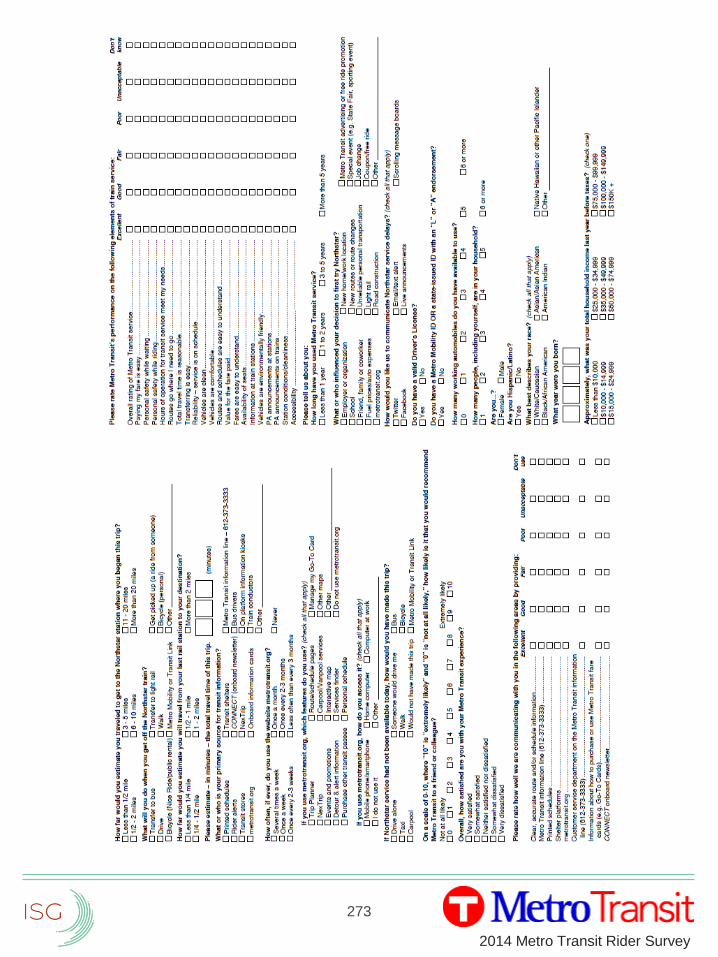
2014 Metro Transit Rider Survey
273